
Abstract
Extracorporeal membrane oxygenation (ECMO) is a method of life support provided in a limited number of (typically centralised) intensive care units (ICUs) which may lead to inequity in the delivery of ECMO. We conducted a retrospective cohort study of all ICU admissions in Australia and New Zealand reported to the Australian and New Zealand Intensive Care Society Adult Patient Database between 2018 and 2022. We performed descriptive and propensity-matched analyses to determine how healthcare jurisdiction, remoteness, and initial admitting hospital type (based on ECMO capability) affected the chance of receiving ECMO. There were 703,529 patients at 199 hospitals who met inclusion criteria, of whom 1654 (0.2%) received ECMO. After propensity matching, patients had a reduced odds of receiving ECMO if admitted in the Australian Capital Territory (odds ratio (OR) 0.54, 95% confidence interval (CI) 0.34 to 0.86), New Zealand (OR 0.42, 95% CI 0.26 to 0.67), Northern Territory (OR 0.29, 95% CI 0.1 to 0.86), Queensland (OR 0.53, 95% CI 0.45 to 0.63) or Western Australia (OR 0.46, 95% CI 0.35 to 0.62) compared with New South Wales. Patients from Outer Regional areas were less likely to receive ECMO than those residing in a Major City (OR 0.77, 95% CI 0.63 to 0.94). Initial admission in a non-ECMO centre was associated with reduced odds of receiving ECMO (OR 0.60, 95% CI 0.52 to 0.69), whilst initial admission in a Major ECMO centre was associated with increased odds of receiving ECMO (OR 2.03, 95% CI 1.78 to 2.31), compared with Minor ECMO centres. Our study suggests there is inequity in the delivery of ECMO in Australia and New Zealand, which should inform policy and planning for ECMO provision throughout the region.
Keywords
Introduction
Extracorporeal membrane oxygenation (ECMO) is a costly, labour intensive and invasive form of artificial life support used in critically ill patients with severe cardiac and respiratory failure and is confined to the intensive care unit (ICU). The use of ECMO has markedly increased in the past decade 1 following suggestion of potential mortality benefit among patients with severe respiratory failure and cardiogenic shock.2–4
The equipment and training required for ECMO are closely related to that of cardiopulmonary bypass, and consequently provision of ECMO is usually restricted to hospitals with cardiothoracic surgical capability in major population centres,5–7 which may create a barrier to access for patients in areas of low population density.8,9 Geographic barriers are particularly pertinent in Australia and New Zealand, where ECMO use has doubled in the past five years but is delivered in only a small number of centres. 10
We sought to investigate the relationship between a patient’s location and the probability of receiving ECMO. We hypothesised that the probability of a patient receiving ECMO would be affected by geographical remoteness, the location of their initial ICU admission, and the ECMO capability of the hospital, independent of their severity of illness.
Methods
Data sources and participants
Data were sourced from the Australia and New Zealand Intensive Care Society (ANZICS) Adult Patient Database (APD), a clinical quality registry dataset used for benchmarking ICU outcomes, to which 94% of ICUs in Australia and 62% of ICUs in New Zealand contribute. 11 The ANZICS APD includes demographic information, postcode, reason for ICU admission, physiological, biochemical and illness severity data from the first 24 h of ICU admission, whether the patient received any form of ECMO and outcomes including mortality at hospital discharge. A statistical linkage key allows a patient admitted to one hospital to be identified as the same patient when later admitted to an ICU in another hospital. Participating centres are listed in the Supplementary material Appendix online.
Adult patients (≥18 years) admitted to participating ICUs between 1 January 2018 and 3 March 2022 were eligible for inclusion. The start date for patient inclusion was chosen as data about the use of ECMO were not collected by the APD before this time. Patients were excluded: (1) if it was not possible to link ECMO data with the site of first ICU admission; (2) if there was missing mortality or illness severity scoring data; or (3) if admitted to ICU for organ donation or palliative care.
Definitions
The initial ICU admission was defined as the first ICU admission during an episode of care. An episode of care was defined as all hospital admissions not interrupted by a period of more than seven days out of hospital, provided those hospital admissions included an ICU stay. Patients were classified as receiving ECMO during that episode of care if ECMO was initiated either at the initial admitting ICU or at another ICU that the patient was transferred to during the same episode of care.
We examined the effect of location using three characteristics: (1) the admitting site’s ECMO capability; (2) the jurisdiction where the patient was initially admitted; and (3), for Australian patients, the geographic remoteness of the patient’s primary residence by postcode.
Hospitals were categorised into Major ECMO, Minor ECMO, or non-ECMO centres. Major ECMO centres were defined as hospitals with established ECMO programmes providing referral or retrieval services. Minor ECMO centres were defined as hospitals with a cardiothoracic surgery programme, or an established ECMO programme without a retrieval service. All other hospitals were classified as non-ECMO centres.
Jurisdiction was defined as either New Zealand or the state or territory of Australia in which the initial admitting ICU was located.
Remoteness was classified using the Accessibility and Remoteness Index of Australia, which divides Australia into five Remoteness Areas based on the road distance from a location to a given level of government service. 12 Remoteness was based upon the postcode of the patient’s primary residential address. A sixth category was added to identify patients admitted in New Zealand. Thresholds for Remoteness Areas are detailed in the Supplementary Appendix.
Outcome
The primary outcome was the odds of receiving ECMO during an episode of care.
Statistical methods
Demographics, outcomes and location characteristics of the initial ICU admission from all patients who received ECMO in an episode of care were first compared with those who did not receive ECMO (unmatched analysis). Second, location characteristics of the initial ICU admission from all patients who received ECMO in an episode of care were compared with propensity-matched patients who did not receive ECMO (matched analysis).
Missing data were filled from other admissions for that patient, by calculation, or (for the matched analysis only) by multiple imputation. 13 Variables used for multiple imputation were selected owing to their known association with both ECMO indication and outcome.14,15 Variables included basic demographic information, admission characteristics (e.g. elective, postoperative) and diagnosis, chronic comorbidities, and acute physiological variables including those used in the ENCOURAGE 14 and SAVE 15 scores. The complete list of variables used for imputation is provided in Supplementary Table S1. The number of imputations was determined using a quadratic rule, 16 and the adequacy of imputations was assessed graphically. Imputation details are provided in the Supplementary Appendix.
For the matched analysis, propensity matching within diagnostic categories was used to identify the largest potential group of non-ECMO patients who had similar characteristics to the ECMO group. 17 Details of the matching process and listed diagnostic categories are provided in the Supplementary Appendix; variables used for propensity matching are listed in Supplementary Table S2. Absolute values (e.g. group size and percentage) cannot be reported for the pooled data owing to small variations in group size between imputations. To adjust for the nature of cases performed in ECMO centres, we also performed a post hoc sensitivity analysis in patients not initially admitted to ICU for cardiac surgery, vascular surgery or thoracic organ transplant.
We assessed the relationship between the remoteness and receipt of ECMO in Australian patients using univariable regression in the matched cohort, which consisted of the patients who received ECMO and their propensity matched controls. We used a modified fragility index to estimate the discrepancy between the number of patients who received ECMO in each Remoteness Area versus the reference category (Major Cities). The modified fragility index was calculated by randomly allocating a non-ECMO patient into the ECMO group, and repeating this process until the difference between a given category and the reference category was not statistically significant, defined as P > 0.05. The modified fragility index is the number of patients reallocated by this process. The modified fragility index was then divided by the study period’s duration in years to estimate the annual ECMO case disparity for each Remoteness Area.
To determine the odds of receiving ECMO based upon location we performed pooled multivariable logistic regression in the matched cohort. Receipt of ECMO was the response variable and the three location characteristics were the exposures of interest. The reference categories for exposure variables were set as Minor ECMO Centre (for ECMO centre type), New South Wales (for jurisdiction) and Major Cities (for Remoteness Area). Multicollinearity between explanatory variables was assessed using the Durbin–Watson test and variance inflation factors on each regression model, prior to pooling. 18
All analysis was performed in R (4.2.1, R Core Team). Continuous variables were compared with a t-test, F-test, or Kruskal–Wallis as appropriate. Categorical variables were compared using the chi-square test for equal proportions. Continuous data are summarised as mean (standard deviation (SD)) or median (interquartile range (IQR)) and categorical data are presented as proportions (%). A P-value of ≤0.05 was considered statistically significant. The code used in the analysis is available at https://www.github.com/cjdbarlow/papers.
The project was approved as a low-risk study, with waiver of individual patient informed consent, by the Human Research Ethics Committee of Auckland District Health Board (Approval number: A+ 9476).
Results
There were 743,366 intensive care admissions to 200 ICUs (199 hospitals) recorded in the ANZICS APD over the study period. Of these ICUs, eight were defined as Major ECMO centres, 33 were defined as Minor ECMO centres, and 159 were defined as non-ECMO centres. There were 703,529 patients who met inclusion criteria, 1654 (0.2%) of whom received ECMO during the episode of care (Figure 1). The number of ECMO cases recorded by ECMO centre type is detailed in Supplementary Table S3.
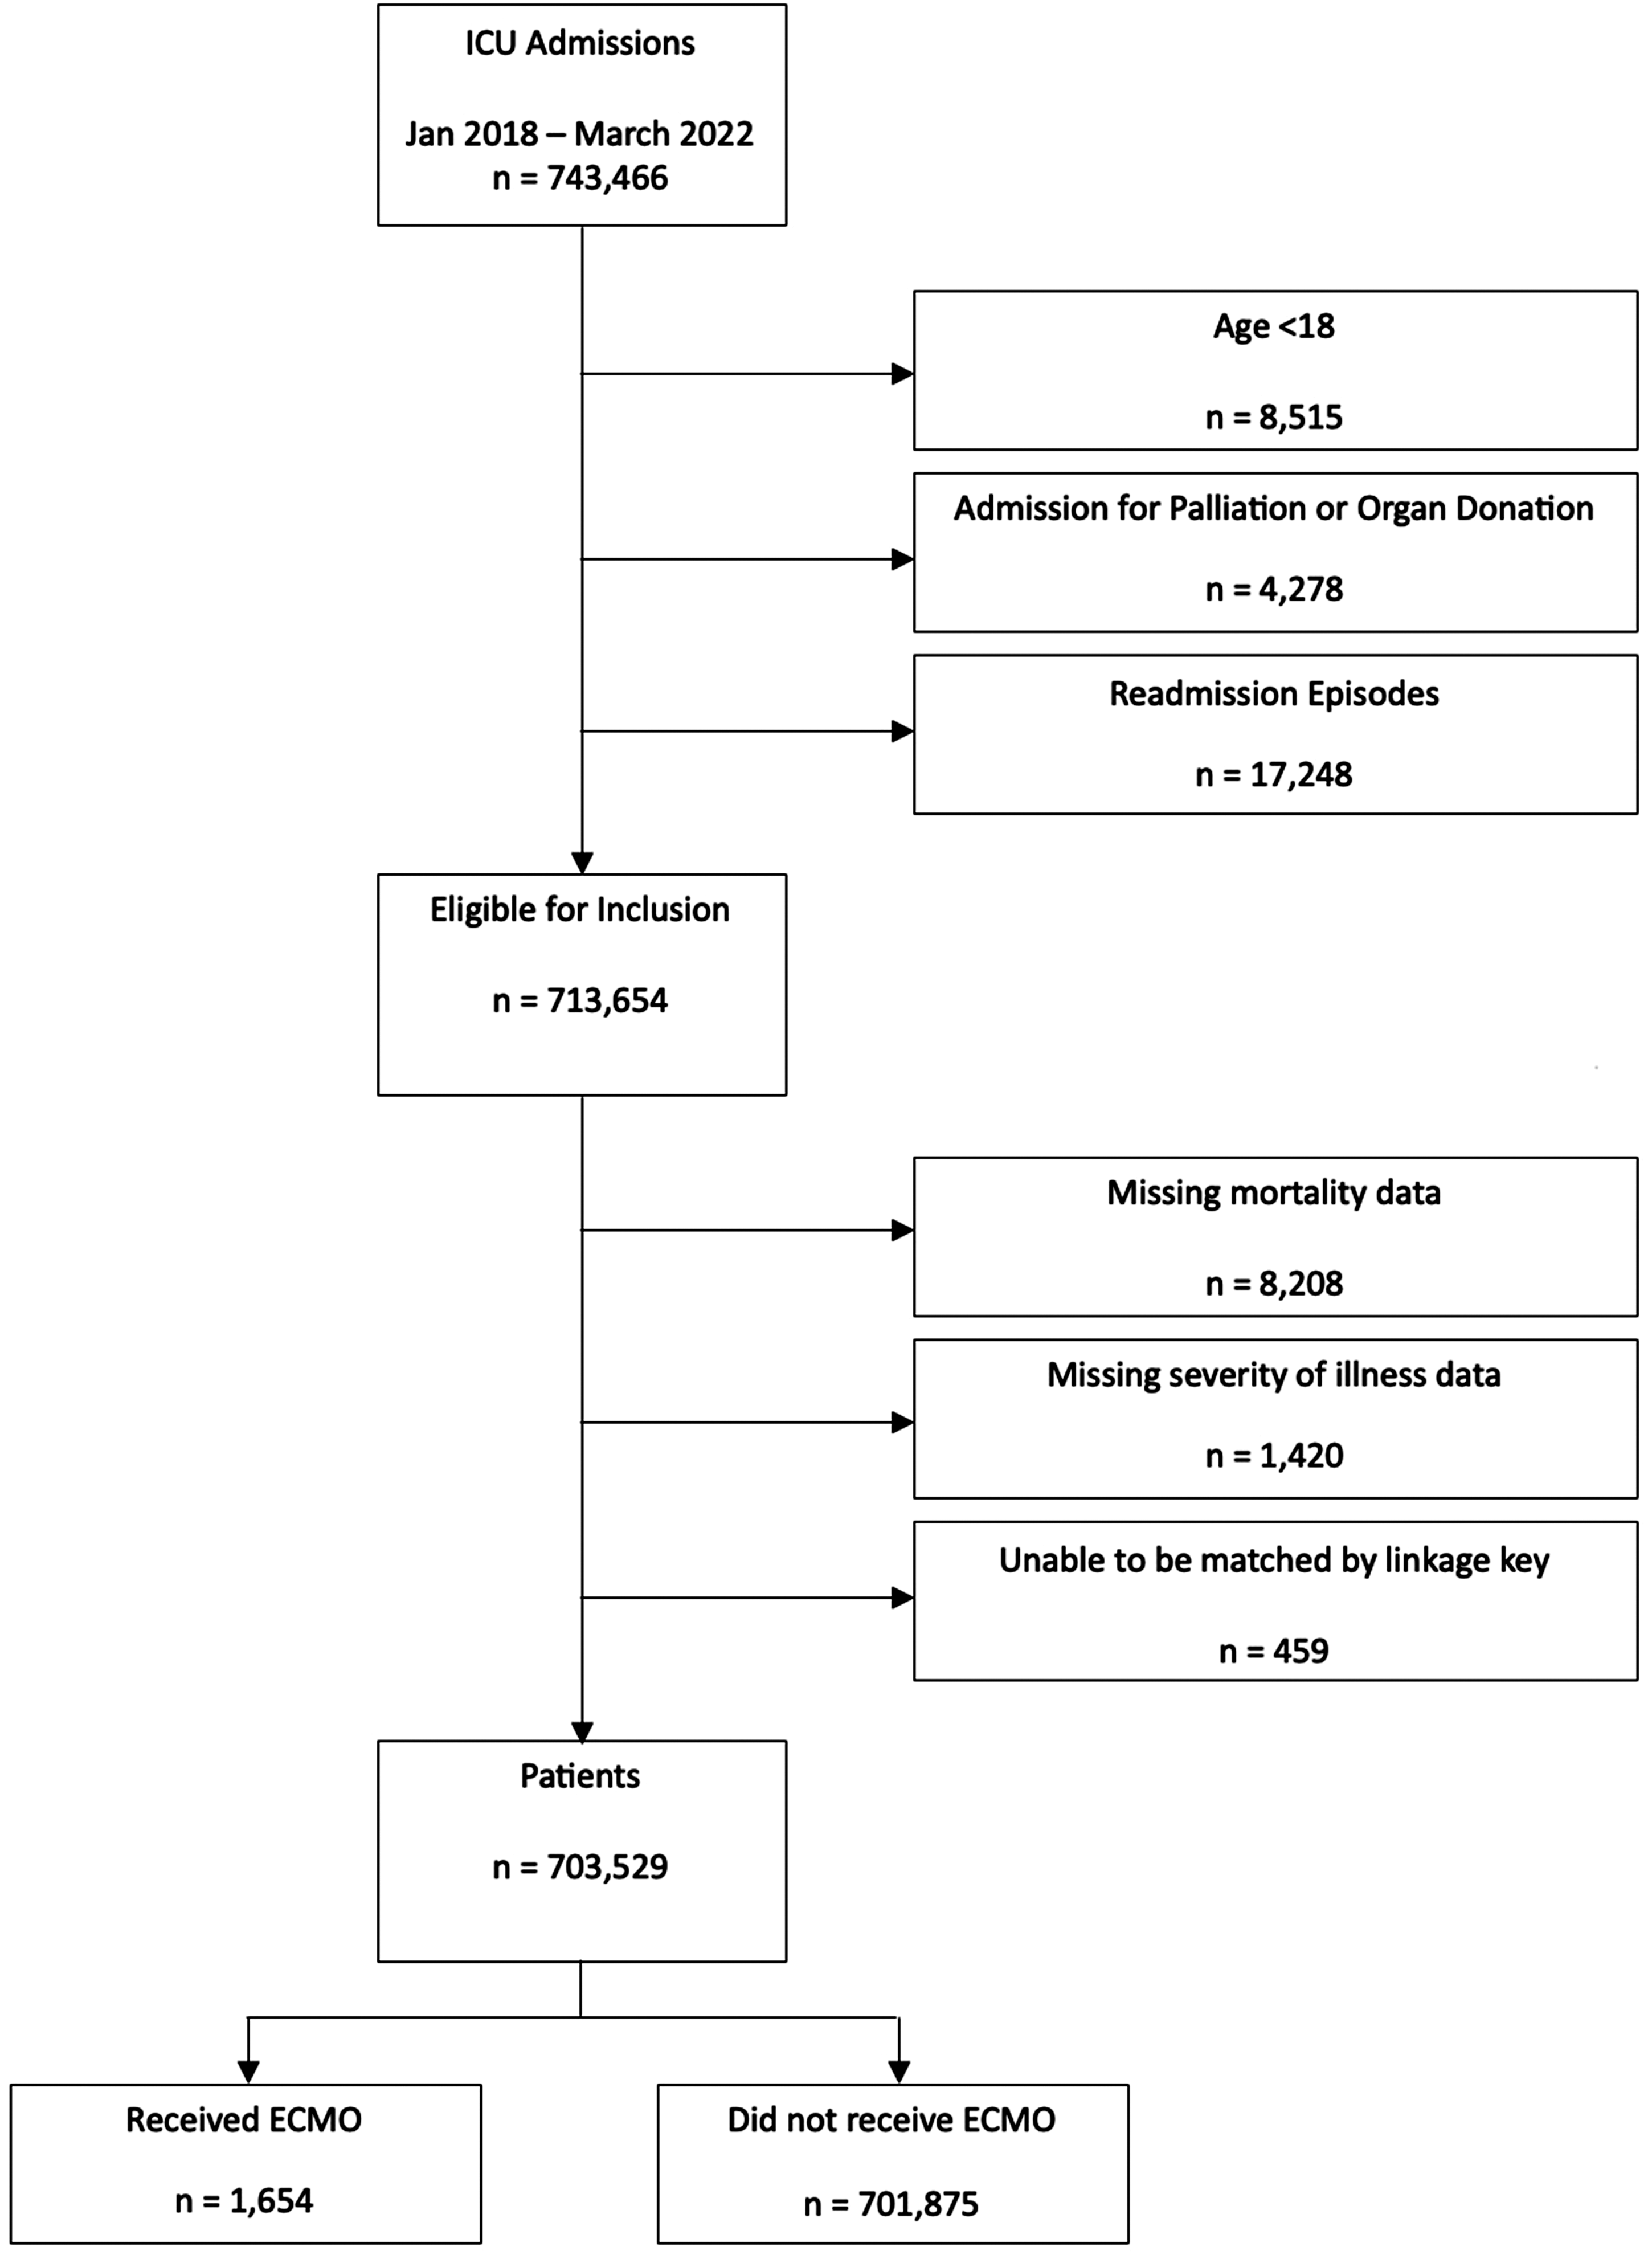
Derivation of study population. STROBE (Strengthening The Reporting of Observational Studies in Epidemiology) flow diagram indicates the number and indication of exclusions based upon trial design and data quality, and the size of the final cohort. The final cohort was used for both the unmatched analysis and the propensity analysis. ICU: intensive care unit; ECMO: extracorporeal membrane oxygenation.
Unmatched analysis
Demographic and location characteristics of patients who did and did not receive ECMO are summarised in Table 1 and Supplementary Table S4. The majority of ECMO patients (51.6%) had their initial admission at a Major ECMO centre, although the majority of initial ICU admissions (60%) were at a non-ECMO centre. Major Cities contributed disproportionately more ECMO admissions (70% vs 59.9%, P < 0.001) than other Remoteness Areas. Hospital mortality was higher in the ECMO compared with the non-ECMO cohort (32% vs 6.8%, P < 0.001).
Baseline characteristics of patients prior to matching.
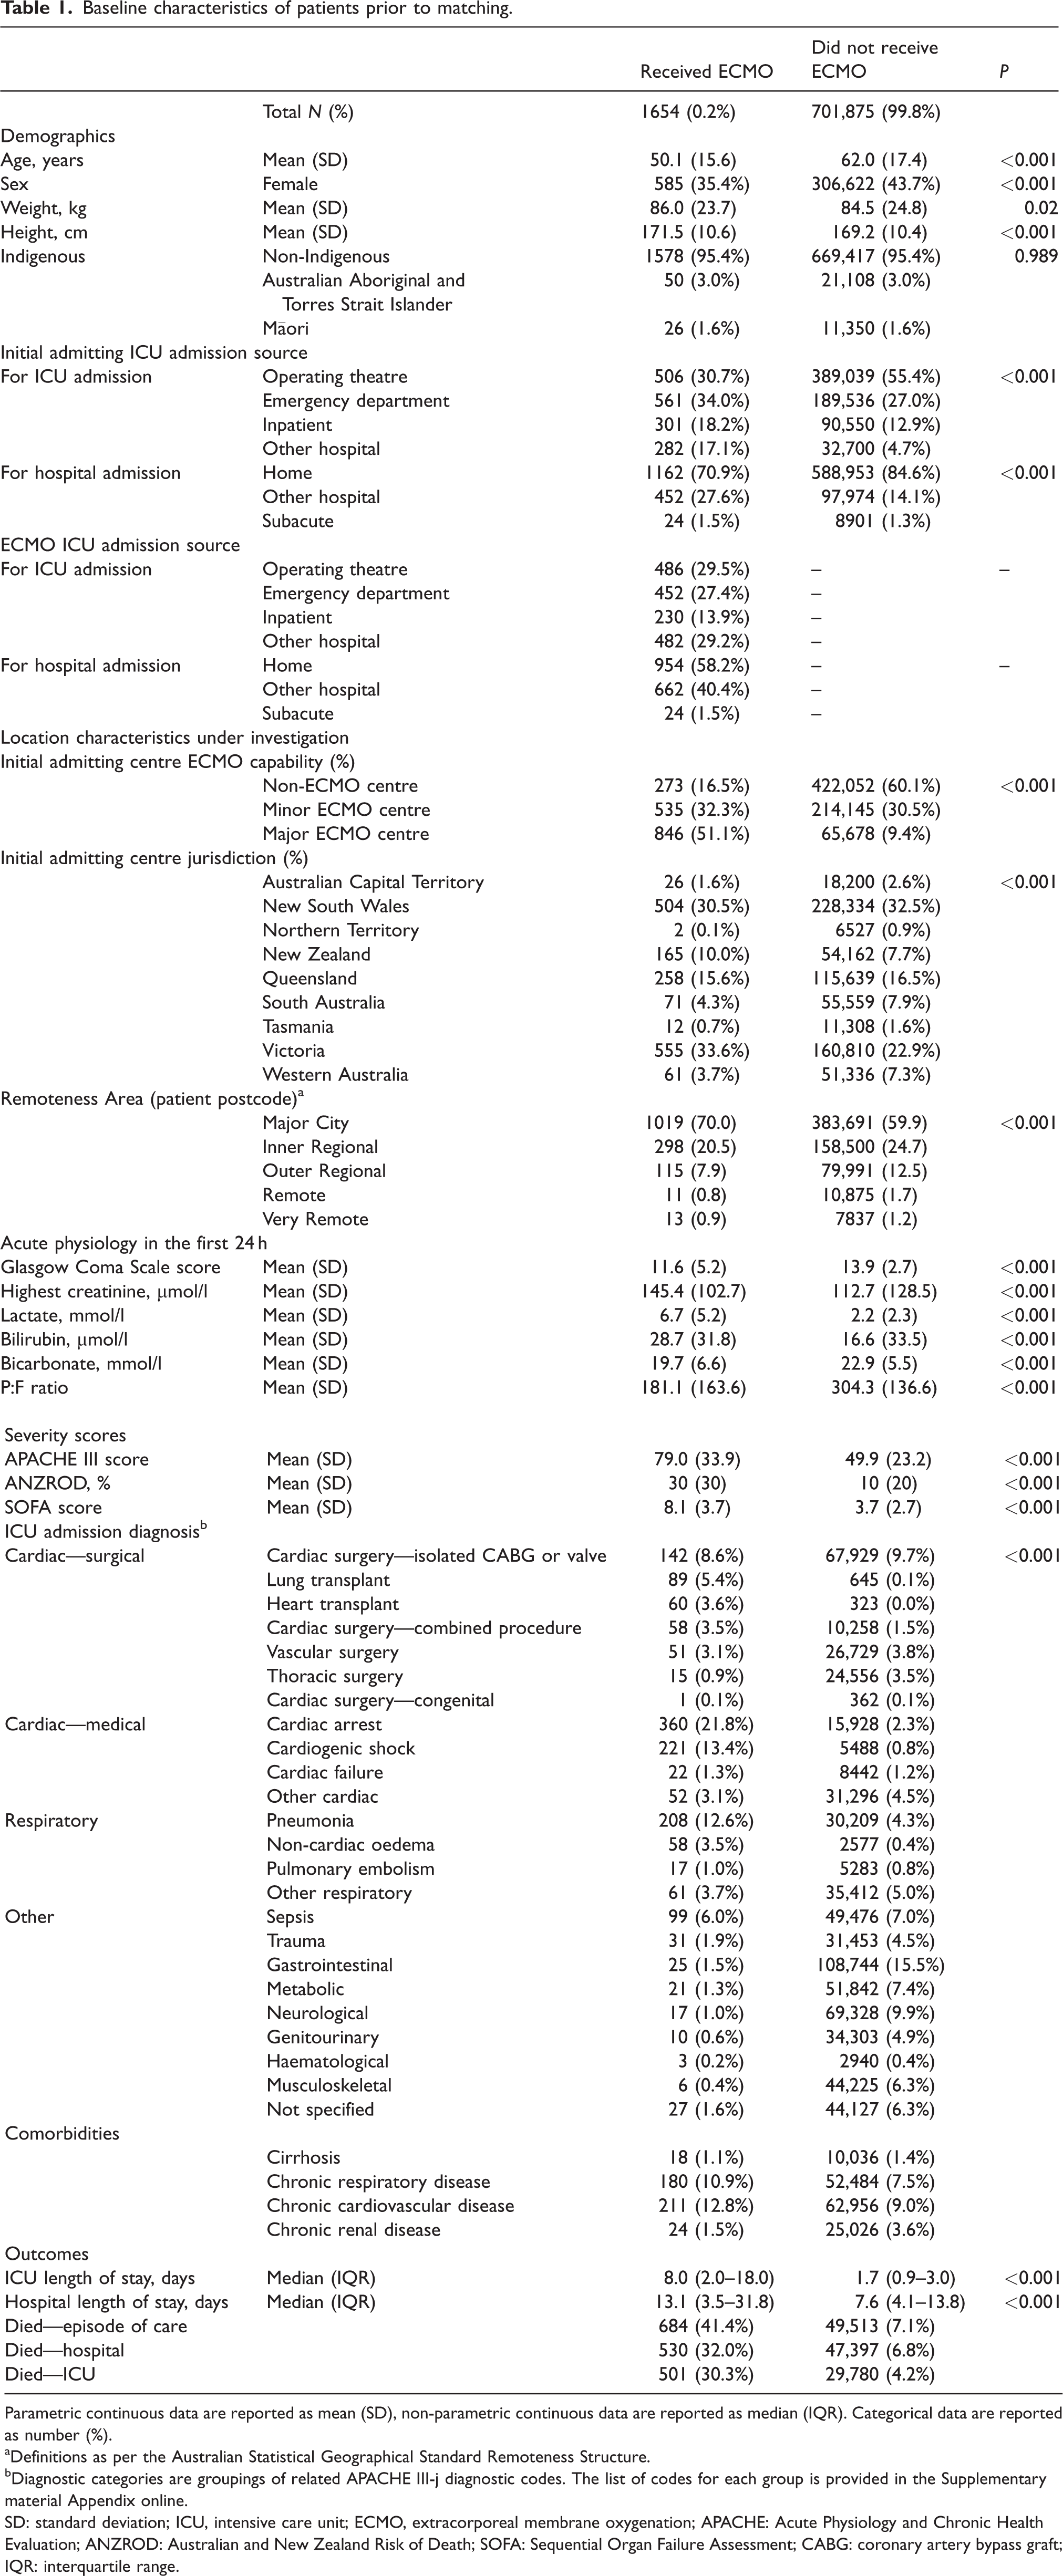
Parametric continuous data are reported as mean (SD), non-parametric continuous data are reported as median (IQR). Categorical data are reported as number (%).
Definitions as per the Australian Statistical Geographical Standard Remoteness Structure.
Diagnostic categories are groupings of related APACHE III-j diagnostic codes. The list of codes for each group is provided in the Supplementary material Appendix online.
SD: standard deviation; ICU, intensive care unit; ECMO, extracorporeal membrane oxygenation; APACHE: Acute Physiology and Chronic Health Evaluation; ANZROD: Australian and New Zealand Risk of Death; SOFA: Sequential Organ Failure Assessment; CABG: coronary artery bypass graft; IQR: interquartile range.
Matched analysis (no risk adjustment)
There was a lower proportion of missing data among the patients who received ECMO compared with those who did not (3.2% vs 5.8%, P < 0.001). Missing data are summarised in Supplementary Figure S1. The imputation showed minimal discrepancy between observed and imputed data (Supplementary Figures S2 and S3).
After propensity matching, ECMO and non-ECMO patients were well balanced with respect to matching characteristics, although imbalance remained in some unmatched characteristics (Table 2, Supplementary Table S5 and Supplementary Figure S4). The propensity for ECMO was low but well-balanced in both ECMO and non-ECMO groups (Supplementary Figure S5). A schematic of the matched analysis process and the results produced at each stage is provided in Supplementary Figure S6.
Balance characteristics of matched patients. Summary of pooled data from 26 imputed datasets.
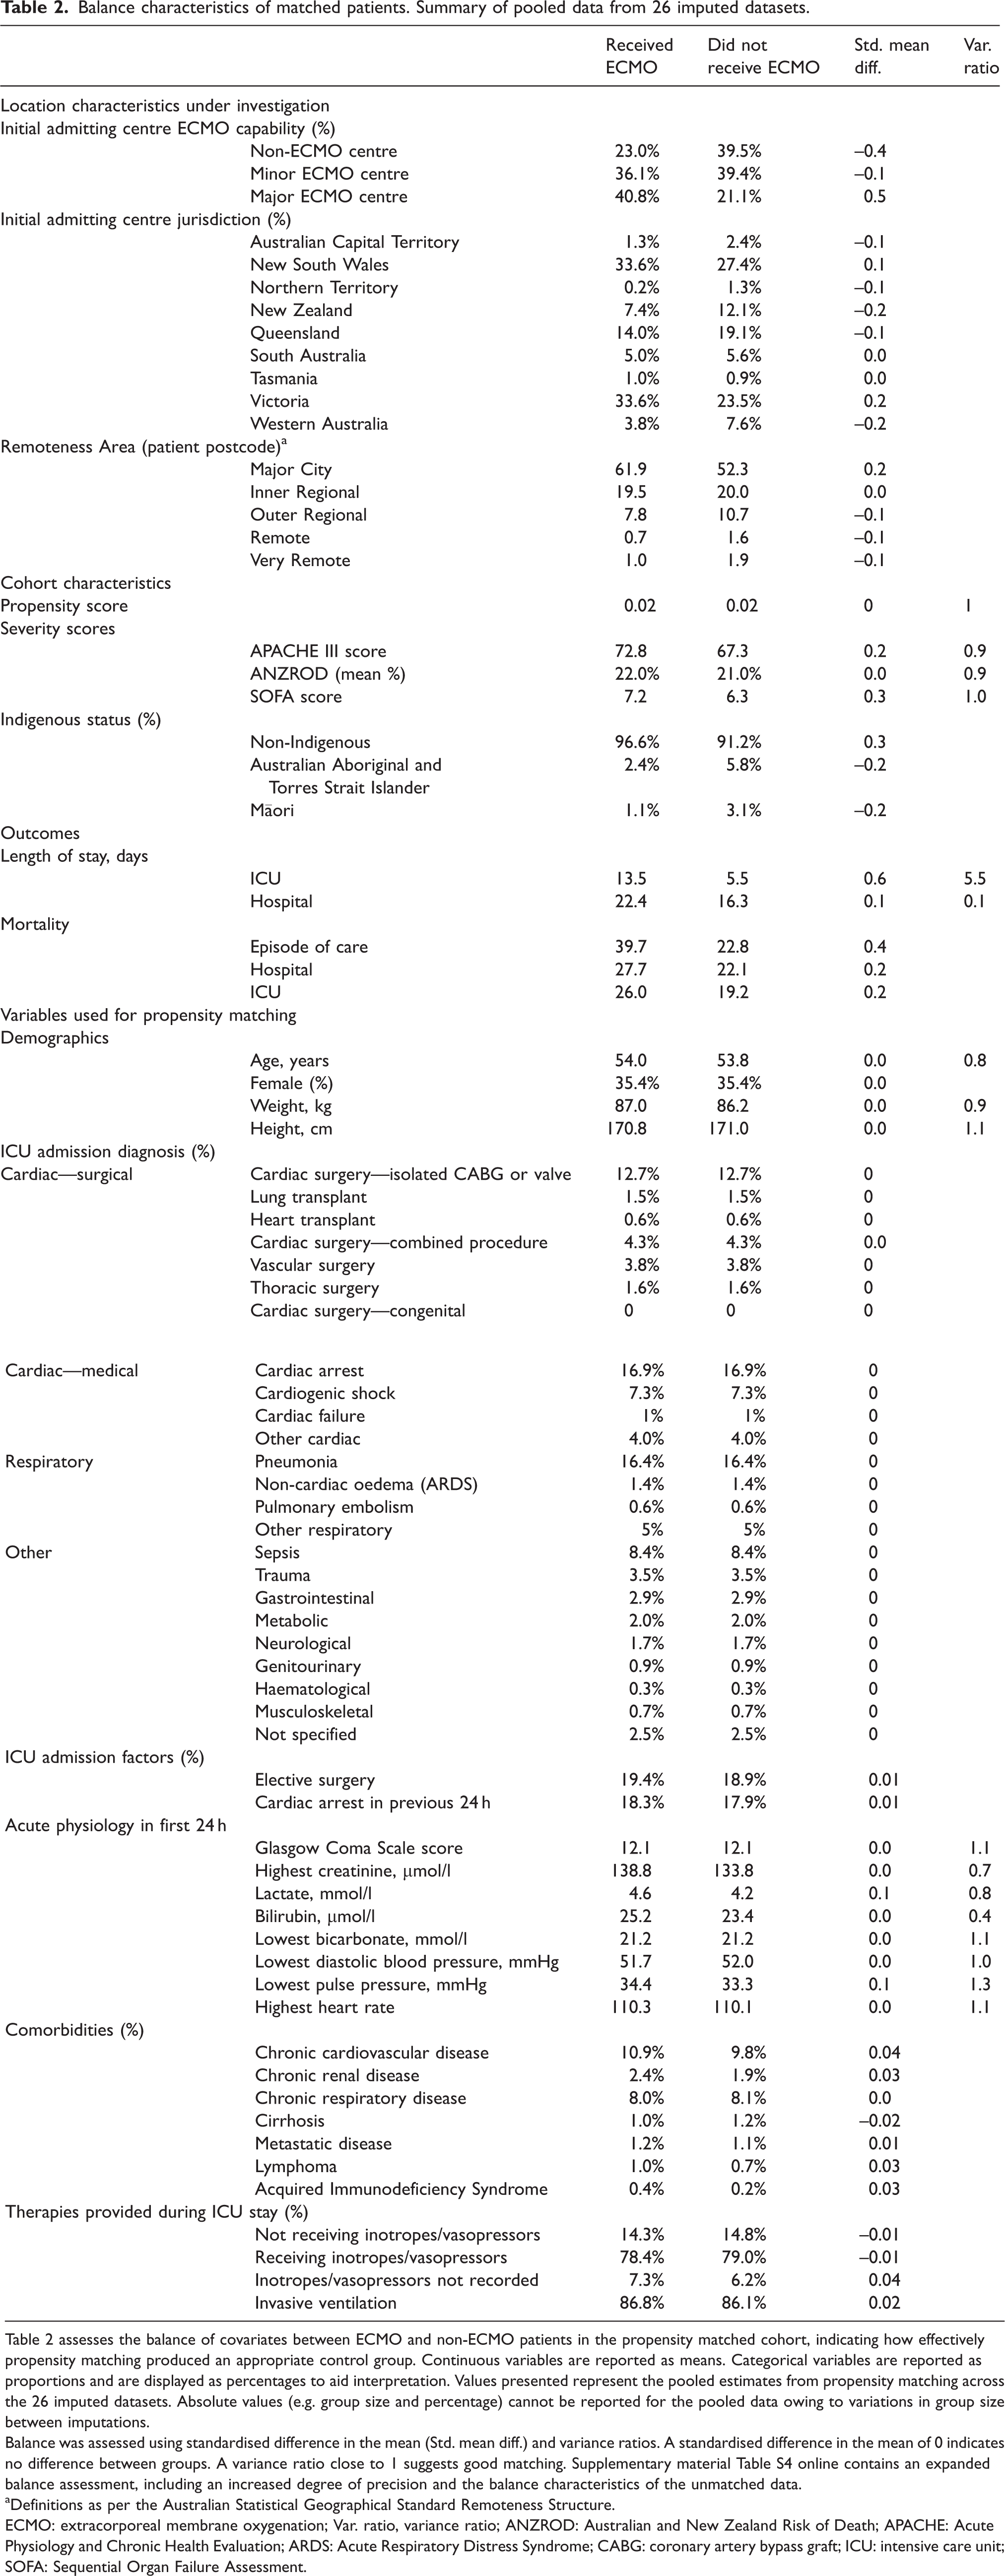
Table 2 assesses the balance of covariates between ECMO and non-ECMO patients in the propensity matched cohort, indicating how effectively propensity matching produced an appropriate control group. Continuous variables are reported as means. Categorical variables are reported as proportions and are displayed as percentages to aid interpretation. Values presented represent the pooled estimates from propensity matching across the 26 imputed datasets. Absolute values (e.g. group size and percentage) cannot be reported for the pooled data owing to variations in group size between imputations.
Balance was assessed using standardised difference in the mean (Std. mean diff.) and variance ratios. A standardised difference in the mean of 0 indicates no difference between groups. A variance ratio close to 1 suggests good matching. Supplementary material Table S4 online contains an expanded balance assessment, including an increased degree of precision and the balance characteristics of the unmatched data.
Definitions as per the Australian Statistical Geographical Standard Remoteness Structure.
ECMO: extracorporeal membrane oxygenation; Var. ratio, variance ratio; ANZROD: Australian and New Zealand Risk of Death; APACHE: Acute Physiology and Chronic Health Evaluation; ARDS: Acute Respiratory Distress Syndrome; CABG: coronary artery bypass graft; ICU: intensive care unit; SOFA: Sequential Organ Failure Assessment.
Increasing remoteness was associated with reduced receipt of ECMO (Supplementary Figure S7). The modified fragility index estimated that the highest disparity for access to ECMO occurred in Outer Regional areas (Figure 2). The annual number of ‘missed ECMO cases’ was estimated as 22 in Inner Regional areas, 40 in Outer Regional areas and 10 in each of Remote and Very Remote areas.
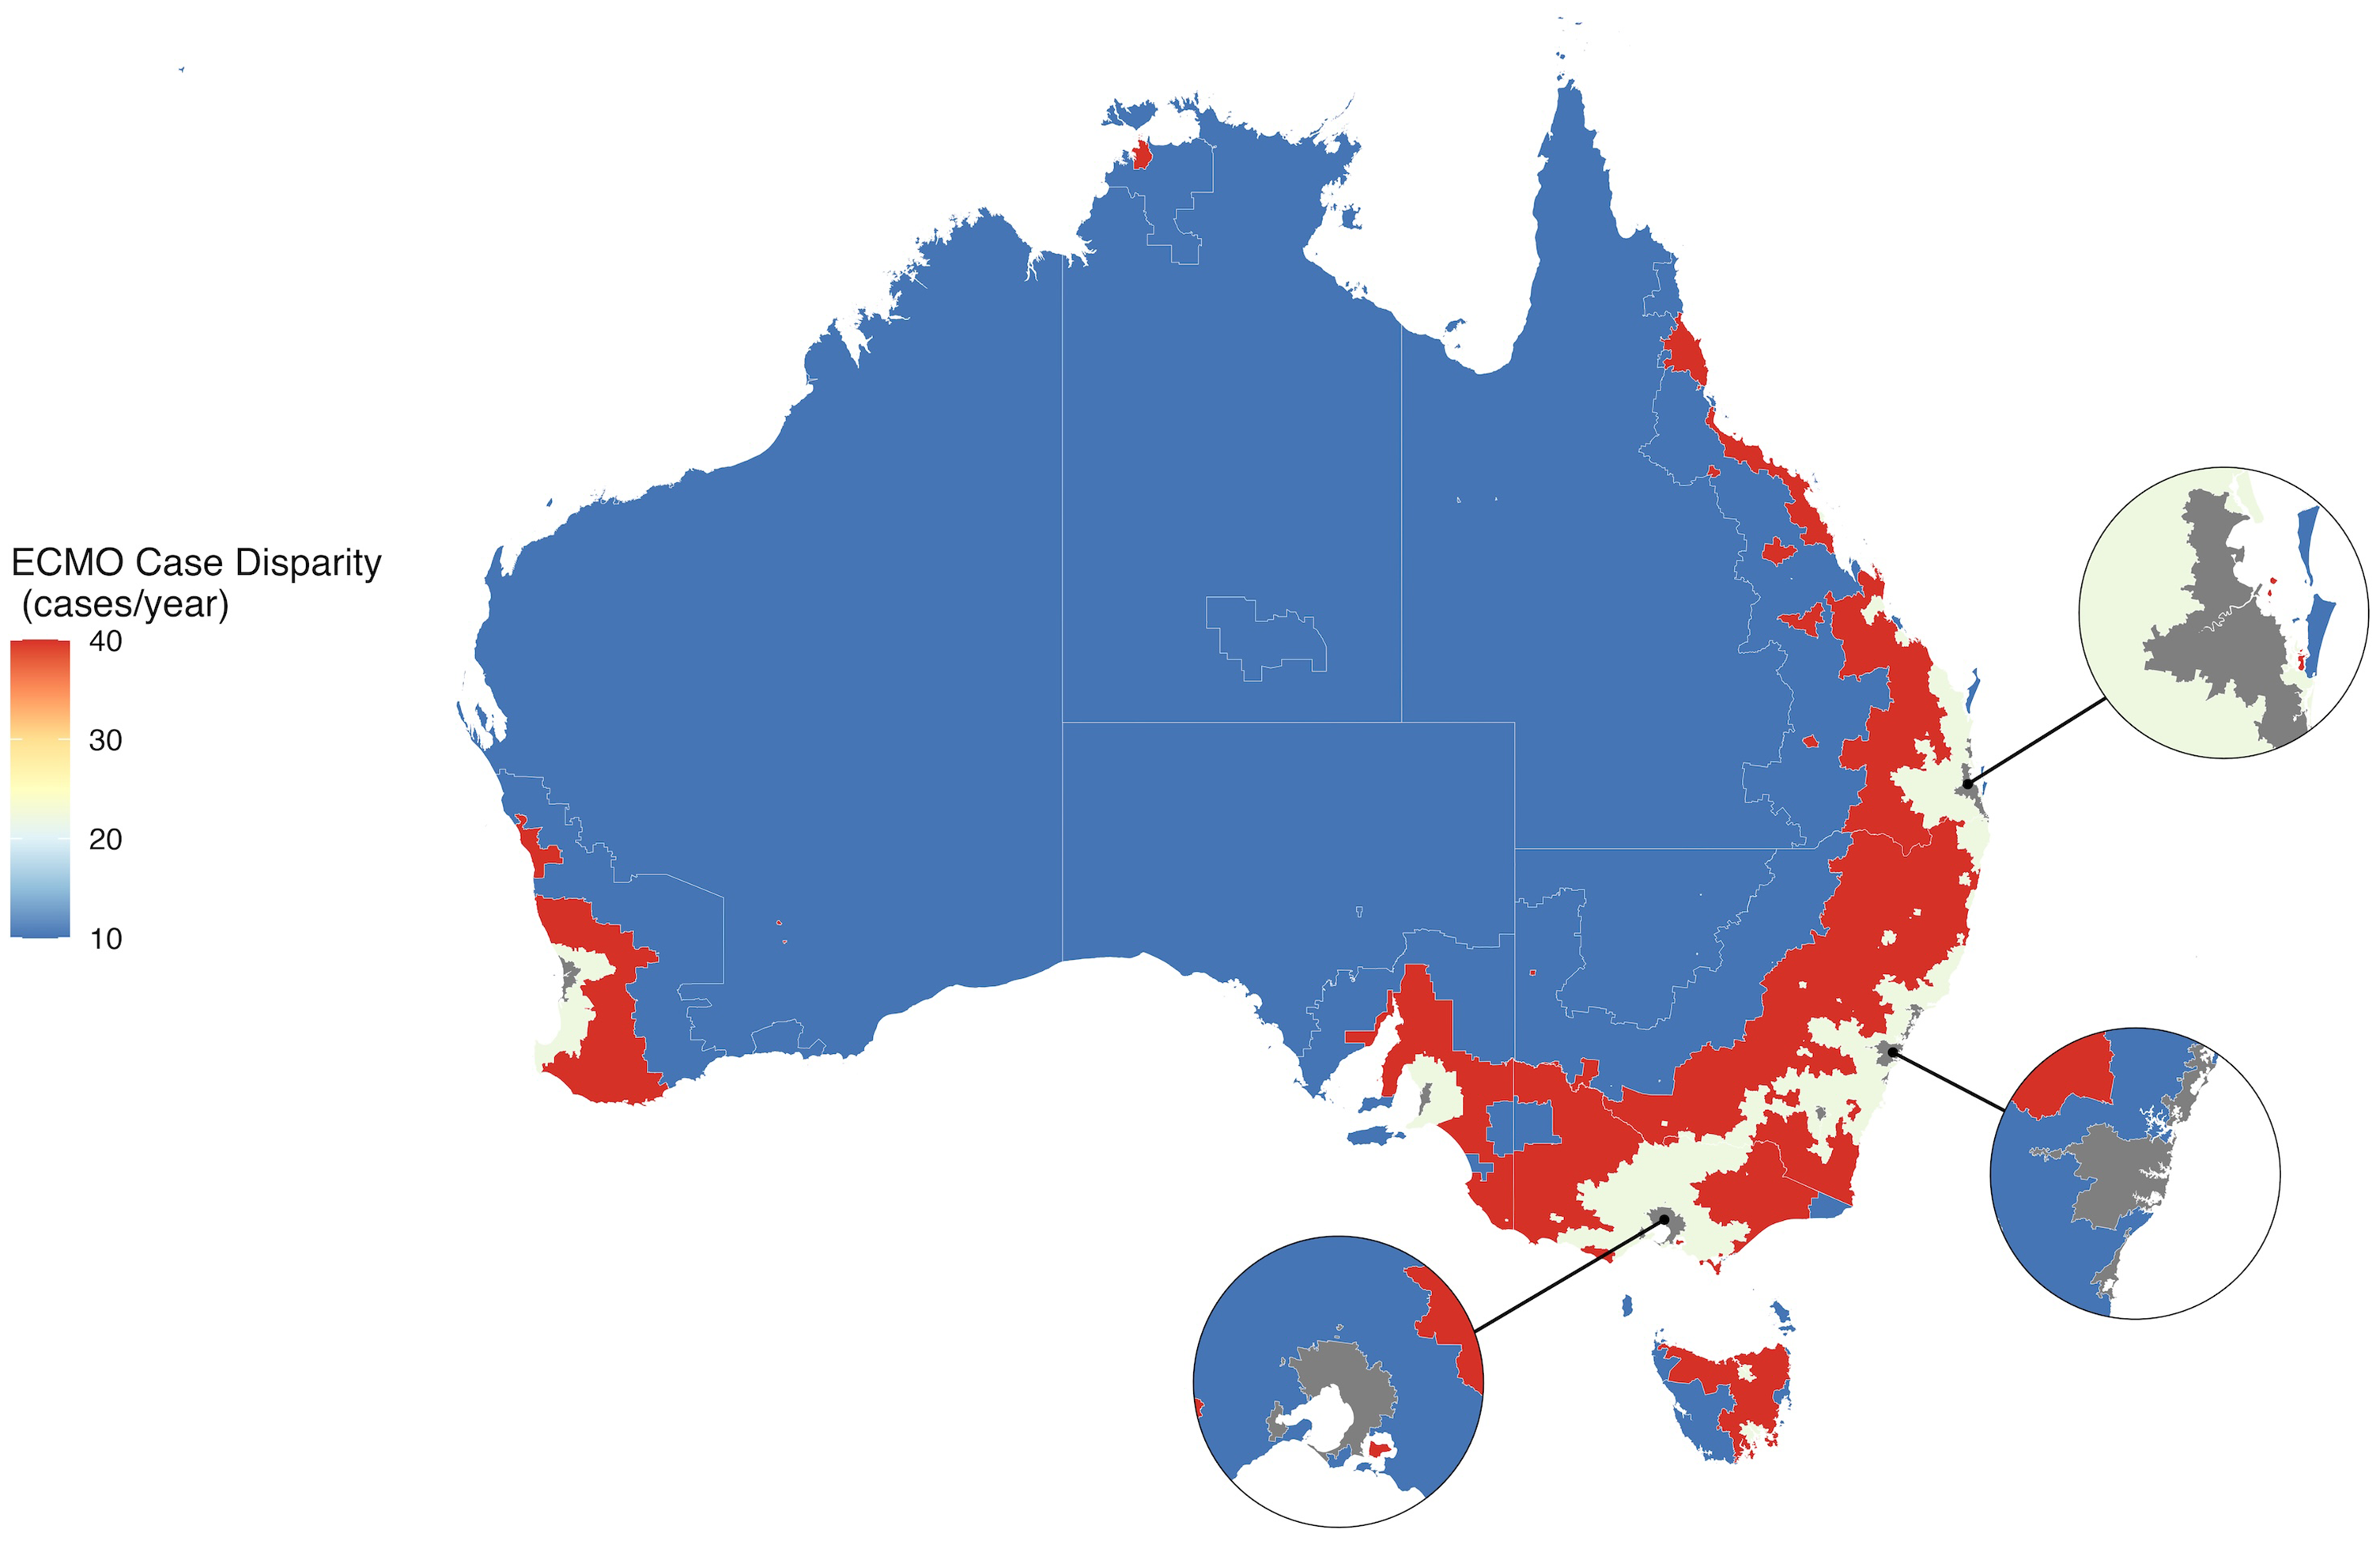
Heat map of annualised fragility index by Remoteness Area. Figure 2 indicates the estimated degree of extracorporeal membrane oxygenation (ECMO) case disparity, as calculated by the modified fragility index, in different Remoteness Areas of Australia. The modified fragility index is the number of additional ECMO cases per year that is required to produce a non-significant difference in the odds of ratio of presenting to an intensive care unit in that Remoteness Area compared with the reference category (Major Cities). Disparity is calculated solely on Remoteness Category of the patient’s primary residential address without adjustment for ECMO centre type or jurisdiction of the index admission centre. State and territory borders are shown only to aid interpretation.
Matched analysis (risk adjusted)
There was evidence of moderate multicollinearity between geographic jurisdiction and Remoteness Area, which was not present when patients admitted in New Zealand were excluded. The multicollinearity had minimal effect on the model coefficients and no effect on statistical significance (Supplementary Figure S8) and was ignored.
Initial admission in a non-ECMO centre was associated with reduced odds of receiving ECMO (odds ratio (OR) 0.60, 95% confidence interval (CI) 0.52 to 0.69), whilst initial admission in a Major ECMO centre was associated with increased odds of receiving ECMO (OR 2.03, 95% CI 1.78 to 2.31) compared with Minor ECMO centres (Figure 3). Patients had a reduced odds of receiving ECMO if admitted in New Zealand (OR 0.42, 95% CI 0.26 to 0.67), the Australian Capital Territory (OR 0.53, 95% CI 0.33 to 0.86), the Northern Territory (OR 0.29, 95% CI 0.1 to 0.86), Queensland (OR 0.53, 95% CI 0.45 to 0.63) or Western Australia (OR 0.46, 95% CI 0.35 to 0.62) compared with New South Wales. Patients from Outer Regional areas were less likely to receive ECMO than those residing in a Major City (OR 0.77, 95% CI 0.63 to 0.94). These results were consistent with the results of the sensitivity analysis (Supplementary Figure S9).
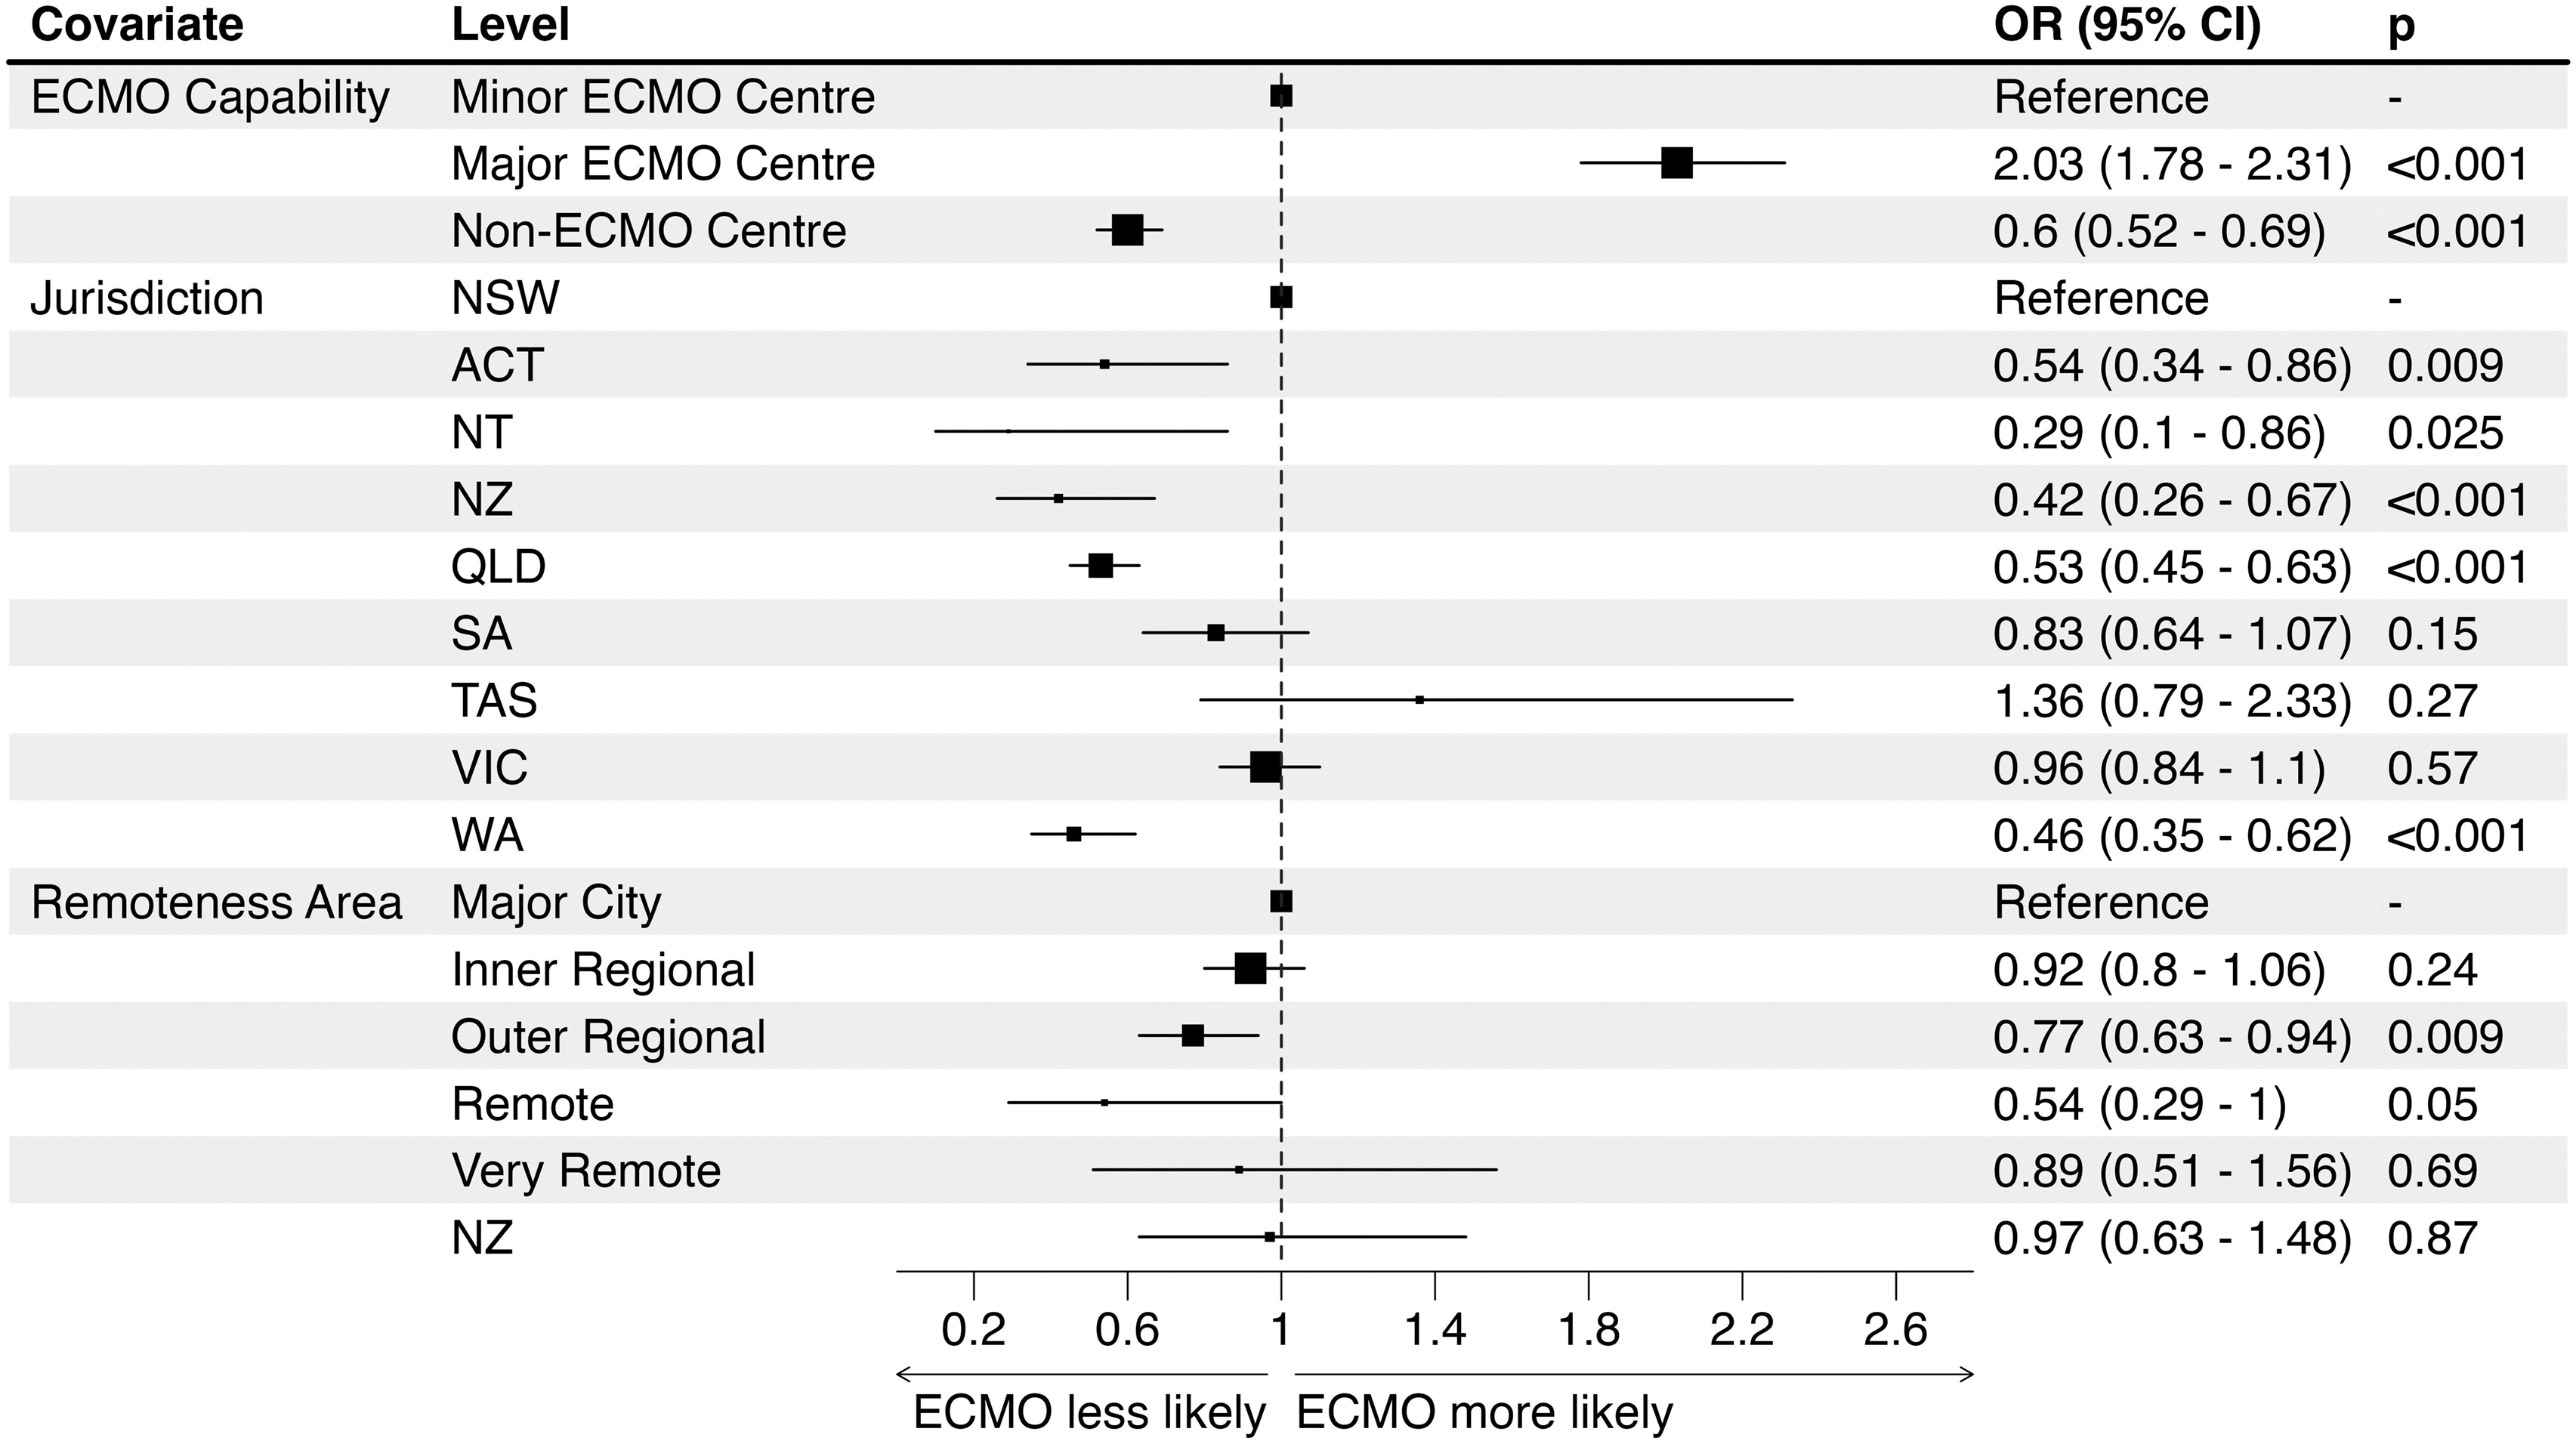
Multivariable analyses of propensity matched data. Multivariable association between receipt of ECMO and location characteristics of the initial admitting intensive care unit and patient Remoteness Area for that episode of care, after propensity matching. Box size for non-reference categories is inversely proportional to the standard error and proportional of the precision of the estimate. Box size for reference categories is arbitrary. OR: odds ratio; CI: confidence interval; ECMO: extracorporeal membrane oxygenation; NSW: New South Wales; ACT: Australian Capital Territory; NT: Northern Territory; NZ: New Zealand; QLD: Queensland; SA: South Australia; TAS: Tasmania; VIC: Victoria; WA: Western Australia.
Discussion
In this propensity-matched risk-adjusted study of 703,529 patients of whom 1654 (0.2%) received ECMO, a patient’s location significantly influenced the odds of receiving ECMO. Patients in outer regional areas of Australia, in jurisdictions other than New South Wales and Victoria, and centres which were not Major ECMO centres were less likely to receive ECMO. The majority of ECMO patients were admitted directly to Major ECMO centres, despite these centres accounting for less than 10% of all ICU admissions, and this effect persisted after risk adjustment. It is also notable that this effect persisted after excluding patients undergoing cardiac surgery and thoracic organ transplant, suggesting that this relationship is not entirely due to the performance of cardiac surgery.
Specialist healthcare is typically centralised to both improve outcomes and increase efficiency. 19 Favourable volume–outcome relationships have been observed in conditions including out-of-hospital cardiac arrest8,20 and thoracic organ transplant. 21 Centralisation of ECMO services in Australia and New Zealand has occurred primarily through co-location within centres providing cardiothoracic surgical services. Volume–outcome relationships have been reported for ECMO internationally, although conflicting data exist.22–24 Centralisation may also reduce access to patients on the periphery of a catchment area. Well-coordinated referral and retrieval services may reduce this imbalance. Our study addresses this information gap about equity of ECMO delivery in Australia and New Zealand.25–27
Initial admission to a centre in the Australian Capital Territory, Northern Territory, New Zealand, Queensland, South Australia, Tasmania or Western Australia was associated with reduced receipt of ECMO compared with an initial admission in Victoria or New South Wales. Both Victoria and New South Wales jurisdictions consist of large populations (contributing 55.4% of all admissions in the study period) concentrated in relatively central cities, with established high-volume ECMO centres. This combination of characteristics is not seen in other jurisdictions.
The reduced access to ECMO in Outer Regional areas of Australia is likely due to the small number of ECMO-capable centres in areas which serve a relatively high number of patients. Although Very Remote and Remote areas have even less access to ECMO, there is a smaller number of patients affected owing to the small population. Despite the statistical significance of this finding, we estimated 40 ‘missed ECMO cases’ per year across the total Outer Regional area of Australia. Nevertheless, there are implications for health policy if dedicated prospective work shows that geographical isolation, with or without sociodemographic inequity, reduces clinically appropriate access to ECMO.
Our study had several strengths. Use of a high quality, inclusive clinical registry ensures that data are representative of ECMO volume in Australia and New Zealand and allowed us to identify appropriate non-ECMO control patients. This could not be performed with any ECMO-specific dataset. By classifying patients as receiving ECMO in their initial admitting centre if they received it at any point during that episode of care, we included the effect of referral and retrieval services in our equity analysis. Propensity matching was effective at identifying the subset of non-ECMO patients who had higher disease burden than unmatched patients.
This study has several limitations. Although propensity scores were well-balanced between groups and patients were balanced on matching criteria, the higher mortality rate in the ECMO group suggests that there are factors that affect ECMO mortality that were not accounted for. ECMO configuration (veno-venous or veno-arterial) was not available; the presence of this data may have improved matching. We did not have data for patients presenting to hospitals without ICUs, which are typically in regional and remote locations. Patients presenting to remote hospitals who are either not transferred or die prior to transfer were not captured. We had no information on patients who received ECMO but died prior to ICU admission.
Our aim was to study access to ECMO, not whether ECMO use was appropriate or had an effect on outcome. However, the higher mortality among patients who received ECMO in the propensity-matched cohort (40.6% vs 22.5%) is interesting and could reflect the fact that ECMO is a marker of severity of illness, independent of other described predictors—and therefore a limitation of propensity matching. Another possibility is that there was a potential mortality detriment from ECMO.
Higher ECMO utilisation in tertiary centres may relate to the nature of the clinical work, or increased utilisation in situations of low clinical benefit. The benefit of ECMO appears to be greatest when used judiciously in carefully selected patients, 28 in high-volume centres familiar with its use. Therefore, increasing access to ECMO should be targeted to patients who may benefit most. Future work to identify the subgroups of patient who most benefit from ECMO support, and to evaluate the efficacy of retrieval services in improving access to ECMO would be beneficial.
Our study indicates that there are differences in provision of ECMO according to geographic location across Australia and New Zealand and these differences may reflect inequity of access to ECMO services. Contributing factors include the patient’s location of origin, and the jurisdiction and hospital-type where the patient is admitted. This should inform future healthcare policy and the planning of ECMO services in both countries.
Supplemental Material
sj-pdf-1-aic-10.1177_0310057X251358274 - Supplemental material for Impact of the location of the initial admitting intensive care unit on the delivery of extracorporeal membrane oxygenation in Australia and New Zealand
Supplemental material, sj-pdf-1-aic-10.1177_0310057X251358274 for Impact of the location of the initial admitting intensive care unit on the delivery of extracorporeal membrane oxygenation in Australia and New Zealand by C Jake D Barlow, Alastair J Brown, Tess Evan, David A Sidebotham and David V Pilcher in Anaesthesia and Intensive Care
Footnotes
Author Contribution(s)
Data sharing statement
Data are submitted to the ANZICS APD by hospitals for benchmarking purposes and are subject to local and institutional privacy policies. Requests for access to data can be made to ![]() .
.
Declaration of conflicting interests
The authors have no conflicts of interest to declare.
Funding
The authors received no financial support for the research, authorship, and/or publication of this article.
Supplemental material
Supplemental material for this article is available online.
References
Supplementary Material
Please find the following supplemental material available below.
For Open Access articles published under a Creative Commons License, all supplemental material carries the same license as the article it is associated with.
For non-Open Access articles published, all supplemental material carries a non-exclusive license, and permission requests for re-use of supplemental material or any part of supplemental material shall be sent directly to the copyright owner as specified in the copyright notice associated with the article.