
Abstract
The purpose of this study is to use structural equation modelling (SEM) to investigate the extent to which different monitoring mechanisms – the board and its committees, shareholders and independent auditors – are complements (i.e. a positive covariance) or substitutes (a negative covariance) for each other. The lack of consistent results in previous corporate governance research may be attributable to attention not being paid to monitoring mechanisms’ substitution or complementary relationships. By using SEM, this study concludes that complementary and substitution relationships among monitoring mechanisms are present. Using data from the pre – and post – global financial crisis period, this study explains where such corporate government impacts occurred, the inconsistencies that are evident in previous studies and provides insights into corporate governance practices.
1. Introduction
In recent years governments’, regulators’ and researchers’ attention to corporate governance has increased significantly. Such interest has largely been directed towards the monitoring of overall corporate governance structures, financial controls and financial performance. This research focuses on monitoring of overall corporate governance structures and the relationships between those monitoring roles using structural equation modelling (SEM). SEM is a technique for analysing data designed to assess relationships existing across both manifest (i.e. directly measured or observed) and latent (i.e. the underlying theoretical construct) variables (Martens, 2005). When using statistical techniques, such as multiple regression or analysis of variance (ANOVA), the researcher only conducts the analysis on variables that are directly measurable, which can be somewhat limiting when the individual is interested in testing alternate governance mechanisms and including a list of the control variables in their analysis. Using various measures of financial performance as a proxy for shareholders’ interests, this research examines whether selected monitoring mechanisms affect company performance. A sample was taken from Australia’s top-500 listed companies for the pre- and post-global financial crisis (GFC) period, in order to examine the extent to which these mechanisms function as substitutes or complement each other.
SEM as a method emerged in the early 20th century, developed by Sewall Wright in 1916 (Bollen, 1990). The increasing complexity of research questions and the appearance of flexible user-friendly computer software (Marcoulides and Hershberger, 1999) have increased interest in SEM (Hair et al., 2009; Kelloway, 1998; Raykov and Marcoulides, 1999). SEM has become increasingly popular in psychology, education, the social sciences (Fan et al., 1999), biology, economics, medicine, marketing (Raykov and Marcoulides, 1999), psychology (Bollen, 1990), demography and even genetics (Hair et al., 2009). It has also been used in fields related to this research, including consumer behaviour (Jarratt, 2000) and ethical decision-making (Hair et al., 2009).
In corporate governance research, there has been a slow but steady increase in the use of SEM (Daily et al., 1999; Lin, 2005; Sahnoun and Zarai, 2009; Tam and Tan, 2007; Zhang, 2010). For example, Daily et al. (1999) used a structural equation model to measure board composition. Lin (2005) studies the influence of board of directors and large external shareholders on controlling CEO compensation using SEM. Tam and Tan (2007) examines the relationship between ownership types and firm performance through SEM. Sahnoun and Zarai (2009) uses SEM to investigate the impact of auditee business risk, audit risk and auditor business risk evaluation on auditor–auditee negotiation outcomes. Zhang (2010) employs SEM to examine how corporate boards can create a sustainable competitive advantage. While all these studies used SEM in a single monitoring setting (i.e. board of directors, shareholders or auditors), attention has not been given to the combined effect of monitoring mechanisms and the possibility that these mechanisms may have a substitution or complementary effect.
Again, the possibility of substitution among various monitoring mechanisms has been previously examined by using different statistical methods, except SEM (e.g. Boo and Sharma, 2008; Coles et al., 2001; Fernández and Arrondo, 2005; Ward et al., 2009). Ward et al. (2009) proposed that when companies are performing poorly, outside monitoring by institutional investors can complement internal monitoring, a function usually done by boards of directors. Boo and Sharma (2008) examined the relationship between internal governance, external audit monitoring and regulatory oversight. They concluded that regulatory oversight reduces information asymmetry; hence, reducing the demand for costly monitoring by the external auditor. Fernández and Arrondo (2005), using a sample consisting of Spanish companies, found that when monitoring by directors increases, monitoring by shareholders decreases and vice versa. Coles et al. (2001) argue that companies may substitute governance choices in selecting the monitoring mechanisms most suitable for their organisational and environmental contexts. However, a major limitation of these studies concerned the existence of endogeneity. Indeed, failing to fully control for all forms of endogeneity can lead to spurious results (Schultz et al., 2010).
Companies’ performance depends on how effective is their mix of monitoring mechanisms to control the agency problem (Agrawal and Knoeber, 1996; Rediker and Seth, 1995; Ward et al., 2009). Even though the overall bundle is effective in aligning managers’ and shareholders’ interests, the impact of any one mechanism may not provide similar results due to the substitute and complementary relationships (Ward et al., 2009). This issue can be explored by using SEM to explore the multivariate relationships that exist between different monitoring mechanisms and their performance consequences. This research aims to provide insights into how the bundle of monitoring mechanisms works to reduce the agency problem.
SEM estimates a series of separate, but interdependent, multiple regression equations simultaneously by specifying the structural model. The same structural model can express relationships among independent and dependent variables, even when dependent variables become independent variables in other relationships. There are two major advantages of using SEM over other statistical tools; firstly, it provides a straightforward method for dealing with multiple relationships simultaneously while providing statistical efficiency; and secondly, it has the ability to analyse the relationships comprehensively and provide a transition from exploratory to confirmatory analysis.
In research on corporate monitoring, there are some variables that cannot be observed directly. These variables are termed latent variables in SEM. In this research examples of latent variables are monitored as undertaken by the board of directors, shareholders and auditors. As these variables are not observed directly, they need to be related to the observed variables to determine their value. In SEM, it is possible to include both observed and latent variables. Observed variables are represented by data and are usually continuous. A latent variable is a hypothesised and unobserved concept that can only be approximated by observable or measurable variables. Latent variables are expressed in terms of observed variables. The latent variables in SEM are continuous regardless of the properties of the observed variables.
Regulatory responses in Australia, such as the Australian Securities Exchange Corporate Governance Council (ASX CGC) and CLERP 9 (Commonwealth of Australia, 2002), have not addressed the substitute and complementary governance issues. While companies operate in an increasingly globalised economy and very competitive environment, they are also subject to regional and local societal, regulatory and business contexts, which may give rise to differences in corporate governance structures and practices.
This paper is structured as follows: Section 2 develops a conceptual view of monitoring mechanisms and performance using an agency perspective; Section 3 discusses the research propositions and methodology; Section 4 describes sample selection and descriptive statistics for the research; Section 5 provides the analysis; and Section 6 presents concluding comments and highlights possible avenues for future research.
2. Theoretical basis for model specification and causality
Theory is important for all multivariate analysis, but it is particularly important for SEM because it is considered a confirmatory form of analysis; that is, it is useful for testing and potentially confirming theory. Theory is needed to specify relationships in structural models. The SEM process begins by choosing the variables that will be measured. It concludes with assessing the overall structural model fit. In the whole process theory plays a key role at each step. The goal of SEM is to test the theory because without theory, a true SEM test cannot be conducted.
Drawing substantially on agency theory literature and previous empirical research results, this research maps how primary monitoring mechanisms may interrelate and affect company performance. A conceptual model has been constructed for this study in order to provide an integrated understanding of how monitoring mechanisms affect company performance. The scope of monitoring research is depicted in Figure 1.
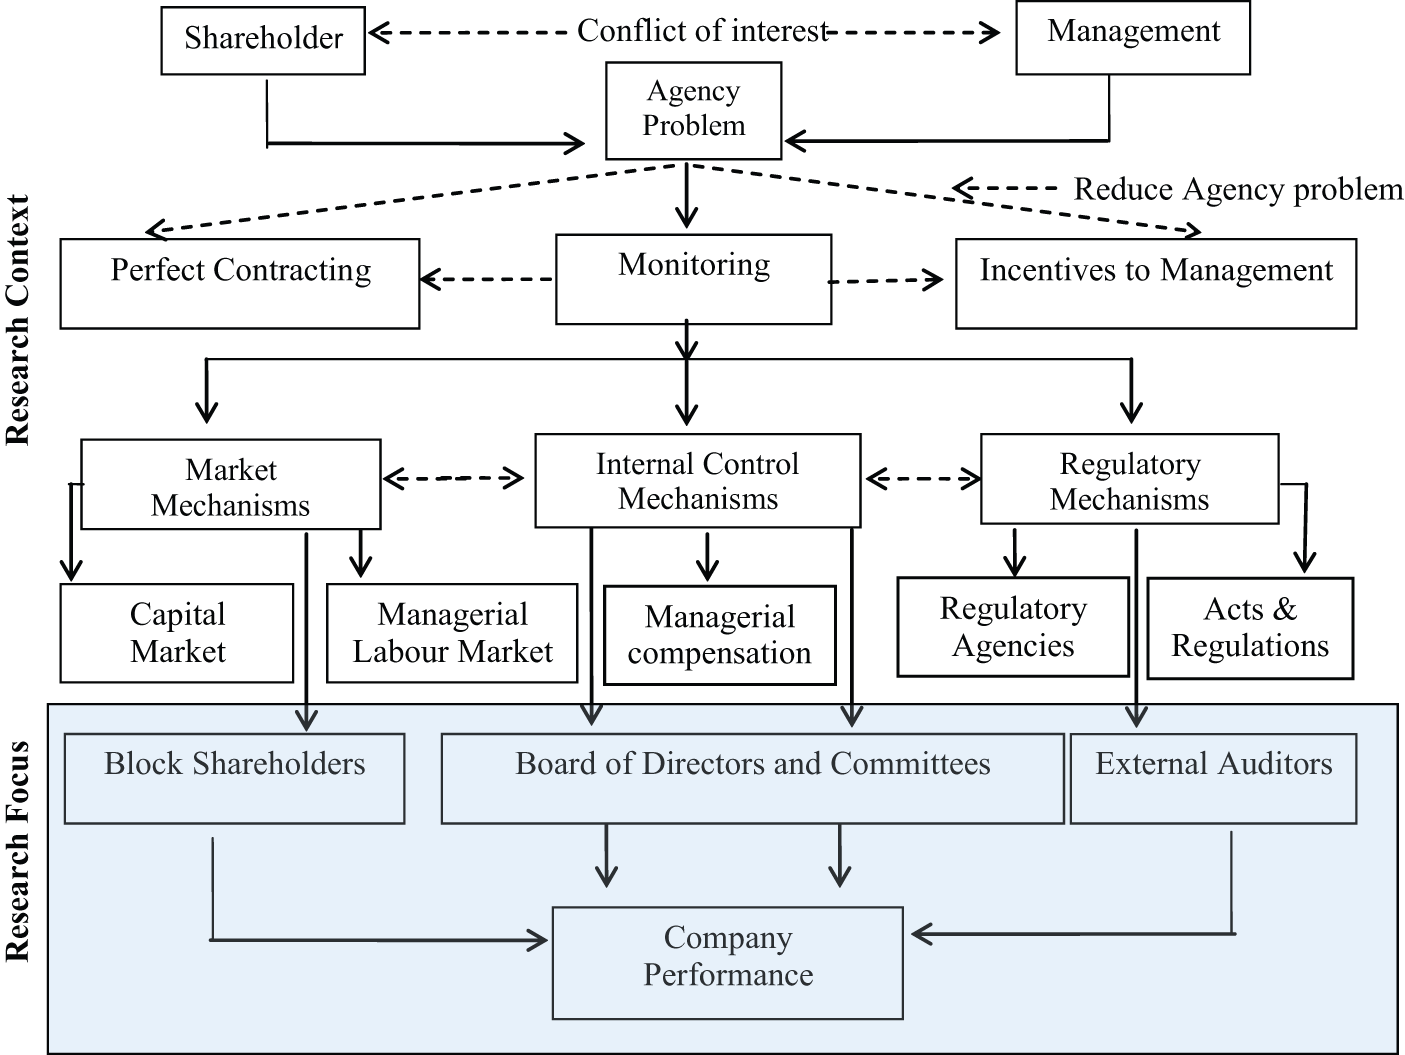
Conceptual model of corporate governance mechanisms and their impact on company performance.
Agency risk will decrease if and when managers can be induced to act in the best interests of shareholders (Jensen and Meckling, 1976). Denis (2001) finds that there are three devices that encourage management to act in this way: contractually bonding management, providing contractual incentives and monitoring management activities. Monitoring, however, is a necessary condition for using the first two devices. Firstly, contractually bonding management requires canvassing the possible eventualities and actions that a manager should take. This is not impossible, but requires a high level of predictability and efficient monitoring. Secondly, incentive contracts require monitoring to evaluate the agent’s performance and provide incentives accordingly (Denis, 2001). Thus, an effective monitoring mechanism is required for all situations to induce management to work in the interests of shareholders (Shleifer and Vishny, 1997).
There are different kinds of monitoring mechanisms (internal and external) available and they can be classified into three broad groupings: market, internal monitoring and regulatory. Market mechanisms may involve block shareholders, the capital market and the managerial labour market. In a single- country study, the capital market and managerial labour market are common to all companies and there is little scope to differentiate among these general market monitoring mechanisms (Agrawal and Knoeber, 1996; Denis and McConnell, 2003). Generally, the reputation of individuals in the labour market is a concern to management. In terms of the managerial labour market, if the performance of the company, in which the managers are serving, is not satisfactory, it will be difficult for managers to sell themselves in the competitive market. As an internal monitoring mechanism, this study concentrates on insider shareholders and boards of directors. Another important internal monitoring mechanism is managerial compensation. However, it is difficult to collect the breakdown of managerial compensation for all the companies. Regarding regulatory mechanisms, Jensen (1993) acknowledges that the legal system is characterised as ‘too blunt an instrument’ to deal with agency problems. Furthermore the legal system is common to all companies in a single-country study. This study therefore focuses its attention on the external auditors as a monitoring instrument operating in the form of a regulatory mechanism.
As shown in Figure 1, the main focus of this paper is on the shareholders, boards of directors, and auditors as monitoring mechanisms and the impact they have on company performance. The following review of relevant studies provides the structure that informed this study.
2.1. Monitoring by shareholders
Monitoring by shareholders is classified into two groups: firstly, monitoring by the insiders (executive and non-executive directors); and secondly, by the major outside shareholders (block shareholders). The role of director ownership as a monitoring mechanism has been the subject of much empirical analysis (Hermalin and Weisbach, 1991; McConnell and Servaes, 1990; Morck et al., 1988). When board members have considerable holdings in a company’s shares, their decisions have an impact on their personal wealth. The degree of ownership concentration in a company determines the distribution of power between its managers and shareholders (Welch, 2003). When ownership is dispersed, shareholders’ control tends to be weak; when ownership is concentrated, major shareholders play an important role in monitoring and reducing the scope for managerial opportunism (Shleifer and Vishny, 1986).
2.2. Monitoring by the board of directors
The theoretical role of the board in monitoring and disciplining management is firmly grounded in the agency framework developed by Fama and Jensen (1983). Empirical examination of board characteristics and company performance focuses on the following criteria.
2.2.1. Board size
Researchers have emphasised the influence of board size on company performance (Jensen, 1993). Larger boards are less effective monitors due to potential free riding, communication breakdowns and inefficiencies (Boo and Sharma, 2008; Bushman et al., 2004). Although the direction of influence is unclear (Kent and Stewart, 2008), most studies find a positive relationship between size of the board and both company performance (Chiang, 2005; Haniffa and Hudaib, 2006) and board monitoring (Anderson et al., 2004; Williams et al., 2005). Kiel and Nicholson (2003) suggest that there is an inverted U relationship between board size and company performance in which adding directors can bring to the board a high level and mix of optimal skills and experience. Beyond that point the difficult dynamics of a large board prevail over the skills and expertise that additional directors might bring.
2.2.2. Independent directors
Boards of directors’ ability to act as effective monitoring mechanisms rely on their independence from management (Beasley, 1996). Researchers have focused on the proportion of executives to independent directors 1 as an indicator of board independence (Davidson et al., 2005; Koh et al., 2007; Peasnell et al., 2005). Some previous studies have suggested that independent directors are effective monitors because they do not have financial interests in the company or psychological ties to management (Boo and Sharma, 2008). They are in a better position to objectively challenge management (Abbott et al., 2004; Klein, 2002). Bedard and Johnstone (2004) have also argued that higher independent director representation on the board provides more vigilant oversight of the monitoring process.
2.2.3. Separate role of CEO and chairman
Conflict of interest may exist where the roles of CEO and chairman (chair) of the board are held by the same person. When a single individual fulfils both roles, managerial dominance is likely to be enhanced, since there is greater alignment of the board with management rather than shareholders. Where the two roles are combined, the CEO will be able to control the board, reduce the board’s independence from management and make decisions in their own interest (Jensen, 1993). Corporate governance guidelines also assume a concentration of power when the CEO is also the chairperson of the board (ASX CGC, 2007; Cadbury, 1992; Standards Australia International, 2003). However, in Australia, unlike the US, not all executive chairs are the CEO (e.g. Macquarie Bank). In this paper, duality measured as the combined role of chair/CEO captures a subset of the ‘non-independent chair’.
2.2.4. Financial expertise of directors
According to the Blue Ribbon Committee Report (1999), a well-balanced and effective board should have directors with an array of talent, experience and expertise that influence different aspects of the company’s activities; such diverse contributions are often made by different directors. DeZoort and Salterio (2001) and Cohen et al. (2002) conclude that it is important for committee members to have accounting and financial expertise. Similarly, Ramsay (2001) notes that financial literacy is ‘an important component of the general standards of care, skill and diligence required of company directors’ (p. 155). The directors’ financial literacy helps them to understand the implications of basic financial decisions. Financial literacy can be acquired through both formal and self-guided education (ASX CGC, 2007; Cohen et al., 2002; DeZoort and Salterio, 2001; Livingston, 2002). The general implication is that financial literacy assists directors in monitoring management.
2.2.5. Board diligence
The number of board meetings per year influences the monitoring ability of the board. Too many or too few meetings can be a threat to effective board monitoring. Too few meetings may indicate the directors are not paying proper attention to the company; again, too many may indicate that there is some difficulty in the firm (Kang et al., 2007; Vafeas, 1999). Boards that meet frequently are more likely to perform their duties diligently and effectively, thereby enhancing their level of oversight (Yatim et al., 2006). Boards of directors need to be active in ensuring high-quality transparent reporting in annual reports (Kent and Stewart, 2008).
2.2.6. Committees of the board
Board committees improve the efficiency of board monitoring by effecting closer scrutiny of management activities and decision-making. This is particularly true when the board size is large (Menon and Williams, 1994). ASX CGC (2007) recommends establishing three different committees of the board: audit, nomination and remuneration committee.
Audit committee
A board audit committee focuses on issues relevant to the integrity of the company’s financial reporting (ASX CGC, 2007; Chen and Zhou, 2007; Davidson et al., 2005). Audit committees have received considerable attention following both more distant and more recent corporate scandals (Sarens et al., 2009). Prior research has found that an audit committee meeting frequently can reduce the incidence of financial reporting problems (Farber, 2005; Hughes, 1999). Similar to the full board, the effectiveness of audit committee monitoring depends on: (i) the number of meetings (Farber, 2005); (ii) the independence of the board (ASX CGC, 2007); and (iii) the financial literacy of the directors (DeZoort and Salterio, 2001; Karamanou and Vafeas, 2005). Although the ASX CGC recommends that all listed companies should have an audit committee, listing rules mandate that only those companies in the Standard & Poor’s (S & P) All Ordinaries Index (the top-500 companies by market capitalisation) must have an audit committee.
Remuneration committee
A board remuneration committee is an efficient mechanism for focusing the company on appropriate remuneration policies for senior executives. The monitoring ability of the remuneration committee is marked by: (i) the number of meetings; and (ii) the proportion of independent directors on the committee (Bosch, 1995).
Nomination committee
The monitoring ability of the nomination committee depends on their independence and the frequency of meetings (Leblanc, 2004). The monitoring ability of the nomination committee can be captured by: (i) the number of meetings; and (ii) the proportion of independent directors on the committee.
2.3. Monitoring by external auditors
The auditor’s role includes suggesting improvements in internal controls (ASA 265) and ongoing concern issues (see ASA 570, 705, 706 in CPA Australia Handbook, 2012), but nothing directly related to company performance. Publicly traded companies in Australia are required to have audits, as stipulated in the Corporations Act 2001. However, the quality of audits and subsequent ability to reduce agency costs varies significantly (DeAngelo, 1981). DeAngelo (1981) defines audit quality as the joint probability that an auditor will: (i) detect a material misstatement in the financial report if one exists (auditor competence); and (ii) report the misstatement if it is detected (auditor independence). Lack of auditor independence will reduce audit quality through a reluctance of the auditor to report any misstatements detected. Therefore, with respect to auditor monitoring, the general finding is that high levels of competence and independence are necessary for a high-quality audit.
Empirical studies by Kim et al. (2003), Krishnan (2003), DeAngelo (1981), Dye (1993) and Craswell et al. (1995) provide strong support for the view that large audit firms provide higher quality audits compared to small firms. Kim et al. (2003) and Krishnan (2003) argue that large audit firms have stronger incentives to protect their reputations, because they lose clients if they produce low-quality audits. Researchers, policy makers and practitioners have debated the provision by audit firms of audit and non-audit services, because this dual provision can have conflicting impacts on the quality of an audit.
2.4. Performance measures
This research uses both accounting and accounting-market (hybrid) performance measures to examine the effect of monitoring mechanisms on company performance. It is expected that the different monitoring mechanisms will influence management to work for the company’s best interests and this will eventually induce them to act in the interests of the stakeholders. Most performance measurement models, such as return on equity (ROE) and return on assets (ROA), are widely regarded by users as most useful and the ultimate bottom line of business performance. Although accounting information is useful and important in corporate governance studies, all agency costs are not reflected in the accounting measures (Wiwattanakantang, 2001). Bacidore et al. (1997) argued in favour of using hybrid-based performance measurement – that is, the price–earnings ratio (PER), market-to-book value (MBV) and dividend yield (DY) – to measure improved value returned to shareholders.
3. Propositions and methodology
The various indicators or proxy elements associated with the (i) board and its committees, (ii) shareholders, and (iii) independent auditors in the monitoring process and their relationship to company performance are presented as an empirical schema. The research questions tested in this study are as follows:
Do the various monitoring mechanisms associated with the three categories of players have a substitution effect?
Do the various monitoring mechanisms associated with the three categories of players have a complementary effect?
To answer questions (i) and (ii), SEM is used as it can deal with multicollinearity and it reveals potentially complex inter-relationships among monitoring mechanisms. By using SEM it is possible to model important latent variables while taking into account any unreliability of indicators (Wooldridge, 2003). Most of the corporate governance variables are latent, which means they are otherwise difficult to measure. Again, in all multivariate analyses it is assumed that there is no error in the variables. However, from practical and theoretical perspectives it is impossible to perfectly measure a latent concept without considering error. SEM improves the statistical estimate by considering this type of error. SEM examines a series of dependent relationships simultaneously – which is particularly useful when one dependent variable becomes an independent variable in subsequent dependent relationships – this helps to avoid the problem of multicollinearity.
No single statistical test can estimate the goodness-of-fit of the SEM model. Researchers have developed a number of goodness-of-fit measures to assess the results. It is necessary to have sufficient data to facilitate the observation of important differences or relationships. SEM applications typically use 200–500 cases and 10–18 observed variables (Hair et al., 2009). This research uses approximately 500 companies for each period: 2004–2006 and 17 observed variables (monitoring mechanisms).
Block shareholders, because of their greater bargaining power over the firm, are more likely to influence management. Block shareholders exercise a ‘voice’ through direct negotiation with management and proxy contests (Chowdhury, 2004). In so doing, block shareholders determine the distribution of power between managers and shareholders. Ownership concentration can function as a monitor to reduce the scope of managerial opportunism (Shleifer and Vishny, 1986). Monitoring by block shareholder is measured by: (1) the percentage of shares held by the top shareholder; (2) the percentage of shares held by the next top-19 shareholders; and (3) the percentage of shares held by the executive and non-executive directors.
Board size is measured by number of directors on the board, and board diligence is measured by number of board meetings per year. Board independence is measured by proportion of independent directors to total directors. Financial expertise signifies past employment experience in finance or accounting, requisite professional certification in accounting or any other comparable experience or background that results in the individual’s financial sophistication, including being or having been a CEO or other senior officer with financial oversight responsibilities (according to Blue Ribbon Committee, 1999). To represent the degree of separation between the roles of board chair and corporate CEO, the analysis employed a dummy variable, taking a value of 0 if the roles of the chair and CEO are exercised by the same individual and 1 if the role is exercised by different individuals.
Indicators of audit committee effectiveness are independence and expertise of committee members. Independence is the proportion of committee members who are described as independent. Similar to the board, the financial expertise of audit committee members is measured as the proportion of members with financial literacy or having been a CEO/chief financial officer (CFO) or other senior officer with financial oversight responsibilities. Since another recommendation is to have regular meetings, the number of audit committee meetings is also measured. Effectiveness and independence of the nomination and remuneration committee are measured by the number of directors assigned to those committees and independence is determined by the proportion of committee members who are described as independent.
Auditors do not directly monitor management; however, they provide an assurance service that improves the quality of financial information. External audits are used to increase the reliability of financial statements (Chow, 1982). The extent to which financial statements can reduce agency costs depends on the quality of the audit; thus, the quality of audit acts as a control mechanism. To characterise the audit quality, this study classifies audit firms into large and small. Large firms comprise the Big Four. Here, a value of 1 is assigned when the company uses a large audit firm and 0 otherwise. Another factor that can influence the monitoring of the auditor is the joint provision of audit and non-audit services. This research therefore quantifies the amount of non-audit fees as a ratio of total audit fees to determine the level of independence.
4. Data and company characteristics
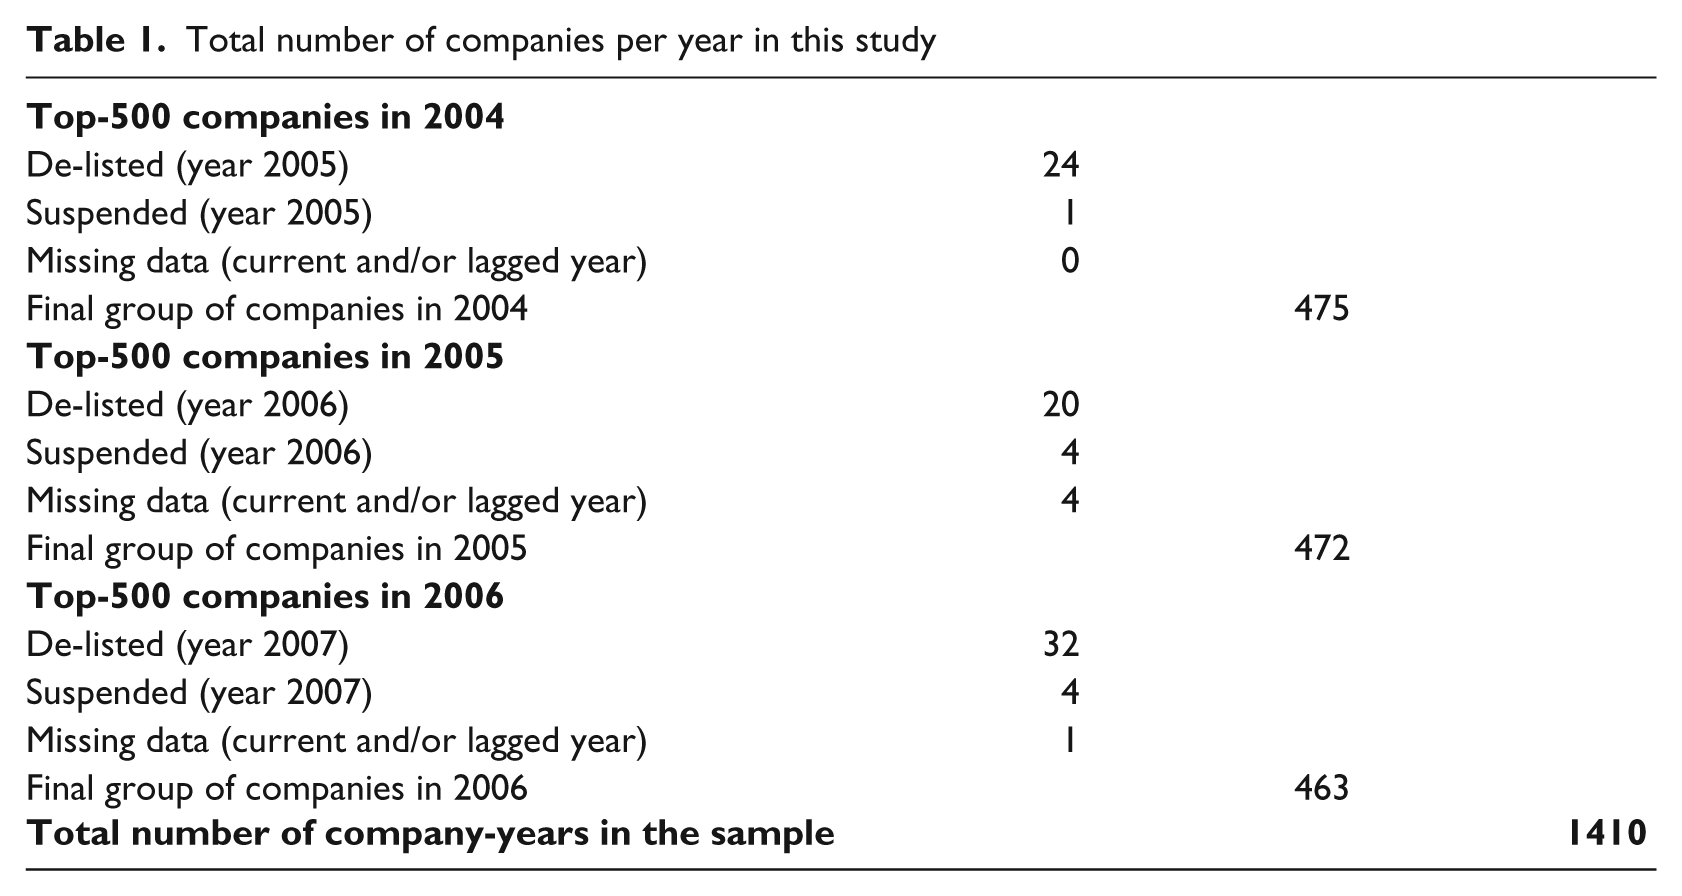
The initial sample consists of 1500 company-year observations from the top-500 ASX-listed companies from 2004 to 2006. This study chooses 2004–2006 because this was the most critical period following major corporate collapses and subsequent implementation of the ASX good corporate governance guidelines in Australia, but before the GFC. This made it possible to investigate the nature of mandatory corporate monitoring responses to the rash of corporate collapses. Top-500 companies were chosen as they covered most of the ASX CGC requirements and were more likely to have sound monitoring processes. Companies are ranked according to market capitalisation for each year. To ensure consistency in the database, companies with missing information are excluded. Ninety companies from the total 1500 company-year sample were excluded due to insufficient information. The remaining companies consist of 475 in 2004, 472 in 2005 and 463 in 2006 (Table 1).
Total number of companies per year in this study
To test robustness, this research also collected data from the top-200 companies for the 2009–2010 financial year following the GFC. This research excludes the GFC period (2008–2009), as shareholders, board of directors and auditors were well aware of the GFC and would be very conservative in their monitoring requirements. Therefore, the results during the crisis period might not be typical or representative.
The archival sources used to collect data were the Aspect Financial Analysis database; Connect 4; and Aspect Huntley Financial Analysis. The information provided in Aspect and Connect 4 were used to manually collect data on corporate monitoring variables, that is, board of directors, committees, external auditors and shareholder information. Aspect Huntley, another Australian comprehensive source of data for listed companies, is used to collect data on company performance. Information is cross-checked with the annual reports obtained from Aspect and Connect 4. The ASX website was used to rank the companies according to market capitalisation, obtain industry classifications and establish whether the company is listed, de-listed or has changed its name.
Performance data for these companies were collected for the years 2004–2008 (and for 2010 for a robustness test), so that one- and two-year lagged analysis is possible. We have calculated industry average performance data, which help to avoid bias in the performance data. A probable concern when dealing with current-year performance is that it is difficult to understand the cause–effect relationship – which leads to the problem of endogeneity. This problem can be avoided when SEM is employed (Renders and Gaeremynck, 2006).
With reference to industry classification (based on four-digit Global Industry Classification Standards (GICS) codes), most company-years in the sample operate in the financial sector (21.63%), followed by the materials sector (18.93%). The remaining 60% are involved in energy, industrials, consumer discretionary, consumer staples, healthcare, information technology, telecommunication and utilities.
As shown in Table 2, on average the top-20 shareholders held 63% of shares. In our sample, in 1059 company-years (75%) the top-20 shareholders held more than 50% of the issued shares and in 431 company-years 31% held more than 75% of the issued shares. On average, the directors of the board held 16% of issued shares.
Descriptive statistics regarding monitoring measures (sample size: 1410 company-years)
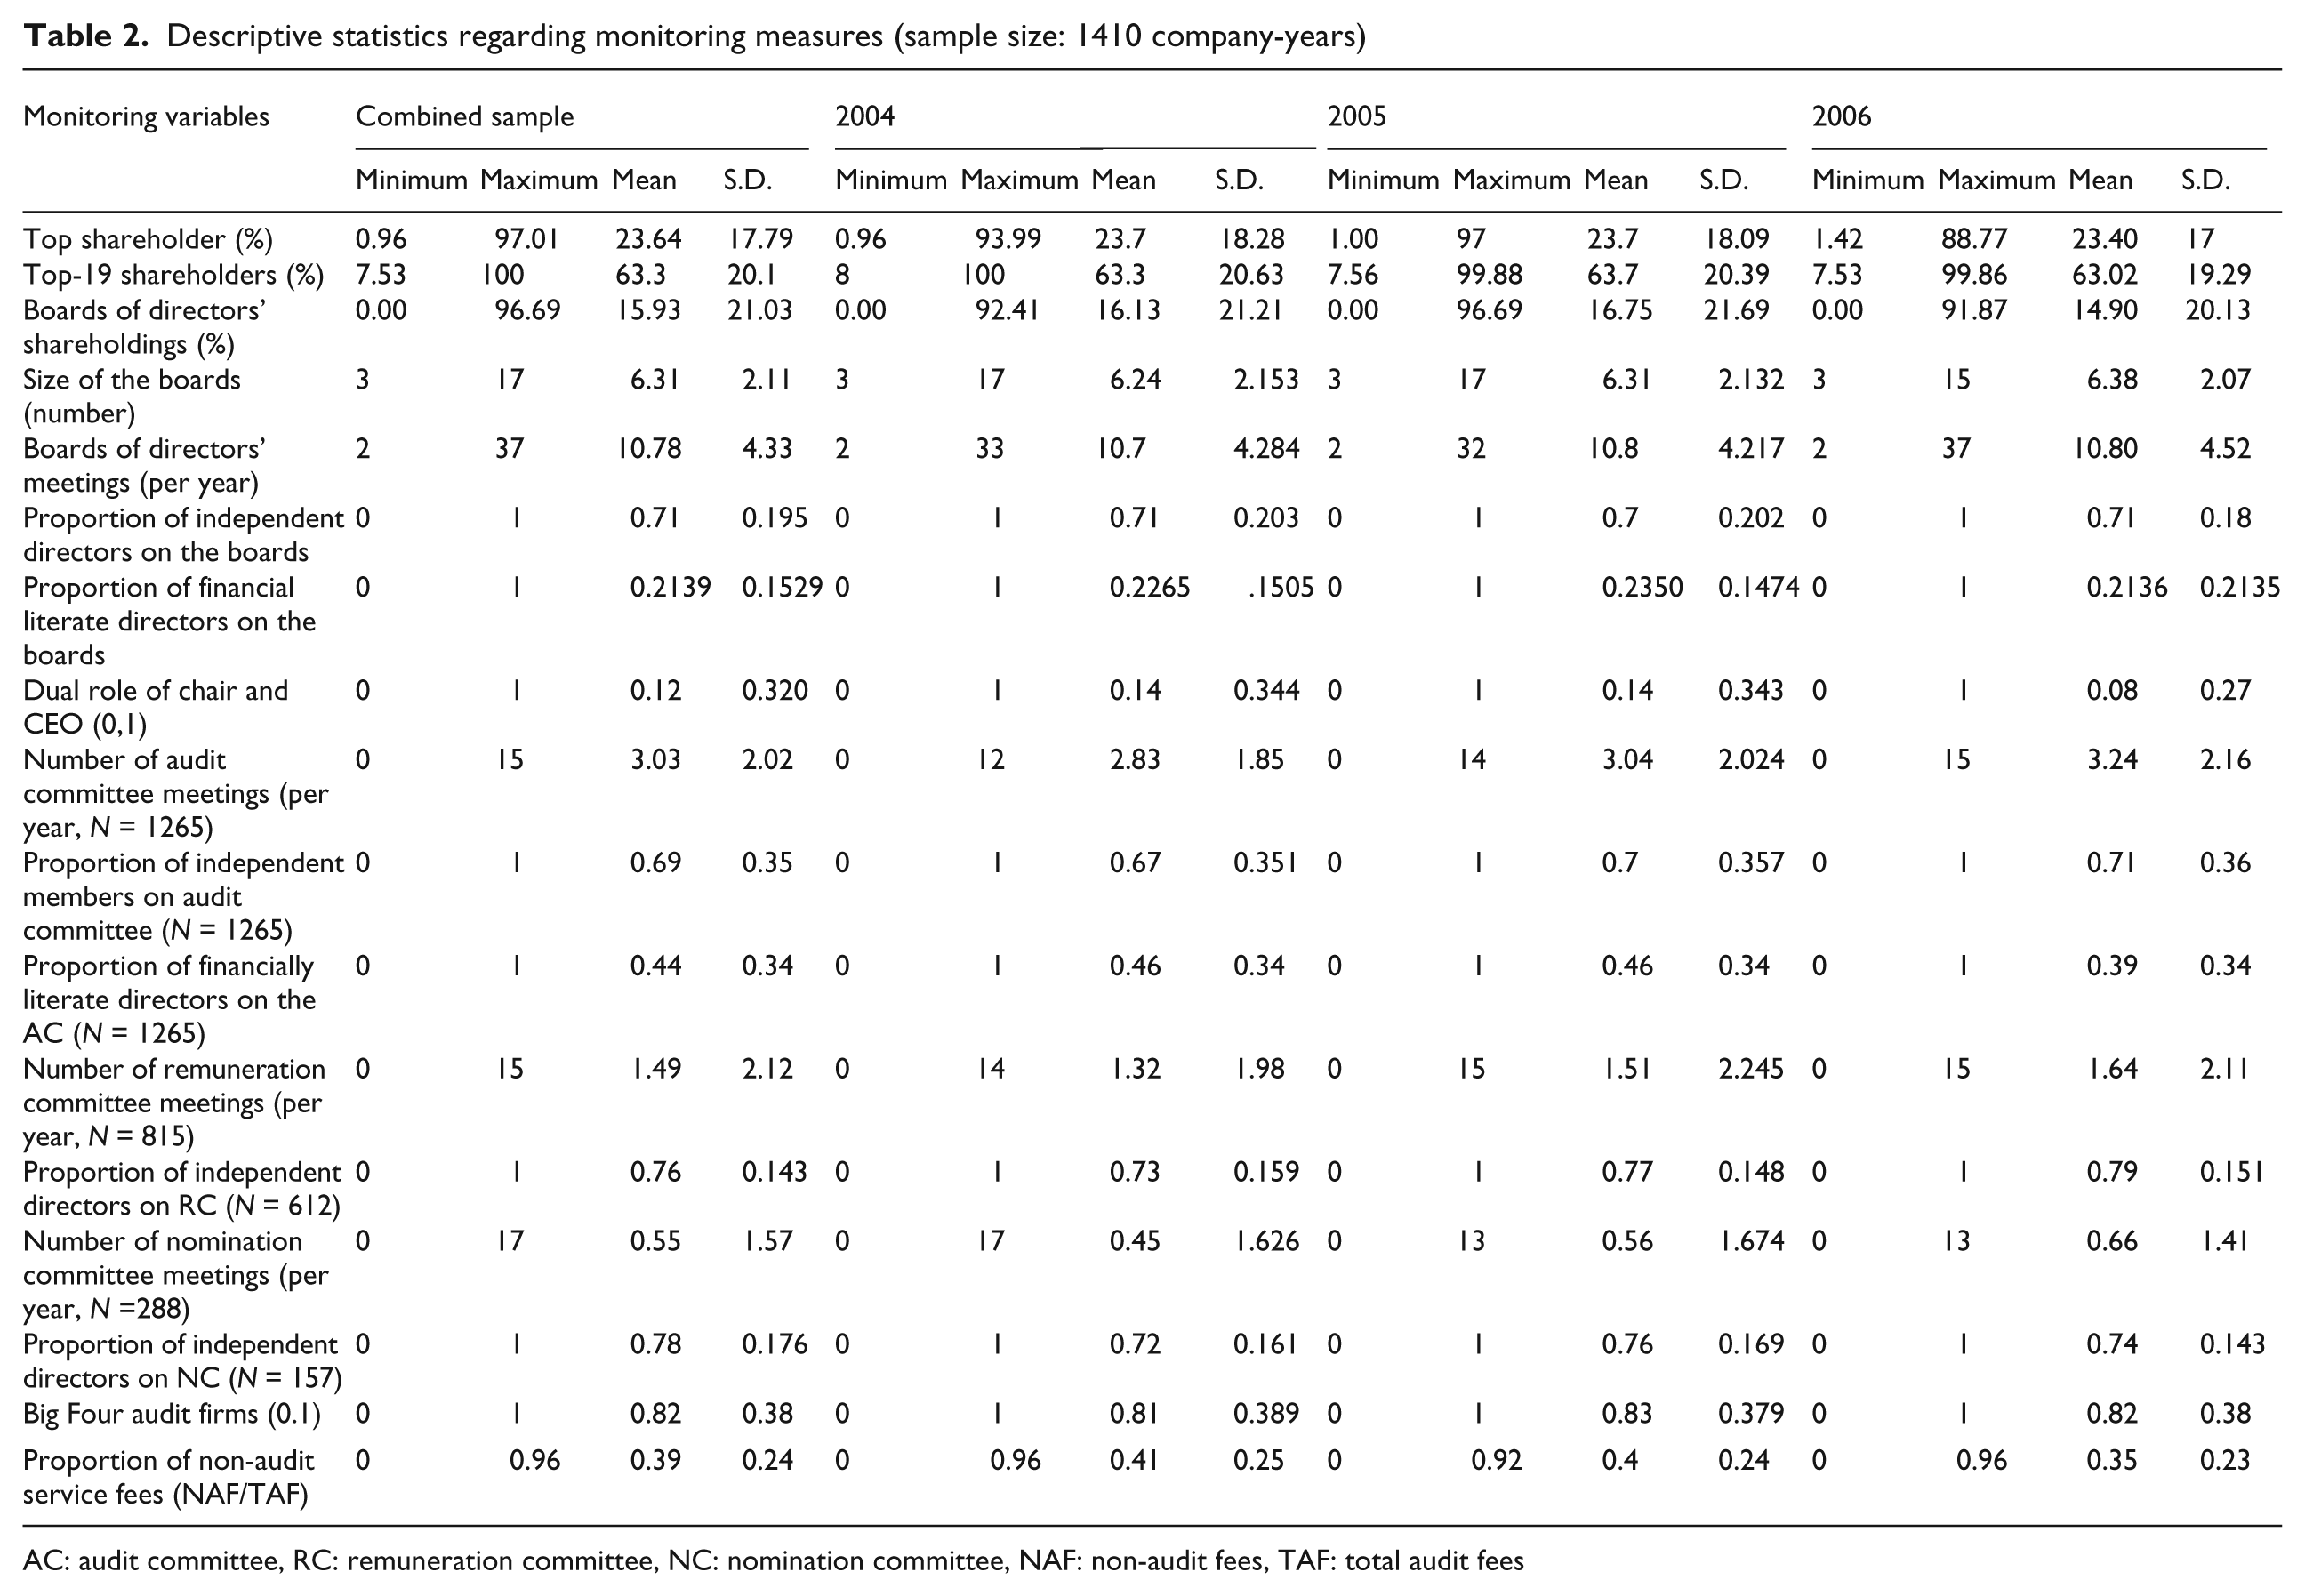
AC: audit committee, RC: remuneration committee, NC: nomination committee, NAF: non-audit fees, TAF: total audit fees
In the study, the average board size was 6 directors (maximum = 17, minimum = 3). Most (n = 1246, 88%) had a board size of 4–9 directors. The average number of board meetings was 10 per annum (maximum = 37 2 , minimum = 2). More than 82% of company-years (1,158) had a board with a majority of independent members. Eighty percent (1143) had 1–4 independent directors on the board. In 56 (4%) company-years, there were no financially literate members on the board and in 229 (16%), all directors were financially literate. In the sample, there were 168 (12%) where the roles of chair and CEO were occupied by one person. One hundred and fifty-three (7%) did not convene any audit committee meetings, and 66% (929) held 2–4 audit committee meetings per annum. In the sample, 79% (1117 company-years) held between 1 and 3 meetings per annum. Only 288 (20%) company-years had a nomination committee. Of these, 239 companies convened 1–4 nomination committee meetings per annum. Only in six committees were there no independent directors.
From the sample, 1158 company-years (82%) were audited by a Big Four auditor. It is expected that the auditing by a Big Four auditor will improve the audit quality. The average non-audit fees earned by the external auditor are $AU8369. In the sample of companies studied, 36% (508) earned higher non-audit fees compared to audit fees.
The Spearman Correlation Matrix (Table 3) shows that there are few pairs of independent variables with a high correlation (i.e. more than 0.6). For example, there is a correlation of 0.6886 between the top-19 shareholders and top one shareholder; correlation of 0.6164 between the proportion of financially literate directors on the audit committee and the proportion of board financially literate directors; and correlation of 0.6218 between the proportion of independent directors on the nomination committee and nomination committee meetings. However, as this research uses SEM, it can competently manage the multicollinearity issue.
Correlation matrix (sample size: 1410 company-years)
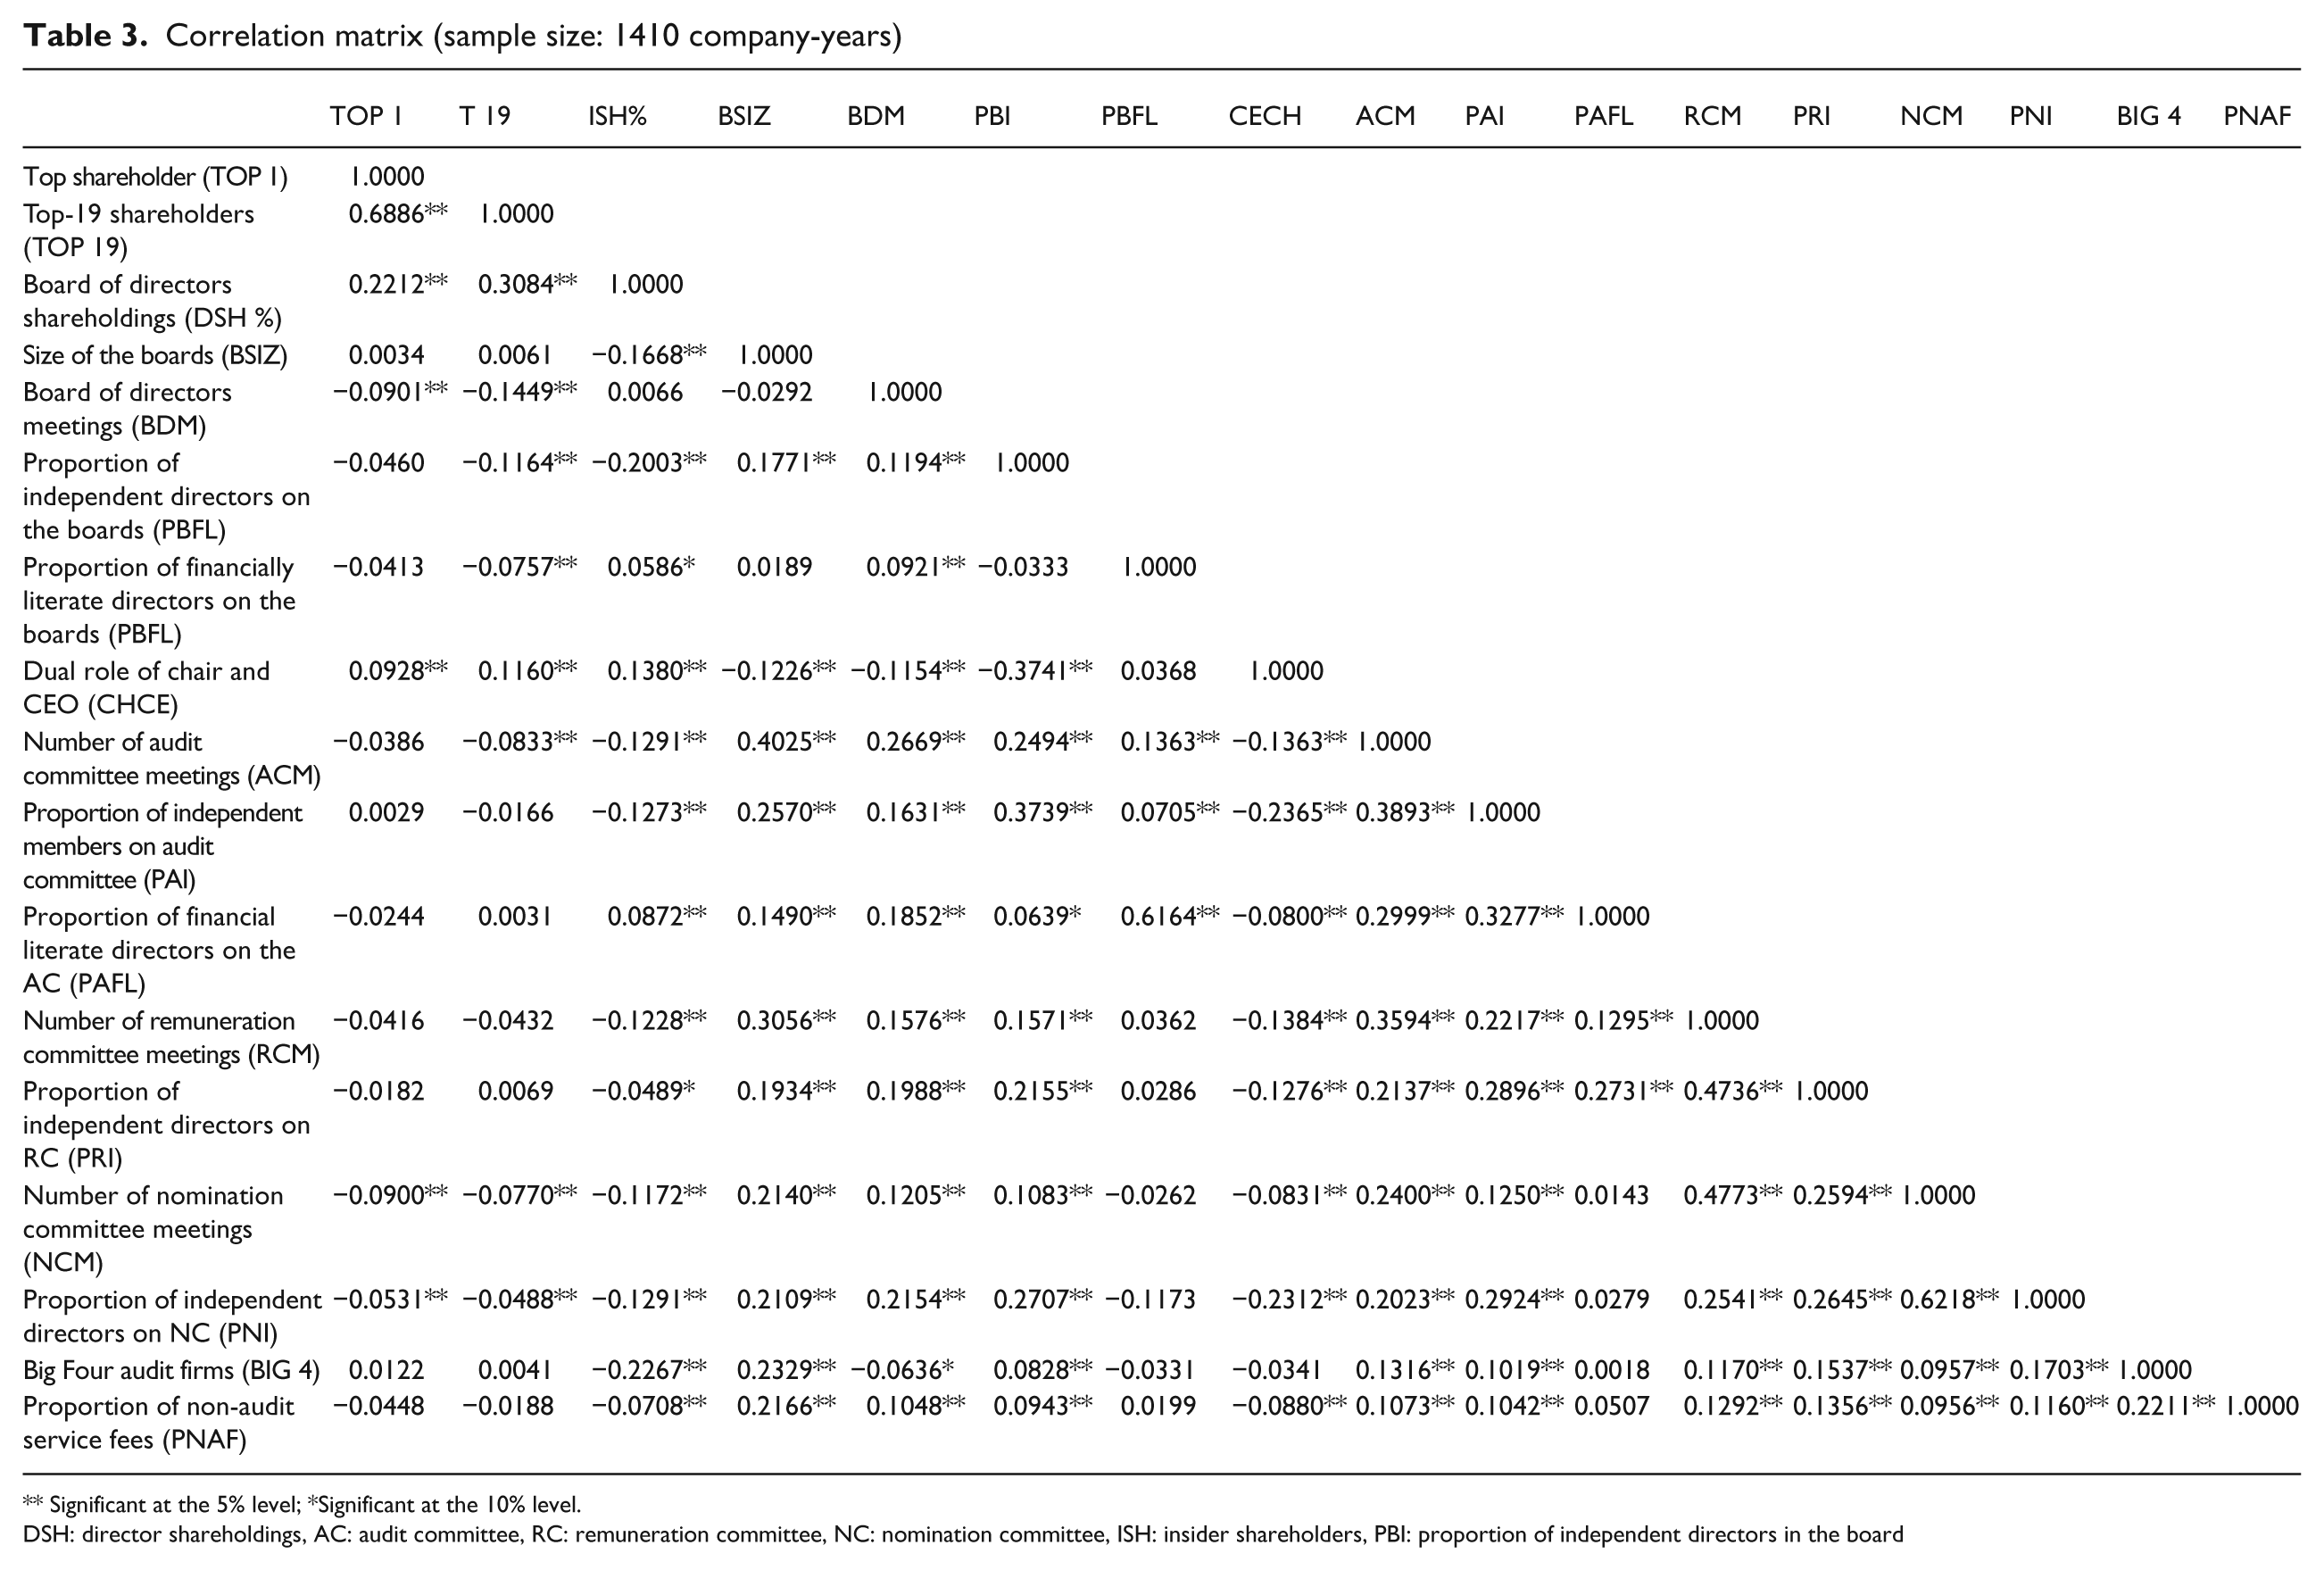
Significant at the 5% level; *Significant at the 10% level.
DSH: director shareholdings, AC: audit committee, RC: remuneration committee, NC: nomination committee, ISH: insider shareholders, PBI: proportion of independent directors in the board
5. Analysis of the results
Initially models were run to test the effect of monitoring variables on the performance of the full dataset (1410 company-years). The models were run for each year separately, which assisted in comparing the changes, if any. As a test of robustness, the model was then run to test whether there was any variation in the result when considering one-, two- and three-year lagged performance for these companies throughout the sample period. The same dataset was run using the Ordinary Least Square (OLS) method and the results were compared to SEM. Data for the year 2010 were also collected to observe the effect after the GFC.
5.1. Fit of the structural models
The overall goodness-of-fit for structural equation models depends on many factors. No single value for the fit indices separates good from poor models, and it is not practical to apply a single set of cut-off rules to all measurement models and, for that matter, to all structural equation models of any type (Hair et al., 2009). The application of multiple fit measures enables a consensus across types of measures regarding acceptability of the proposed model to be attained. Various goodness-of-fit measures assess the results from three perspectives: (i) absolute fit measure; (ii) incremental fit measures; and (iii) parsimonious fit measure.
5.1.1. Absolute fit measures
Absolute fit measures are used to understand the degree to which the overall model (structural and measurement models) predicts the observed covariance or correlation matrix. For this reason, this study used two commonly used absolute fit measures: the chi-square statistic (χ2) and root mean square error of approximation (RMSEA). The chi-square (χ2) statistic determines the independence or relatedness of the variables and strength of their relationship with the model. This research finds that χ2 ranges from 234.11 to 297.03 for 2004, 2005 and 2006. These results are consistent for all of the models, which suggest monitoring variables are strongly interrelated. Again, in this study RMSEA ranges from 0.044 to 0.054, results that are consistent with Browne and Cudeck’s (1993) suggestion of the value being around 0.08 or less as an indication of model fit (Table 4).
Model fitness
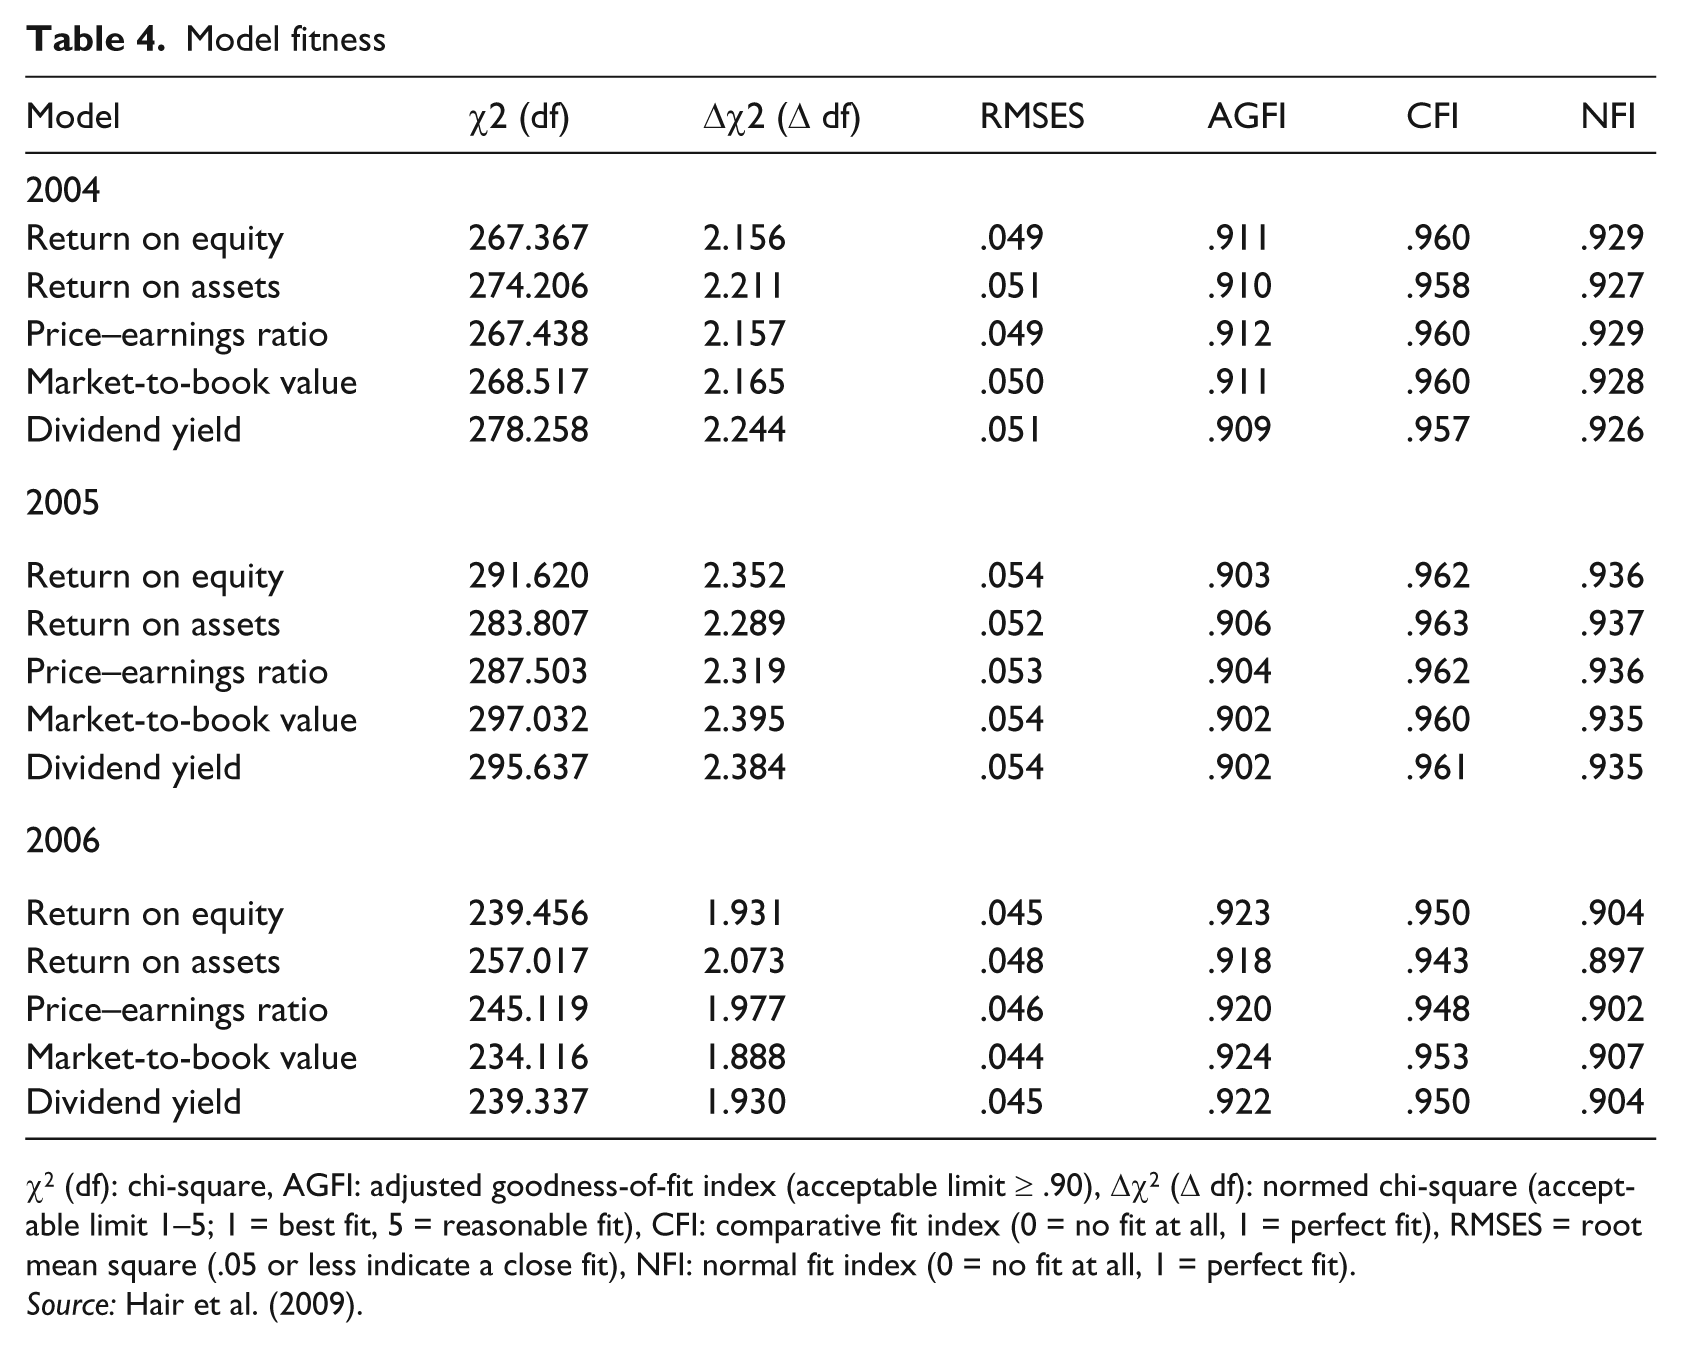
χ2 (df): chi-square, AGFI: adjusted goodness-of-fit index (acceptable limit ≥ .90), Δχ2 (Δ df): normed chi-square (acceptable limit 1–5; 1 = best fit, 5 = reasonable fit), CFI: comparative fit index (0 = no fit at all, 1 = perfect fit), RMSES = root mean square (.05 or less indicate a close fit), NFI: normal fit index (0 = no fit at all, 1 = perfect fit).
5.1.2. Incremental fit measure
Incremental fit assesses how well a specified model fits relative to some alternative baseline model. To measure incremental fit, the following indices are used: adjusted goodness-of-fit index (AGFI), comparative fit index (CFI) and normal fit index (NFI). AGFIs range from 0.902 to 0.963. For all models, a recommended acceptable level is a value greater than or equal to 0.90 (Hu and Bentler, 1999). The CFI has been found to be more appropriate in a model’s development. This research found the CFI value ranges from 0.942 to 0.963. This is consistent with the findings of Hair et al. (2009), who discovered that values fall between 0 and 1, with higher values indicating superior goodness-of-fit. The NFI, which is a relative comparison of the proposed model to the null model, indicates results ranging from 0.0897 to 0.937. Hair et al. (2009) showed that the NFI ranges between 0 and 1 with a cut-off value of 0.90, where 0 indicates no fit and 1 indicates perfect fit. Considering this standard, these results indicate that the models are near to perfect fit.
5.1.3. Parsimonious fit measures
Parsimonious fit provides information about which model is best. Conceptually, parsimonious fit indices are similar to the notion of an adjusted R2 in the sense that they relate to model fitness (Hu and Bentler, 1999). One of the measures of parsimonious fit is normed chi-square (χ2/df). The value of normed chi-square (χ2/df) ranges from 1.888 to 2.395. As suggested by Carmines and Mclver (1981), normed chi-square ranges from 2 to 1 or 3 to 1, indicating an acceptable fit between the hypothetical model and sample data.
5.2. Substitute or complementary effect of monitoring
There are three groups of monitoring variables in the model: shareholders, board of directors and external auditors. For all models, the relationships are significant among shareholders, external auditors and board-monitoring variables for all the identified paths. The research question is whether, in the Australian context, a substitution or complementary effect exists among the monitoring variables. Prior studies point to the existence of such effects, although country-specific institutional factors (such as regulation, labour force market, stakeholders’ expectations) that shape monitoring variables and their effectiveness make the generalisability of findings from these prior studies open to question.
Various monitoring mechanisms have strong links and it is important to consider these linkages between corporate governance variables and how their relationships are structured. It is expected that, in practice, various monitoring mechanisms are set up to operate jointly in order to resolve the shareholder–manager agency problem. For example, if it is accepted that the board of directors, through the audit committee, monitors the role of external auditors, this means the board influences the quality of the auditor function. Similarly, shareholder concentration appears to influence auditors with respect to their impact on performance. When there are concentrated shareholdings, shareholders will keep pressure on auditors by acting as a proper monitor of reported performance.
5.2.1. Shareholder and board of directors monitoring
Of all the accounting and hybrid measurement models, Table 5 shows that there is a significantly negative correlation concerning 2004 (p = .001), 2005 (p = .015) and 2006 (p = .000) models for shareholder monitoring and monitoring by the board of directors. This indicates that shareholder monitoring can substitute for board monitoring. Agency theory emphasises the board’s role in monitoring the activities of management and representing the interests of shareholders. In this respect it can be argued that greater shareholder monitoring is a substitute for weaker board monitoring or vice versa.
Substitution effect between shareholders and board monitoring (sample size 1410 company-years)
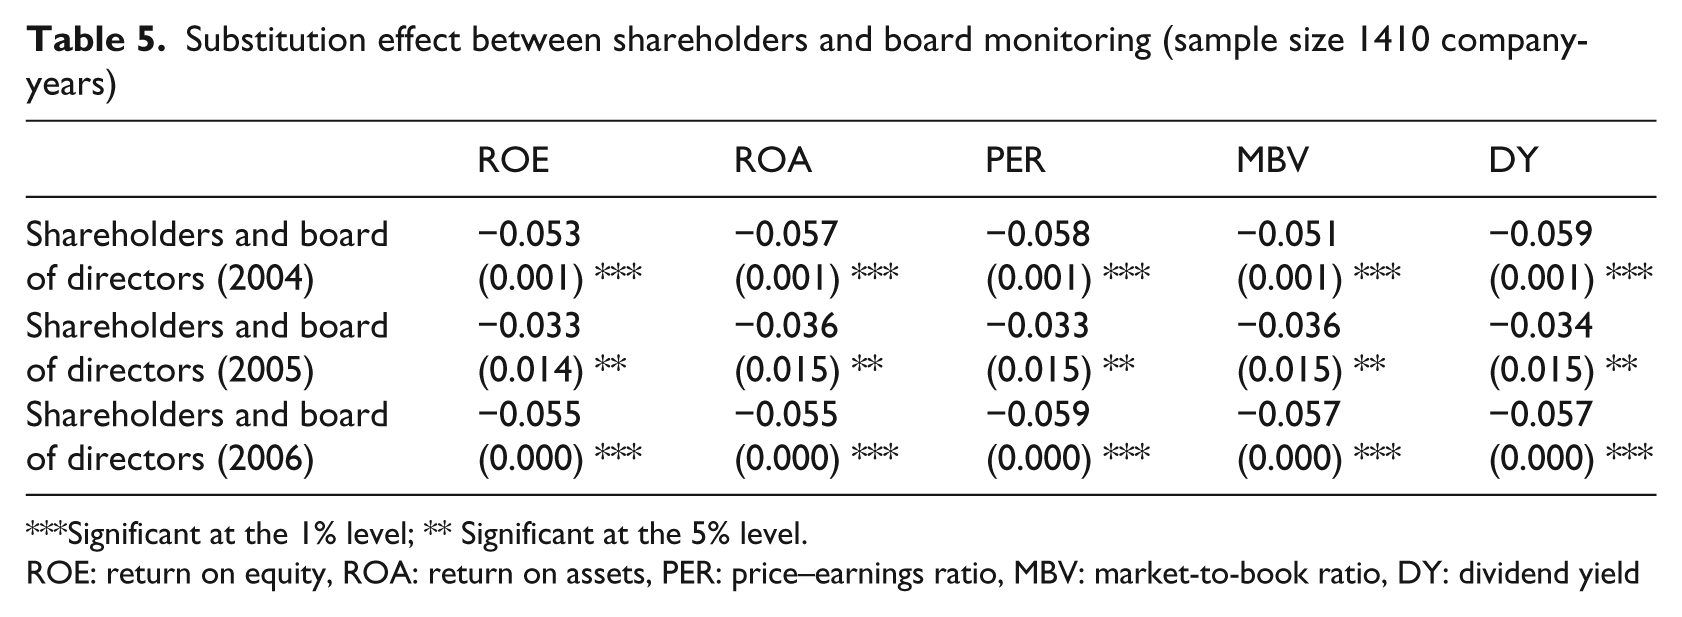
Significant at the 1% level; ** Significant at the 5% level.
ROE: return on equity, ROA: return on assets, PER: price–earnings ratio, MBV: market-to-book ratio, DY: dividend yield
5.2.2. Board of directors and auditor
The next set of findings is a complementary relationship for all models from 2004 to 2006 between board of directors monitoring and monitoring by auditors. This complementary effect is indicated by the significantly positive correlations in Table 6. The auditor’s function is confirmed as a value-adding activity for the board-monitoring process. An important role of the board of directors is to oversee the financial information provided in the annual report. To do this the board engages auditors to assure the quality of the published financial reports prepared by management. Hence, a higher quality auditor complements a more independent and active board.
Complementary effect between board and auditor monitoring (sample size 1410 company-years)
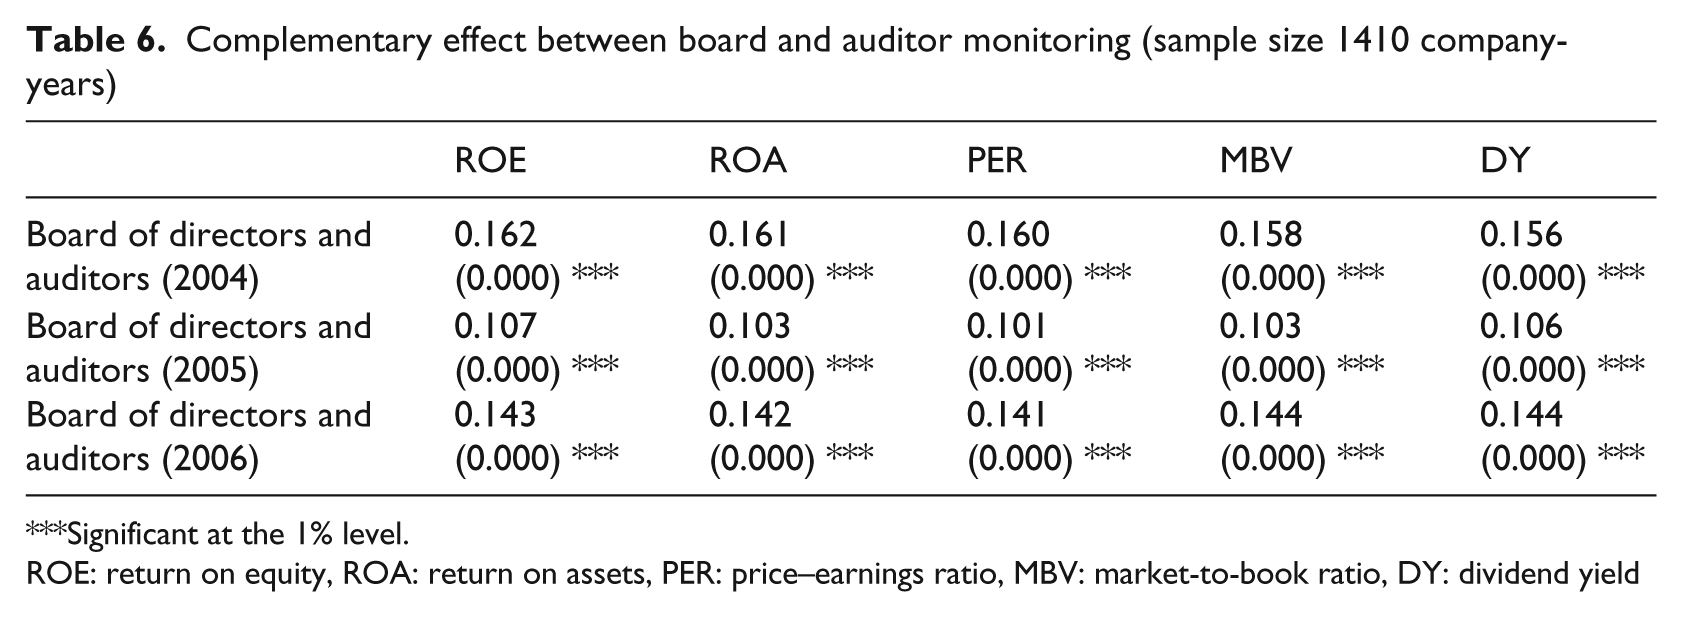
Significant at the 1% level.
ROE: return on equity, ROA: return on assets, PER: price–earnings ratio, MBV: market-to-book ratio, DY: dividend yield
The findings of this study are consistent with that of Beasley and Petroni (2001), who noted that independent boards are more likely to hire a high-quality, industry specialist audit firm for quality monitoring. Until recently, boards of directors tended to select audit firms. This role has increasingly been taken over by an audit committee that is a committee of the board (Gay and Simnett, 2006). Therefore, both board and auditor monitoring is essential in the monitoring process and they cannot substitute for each other.
5.2.3. Shareholders and auditor monitoring
The external auditing function is mandatory for all listed companies. Therefore, it is supplied for the advantage of all shareholders. However, the question to be addressed relates to the quality of auditor monitoring of reported corporate financial information and the extent to which the shareholders depend on the auditor’s role. If the shareholders have sufficient privilege or influence in accessing the monitoring and control functions of the company’s management, they can become less dependent on the auditor’s monitoring. This influence is shown in Table 7, where a significantly inverse relationship between shareholder monitoring and auditor monitoring is demonstrated.
Substitution effect between shareholder and auditor monitoring (sample size 1410 company-years)
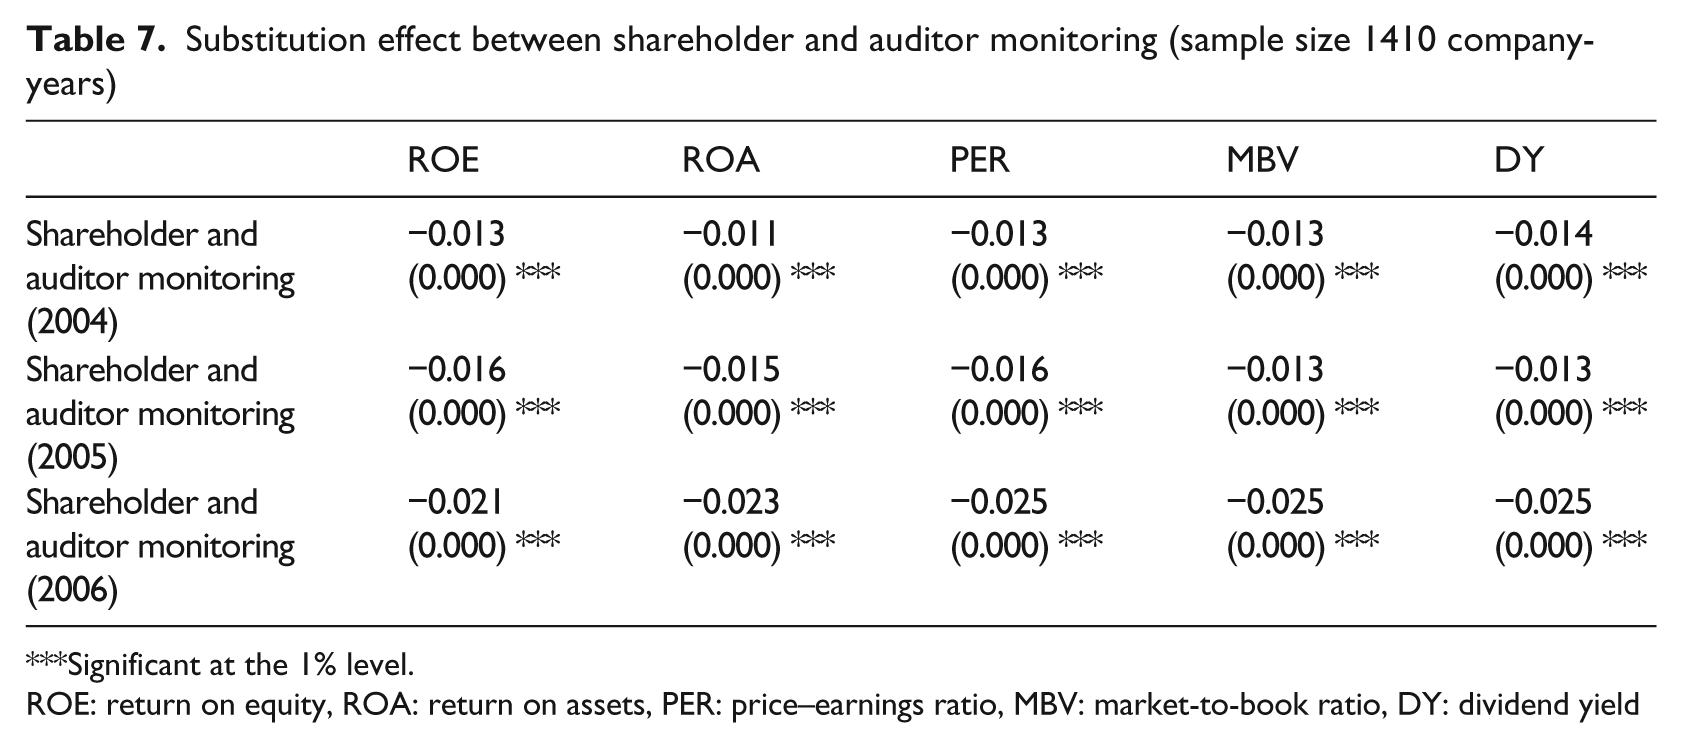
Significant at the 1% level.
ROE: return on equity, ROA: return on assets, PER: price–earnings ratio, MBV: market-to-book ratio, DY: dividend yield
This result indicates that shareholder monitoring can be a substitute for auditor monitoring. Shareholder monitoring is measured by insider shareholder/managers and block shareholder ownership. If shareholdings by managers and block shareholders’ ownership levels are high, they tend to become less dependent on auditor monitoring. Therefore, shareholder monitoring can be a substitute for auditor monitoring.
It is likely the complementary/substitution effects within one company will vary little over time. Yet in Table 5 the years 2004 and 2006 appear very similar, but the coefficients in 2005 appear much lower; this pattern does not appear to be repeated in Tables 6 and 7. This coefficient explains that the substitution effect between shareholders and board monitoring was lower. The explanation for this may lie in the CLERP 9 amendments to the Corporations Act, which took effect on 1 July 2004 (reflected in financial reports published in 2005) and introduced substantial changes to the Australian corporate reporting and disclosure landscape. In 2005, instead of depending on shareholder or board monitoring, the focus shifted towards reporting and disclosure.
5.3. Robustness tests
This research finds a similar substitution and complementary relationship among corporate monitoring mechanisms when examining the relationship between board, shareholders and auditors monitoring on one-, two- and three-year lagged performance. All the models indicate that there is a substitution effect existing between shareholder monitoring with board monitoring and auditor monitoring, and a complementary relationship between board and auditor monitoring. Substitution and complementary relationships among monitoring mechanisms may explain why previous studies failed to find any consistent results when examining the effect of monitoring on company performance.
Given that most readers would be more familiar with regressions models, analysis of OLS was done using the same data set (2004–2006) and finding which statistical model (OLS or SEM) better explains the relationship between corporate governance mechanisms and company performance. The OLS model results in general show a poor fit and the coefficient
Results from Ordinary Least Square models using current-year monitoring (2005) and performance (2005)
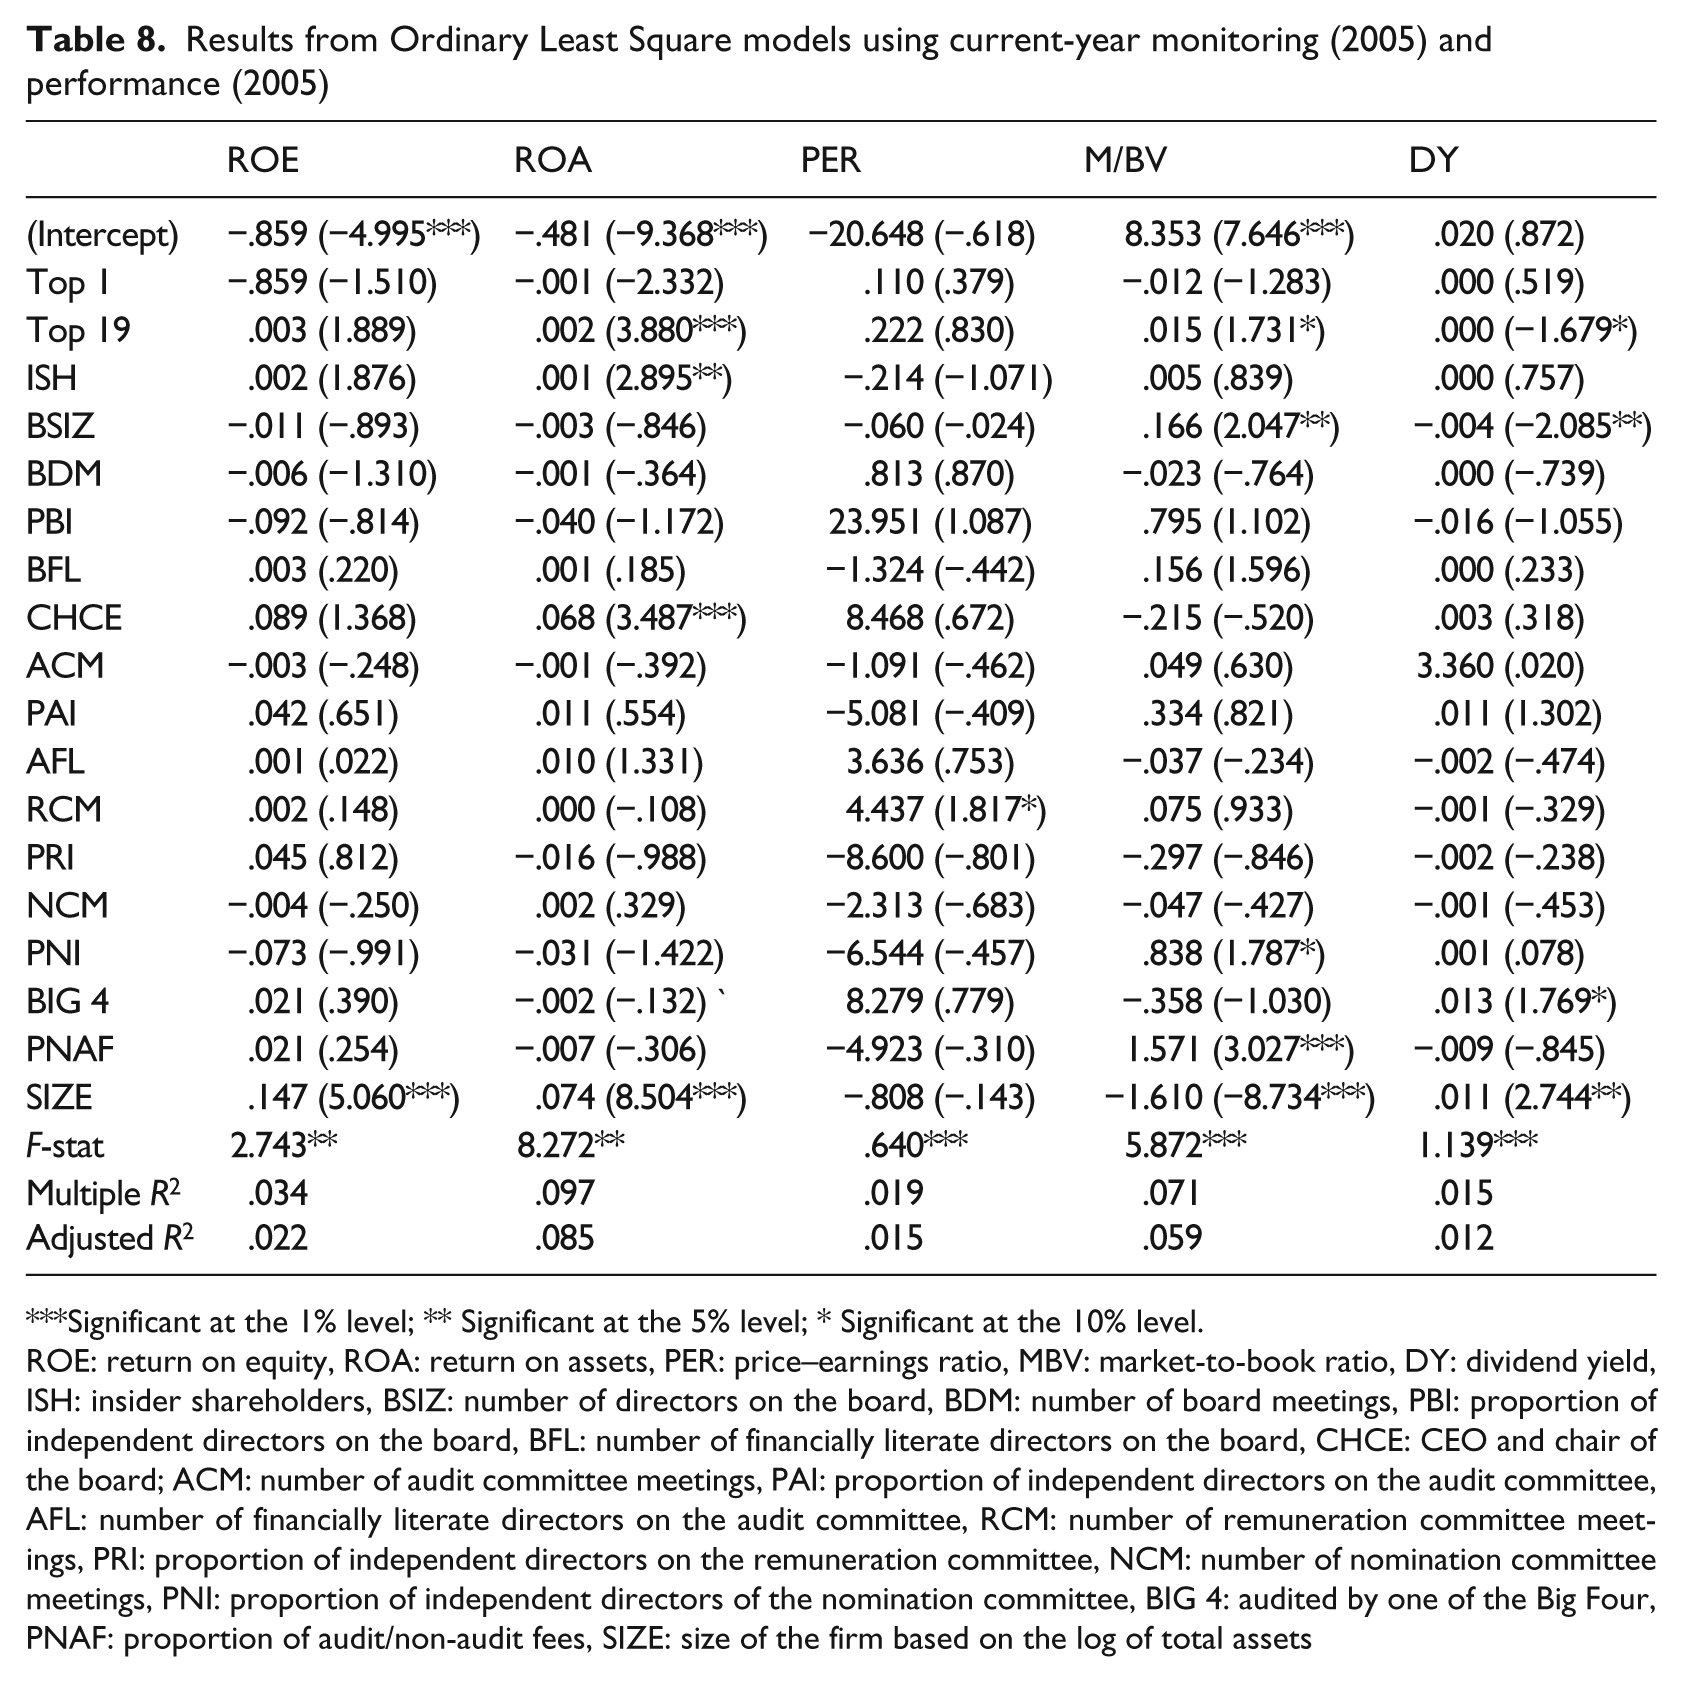
Significant at the 1% level; ** Significant at the 5% level; * Significant at the 10% level.
ROE: return on equity, ROA: return on assets, PER: price–earnings ratio, MBV: market-to-book ratio, DY: dividend yield, ISH: insider shareholders, BSIZ: number of directors on the board, BDM: number of board meetings, PBI: proportion of independent directors on the board, BFL: number of financially literate directors on the board, CHCE: CEO and chair of the board; ACM: number of audit committee meetings, PAI: proportion of independent directors on the audit committee, AFL: number of financially literate directors on the audit committee, RCM: number of remuneration committee meetings, PRI: proportion of independent directors on the remuneration committee, NCM: number of nomination committee meetings, PNI: proportion of independent directors of the nomination committee, BIG 4: audited by one of the Big Four, PNAF: proportion of audit/non-audit fees, SIZE: size of the firm based on the log of total assets
Results from Ordinary Least Square models using current-year monitoring (2005) and lagged-year performance (2006)
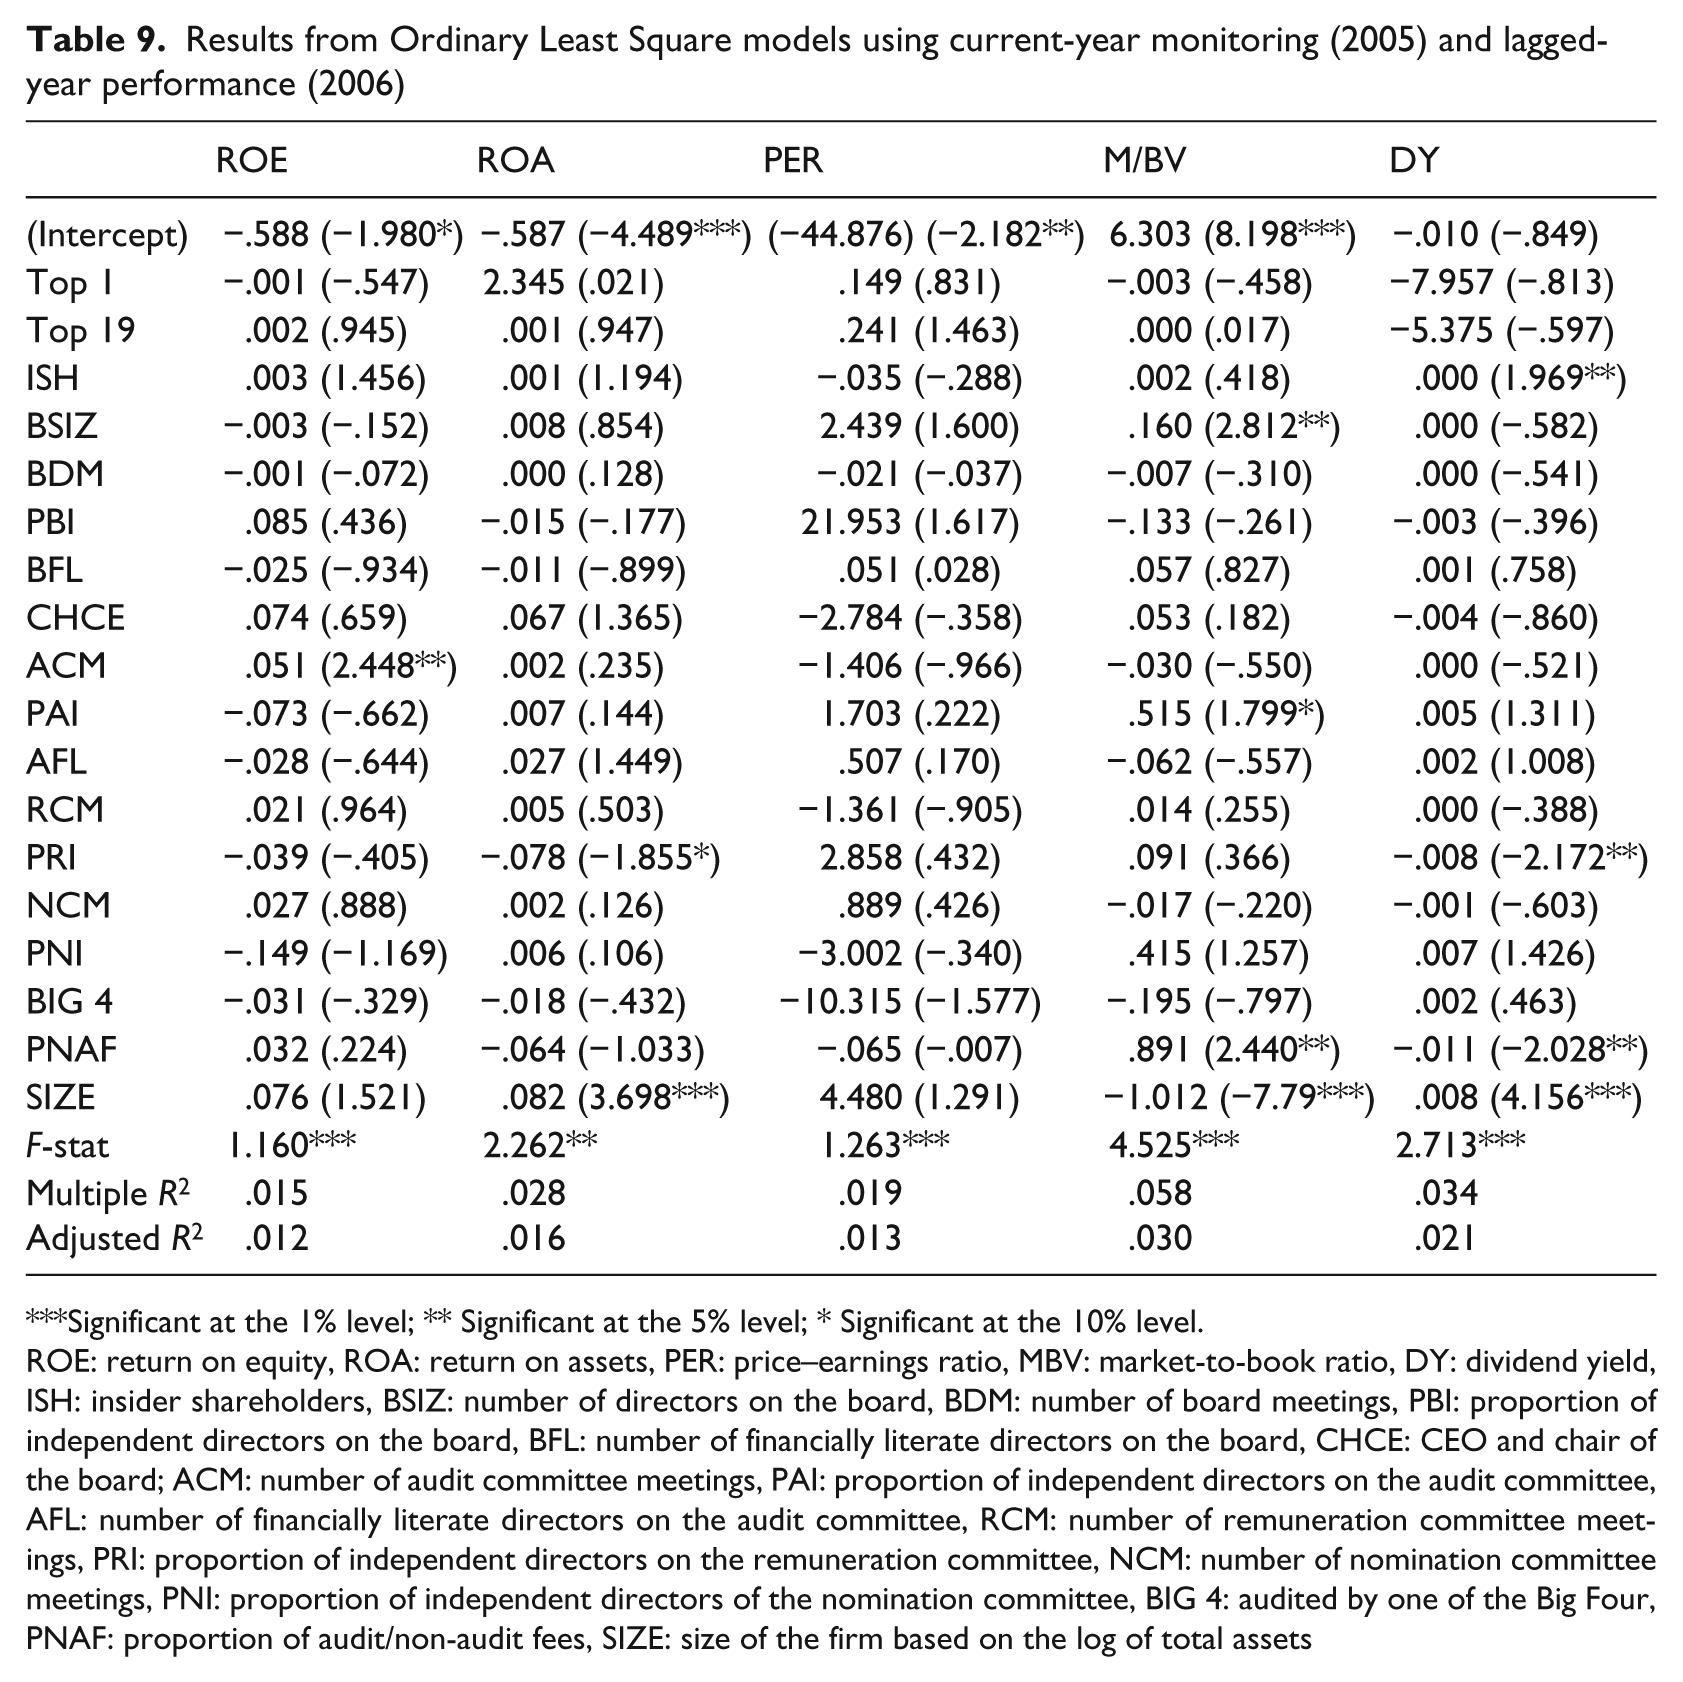
Significant at the 1% level; ** Significant at the 5% level; * Significant at the 10% level.
ROE: return on equity, ROA: return on assets, PER: price–earnings ratio, MBV: market-to-book ratio, DY: dividend yield, ISH: insider shareholders, BSIZ: number of directors on the board, BDM: number of board meetings, PBI: proportion of independent directors on the board, BFL: number of financially literate directors on the board, CHCE: CEO and chair of the board; ACM: number of audit committee meetings, PAI: proportion of independent directors on the audit committee, AFL: number of financially literate directors on the audit committee, RCM: number of remuneration committee meetings, PRI: proportion of independent directors on the remuneration committee, NCM: number of nomination committee meetings, PNI: proportion of independent directors of the nomination committee, BIG 4: audited by one of the Big Four, PNAF: proportion of audit/non-audit fees, SIZE: size of the firm based on the log of total assets
Again, despite the use of multiple performance measures, this paper loads them onto (i) one single performance measure and (ii) two separate (accounting and market) measures. The results in any case are consistent with multiple performance measures.
Again, a robustness test was done using data (top-200 companies) for the 2009–2010 financial year. In Table 10, results of SEM show that there is a substitute and complementary relationship among monitoring mechanisms. However, the effects of the GFC changed the coefficient
Substitution/complementary effect on monitoring mechanisms (sample size 200 company-years)
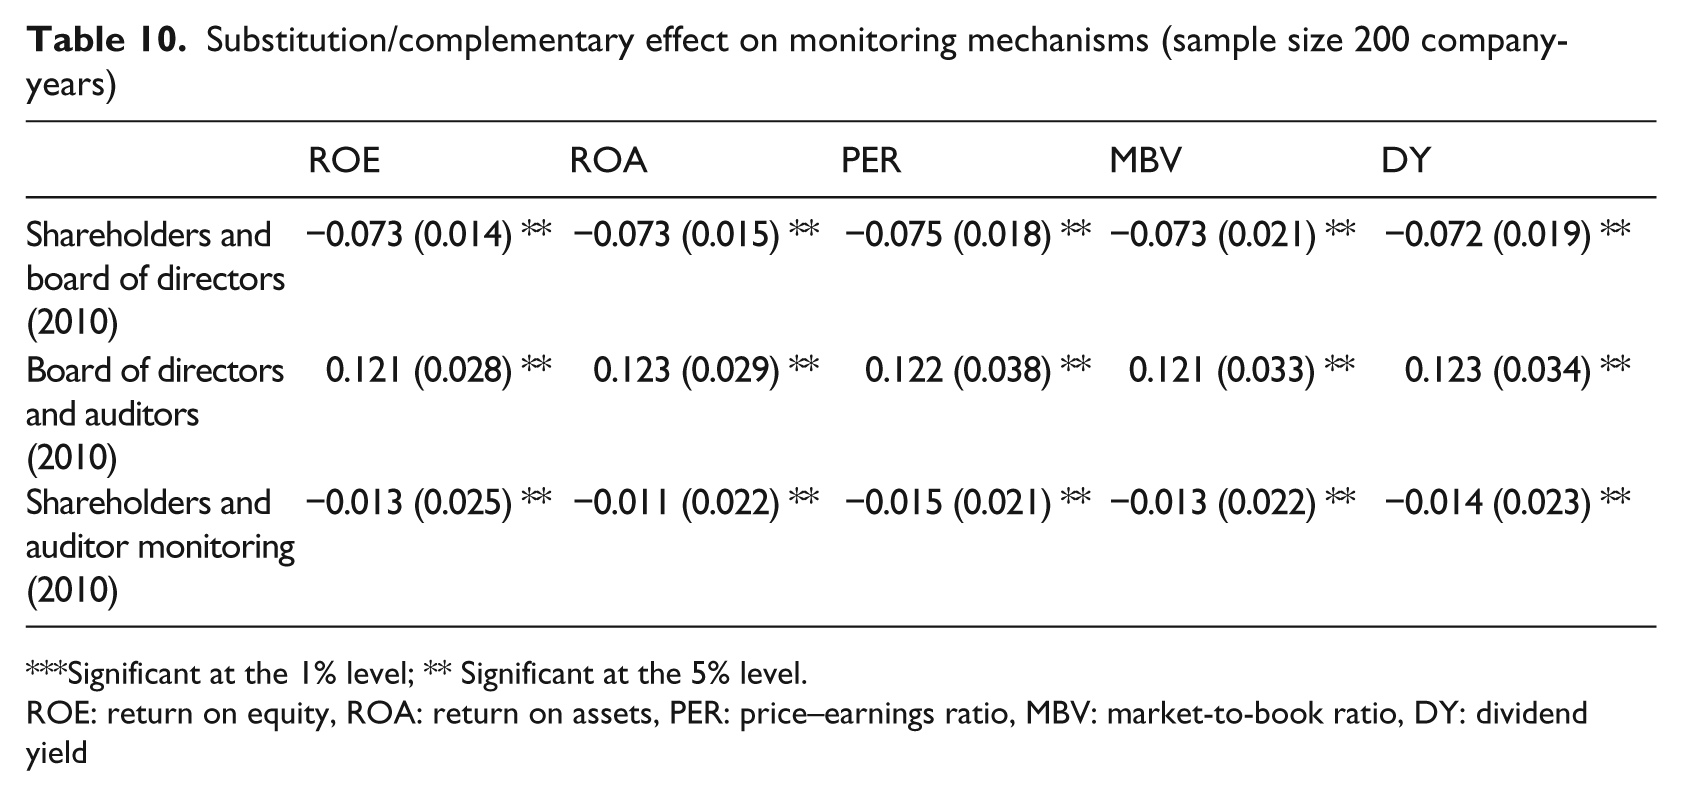
Significant at the 1% level; ** Significant at the 5% level.
ROE: return on equity, ROA: return on assets, PER: price–earnings ratio, MBV: market-to-book ratio, DY: dividend yield
It seems that the governing boards of listed companies seemed unable to prevent the risky and ill-fated decisions that jeopardised their companies, devastated their investors and helped precipitate a financial meltdown that morphed into a global recession. This furthermore had a negative impact on investors’ trust in board monitoring. Similarly, after the GFC, shareholders became more careful about their financial interest and auditors were aware of the GFC and become more conservative in their requirements.
6. Conclusion
This study developed and tested a conceptual model to better understand the complex relationships between various monitoring mechanisms and their impact on company performance. As evident in this paper, SEM is superior in identifying the cause–effect relationships among variables and the existence of reverse causality. Very few studies have employed SEM to examine the inter-relationships among the corporate governance variables. The prospect of changes to monitoring mechanisms in response to performance deficiencies gives rise to simultaneity issues. Effective combinations of corporate governance mechanisms would mean that a company can perform better and satisfy its shareholders’ interests.
Results show a greater consistency across all the models when examining the substitution or complementary effects between the combinations of (a) shareholders and board of directors monitoring; (b) board of directors and auditor monitoring; and (c) shareholder and auditor monitoring. Any individual monitoring mechanism will be complemented to some extent by an alternative one. This finding is consistent with the conclusions of Ward et al. (2009), Boo and Sharma (2008), Fernández and Arrondo (2005), and Coles et al. (2001). Specifically, if governance mechanisms can complement or substitute for each other, then no clear relationship could be established between monitoring mechanisms (when considered independently of each other) and company performance. This fact can explain why previous research has found inconsistent results. By confirming these relationships, this study adds value to the body of literature on monitoring and its influence on company performance.
Both the literature review and empirical findings of this research point to the practical reality of diversity in corporate governance structures, activities and practices across countries and corporations. Differences in business circumstances, competitive conditions in Australia’s capital market compared to those of the USA and UK and differences in Australian corporate board structure compared to Japan and Germany give rise to the importance of developing a modified corporate governance system. It needs to be a system that best suits the operations of corporations in their local, national or regional context.
A number of limitations influenced the results of this study, and these need to be addressed in order to improve the integrity of future research in this area. Firstly, this study did not classify block shareholders into different categories (e.g. institutional shareholders, government ownership, family ownership, corporate ownership). This issue is important in accommodating the varying motivations of block shareholders who want to retain control over the companies in which they have invested. Secondly, two accounting bases and three hybrid measurements were used in this study. This strategy may impede some important performance features that could be obtained through other tools, such as stock market return. Therefore, this study may not accurately report companies’ intrinsic business performance. Accounting measures of performance are subject to accounting policy choice, while hybrid measures of performance are affected by market inefficiencies. Thirdly, this research tests the attendance of directors at company meetings as a form of monitoring. However, it does not consider the degree of their involvement, and whether their business experience may have an impact on the quality of monitoring. Fourthly, the notion that monitoring effectiveness can be observed in performance is largely a long-term view, and short-term effects are likely to be weak. However, changes in mechanisms and conditions preclude testing lag effects for arbitrarily long periods. Fifthly and finally, this research only uses information concerning the top-500 companies. Other listed companies may have very different monitoring mechanisms and these may exhibit different kinds of impacts on performance. Therefore, the results may have varied if the remainder of the listed companies or the bottom-500 listed companies were sampled.
For future research, the model in this study could be expanded to include more alternative monitoring mechanisms that influence a company’s performance. For example, equity-based incentives, such as granting of rights, bonus shares and share options to managers, are widely used to align the interests of the principals (owners) and the agent (employees). Similarly, there are different control mechanisms, such as those derived from the market, where managerial talent has the expertise and integrity to reduce agency-related problems. Performance-based cash bonuses represent another mechanism for encouraging the agent to work so that the company’s performance targets are achieved. Furthermore, the interlocking of directors and auditors can influence monitoring procedures and effectiveness. While this study did not consider the impact this would have on company performance, the way is open for such a theme to be pursued in future research.
Footnotes
Appendix variables for Ordinary Least Square and structural equation modelling
Acknowledgements
The author appreciates helpful comments from the participants at the British Accounting Association Conference, 2009, Dundee, Scotland; and the Accounting and Finance Association of Australia and New Zealand Annual Conference, 2010, Christchurch, New Zealand. The author is indebted to Professor Lee Parker (UniSA), Professor Dennis Taylor (RMIT) and Professor John Dalrymple (Swinburne) for their helpful comments. The author would also like to acknowledge two anonymous reviewers for their helpful comments.
Funding
This research received no specific grant from any funding agency in the public, commercial or not-for-profit sectors.