
Abstract
Effective design and regulation of retirement benefits require accurate understanding of how the elderly decumulate. We analyse the income, assets and decumulation patterns of a longitudinal panel of 10,000 Australian age pensioners. On average, age pensioners preserve financial and residential wealth and leave substantial bequests. There is, however, considerable heterogeneity in decumulation patterns. Younger households generally run down financial wealth, while older households maintain their assets or save. Means-testing accelerates decumulation, with average drawdown rates 3% higher for pensioners subject to the income test relative to full pensioners and 9% higher for those subject to the asset test relative to full pensioners. Loss of a partner is linked to large falls in assets. The theoretical, empirical, and practical implications of these findings are discussed.
1. Introduction
Increasing numbers of retirees in many countries are able to choose how to invest and spend their retirement savings, both before and after retirement. There is, however, an ongoing debate over appropriate policy settings. This debate is particularly urgent in countries like Australia where the second (salary related) pillar of the retirement system applies minimal restrictions on how retirees decumulate. The Australian second pillar, the Superannuation Guarantee, compels employees to build savings to supplement or substitute the public pay-as-you-go funded Age Pension but also allows unrestricted consumption of lump sum withdrawals (Henry, 2009). Almost all Australian retirees either take their accumulated balances as lump sums or make phased withdrawals via ‘account-based pensions’ that impose minimum, but not maximum, rates of withdrawal. This raises the question of how retirees manage their superannuation balances, a matter that regulators have identified as deserving ‘further and collective attention’ (Productivity Commission, 2015: 2).
On the recommendation of the recent Financial System Inquiry, the government is now encouraging the superannuation sector to develop Comprehensive Income Products for Retirement (CIPR). The governments expect CIPRs to deliver ‘a regular and stable income stream, longevity risk management and flexibility’ (Australian Treasury, 2014). Before designing new products, however, industry and government need to understand how retirees spend and save their wealth and what puts their financial security at risk. Moreover, since CIPRs will need to complement the Age Pension entitlements of the majority of elderly households, their good design depends on knowing which Age Pension and related means-tests most affect households.
In this study, we record and analyse the decumulation patterns of a large group of Australian age pensioners, showing how retirees spend, invest, preserve and bequeath their wealth. The results of this study elucidate how retirees manage their superannuation balances. The results inform the development of policy settings to assist members of defined contribution plans transform their lump-sum balances into retirement incomes.
The Age Pension and related means-tests 1 influence the way people save for retirement, how they manage their wealth, what risks they insure and how they spend down their savings after leaving the workforce. First, workers could be discouraged from working longer and from voluntary savings because the pension ensures a basic income in old age and means-tests penalise income and higher asset balances. Second, the means-test does not count the family home as an assessable asset. This exclusion makes housing a more attractive asset than financial securities. Third, means-tests encourage retirees to access a potentially higher pension payment by spending faster and accepting more investment risk (Hulley et al., 2013). Fourth, the Age Pension discourages households from voluntarily purchasing longevity (and inflation) insurance because it pays a real, indexed annuity stream (Iskhakov et al., 2015). Fifth, the taper rate of the asset test has applied an implicit tax rate of over 100% on some annuities over the period of our investigation. Using longitudinal panel data, we describe how pensioners respond to these incentives in practice and suggest areas for policy review.
Our research builds evidence about two essential questions for retirement policy: first, do retirees spend their wealth too quickly; and second, what are the most serious risks to the financial security of the elderly? The combination of a mandatory retirement saving system, unrestricted decumulation and the Age Pension means-testing has often raised concerns that retirees will treat savings ‘as a windfall … used to pay for the lifestyle that’s being lived now instead of being put aside …’ (Certified Practising Accountants of Australia (CPA Australia), 2012: 2). While they might be tempted to spend too much in the short term, both empirical and theoretical research shows that the need to keep a buffer of savings against uninsured risks (such as health shocks) can make retirees extraordinarily thrifty (Ameriks et al., 2015). In addition, many retirees want to leave sizeable bequests (De Nardi et al., 2015; Retail Employees Superannuation (REST), 2015; Spicer et al., 2016). How retirees react to these competing priorities, as well as the impacts of changes in their circumstances, are empirical questions. The answers can help design social pension and private superannuation benefits that address the real needs of retirees.
Using an 8-year sample of fortnightly social security (Centrelink) data on a panel of over 10,000 people, we describe in detail how Australian age pensioners spend, save and invest. Our data set has advantages over self-reported panel surveys such as the Household Income and Labour Dynamics in Australia (HILDA) survey because Centrelink collects asset values directly from financial institutions and applies penalties for non-disclosure. It also includes a representative sample of pensioners who live in institutions. Our data also allow us to estimate the impact of the means-tests on heterogeneous households, a task needing frequent, accurate and longitudinal records of wealth and income.
We document sources of income, track adjustments to asset holdings, map consumption patterns and measure what wealth pensioners have left at the time they pass away. We find that on average pensioners are more cautious than they are profligate or short-sighted. At the same time, the average covers wide variation by age, wealth and household composition. For example, our analysis demonstrates that while younger households tend to draw down their non-residential (assessable) asset balances, older households maintain or even accumulate assets. Pensioners tend to preserve the family home until very old ages. When houses are sold or bequeathed, it is normally by very elderly singles or when one member of couple leaves or dies. The combination of cautious spending and keeping the family home partly explains why the median pensioner who passed away during the sample period left behind assessable wealth (mainly financial) equal to 90% of the assets recorded at first observation in the sample period. In other words, many pensioners spend little of their capital.
While there is considerable heterogeneity in drawdown patterns – with over 10% of single households in the study exhausting 90% of their initial assets over the sample period, for example – we find that a majority of households preserve a large proportion of assessable assets as a buffer or bequest. The largest falls in assets are linked to changes in household structure due to death or the breakdown of a relationship. Households subject to different means-test tapers draw down at different rates. The average drawdown rates for households whose pension benefits are subject to the higher implicit tax rates imposed by the income test and asset test are about 3 and 9 percentage points, respectively, higher than those receiving the full pension. We use this evidence to formulate some suggestions about the design of the public pension and of retirement benefits.
Our work confirms a growing body of international evidence that rates of retirement decumulation are remarkably slow. Consistent with our analysis, US panel studies find that elderly households continue to save and that the elderly hold very similar asset levels at the last point they are observed as at the first point they are observed (Poterba et al., 2011b, 2015). Other international studies find similar results (see, among others, Bershadker and Smith, 2006; Börsch-Supan and Lusardi, 2003; Bryant et al., 2011; Guiso et al., 2002; Love and Smith, 2007; Milligan, 2005; Ooijen et al., 2015). Australian studies using alternative data sources also find evidence of saving by the elderly. Analyses of the HILDA panel report that the wealth (net of residence) of the median pensioner household was steady or modestly increasing over the 2002–2010 period. These studies also confirm our finding that households subject to different means-tests spend their wealth at different rates (Hulley et al., 2013; Spicer et al., 2016).
In the next section, we describe the data and sample. Section ‘Sources of income’ documents pensioners’ sources of income and section ‘Asset allocation’ outlines household asset portfolios. In section ‘Decumulation’, we graph and estimate econometric models of decumulation, and section ‘Discussion and conclusion’ concludes.
2. Data and demographics
We analyse records of people receiving a full or part Age Pension from the Centrelink Longitudinal Data Sample (LDS). The LDS is a random sample of 1% of all Centrelink benefit recipient fortnightly records, over the period 1999–2007. There are 15,938 age pensioners in the LDS at the start of asset balance records on 16 July 1999 and 19,016 on 8 June 2007. This increase of 19% shows how population growth and longer lifetimes have more than offset the effects of an increase in the pension eligibility age for women from 61 to 63 years during the sample period.
The LDS reports fortnightly assessed income and assets of individual pensioners. Individual pensioners in a couple are classified as ‘couples’ rather than ‘singles’ and ascribed the asset balances of both partners. If a partnered pensioner (single pensioner) loses their partner (takes a partner) during the study period, they are reclassified as single (a couple) from that time onwards. If pensioners die or no longer qualify for a pension, Centrelink removes them from the sample and replaces them by otherwise randomly selected entrants who are newly eligible for the Age Pension.
Out of the 26,488 pensioners in the initial sample, 6942 – or just over a quarter – drop out before the last record date, 8 June 2007. Of the people who drop out, 75% are recorded as having died, while 11% have other reasons supplied for their attrition but are most likely to have passed away. A further 11% dropped out because the means-test made them ineligible for payment or because they qualified for a veteran’s pension. The remaining 3% leave the sample for unexplained reasons.
The LDS only keeps records of assessable income and assets. Assessed income consists of labour income and non-labour income that is generated by financial assets. 2 Assessed assets include all financial assets except for the family home, so we can keep track of home ownership rates but not the value of housing equity. Before 2002, certain private trusts, and before 2004 retirement income streams (life annuities), were also exempt from the assets test. It is unlikely that the small amounts related to these exemptions materially distort our results.
Of course, the LDS sample is not drawn from the whole elderly population, being confined to age pensioners, who make up close to 75% of the age-eligible population. This means the pensioners in our sample are almost all in the lower 80% of the wealth distribution and retired from the workforce. Consequently, we cannot study a representative sample of the full wealth distribution, as Spicer et al. (2016) do using HILDA data, nor can we study the period prior to and immediately following retirement as the Productivity Commission (2015) does using HILDA and Australian Bureau of Statistics (ABS) data. Despite these limitations, the LDS allows us to focus on the group of people whose drawdown on assets will most directly affect the sustainability of government support for retirees.
We work with a balanced panel for most analyses since we are most interested in the decumulation patterns of surviving pensioners. This lets us minimise selection effects related to people whose assets are near the means-test thresholds and who might be dropped from or added to the sample as their asset holdings vary. We also exclude pensioners whose asset balances are missing at some point in the sample period. 3 Using these restrictions, we construct a balanced sample of 10,350 pensioners: 3683 males and 6667 females. Of these, 6316 were married or in a de facto relationship in 1999. Partners are not automatically included in the sample; 45% of those married were male, compared with 20% of singles.
Most of the LDS balanced panel are female, married and homeowners. Median values are 74 years for age, $54,000 4 for assets outside the family home and $13,900 p.a. for Age Pension payments (Table 1). Despite the fact that means-testing truncates the right tail of the wealth distribution in the LDS, we still notice a right-skew with average assessed assets higher than median assessed assets, at around $84,000.
Summary statistics: demographics; assets, income and Age Pension benefits (in ’000 of $2007).
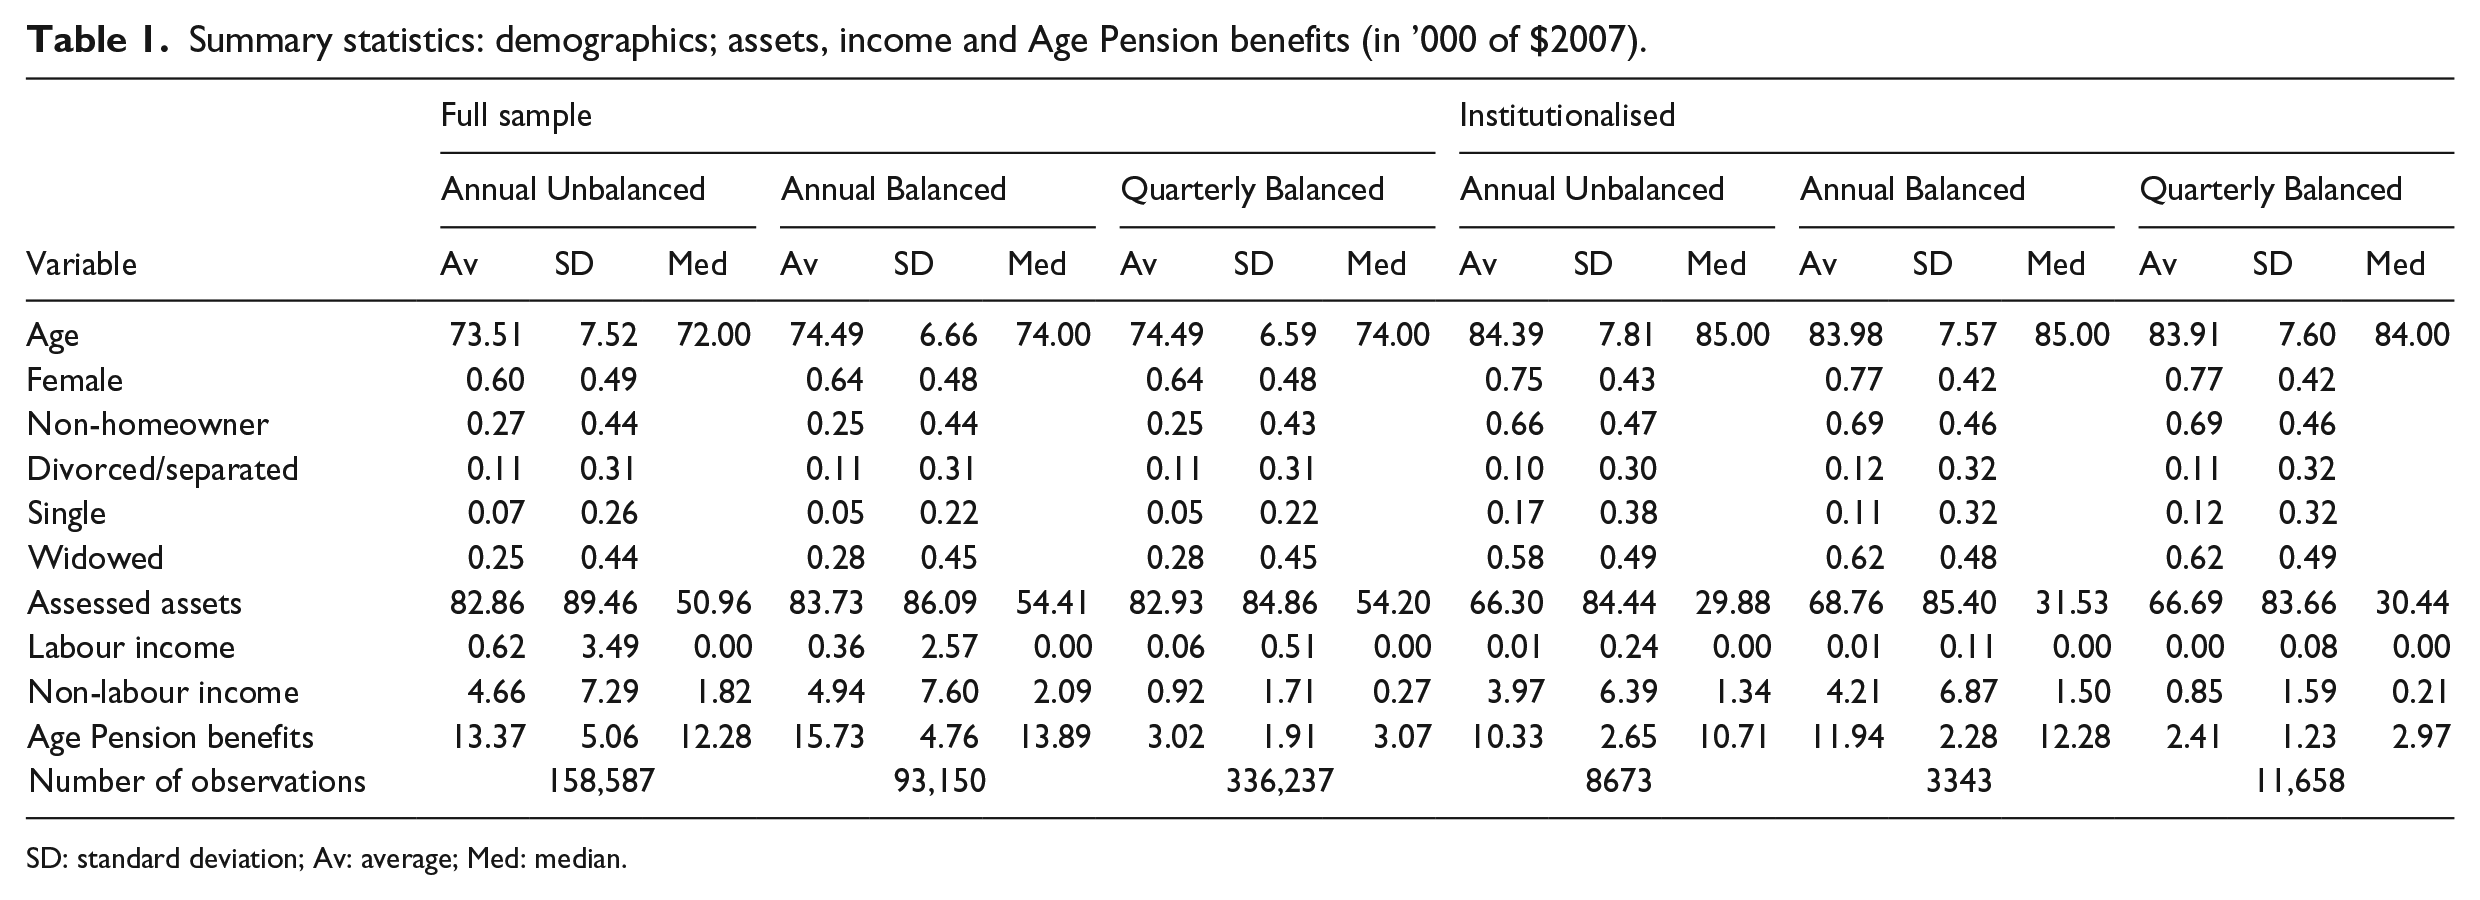
SD: standard deviation; Av: average; Med: median.
Changes in household structure, the death of a partner and shocks to health can have large effects on retirees’ wealth (Coile and Milligan, 2009; Poterba et al., 2011a). The LDS sample records when and why coupled pensioners switch to single status and when people move into institutional care. Of the 1476 coupled pensioners from the balanced panel who become single over the sample period, 57% were widowed, 8% were divorced, 16% moved to aged care facilities and 19% had no reason recorded. Pensioners are in institutional care in 3.6% of the observations in the balanced panel, amounting to 373 persons on average over the period. Statistics in Table 1 show that the average age of this group is 10 years older than the panel average, they more likely to be female and more likely to be widowed. Assessable assets for institutionalised people are about 20% lower than the panel average. We find that 31% are homeowners as compared with 75% of the balanced panel as a whole, evidence that the costs of moving into residential aged care are often covered by the sale of the family home.
3. Sources of income
Diversified sources of income can improve the security of retirees and reduce the fiscal burden of pension payments. A related goal of the retirement savings system is to ensure that cohorts of retirees will increasingly substitute income from personal retirement accounts for transfer payments (Australian Treasury, 2014). Other government policies such as changes to Age Pension means-tests and eligibility ages aim to encourage labour supply at older ages (Atalay and Barrett, 2014; Productivity Commission, 2015). These only partly reduce the disincentive to participate in the labour force created by other regulations. For example, there are no incentives to delay collecting the Age Pension past eligibility age; people wishing to leave the labour force earlier can start withdrawing their superannuation at a ‘preservation age’ that is 5–10 years earlier than the eligibility age; and the means-tests apply a high implicit tax rates on labour income once people start drawing the Age Pension. In all, we see the effects of these policies in the very low proportion of labour income received by age pensioners.
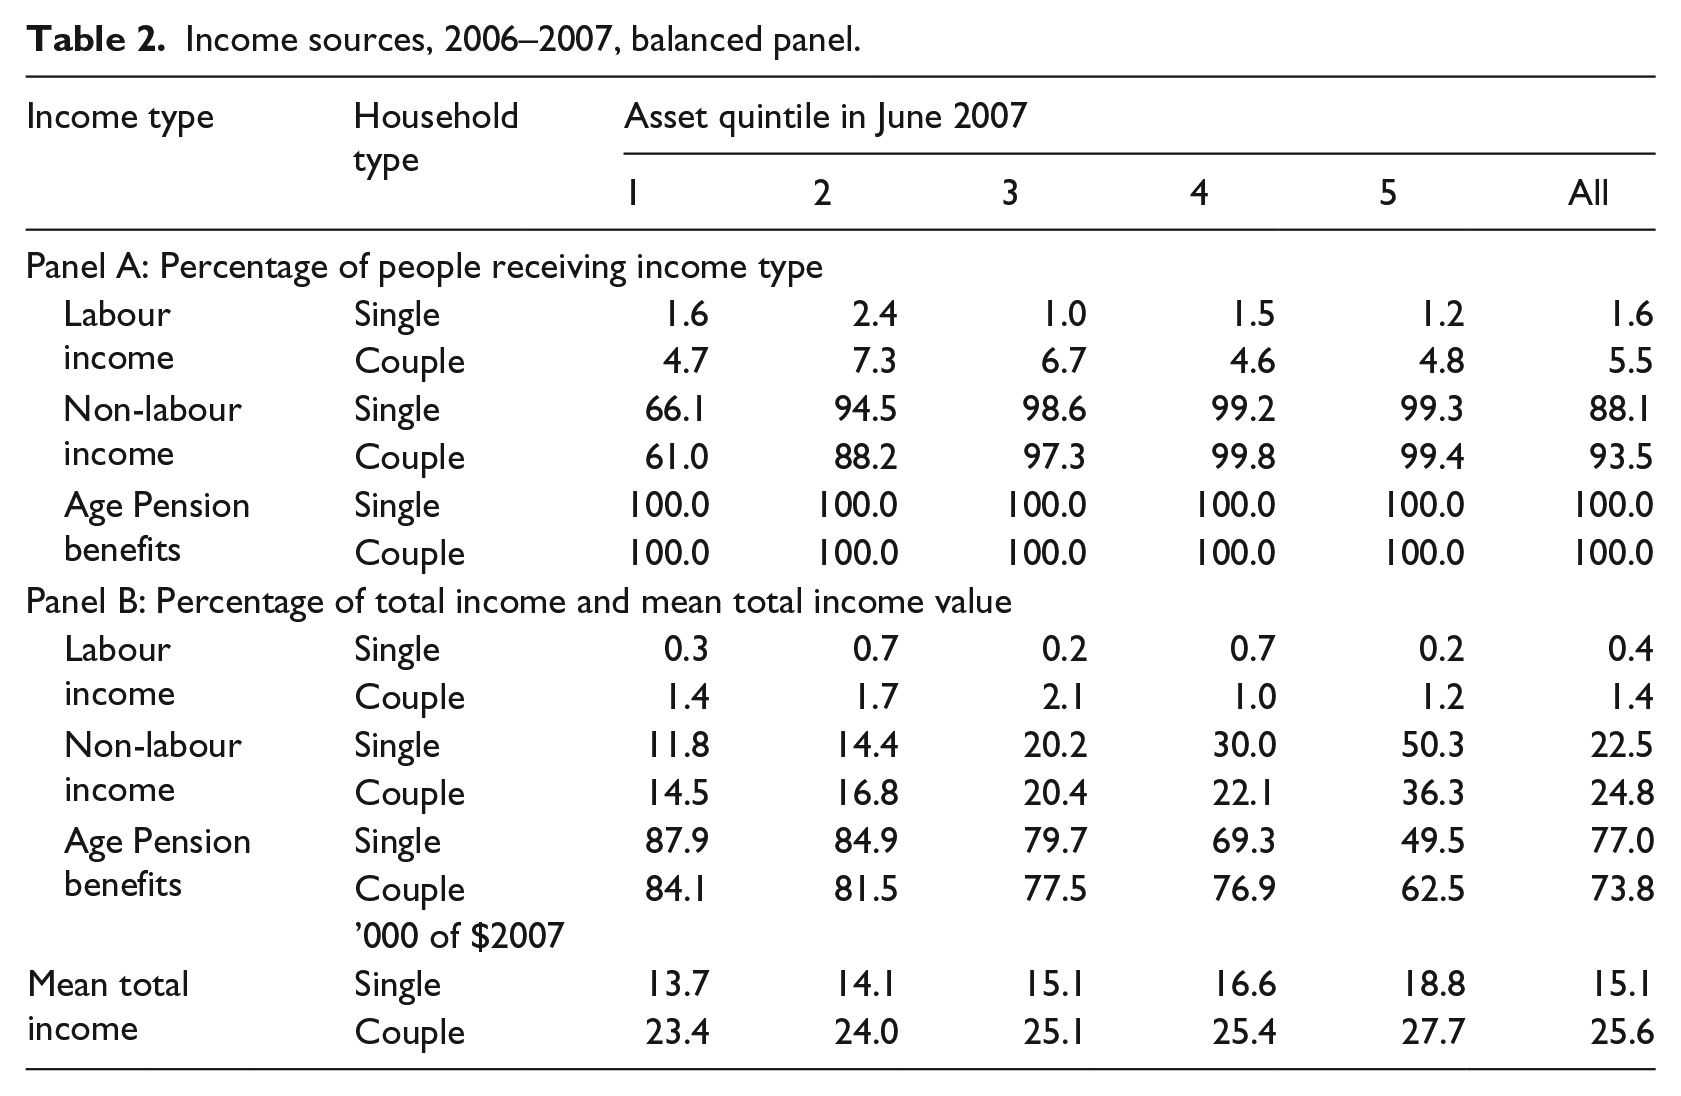
Table 2 sets out sources of income of pensioners sorted into assessable asset quintiles as at the last year of the sample period (2006–2007). The Age Pension contributes more than 50% of income for all groups, except singles in the highest asset quintile. About 20% of income for the median individual comes from occupational pensions, retirement income streams and financial asset returns. However, only 5.5% of couples receive labour income (even fewer single households do) and the contribution to total income is very small. We calculate that only 8.4% of pensioner households have received labour income at any time in the sample period, with couples more likely to do so. The people who do report some labour income received it for an average of 5 out of the 8 years for which we have records. For partnered and single pensioners combined, the average labour income is $16,800 p.a. at the age of 61 years, declines to half that by the age of 66 years, then decreases gradually to $6250 by the age of 76 years. Labour income plateaus between $3000 and $4000 for those working into their 80s.
Income sources, 2006–2007, balanced panel.
Not only is the Age Pension the main source of income for most households in the LDS, around two-thirds receive the maximum pension payment. Table 3 reports means and standard deviations of the Age Pension benefit as a percentage of the maximum payment and the proportion of households receiving a full pension by cohort and asset quintile in June 2007. On average, age pensioners were receiving 93% of the full pension amount. Even in the wealthiest quintile, 16% of pensioners received the maximum payment. The average percentage payment declines slightly by age and assessable wealth quintile; this could be related to sales of the family home at very old ages.
Age Pension benefit by age cohort and assessable asset quintile, balanced panel.
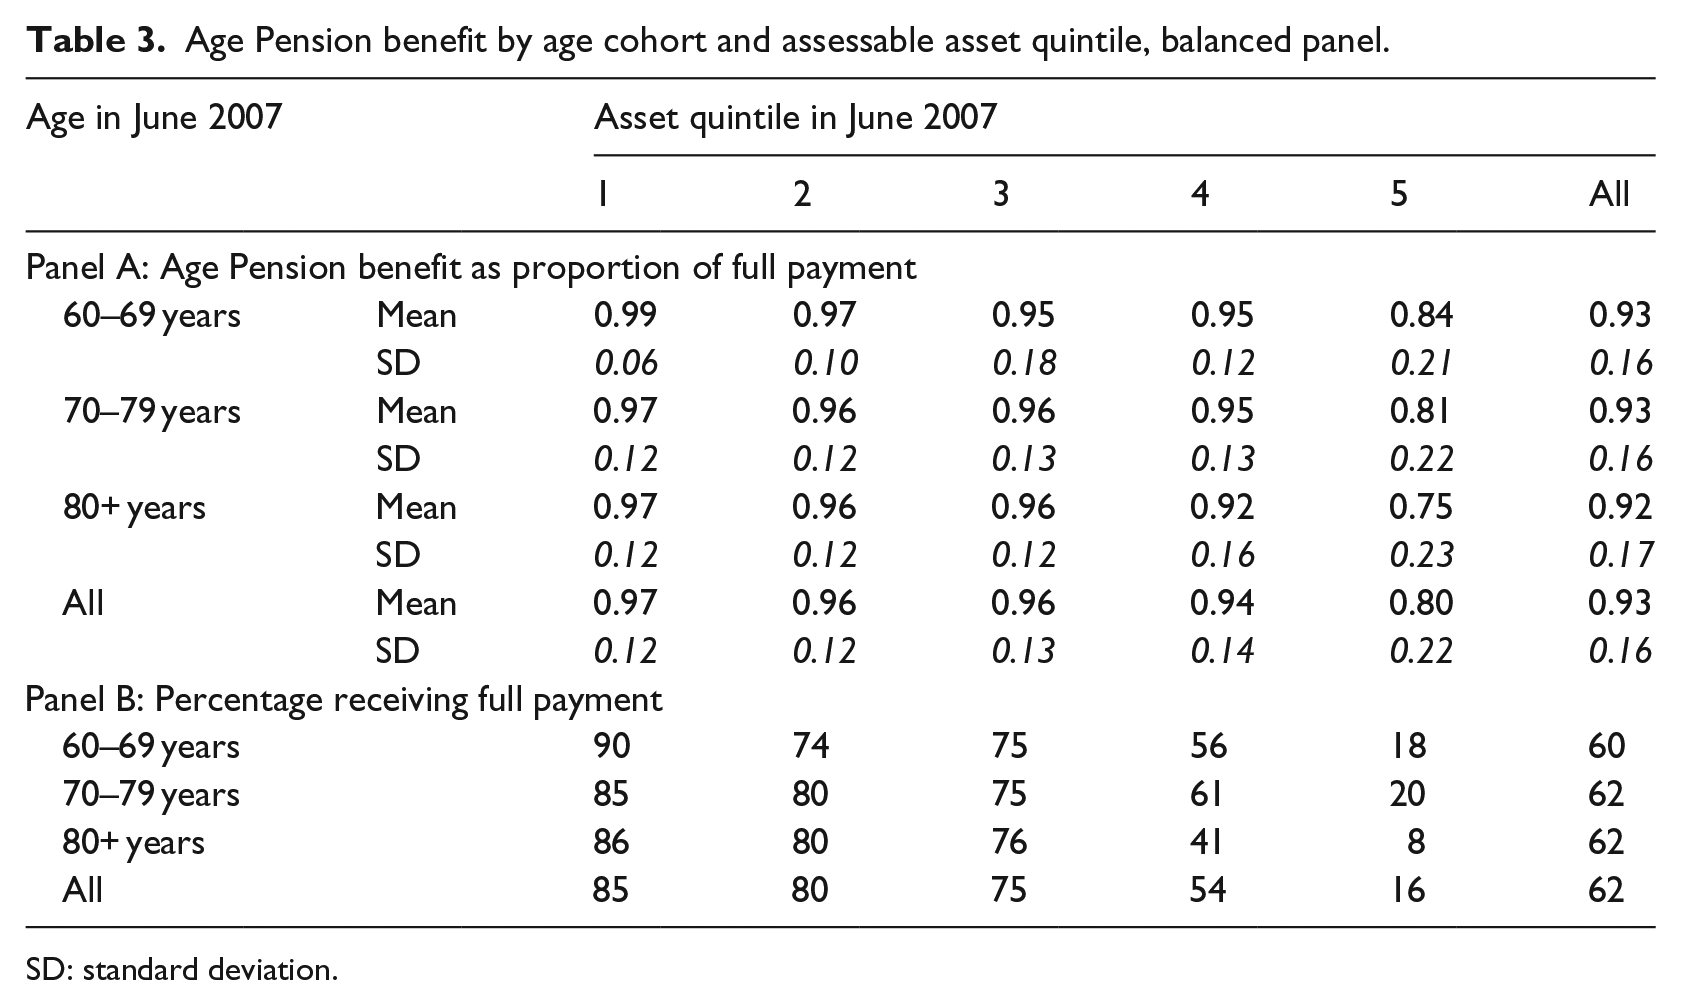
SD: standard deviation.
To summarise income patterns, public pension payments dominate incomes, but earnings from other savings contribute around one-fifth of reported income each year to households of all wealth levels. Labour income goes to few households and is very small. A very small proportion of pensioner households are likely to receive bequests. 5 This suggests that improving labour force participation rates among the retired would increase diversification of income sources.
4. Asset allocation
We now turn to asset balance. How wealth is stored, whether in real estate, equities, managed investments or bank deposits, is likely to be another important influence on the decumulation behaviour of households. Liquid assets can more readily support consumption, but means-test valuation rules and exclusions are also likely to affect asset holdings. The family home is excluded from means-tests and often preserved for bequests (REST, 2015) or to fund aged care; and risky asset holdings are partly hedged by the tapers, but expose retirees to shocks in returns (Spicer et al., 2016).
4.1. Home ownership and financial asset balances
Around three quarters of age pensioners own their own homes, a proportion that does not vary much as they age (Table 4). Home ownership rates rose over the study period for couples aged 80 years or older, were stable for singles and couples aged between 70 and 80 years but declined for other groups (see Panel A of Table 4). For all age groups, at all points in the study period, the home ownership rate of singles is at least 20 percentage points lower than for couples, making them more vulnerable to financial shocks (see also Spicer et al., 2016).
Home ownership rate and mean assessable asset balances, balanced panel.
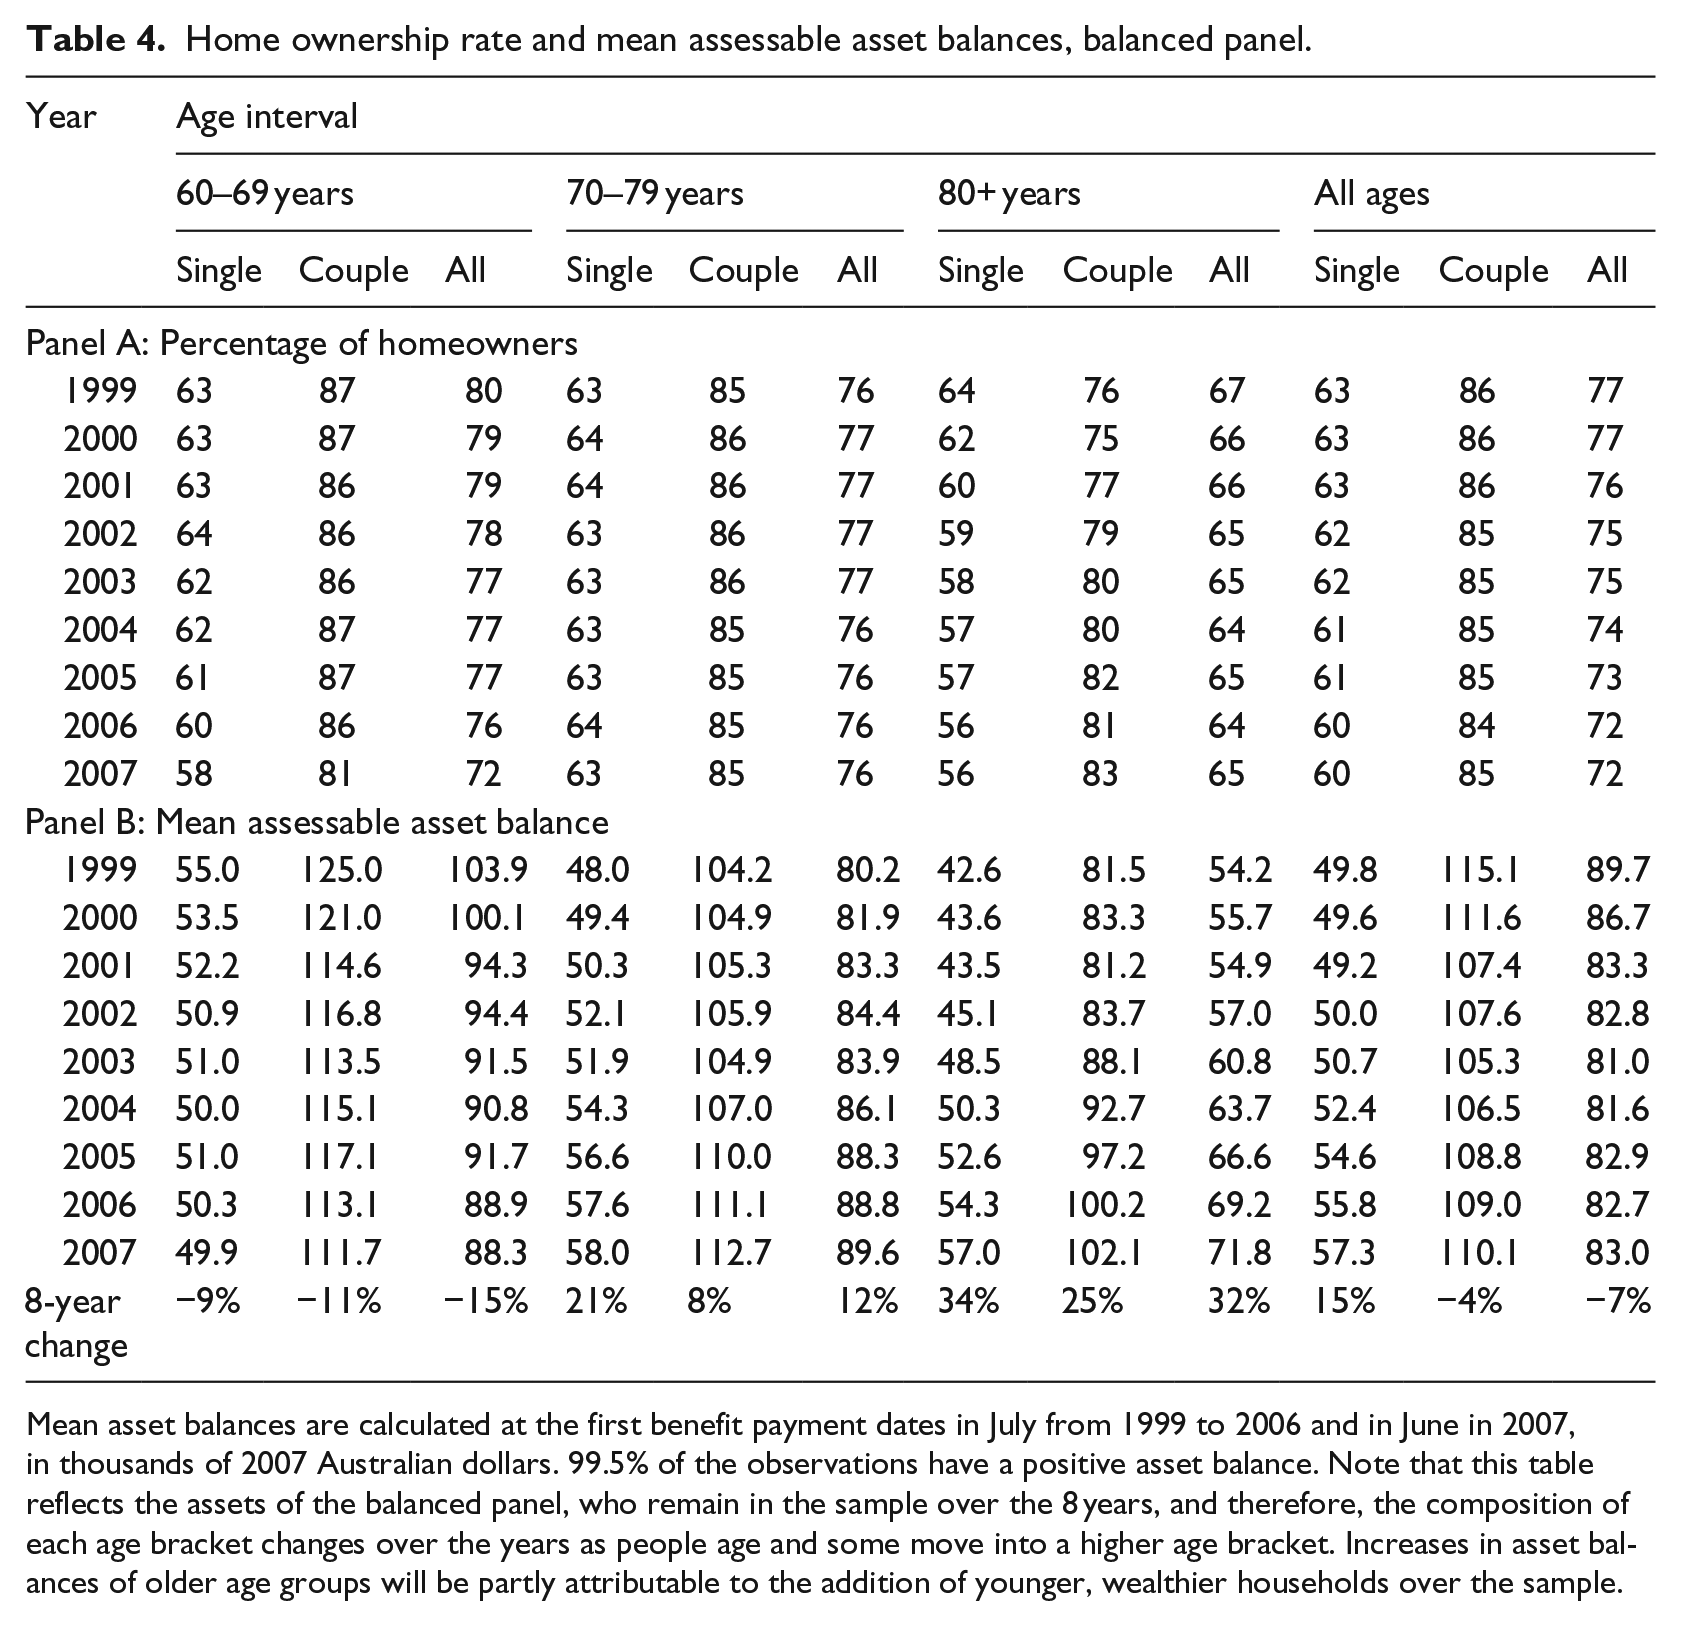
Mean asset balances are calculated at the first benefit payment dates in July from 1999 to 2006 and in June in 2007, in thousands of 2007 Australian dollars. 99.5% of the observations have a positive asset balance. Note that this table reflects the assets of the balanced panel, who remain in the sample over the 8 years, and therefore, the composition of each age bracket changes over the years as people age and some move into a higher age bracket. Increases in asset balances of older age groups will be partly attributable to the addition of younger, wealthier households over the sample.
Age pensioners in the LDS had low asset balances. Table 4 (Panel B) reports average asset holdings for three different age brackets. For all single households, the average assessable asset balance was about $49,800 in 1999 and $57,300 in 2007, well below the means-test thresholds. Average assessable asset balances for couple households were about twice those for singles. Average assessable asset balances decline (slowly) by 7% in total (less than 1% p.a.) for households observed over the full 8 years.
4.2. Financial asset allocation
We categorise the financial assets of the LDS into five broad groups. 6 Table 5 summarises the percentage of households with holdings in each category in 2003 7 and reports averages of the assessable asset balances in each group over that year. Younger cohorts generally have higher superannuation balances and are wealthier. That said, average superannuation balances are small across all groups – in most cases much less than equities and managed investments held outside superannuation. The cohorts we study here were covered by the Superannuation Guarantee for a shorter period and contributed at lower rates than workers do currently. While the portfolio share of superannuation of employees nearing retirement is increasing (CPA Australia, 2012), how much of that increase will be preserved to support old age consumption is unclear (Productivity Commission, 2015).
Asset allocation, July 2003, balanced panel.
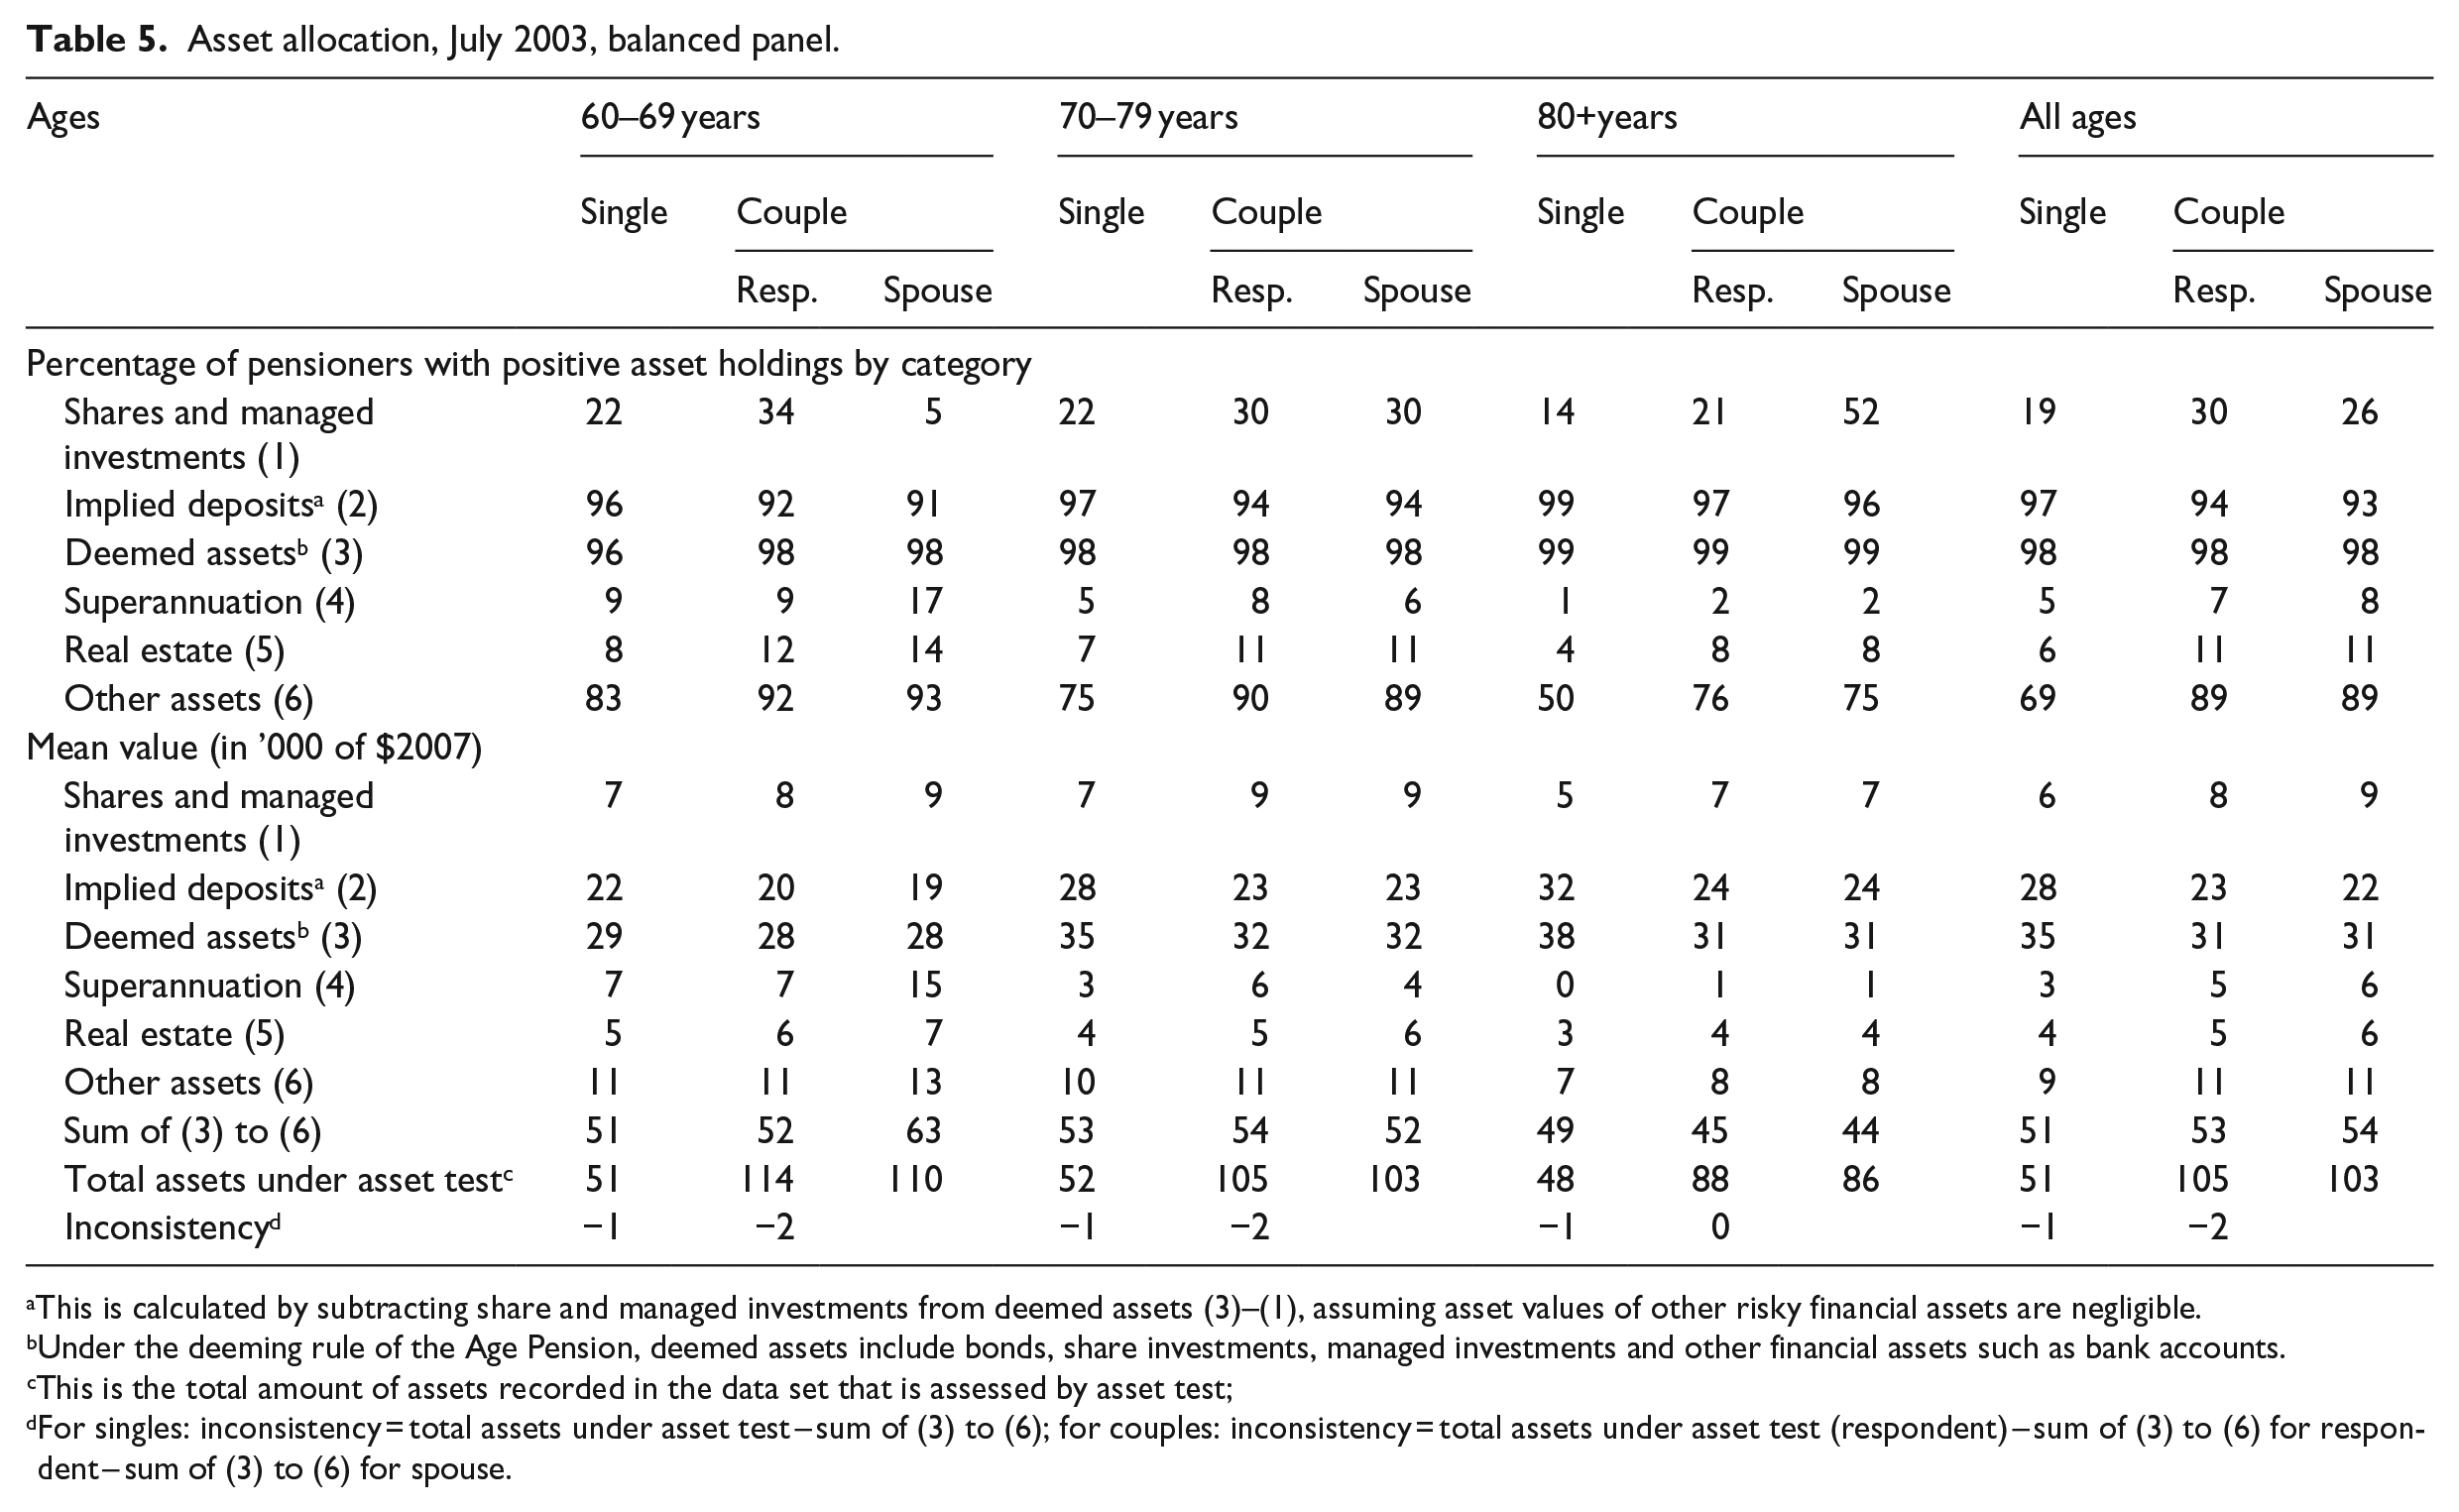
This is calculated by subtracting share and managed investments from deemed assets (3)–(1), assuming asset values of other risky financial assets are negligible.
Under the deeming rule of the Age Pension, deemed assets include bonds, share investments, managed investments and other financial assets such as bank accounts.
This is the total amount of assets recorded in the data set that is assessed by asset test;
For singles: inconsistency = total assets under asset test – sum of (3) to (6); for couples: inconsistency = total assets under asset test (respondent) – sum of (3) to (6) for respondent – sum of (3) to (6) for spouse.
We observe lessening exposure to financial risk as people age. Consistent with the protection against risk provided by the means-tests tapers (Hulley et al., 2013) and with increased risk aversion and shorter life expectancy, Table 5 shows that older cohorts have a smaller proportion of risky assets on their balance sheets. This pattern aligns with patterns in the Australian HILDA panel (Spicer et al., 2016) and the US Health and Retirement Survey (Coile and Milligan, 2009). Rates of return on financial assets were positive over most years in the study, apart from 2002 to 2003, but share market fluctuations appear to have a minimal impact on assessed asset value, possibly because changes in market values are not always reported immediately. Australian retirees do, however, maintain a substantial vulnerability to investment risk that is likely to increase as retirement savings become increasingly concentrated in superannuation accounts (Spicer et al., 2016).
The means-tested Age Pension is intended to provide for the needs of the poorest of retirees and as a redistributive vehicle. We have performed tests of wealth inequality over time that indicate that financial wealth inequality did not decrease over the period 1999–2007. 8
Overall, average asset holdings – both home ownership and financial assets – are remarkably stable, apart from the decline in risky financial asset holdings as households age, and the noticeably higher superannuation balances of younger households.
5. Decumulation
Life-cycle theory predicts that households will accumulate savings during working life with the intention of spending their accumulation to fund consumption in retirement. In this section, we graph the asset drawdown of age pensioners. We begin with the time-path of home ownership and then study financial asset decumulation for the balanced panel. Next, we estimate consumption levels and residual wealth at the end of life, completing the analysis with econometric estimates of decumulation.
5.1. Home ownership
Figure 1 plots year-to-year changes in home ownership over the period 1999–2007 by household structure. The lines between two connected points measure the difference in home ownership of pensioners observed in two consecutive years, for each type of household. The gaps between two disconnected points arise from changes in household composition.
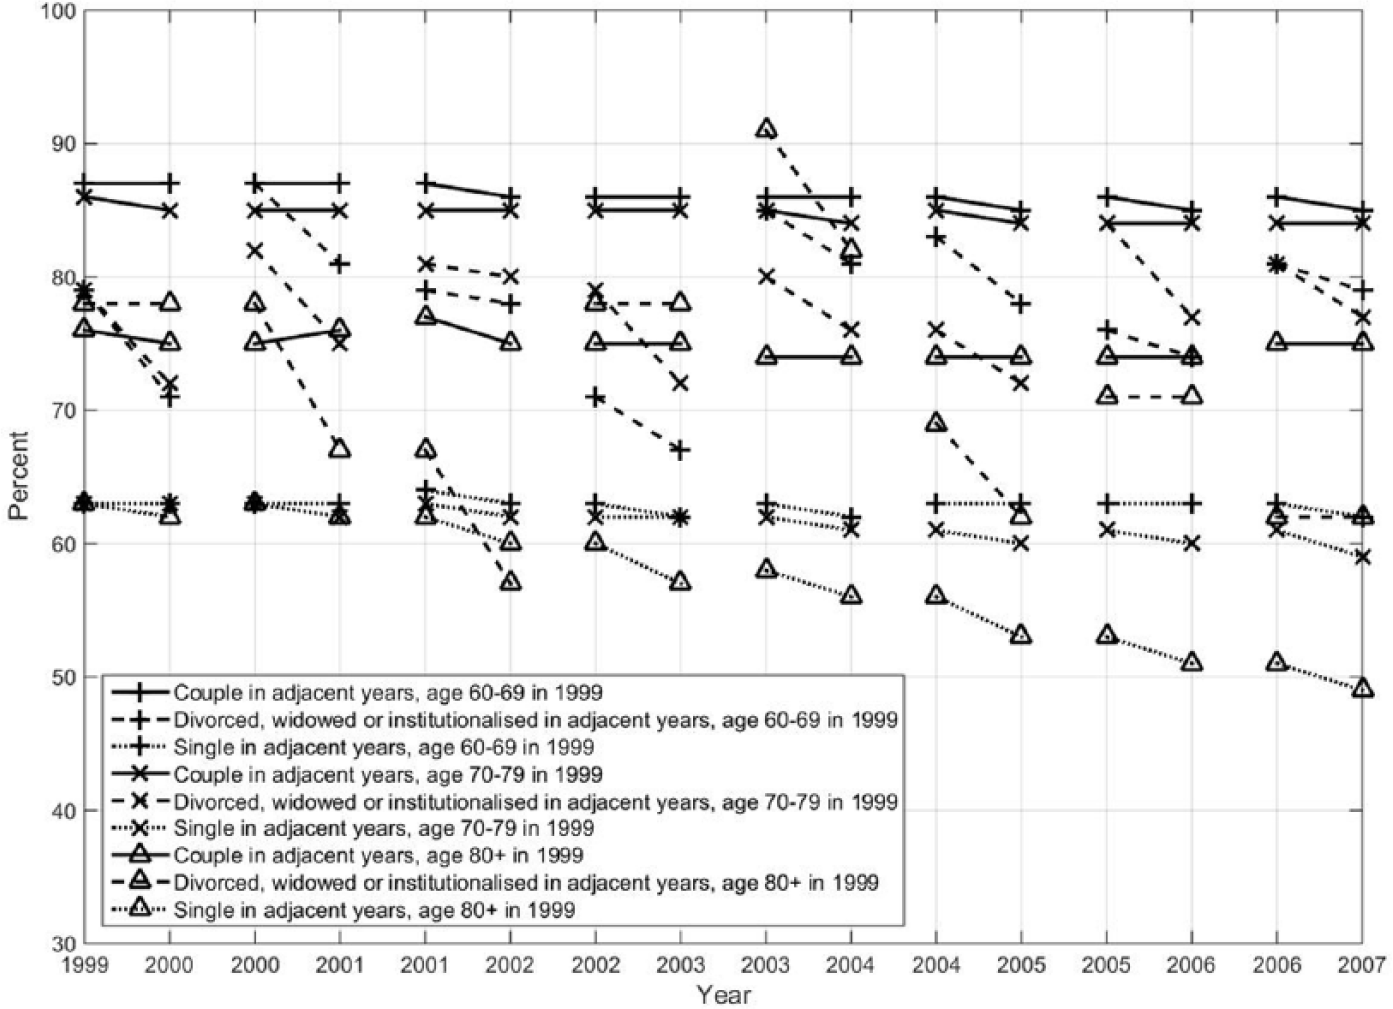
Changes in home ownership by age and household structure.
There is little change in home ownership rates among continuing couples. However, single households show declines in rates of home ownership over time. This is most clearly seen for singles over the age of 80 years, where home ownership drops by around 3% each year, amounting to a 20% decline over the 8 years of the sample. The dissolution of households is the other cause of home sales, which is consistent with patterns in the United States (Poterba et al., 2011a). Members of couples could lose home ownership through divorce, and those becoming widowed or moving into long-term care might sell houses to cover expenses or to reduce the maintenance burden.
Continuing high rates of home ownership among most pensioner households, when considered along with the evidence that few retired households use financial products such as reverse mortgages to consume their housing wealth, suggests that Australian age pensioners hold on to houses for precautionary reasons or as bequests. Indeed, 58% of respondents to the REST (2015) survey of pre-retirees said they intended to leave equity in their residence or property assets as a bequest to help their children purchase a house.
5.2. Assessable assets
Retired households generally need to use financial assets to fund consumption, so patterns of decumulation should be most easily seen in changes in assessable asset balances, which are more liquid than houses.
To get a clearer understanding of the pattern of drawdown, we need to follow the same individuals over time. Figure 2 plots average asset balances at each age and family structure for selected cohorts (labelled by the cohort age in 1999). Each segment shows the same cohort of pensioners over these years, for those aged 61, 66, 71, 76 and 81 years in 1999. It traces the asset values for continuing couples and singles and pensioner couples who transition to singles at any time during the period.
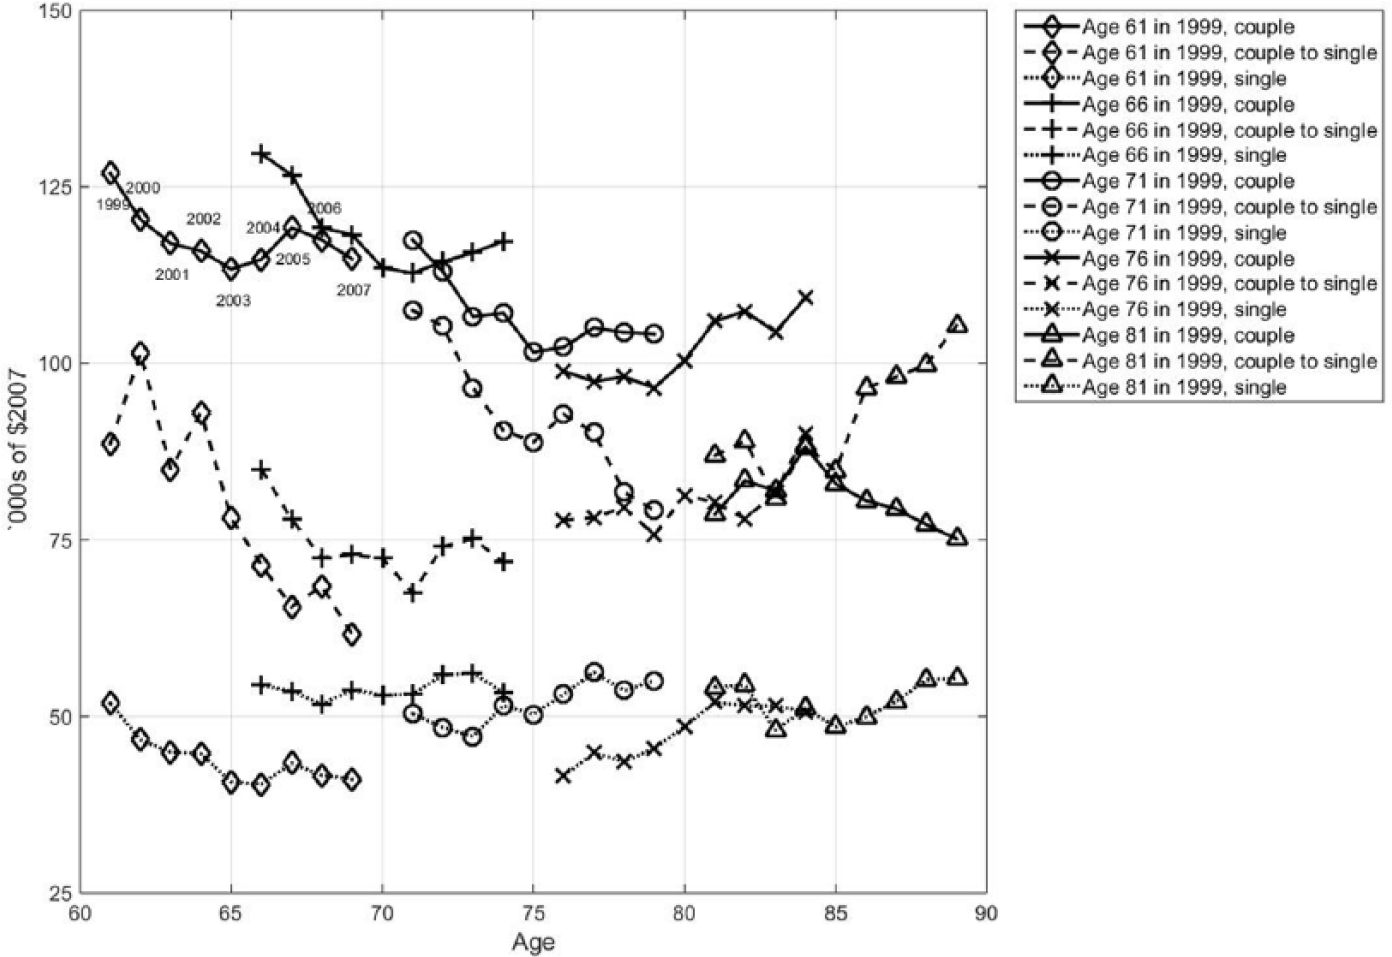
Mean balances of assets for selected cohorts by age and household type.
For continuing couple households under the age of 80 years, and especially for the younger couples, the graphs show a decline in asset values in each of the first 4 years but not in the latter four. The similarity in calendar year patterns among the different cohorts at younger ages suggests that time effects are important (see Ooijen et al., 2015 for similar patterns among Dutch households associated with trends in returns on financial assets).
Those in dissolving partnerships experience large falls in assessable assets. The average decline is 32% for those under the age of 70 years and 20% for those between 70 and 80 years, but only 7% for those over the age of 80 years. Possible explanations for the fall are divorce (including legal and other costs), bequests to others than the spouse, and end-of-life costs. The division of assets on divorce could account for around 5 percentage points of these decreases: divorce on average entails a 50% split of assets but only 10% of dissolutions we observe are due to divorce. Bequests might make up another 5 percentage points: Baker and Gilding (2011) analyse probate distributions in Victoria and show that around 90% of a person’s assets go to surviving spouses, leaving the residual for other beneficiaries. Some of the remaining declines could be explained by costs associated with divorce, but are more likely to be health, aged-care and funeral expenses.
The cohort analysis shows that pensioners, especially singles, hold on to their relatively small pots of retirement savings and only consume current income. The asset balances shown here are large enough to supplement retirement consumption if drawn down, but, after the first few years of retirement, households appear to be holding on to them, possibly because of a declining inclination to spend or to cover the risk of long life, health and long-term care costs, other unforeseen expenses and bequests. It is possible, however, that pensioners would be less cautious if they had a better idea of the actual costs of health and aged care or could access appropriate insurance. 9
So far, we have grouped pensioners by age, but people with different levels of wealth may have different spending behaviours, as observed in other countries (e.g. Alessie et al., 1999; Börsch-Supan, 1992; Hurd, 1990) and in Australia (e.g. Hulley et al., 2013). Figure 3 plots the year-to-year changes in assessable asset balances by asset quintile of individuals aggregated over all ages. Here, we group pensioners by their July 1999 asset balances, which allow classification by household to vary by year, so a partnered pensioner can move to single status and thus to a different line segment. We only look at the balanced panel so as to remove survivor bias.
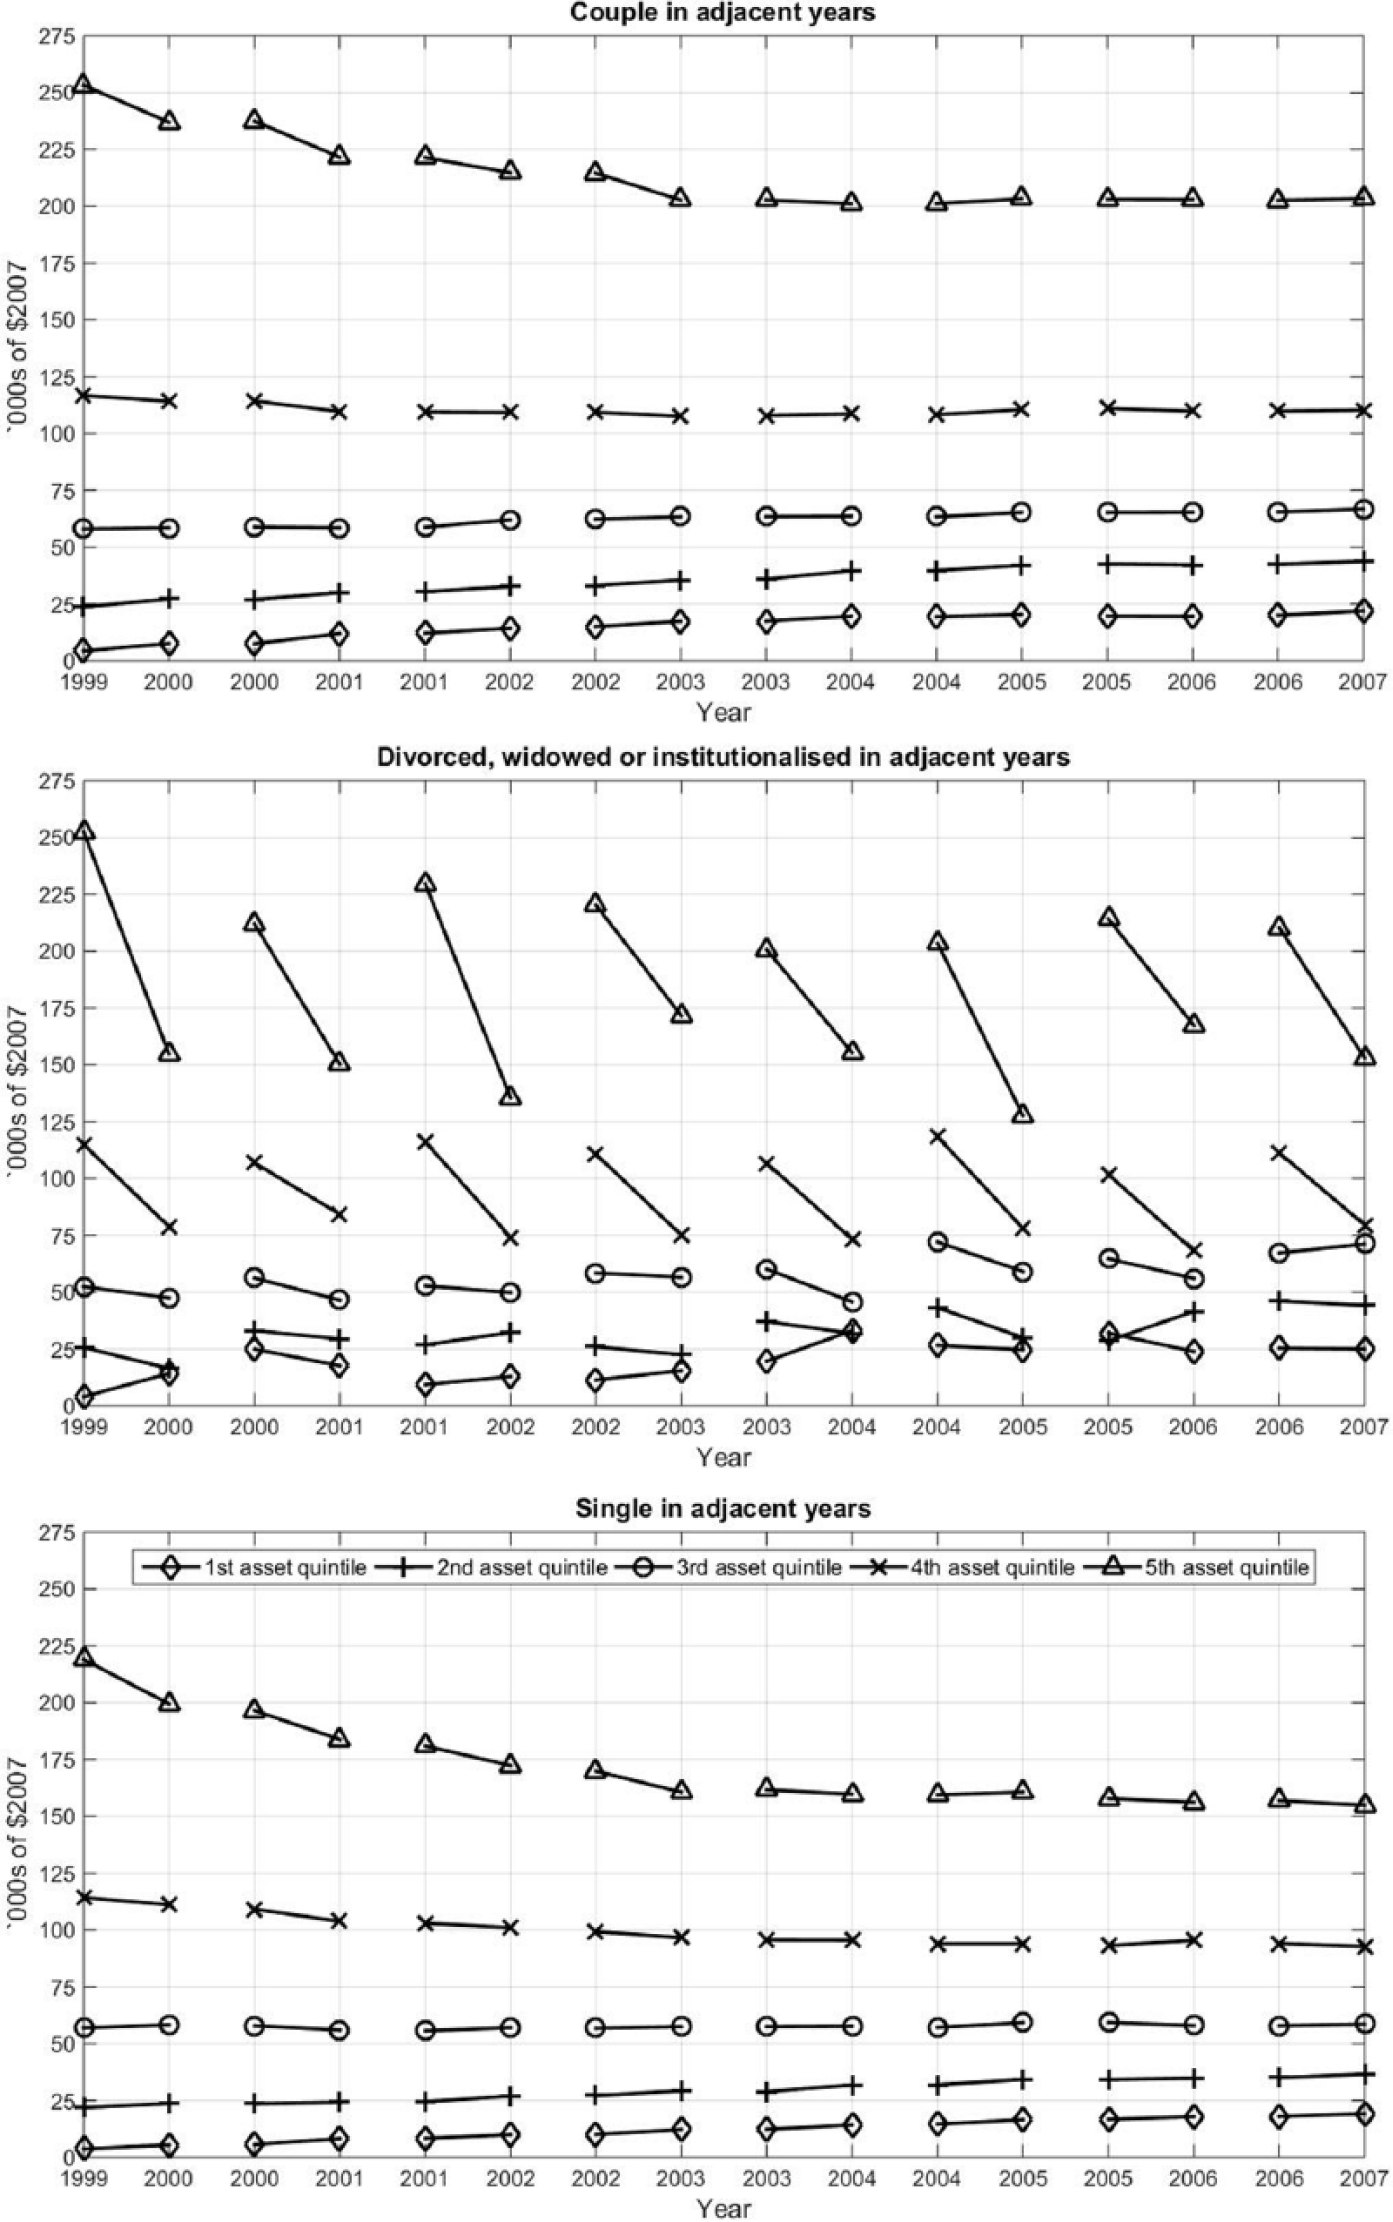
Assessable assets by wealth quintile in July 1999: balanced panel.
The top two quintiles of all household types reduced their assets, on average, in the first 4 years, while the lowest two quintiles of both couples and singles increased theirs over the whole period. Results for the couples transitioning to single are mixed: households with assets over $50,000 per person experience large declines, while those with less than $50,000 tend to accumulate assets. These less wealthy households seem to hold on to more wealth than they need as a precaution against late-life health costs, suggesting other saving motives matter.
In Figure 4, we show the ratio of assets over time against assets in July 1999. For illustrative purposes, we have randomly selected 100 continuing couples and show the bottom, middle and highest quintiles of initial wealth. (The other household types are similar so we do not show them separately.) The heterogeneity is marked, particularly at the lowest quintile, where initial wealth can be very small and proportional changes large. There does, however, seem to be a bifurcation, with one group 10 to 100 times better off and another group clustered around zero (meaning no change in their assets over the period). The same bifurcation is not visible in the middle and highest quintiles, where the ratios are more clustered around zero. The jumps in assets could be due to receiving bequests or proceeds from the sale of the home. 10
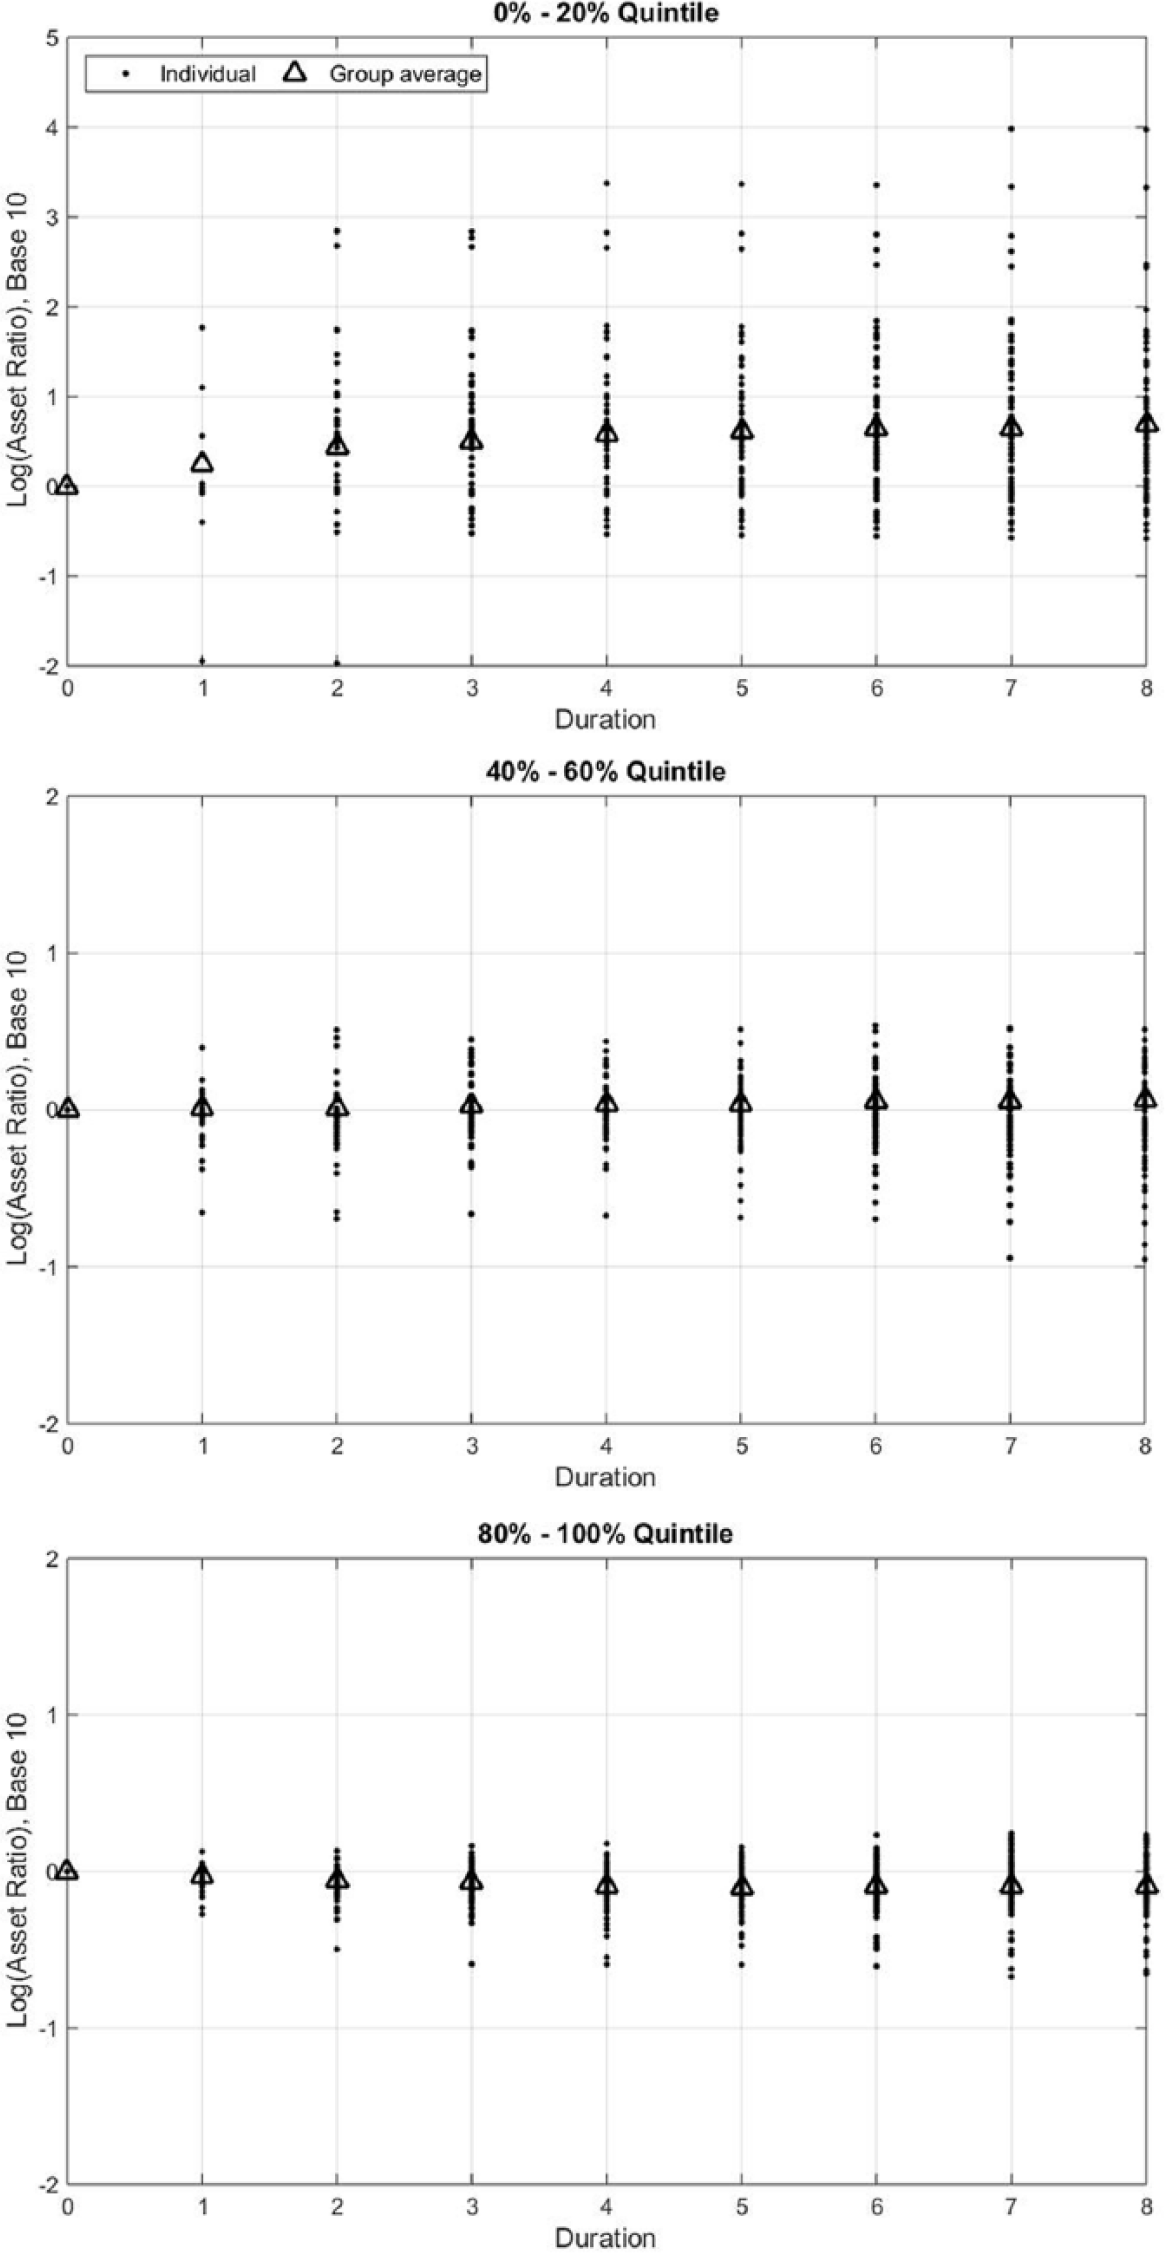
Asset ratio of couples by duration from 1999: random sample of 100 couples.
Of concern is the number of couples whose assets decline precipitously: over 10% of the sample experienced a decline in asset values of more than 50% over the period for reasons that we cannot identify. While such declines may be voluntary, other candidate explanations are catastrophic medical costs that should be insured, fraud or elder abuse (Cooper et al., 2008).
5.3. Consumption
Using data from the balanced panel, we estimate annual household consumption by age and asset quintile in 1999, as shown in Table 6. We calculate household consumption as income (including Age Pension, labour income and income from financial assets) less the increase in assessable assets. This measure excludes the consumption value of housing for homeowners, as well as consumption out of bequests and the proceeds of home sales. We compare consumption in the sample to the Association of Superannuation Funds of Australia (ASFA) (2014) Retirement Standard measures of spending for a ‘modest’ or ‘comfortable’ lifestyle that estimates a budget for households who own their homes and enjoy good health.
Average household consumption (in ’000 of $2007), balanced panel.
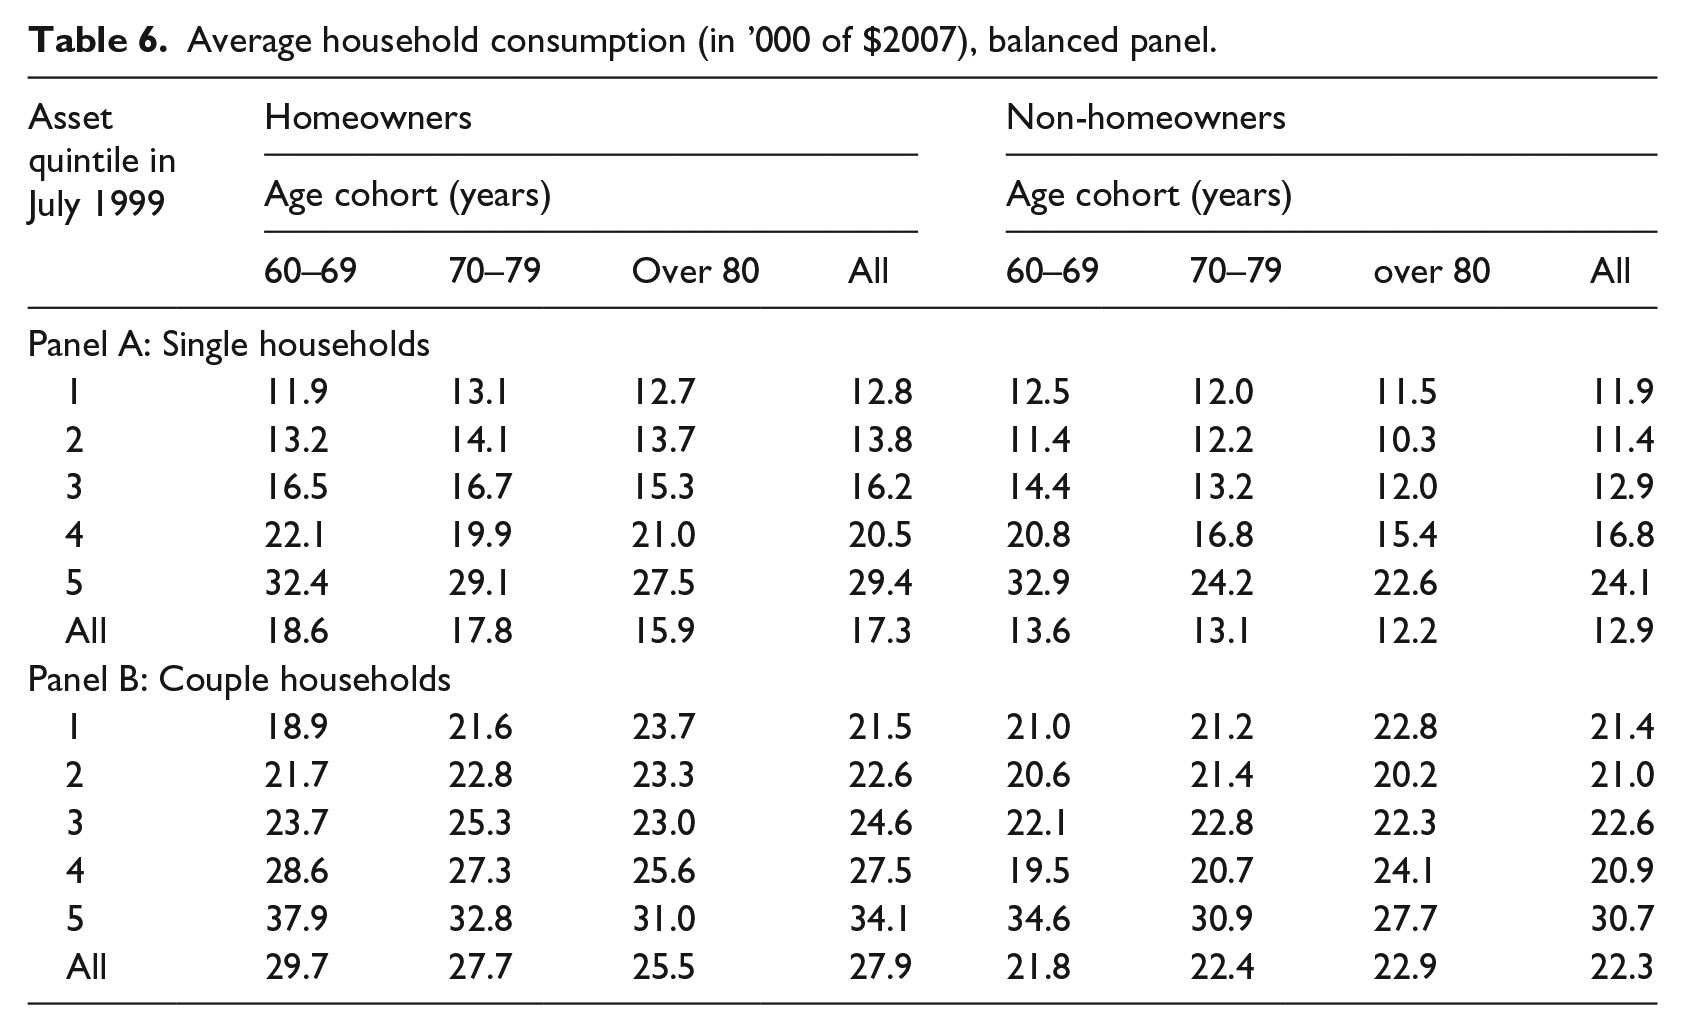
Average expenditure for the lower two quintiles of single homeowner pensioners is slightly less than the full pension payment and increases to more than double at higher wealth levels, although it is lower at older ages. The ASFA estimate of the budget required for a modest lifestyle for a single, home-owning retiree was around $18,000 p.a. in 2007 (Nicholls, 2007). The majority of single pensioners spent at a slower rate than this benchmark, with the average in the lower quintiles being less than $13,000 p.a. The related figure for a ‘comfortable’ lifestyle, according to ASFA, is $36,000 (in $2007), above the annual spending of even the wealthiest singles. The ASFA ‘modest’ standard for couples at 2007 rates was $26,000 p.a., higher than the spending of all but the top two couple quintiles in Table 6. Furthermore, none of the couple averages approach the ‘comfortable’ ASFA budget of $48,000 p.a.
Residual wealth at death of pensioners in the LDS confirms that low or slow decumulation is typical of many households. Table 7 shows the last observation on assessable asset balance of the 5365 individuals who died over the sample period (and thus are from the unbalanced panel). The lower panel compares this amount with the real ($2007) wealth of the same person in 1999. Average residual wealth ratios are almost uniform across ages and wealth levels, at around 90% of assets recorded at the beginning of the sample. Apart from the wealthiest quintiles, pensioners who pass away at younger ages leave a slightly higher percentage of their initial wealth, but the differences are very small by age at death. In other words, pensioners bequeath most of their wealth. These results are very similar to findings of Poterba et al. (2015) for the United States.
Residual wealth at death.
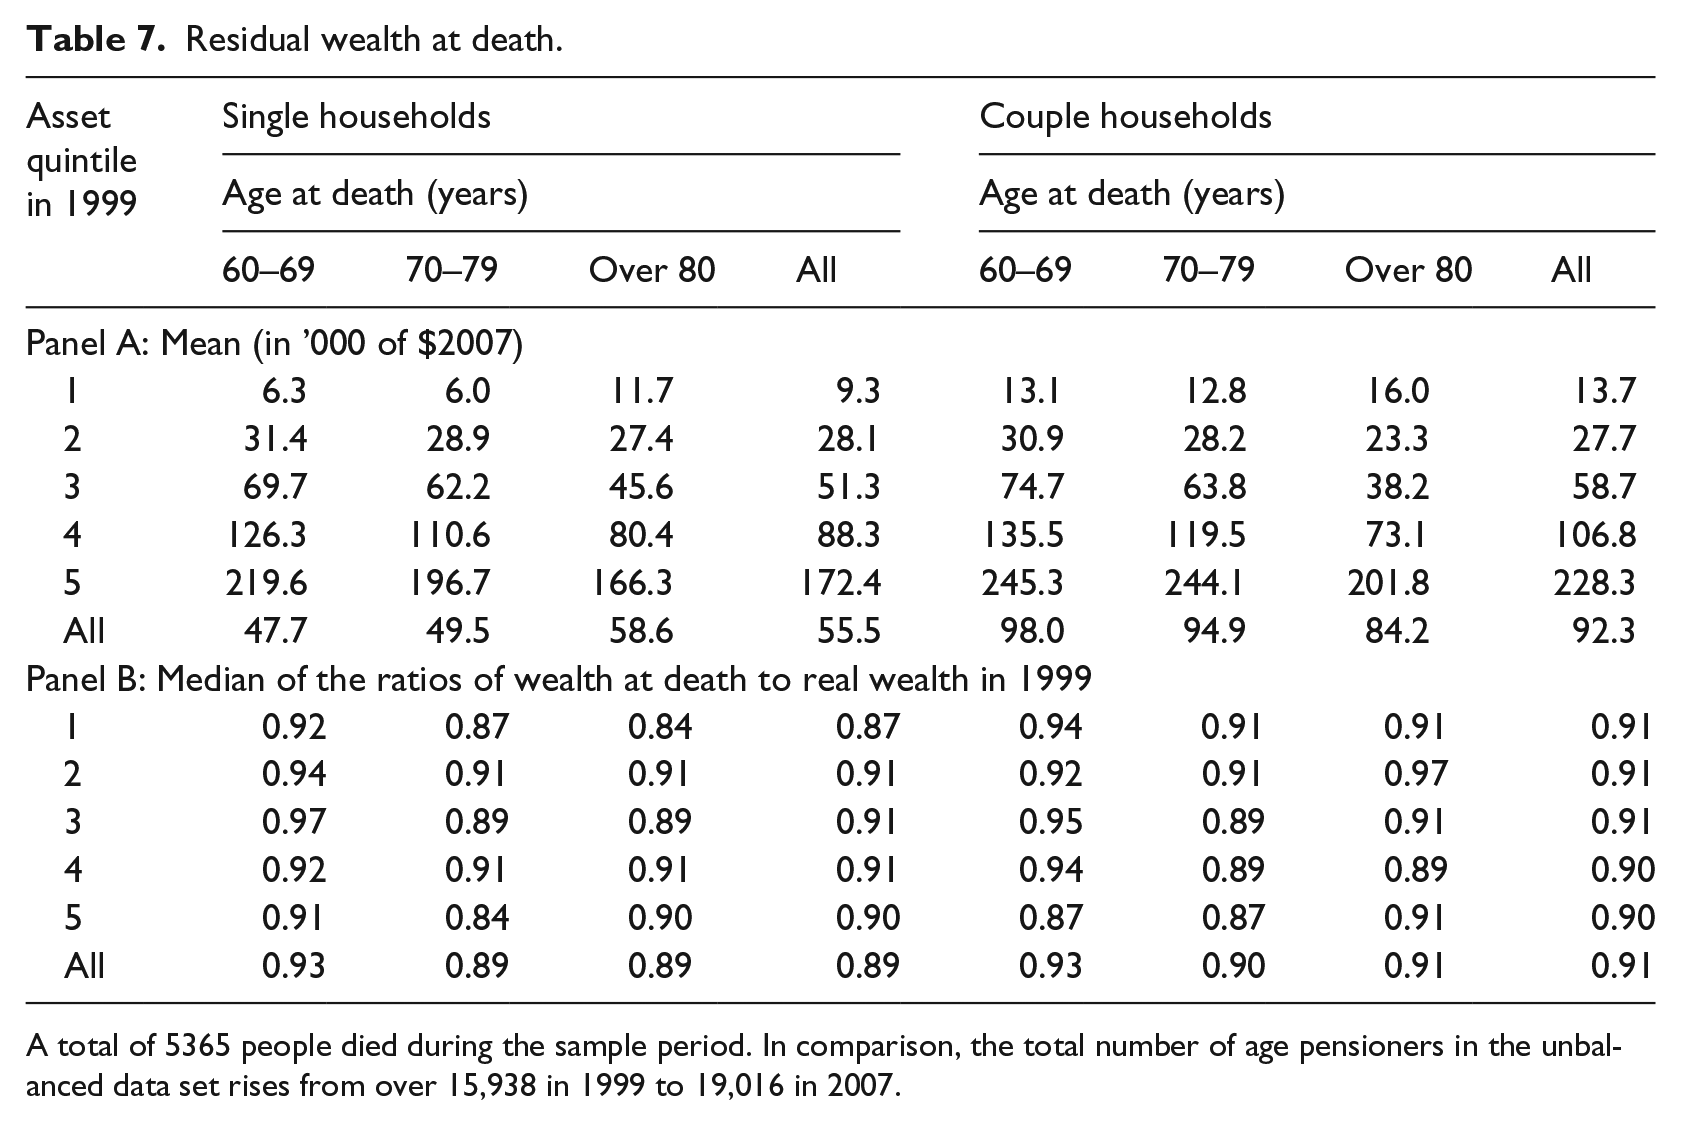
A total of 5365 people died during the sample period. In comparison, the total number of age pensioners in the unbalanced data set rises from over 15,938 in 1999 to 19,016 in 2007.
In the LDS, intended and unintended bequests are observationally equivalent, so we cannot infer the motivation for this conservative behaviour. However, keeping almost all one’s financial resources is not explained by self-insuring against longevity alone. If we assume that the deaths we observe are evenly spread through the sample so that the average time spent alive by those who do pass away during the sample period is 4 years, the implied decumulation rate for the average individual in Table 7 is about 2.5% p.a. from 1999 until death. This is below the rate of change in conditional life expectancy of about 5% p.a.
5.4. Panel estimation of decumulation
In this section, we estimate a reduced form panel model of asset drawdown to measure the conditional effect of the characteristics recorded in the LDS. 11 While observations are available on a 2-weekly basis, there is little change over such short periods, so we take observations at the first payment date of the Age Pension benefits in July (or June for 2007), October, January and April in each year of the sample period. We drop records of pensioners who do not appear in every quarter of the sample to avoid selection effects, leaving 326,048 observations (for 10,189 individuals) to use in estimation. Our unit of analysis is the household because the means-tests are applied to households. All financial variables such as assets and income are measured at the household level and the values are recorded for whichever person within the household is tracked by the sample.
Wealth, income, portfolio structure and the means-test tapers are jointly (endogenously) determined, so to avoid inconsistent estimation, we regress quarterly changes in financial wealth on lagged (predetermined) values of income, portfolio allocation and taper status and on current values of available demographics, which we treat as exogeneous. We use cluster-robust standard errors to address any remaining within-group correlation, after controlling for fixed effects.
Using the sample of quarterly balanced panel data, we estimate two models to explore decumulation behaviour. First, we estimate a pooled ordinary least squares (OLS) model that explains drawdowns for the sample as a whole
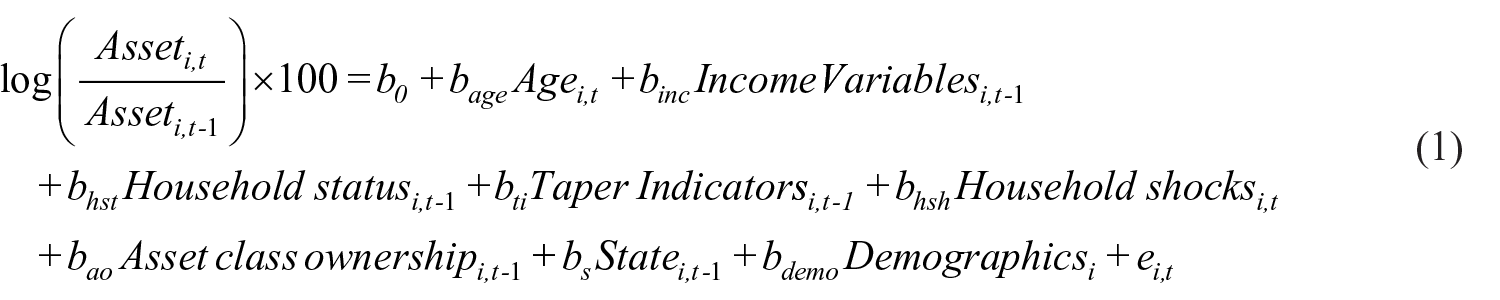
where
Following Coile and Milligan (2009), we include
To examine the effects of each of the variables on pensioners over time and take full advantage of our panel data, we need to allow for differences between people. The Hausman test rejected a random effects specification so we use a fixed effects model to account for time-invariant and unobserved heterogeneity. We estimate this model separately for males and females. As usual, we cannot separately estimate age, cohort and time effects, so following Coile and Milligan (2009), and given our short sample of quarterly observations, we assume that time effects are small relative to age and cohort effects.
5.5. Interpretation
Estimation results confirm the graphical analysis presented above, although the model explains a relatively small proportion of the variation. 16 The results of the OLS model in the second column of Table 8 show that labour income significantly adds to assessable assets. Household structure and its interaction with home ownership have large and significant effects on decumulation. 17 Long-term singles decumulate significantly faster than couples, and not owning a home increases the rate further. The positive impact of institutionalisation on financial assets for homeowners is almost exactly offset by the negative coefficient on the interaction term between institutionalisation and non-homeownership, suggesting that institutionalisation is related to further accumulation for those able to enter care without selling the family home, but has little net effect on the assets of those who do not own homes to begin with or who sell a home to help fund care.
Pooled OLS and fixed effects regression results, balanced panel.
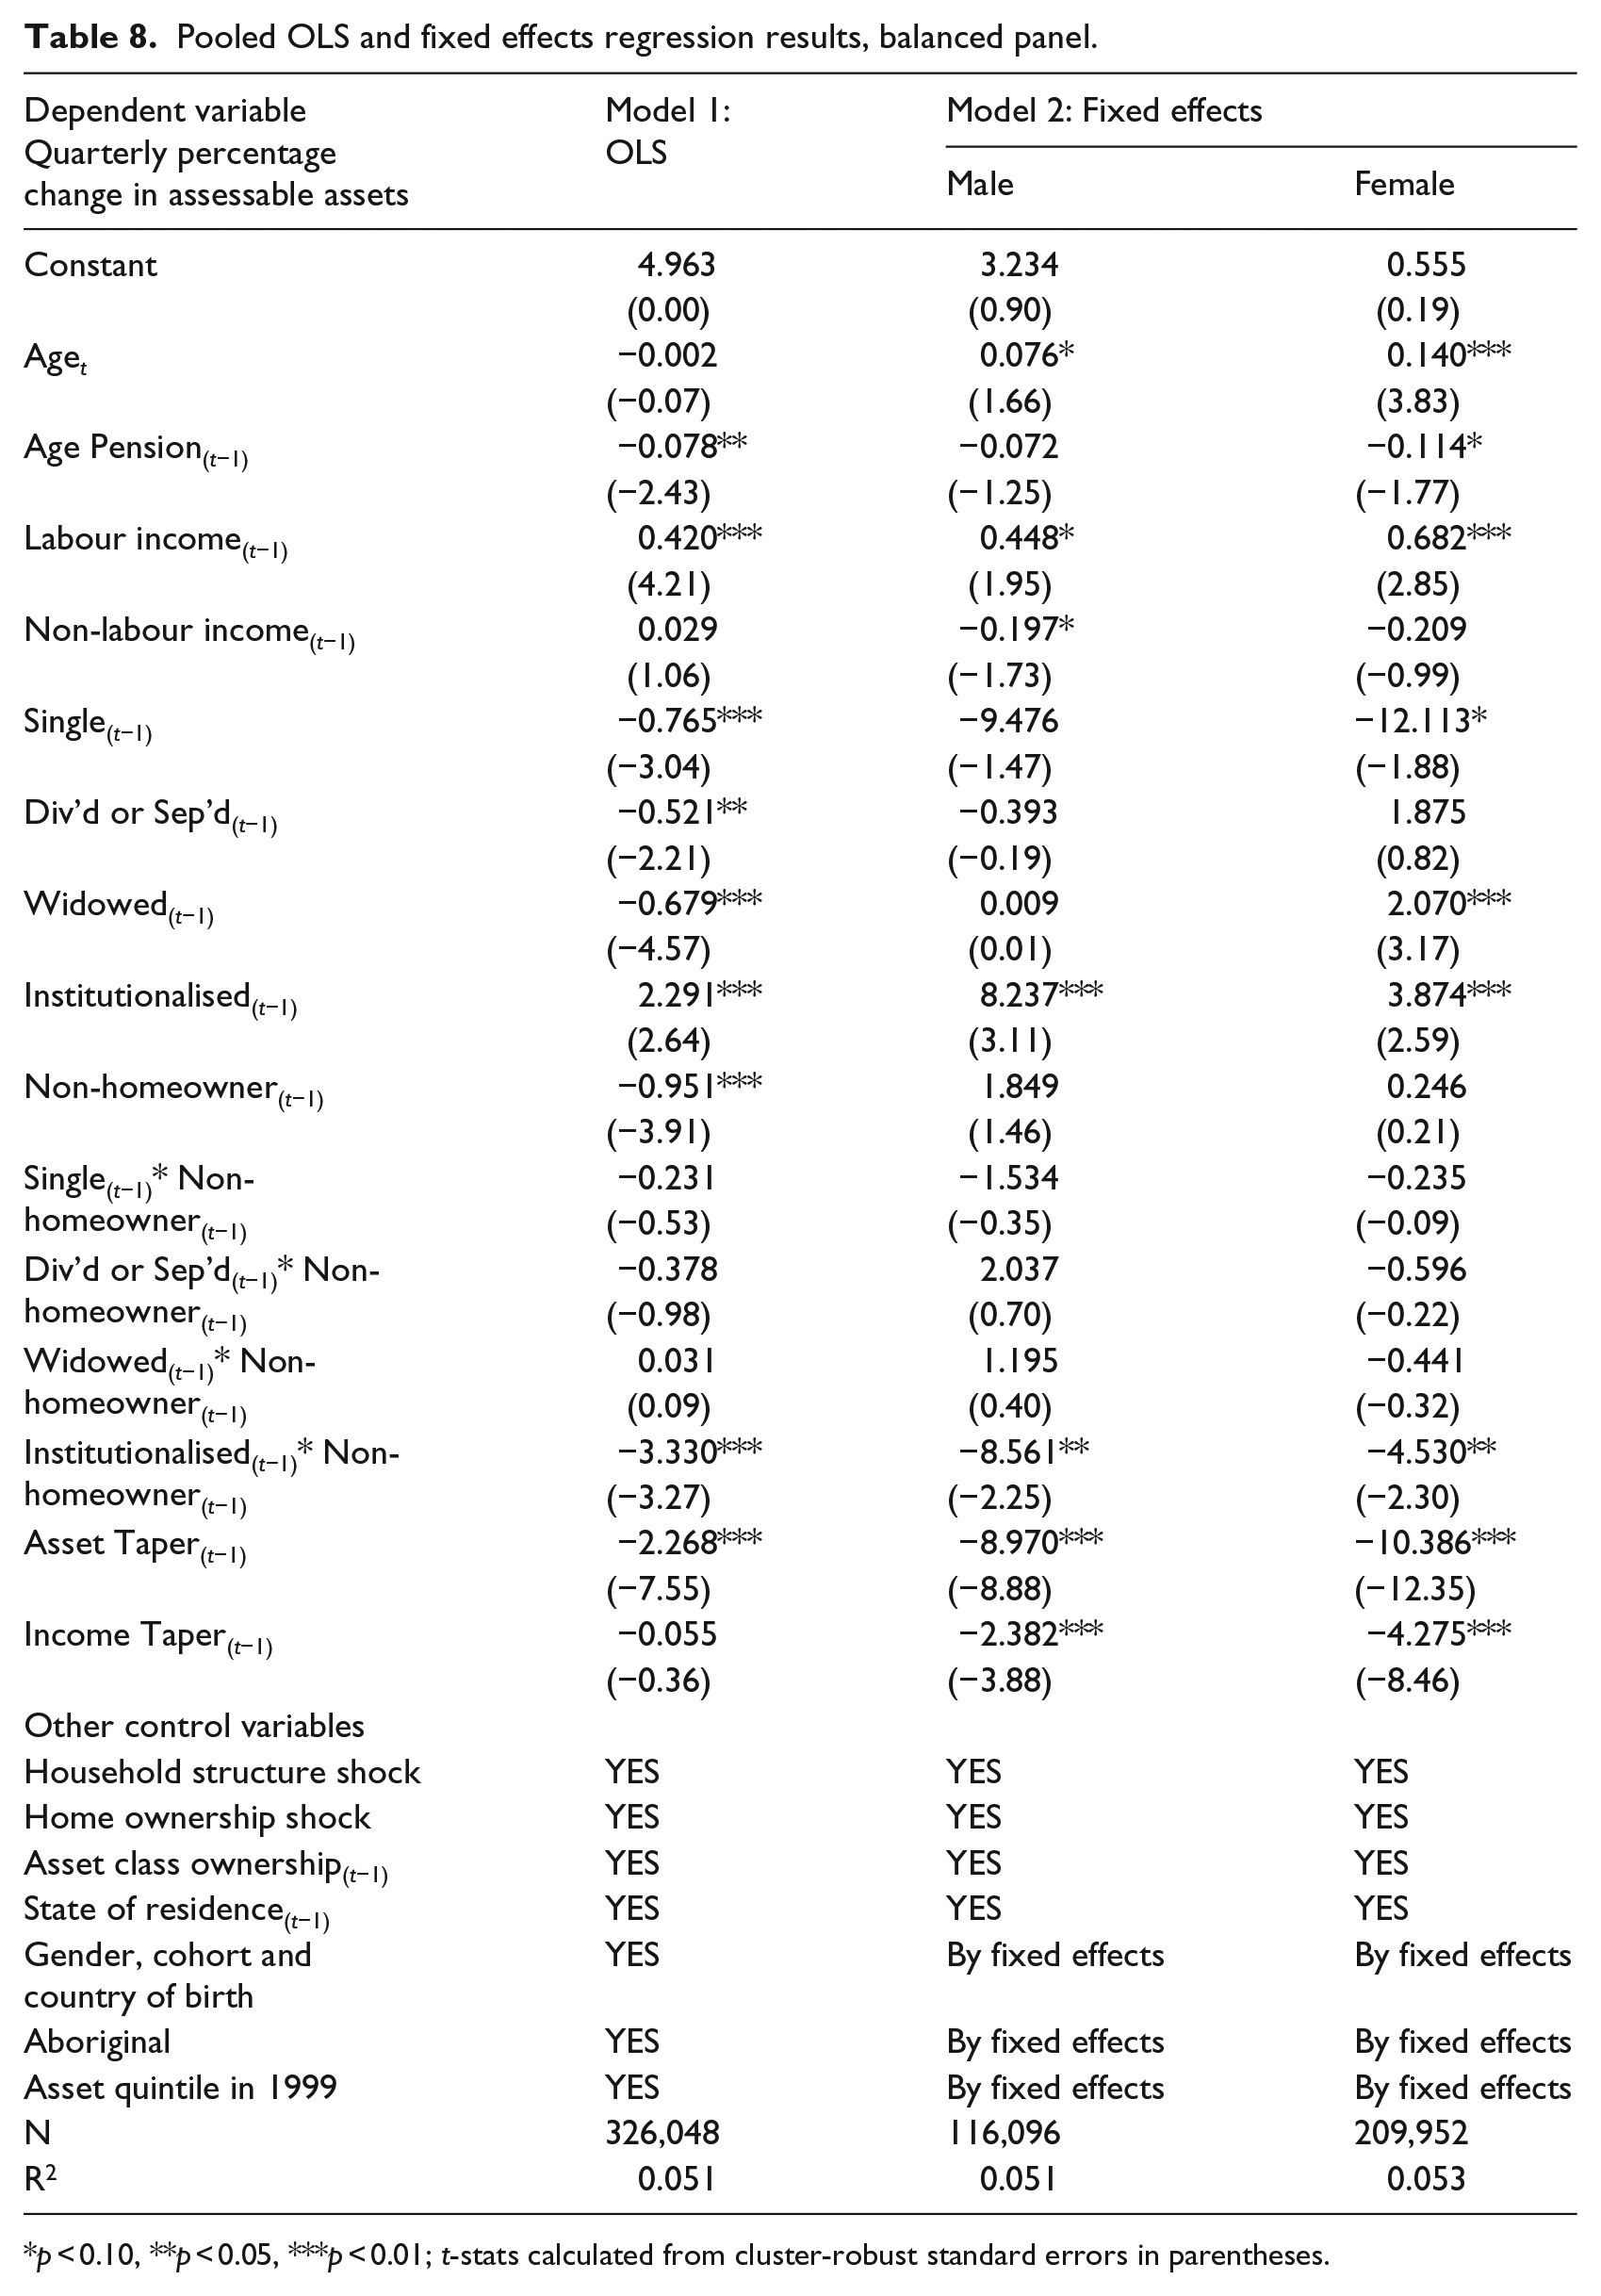
p < 0.10, **p < 0.05, ***p < 0.01; t-stats calculated from cluster-robust standard errors in parentheses.
The coefficients on asset and income taper indicators have the expected negative signs and are statistically and economically significantly related to decumulation rates. Pensioners who are subject to the means-tests decumulate at higher rates than those who receive the full pension.
The results of the fixed effect models throw further light on the impact of changes to circumstances over the period. Figure 5 combines the main effects and interactions related to age and graphs the fitted annual rate of decumulation by age and gender for pensioners on the full rate (solid line), income taper (dotted line) and asset taper (dashed line). Both male and female full-rate pensioners accumulate assessable assets at a slowly increasing rate as they age, rising to around 3% p.a. by the age of 100 years from close to zero at the age of 65 years. Pensioners on the income taper decumulate at about 2% p.a. but this spending slows so they become savers by age 90. Consistent with the theoretical predictions of Hulley et al. (2013), asset test taper pensioners decumulate fastest, also at rates that slow with age, spending assessable assets at around 9%–10% p.a. at the age of 65 years, but by around 6% by the age of 100 years. These graphs are consistent with the effective disincentive to save imposed by the implicit tax of the taper, but not consistent with predictions that higher mortality probabilities at older ages should induce faster rather than slower decumulation.
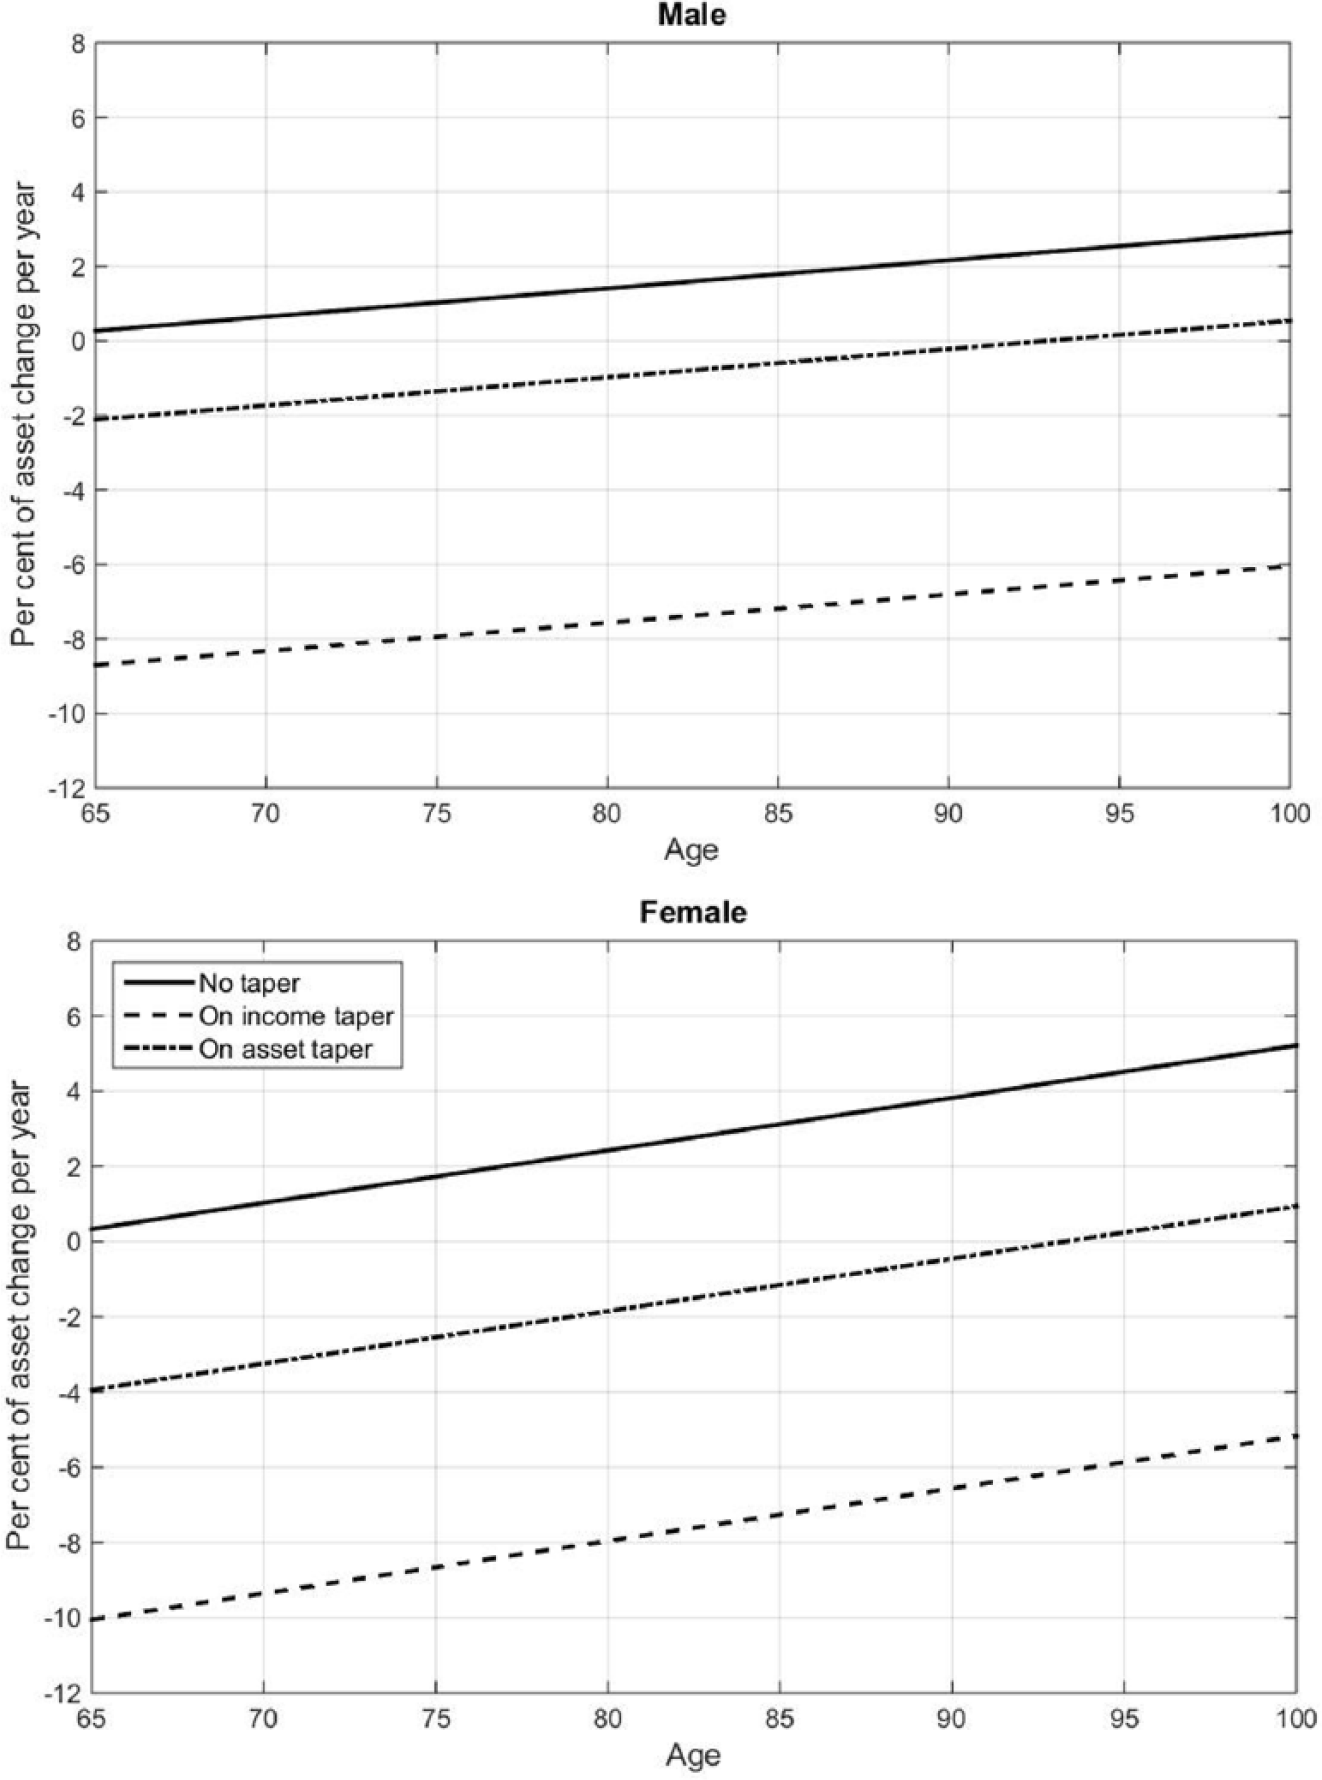
Asset drawdown rate. The figure compares the predicted asset drawdown rates from the age of 65–100 years using the estimation results of Model 2 in Table 8.
Results also show a statistically insignificant increase in assets after a home is sold. One might have expected the increase in assessable assets on the sale of a home to be larger, but for many couples a sale coincides with becoming single, which leads to a very large drop in assets, slightly mitigated for divorced, separated and widowed women. They appear to be getting a larger share of the proceeds.
6. Discussion and conclusion
In Australia, superannuation balances are preserved to a set age (55 to 60 years) but can be withdrawn as a lump sum without penalty after the age of 60 years. While more than half of balances are transferred to phased withdrawal accounts at retirement, very few Australians voluntarily annuitise to protect themselves against outliving their wealth. Current policy is wanting to support the development of financial products to help retirees draw income from their superannuation balances. Before specific changes to Age Pension, retirement incomes policies and benefit designs are made, however, industry and government need a solid understanding of the decumulation behaviour of current retirees.
We have examined the income and assessable asset records of a 1% sample of elderly retirees receiving the public Age Pension from 1999 to 2007, using a longitudinal administrative data set (LDS) supplied by the government agency, Centrelink. Since around 70% of Australians over the eligible age receive at least a part Age Pension payment, the study of age pensioners covers a wide range of household structures and wealth categories. We find considerable heterogeneity within the sample: pensioners on average pass away with almost as much wealth as they had at the beginning of the sample period, but a significant number of retirees spend or lose most of their assets or gain significantly. Further research is required to determine the reasons for losses and the extent to which they create distress as well as the reasons why pensioners preserve wealth.
Our study of decumulation shows that pension recipients are cautious rather than spendthrift in managing their retirement wealth, despite the guaranteed safety net available through the public Age Pension. At older ages in particular, pensioners preserve a buffer of financial savings in addition to the family home of around $50,000 per person. Wealthier pensioners, on average, spend down their financial assets early in retirement, but their rate of spending declines and they tend to accumulate at later ages as health and energy reduces.
We find that means-testing accelerates decumulation. Estimated decumulation rates for pensioners subject to the asset (income) taper are 9%–10% (2%–4%) p.a. higher at the age of 65 years than pensioners not subject to tapering (full-rate pensioners), declining towards 6% (0%) p.a. at older ages. Furthermore, we estimate that lower wealth full-rate pensioners add to their assessable assets at an average rate between 0% and 3% p.a., maintaining a buffer of savings. The buffer of around $50,000 per person we observe represents 4–5 years of consumption for pensioners in our sample. This is a high cushion against financial shocks. Although we do not know the precise reasons for this saving, Ameriks et al. (2015) propose that long-term care needs, health and longevity uncertainty determine saving behaviour and preferences for bequests and consumption. The results that older and less wealthy pensioners save more are consistent with this model.
Pensioners report that they are saving for bequests and inter vivos gifts, despite their limited means (REST, 2015), so a speedier transfer of wealth could be facilitated if there were products that made the pensioners more financially secure. Pensioners might be reassured if they were better informed about the protection offered by (means-tested) publicly funded medical and age care provisions. Products providing longevity, health and aged-care insurance to supplement publicly funded benefits could help to increase the welfare of retirees by reducing the need for precautionary saving.
Continuing couple households maintain ownership of the family home, but some sell when households dissolve due to death or separation. Single households over the age of 80 years show marked declines in home ownership, probably related to the demands of funding means-tested aged care. In general, dissolution of partnerships is associated with large changes in both financial and housing wealth. Homeowners consume at a higher rate than non-homeowners suggesting that they are relying to some extent on the value of their homes.
Very few Age Pension households earn labour income, so policy measures encouraging greater participation in the labour market would help diversify income among the retired.
Overall, the data suggest that age pensioners live well within their means. On average, consumption stays at modest levels, even among wealthier pension households, and poorer pension households appear to consume even less than the full pension payment. Setting aside precautionary and bequest motives, retirees could spend more in retirement and still not exhaust their assets. This suggests a greater role for policy settings and annuity designs that provide affordable insurance against risks late in life.
Footnotes
Final transcript accepted 12 November 2016 by Millicent Chang (AE Finance).
Funding
The authors disclosed receipt of the following financial support for the research, authorship, and/or publication of this article: Thorp acknowledges the support of the Australian Research Council under DP120102239. Wu acknowledges the support of Australian Research Council Centre of Excellence in Population Ageing Research under CE110001029.