
Abstract
We use the 2003 NYSE and NASDAQ listing rules for board independence as an exogenous shock to estimate the causal relation between board independence and the variability of firm performance. Using a difference-in-difference approach, we find that non-compliant firms without a majority of independent directors observe a larger decrease in the variability of firm performance than compliant firms. In particular, board independence is negatively associated with the variability of (1) monthly stock returns, (2) ROA, (3) Tobin’s Q, (4) analyst forecast inaccuracy, (5) accounting accruals, (6) extraordinary items, (7) capital expenditures, (8) cash holdings and (9) the frequency of acquisition activities. We conclude that increased board independence weakens the CEO’s power over the board and restrains corporate risk-taking; thus, decisions made by firms with more independent boards are less extreme, resulting in less variability of firm performance.
1. Introduction
As one of the most important corporate board characteristics, board independence has attracted much attention from regulators, investors, researchers and the media. Many prior studies have examined the relation between board independence and the level of corporate performance without reaching any consensus (Bhagat and Black, 2002; Bhagat and Bolton, 2008; Hermalin and Weisbach, 2003; Knyazeva et al., 2013; Pham et al., 2011). This article extends the literature by documenting a causal relation between board independence and the variability of corporate performance.
The relation between board independence and the variability of corporate performance is a theoretically ambiguous and empirically unanswered question. On the one hand, an independent corporate board of directors is often viewed as an effective way to strengthen board monitoring. According to Fama (1980), independent directors are motivated to develop and retain a good reputation in the corporate directorship market as skilled decision control experts. Thus, they are more willing to exert greater board oversight as compared to gray or inside directors. Consistent with this idea, Guo and Masulis (2015) find that more independent boards lead to increased forced CEO turnover sensitivity to firm performance. Boards with more rigorous CEO monitoring and discipline are better able to challenge and restrain CEOs. Adams et al. (2005) argue that powerful CEOs 1 tend to make more extreme corporate decisions, resulting in more variability in corporate performance. To the extent that a more independent board conducts more intensive monitoring (Hermalin and Weisbach, 1998), one can expect that a more independent board could better restrain the CEO and the firm with a less powerful CEO will experience less variable performance.
On the other hand, however, a positive relation between board independence and performance variability may exist. While independent directors are less likely to be captured by the CEO, they often have limited access to firm-specific information and face high costs in evaluating its reliability, resulting in their reduced monitoring incentives and effectiveness (Adams and Ferreira, 2007; Jensen, 1993). Independent directors also have limited financial incentives to carefully monitor the CEO as they typically hold small equity stakes in those firms where they serve as independent directors (Perry, 2000). The free-rider problem of independent directors may become more severe as board independence increases (Harris and Raviv, 2008), so that it is easier for the CEO to influence and control the board, resulting in stronger CEO power. In addition, consistent with the idea that other insiders may be rivals for the CEO’s power and position (Ocasio, 1994), a board with more independent directors and so fewer insiders may result in greater CEO power. Given the documented positive relation between CEO power and corporate performance variability (Adams et al., 2005), one can expect that firms with a more independent board and thus a more powerful CEO will experience more variable performance. Overall, which of the competing theories will dominate is unclear and this article aims to address this empirical issue.
Corporate governance literature that empirically attempts to identify any causal relationships is usually plagued by the endogeneity problem. Specifically, board structure, the need for board monitoring and advising, corporate policies and firm value are all determined endogenously within a firm. In most prior studies, results are sometimes hard to interpret because the corporate governance structure is a variable chosen by firms themselves, partially because of their specific monitoring and advising needs. Thus, coefficient estimates are likely to be biased and statistical power is likely to be reduced because of this endogeneity problem (Hermalin and Weisbach, 2003; Schultz et al., 2010). However, the passage of the Sarbanes–Oxley Act of 2002 (SOX) and the changes in listing rules in the NYSE and NASDAQ offer a unique laboratory to test the effect of board structure on corporate performance, firm value and board monitoring, as the mandated rules can be considered as an exogenous intervention to the board structure of firms.
Since the corporate scandals of large US firms in 2001 and 2002, efforts have been made by policy makers and regulators to enhance the efficacy of corporate boards – in particular, by increasing the representations of independent directors. The SOX, which was intended to be a comprehensive solution to the type of corporate malfeasance that led to the spectacular downfalls of firms such as Enron, Tyco and WorldCom (Bartov and Faurel, 2016; Linck et al., 2009), required that the audit committee be composed of entirely independent directors, while both the NYSE and NASDAQ changed their listing standards, requiring a majority of independent directors on boards and a fully independent audit, compensation and nominating committee (e.g. Chhaochharia and Grinstein, 2009; Duchin et al., 2010; Linck et al., 2009). Using the change in board structure mandated by the regulation as an exogenous shock, several recent studies examine the effect of board independence on CEO compensation and CEO turnover. For example, Guthrie et al. (2012) document evidence that when firms are forced to adopt a fully independent compensation committee, the total pay of CEOs actually increases. Guo and Masulis (2015) utilise the same experiment design and find that firms that are forced to adopt a majority independent board or a fully independent nominating committee experience statistically significant increases in the sensitivity of forced CEO turnover to firm performance after SOX, compared to firms that were already compliant with the independence rules before SOX.
This article empirically examines how board independence affects the variability of firm performance. Following recent studies (Chhaochharia and Grinstein, 2009; Guo and Masulis, 2015; Guthrie et al., 2012), we use the changes in exchange listing rules following the enactment of the SOX as an exogenous shock to identify a shift in board composition. The use of the quasi-natural experiment is a promising way to mitigate the reverse causality problem, which is usually a major endogeneity concern in the corporate governance studies. Hereafter, the SOX and the following changes in exchange listing rules will be collectively referred to as SOX for brevity. 2
Using data from 983 firms covered in the RiskMetrics (formerly Investor Responsibility Research Center (IRRC)) database on corporate directors over the 1996–2006 period, we find that the mandated board independence rule significantly decreases the variability of firm performance in the post-SOX period. This finding is based on a difference-in-difference estimation using the regulatory shock on board independence. The variation comes from the pre-SOX board composition. Firms without a majority of independent directors on the board pre-SOX are the treatment group, whereas firms already compliant with the independence requirement are the control group. Board independence is negatively associated with the variability of (1) monthly stock returns, (2) return on assets (ROA) and (3) Tobin’s Q. Specifically, treatment firms experience a greater decline in the variability of the above performance measures than control firms in the post-SOX period. The evidence is consistent with the proposition that increased board independence better restrains the CEO and weakens her power over the board and thus decisions made by firms with more independent boards are less extreme, resulting in less variability of firm performance. The results are robust to concerns regarding sample selection bias. We also conduct the heteroskedasticity tests of Glejser (1969) to a panel data to examine performance variability within and across firms. The results still hold.
Furthermore, to identify the channels through which board structure affects corporate performance, we examine several underlying channels of performance variability – namely, analyst forecast inaccuracy, accounting accruals, extraordinary items, R&D expenditures, capital expenditures, cash holdings and acquisition activities. The results show that after SOX, treatment firms observe lower within-firm, over-time variability in most (if not all) of the above factors, further supporting the view that board independence is negatively associated with the variability of firm performance.
Overall, the results of this article consistently indicate that board independence has a negative impact on performance variability. This finding makes at least three contributions to the corporate governance literature. First, this article adds to and extends the existing literature that examines the relation between board independence and corporate performance. Many prior studies examine the relation between board independence and the level of corporate performance but end up with mixed findings. Using SOX as an exogenous shock to board structure, this article provides evidence on the causal relation between board independence and performance variability. Specifically, the variability of firm performance decreases as board independence increases.
Second, the evidence adds to the debate on the costs and benefits of governance regulations (e.g. Linck et al., 2009). While opponents claim that the mandatory increases in board independence might push firms away from their optimal inside–outside director ratio and thus be value-destroying, evidence in this article suggests that the SOX mandates are at least effective in reducing the variability of firm performance and producing stability, which is especially preferable for risk-averse investors and shareholders. This could be especially important given the spectacular downfalls of large US firms and the urgent need to bolster investor confidence. While the increases in the percentage of independent directors may not be correlated with better firm performance, they effectively reduce the variability of firm performance.
Third, research on firm performance variability is limited (Adams et al., 2005; Cheng, 2008) and the findings in this article suggest that board independence is an important factor associated with the variability of firm performance. As a different aspect of firm performance, variability is of interest and importance. However, it has often been overlooked as compared to the level measure. In fact, as a second-order measure, variability is traditionally a measure of corporate risk-taking. While the level measure depicts the return, the variability measure depicts the risk, with both being indispensable elements when evaluating firm performance. Many prior studies have examined board characteristics and the level of firm performance, 3 but little attention has been paid to the variability measure. This article fills this gap.
There are two studies that are closely related to this article. Adams et al. (2005) show that firms with more powerful CEOs experience more variability in performance. They attribute the increased variability to the centralisation of CEO power, which directly affects group decision-making (Hambrick and Finkelstein, 1987; Sah and Stigliz, 1986, 1991). To the extent that an increase in the percentage of independent directors represents a real increase in board independence and that more independent boards are associated with less powerful CEOs, a larger decrease is expected in performance variability in firms significantly affected by SOX mandates relative to firms that are less affected. In fact, the empirical evidence consistently lends support to this hypothesis. Cheng (2008) extends Adams et al.’s (2005) work and examines the effect of board size on performance variability. He documents evidence that board size is negatively associated with the variability of corporate performance and firm value. 4 He argues that it takes more compromises for a larger board to reach consensus, and thus decisions made by such boards are less extreme, leading to less performance variability. Cheng (2008) includes the percentage of independent directors as an explanatory variable in the regressions but finds insignificant coefficient estimates. We argue that Cheng’s (2008) failure to find a significant effect of board independence on performance variability is most likely due to the overlooked reverse causality problem. After all, it is unclear whether a particular board structure leads to certain decisions or whether boards that make certain decisions tend to have particular board structures (Guo and Masulis, 2015). We overcome this concern by utilising an exogenous shock so that the evidence documented in this article is causal.
The rest of this article is organised as follows. Section 2 describes the data construction and estimation methodology. The empirical results are presented in section 3, and robustness checks are conducted in section 4. Several underlying channels through which board independence can affect performance variability are explored in section 5. Section 6 concludes the article.
2. Data and methodology
2.1. Data and sample
We obtain data on boards of directors of S&P 1500 firms from RiskMetrics (formerly IRRC) database, over the 1996–2006 period. The information most relevant to this article includes board size, CEO–chairman duality and independence status of directors. Firm stock returns are from the Center for Research in Security Prices (CRSP) database, financial and accounting items are from Compustat, data on analyst forecasting are from I/B/E/S, the number of blockholders are from Thomson Reuters Institutional Holdings (13F) Database and data on acquisitions are from SDC. As is standard in the literature, we exclude firms in the financial (with two-digit SIC code 60–69) and utility industries (with two-digit SIC code 49). Following Guo and Masulis (2015), we require that (1) sample firms must have non-missing director independence data in fiscal year 2001 and (2) their common stock is listed on the NYSE or NASDAQ from 2001 until at least 2004. The first requirement enables us to classify firms at year-end 2001 by compliant and non-compliant status. In particular, we use board structure in fiscal year 2001 to divide firms into a treatment group (where firms were not compliant with the listing rules that the board be composed of a majority of independent directors) and a control group (where firms were already compliant with the listing rules). The second requirement that firms survive the 2001–2004 period ensures that sample firms are subject to regulatory shocks and our results are not simply driven by firms entering and exiting the sample before or after the adoption of the listing rules. For firms in the control group, we define the pre-SOX period as 1996–2001 and the post-SOX period as 2002–2006. For firms in the treatment group, we define the pre-SOX period as years in which the firm did not meet the independence rule and the post-SOX period as years after the firm became compliant with the rule. Note that we do not simply use year 2002 or 2003 as a cut-off point; instead, the exact year is used when each firm became compliant with the rule to define the pre- and post-SOX periods. This method is superior to many prior studies, as it provides more accurate difference-in-difference estimations. 5 We further require that each firm should have at least two usable observations for both periods so that we are able to compute standard deviations for the variables. The final sample consists of 983 firms, representing 57 two-digit SIC code industries. In total, 730 firms are classified as control firms and 253 firms are treatment firms. The number of observations may vary in different analyses due to data availability. Variable definitions are provided in Appendix 1. All accounting variables are winsorised on both sides at the 0.5% level so that outliers will not drive/bias the results.
2.2. Methodology
To measure the treatment effect of the mandated independence requirement on the variability of firm performance, we adopt a difference-in-difference approach (e.g. Chhaochharia and Grinstein, 2009; Guo and Masulis, 2015). Following Adams et al. (2005) and Cheng (2008), we focus on within-firm, over-time variability of firm performance and estimate the following regression.
Standard deviation of monthly stock returns (or annual ROA, or Tobin’s Q) =
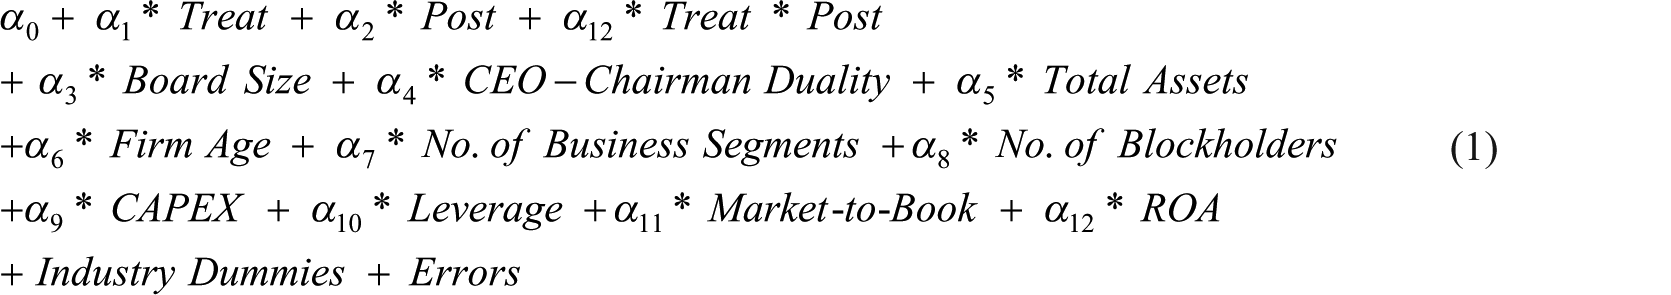
Within-firm, over-time variability in stock performance (or accounting performance, or corporate value) is defined as the standard deviation of the firm’s monthly stock returns (or annual ROA, or Tobin’s Q) over the pre- and post-SOX periods, respectively; thus, every sample firm has one observation for the pre-SOX period and one for the post-SOX period. The independent variables are averaged over the pre- and post-SOX periods, respectively. The coefficient of main interest is α12. It measures the change in performance variability in treatment firms relative to control firms from before to after the treatment. If the board independence rule mandated by SOX has caused lower variability of firm performance, then it is expected that the estimate for α12 will be negative and statistically significant. It is worth noting that coefficient α1 measures the difference in performance variability between treatment firms and control firms in the pre-SOX period, while coefficient α2 measures the difference in performance variability for control firms between post-SOX period and pre-SOX period.
3. Empirical results
3.1. Summary statistics
Table 1 presents the summary statistics for variables used in this article. We split the sample into treatment and control groups, and compare them in pre- and post-SOX periods, respectively.
Summary statistics. The sample consists of 983 firms in the RiskMetrics database over the period 1996–2006. Firms that did not have a majority of independent directors on their boards by 2001 are classified as treatment firms, whereas firms that were already compliant with the rule by 2001 are classified as control firms. For firms in the control group, we define the pre-SOX period as 1996–2001 and the post-SOX period as 2002–2006. For firms in the treatment group, we define the pre-SOX period as years in which the firm did not meet the independence rule, and the post-SOX period as years after the firm became compliant with the rule. All variables are defined in Appendix 1 and winsorised on both sides at the 0.5% level. Panel A (B) contains sample means of the independent (dependent) variables for treatment and control firms in the pre- and post-SOX periods, respectively. p-values are from t-tests for mean comparison. ***, ** and * denote significance at the 1%, 5% and 10%, respectively.
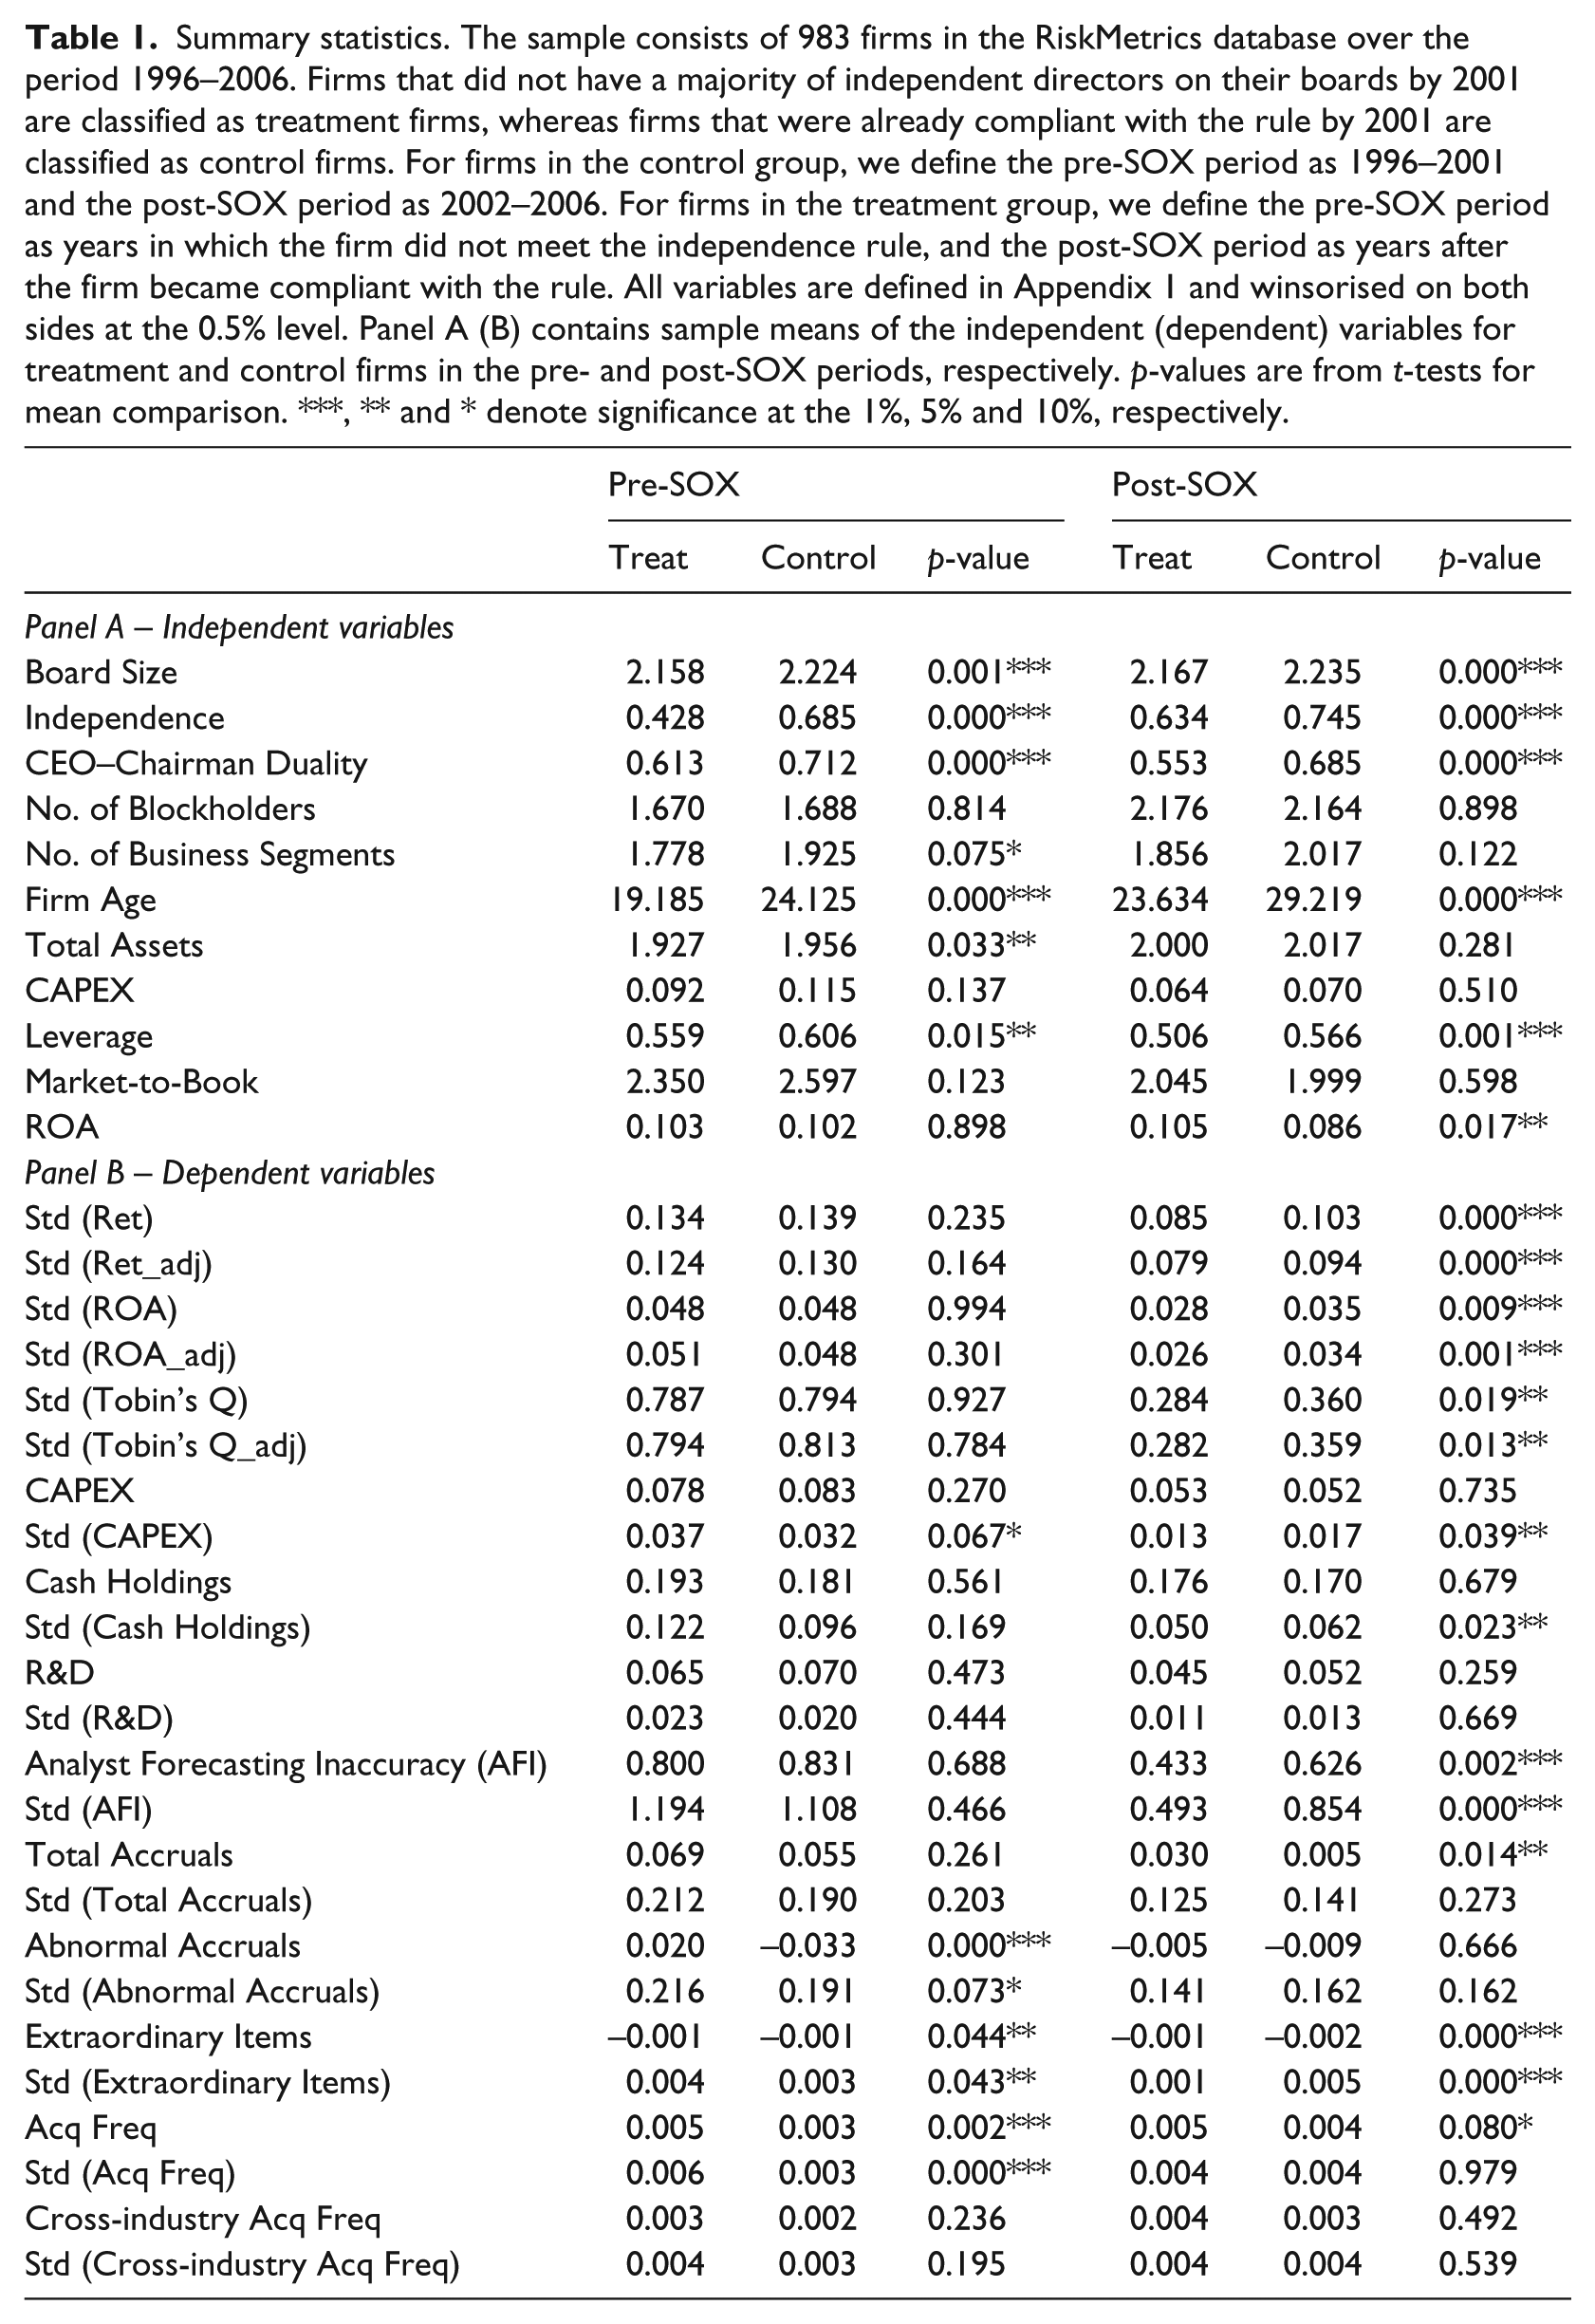
The results in Panel A indicate that control firms have larger boards than treatment firms in both pre- and post-SOX periods. The difference is significant at the 1% level for both periods. In the pre-SOX period, control firms have 68.5% independent directors on the board, whereas treatment firms have 42.8%. In the post-SOX period, due to the enactment of the regulation, both groups increase the proportion of independent directors; however, the percentage difference still remains significant at 1% level. In terms of the CEO–chairman duality, control groups are more likely to have a CEO who simultaneously holds the chairman title than treatment firms, irrespective of the sample period. In both periods, control firms are slightly larger than treatment firms, but the significant difference disappears in the post-SOX period. Control firms consistently have higher leverage ratios than treatment firms, but both types of firms experience decline in this ratio in the post-SOX period. Control firms are older than treatment firms in terms of firm age. Differences in capital expenditures, ROA, market-to-book ratio, number of business segments or number of block shareholders are not significant between the two groups.
It is possible that there is a linear relationship between our main test variables (Treat, Post and Treat*Post) and other control variables. To address this potential multicollinearity concern, we calculate the Variance Inflation Factor (VIF)
Panel B presents evidence on the changes of variability of firm performance from the pre- to post-SOX period for control and treatment firms, respectively. In general, (1) there is little difference in most of the measures in the pre-SOX period between the two groups, (2) the differences become significant for most of the measures in the post-SOX period and (3) more importantly, both groups experience declines in the measures of performance variability, with treatment firms observing even larger decreases. For example, in the pre-SOX period, there is no difference (0.048 vs 0.048) in the variability of firm accounting performance, as measured by the standard deviation of ROA, between treatment and control firms. However, in the post-SOX period, the difference becomes significant, with both types observing declines and treatment firms having a much lower number (0.028 vs 0.035). That is, compared to control firms, treatment firms experience a much lower variability of firm accounting performance in the post-SOX period. Evidence on stock return performance and corporate value (as measured by Tobin’s Q) yields the same results. Moreover, changes in the factors that are potentially related to firm performance variability also exhibit a similar pattern. The variability of accounting accruals, extraordinary items, analyst forecast inaccuracy, capital expenditures, cash holdings and the frequency of acquisition activities is consistently and significantly lower in the post-SOX period for treatment firms relative to control firms. The univariate results seem to suggest that the independent board requirement mandated by SOX significantly decreases the variability of firm performance, especially for treatment firms that were forced to adopt the independence rule. While we do not include any other control variables in this part, we will do so in the following multivariate analysis.
3.2. Multivariate regressions
Under a multivariate framework, we examine the effect of independent board requirement on within-firm, over-time variability of corporate performance and value. This approach is said to help alleviate the concern that differences in cross-sectional variability in performance are driving the results (Adams et al., 2005; Cheng, 2008).
The results are presented in columns 1, 3 and 5 of Table 2. As shown, the independent board requirement mandated by SOX has a significantly negative effect on the variability of firm performance. This result is consistent across the three columns, where the key independent variable Treat*Post is significantly negative. In particular, the coefficient on the interaction term Treat*Post is significantly negative for the standard deviation of monthly stock return at the 1% significance level, annual ROA at the 5% significance level and Tobin’s Q at the 1% significance level, indicating that treatment firms experience significantly lower variability of firm performance in the post-SOX period due to the mandated increase in board independence.
Board independence and variability of firm performance. This table presents the results on the relation between board independence and within-firm, over-time variability of the firm’s stock performance, accounting performance and corporate value. All variables are defined in Appendix 1 and winsorised on both sides at the 0.5% level. The independent variables are averaged over the pre- and post-SOX periods, respectively. The dependent variables are the standard deviations of corresponding performance measures, calculated over the pre- and post-SOX periods, respectively. Each firm has only one observation for the pre-SOX period and one for the post-SOX period. Industry-fixed effects are included in all columns. Robust p-values are presented in the parentheses next to the estimates, with ***, ** and * denoting significance at 1%, 5% and 10%, respectively.
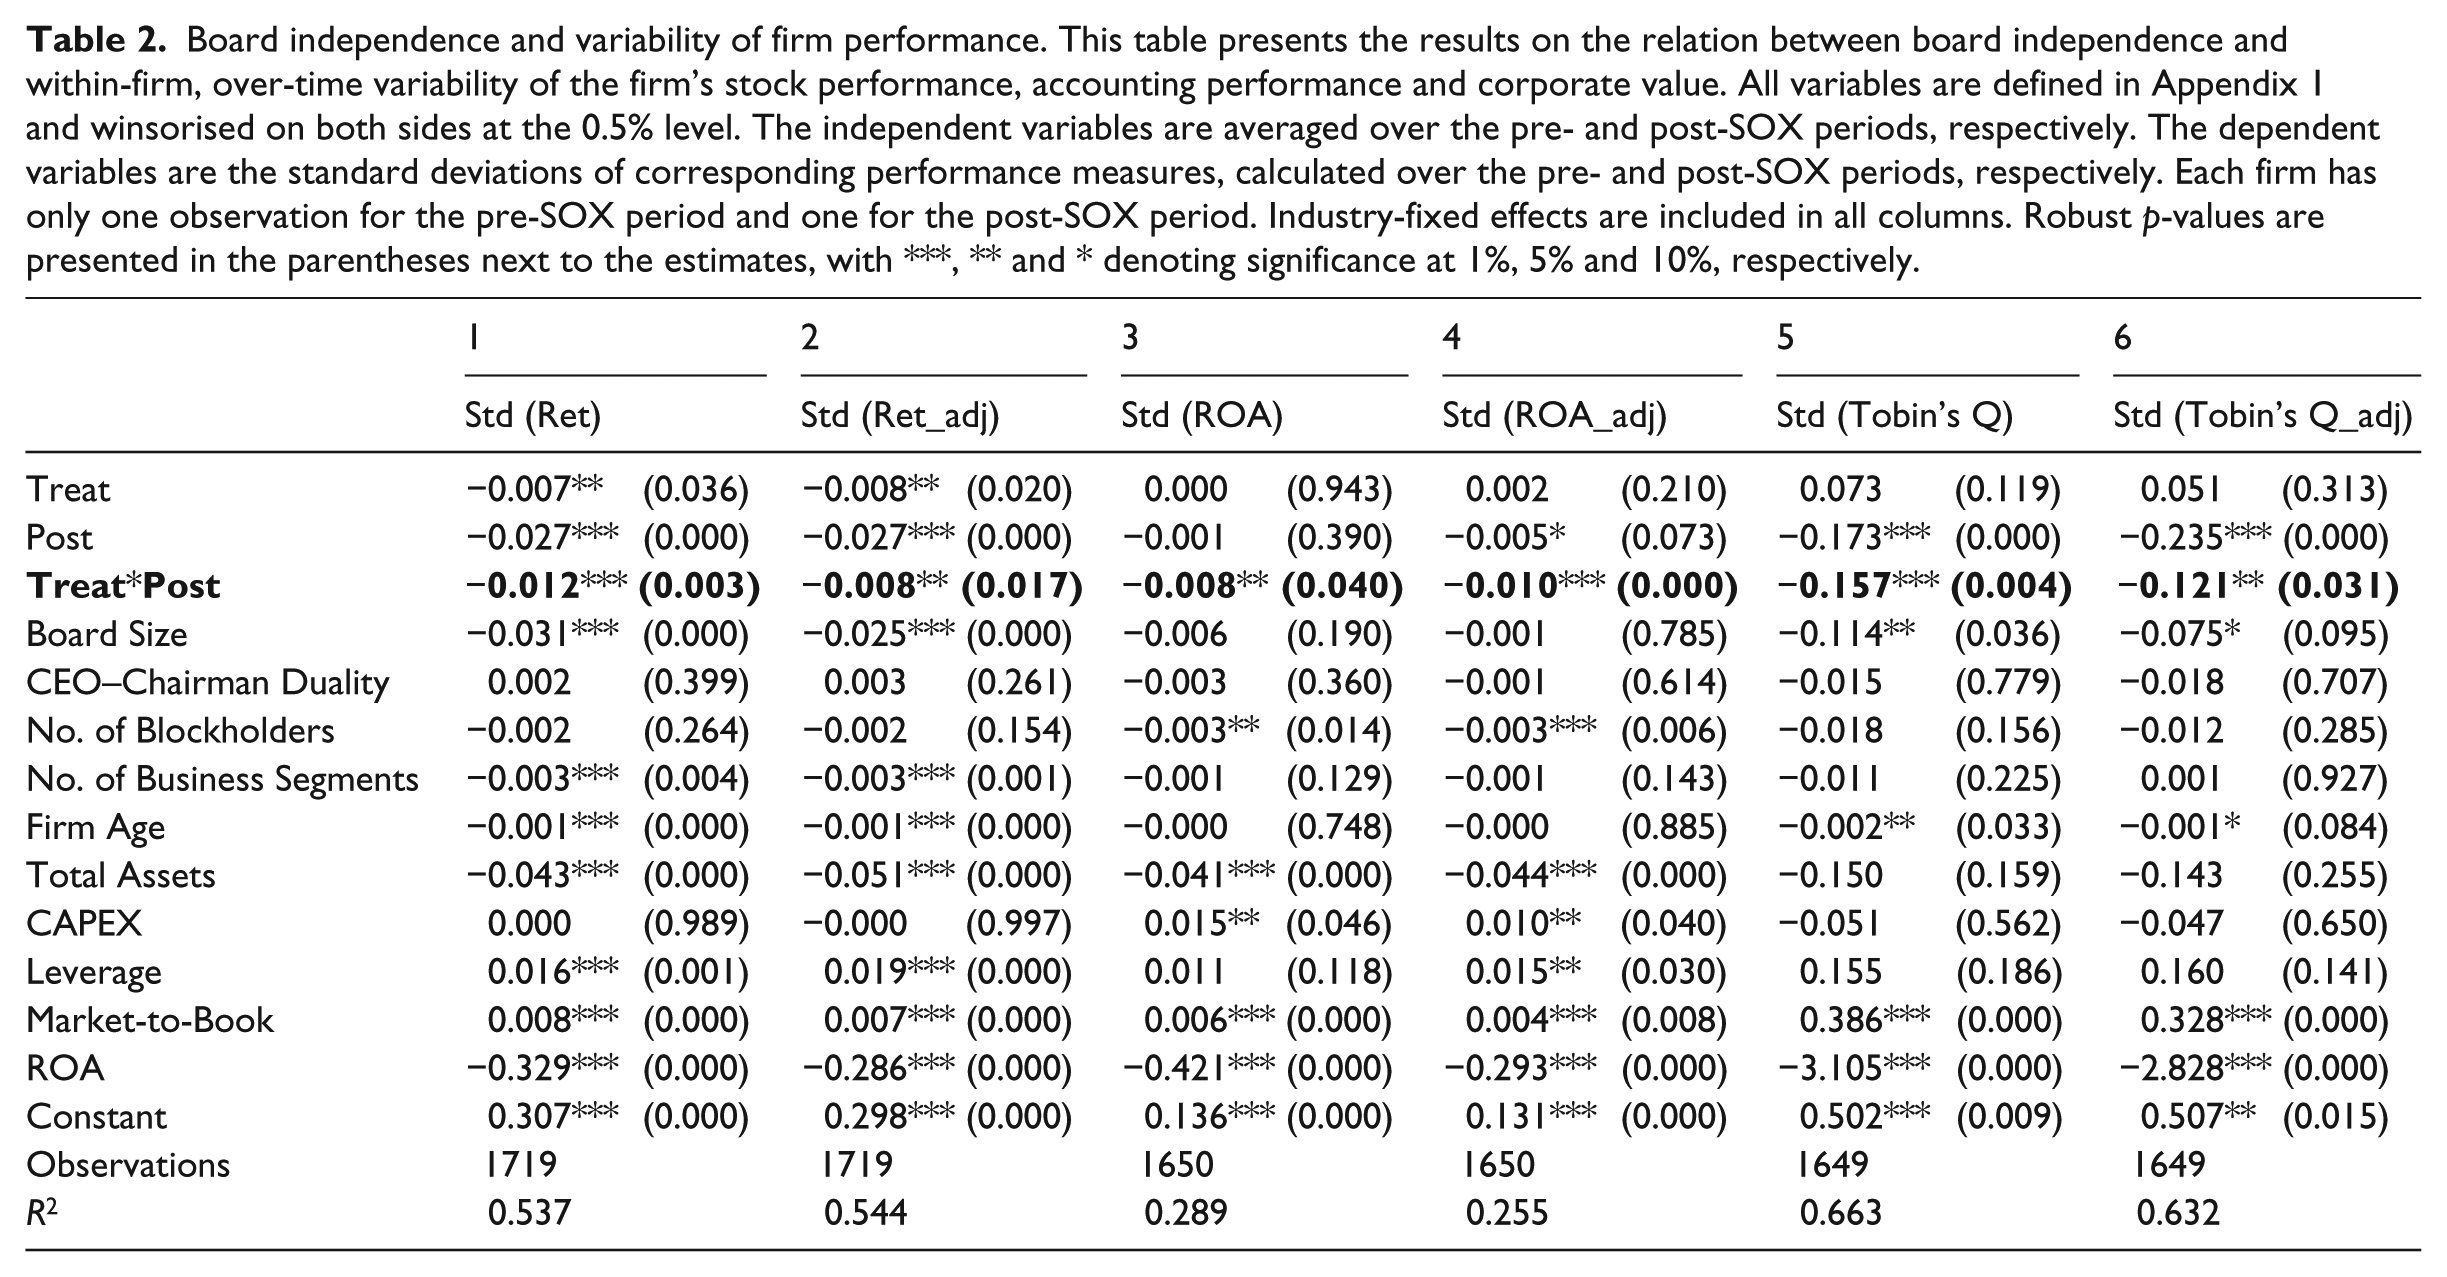
Other control variables are largely consistent with prior studies (Adams et al., 2005; Cheng, 2008) in terms of the sign and significance. For example, evidence supports Cheng’s (2008) main finding that board size is negatively associated with the variability of firm performance and value. Specifically, in the stock return regression, for example, the coefficient on board size is significantly negative, suggesting that as a board increases in size, stock return becomes less variable. Firm size, firm age and diversification also reduce stock return variability.
In order to capture some ‘unexpected’ accounting and stock performance, we further consider three adjusted dependent variables. Specifically, we calculate (1) the market-adjusted monthly stock return by subtracting the market’s value-weighted stock return from the firm’s monthly stock return, (2) the industry-adjusted ROA by subtracting the average ROA of the firms in the same two-digit SIC code industry from the firm’s annual ROA and (3) the industry-adjusted Tobin’s Q by subtracting the average Tobin’s Q of the firms in the same two-digit SIC code industry from the firm’s Tobin’s Q. The results are presented in columns 2, 4 and 6 of Table 2. Robust and consistent results are found, despite the use of adjusted performance and value measures. The interaction variable Post*Treat has a significantly negative coefficient, supporting the findings in the basement regressions in columns 1, 3 and 5.
It is worth noting that the post-SOX dummy variable Post has significantly negative coefficients in five of the six columns. It indicates that for control firms, they experience significantly smaller variability in firm performance in the post-SOX period relative to the pre-SOX period. This interpretation is intuitive and consistent with the evidence in Panel B of Table 1. Control firms, similar to treatment firms, also experience declines in performance variability upon the enactment of the SOX mandates. This fact further justifies the use of the difference-in-difference method in this article, which captures the real effect of the SOX mandates on the variability of firm performance.
4. Robustness checks
4.1. Subsample analyses
Prior studies have established that board structure – in particular, board independence and board size – is not one-size-fits-all. For example, Coles et al. (2008) find that complex firms, with more advising needs than simple firms, have larger boards with more outside directors. Thus, it is possible that the results in Table 2 are driven by complex firms. We address this concern by using firm size and firm value as proxies for corporate complexity. We divide the sample firms into two groups based on firm size and Tobin’s Q, respectively. Thus, for each of the performance variability measures, we have two subsamples – firms with below median firm size (Tobin’s Q) and firms with above median firm size (Tobin’s Q). We then re-estimate Model (1) for the subsamples.
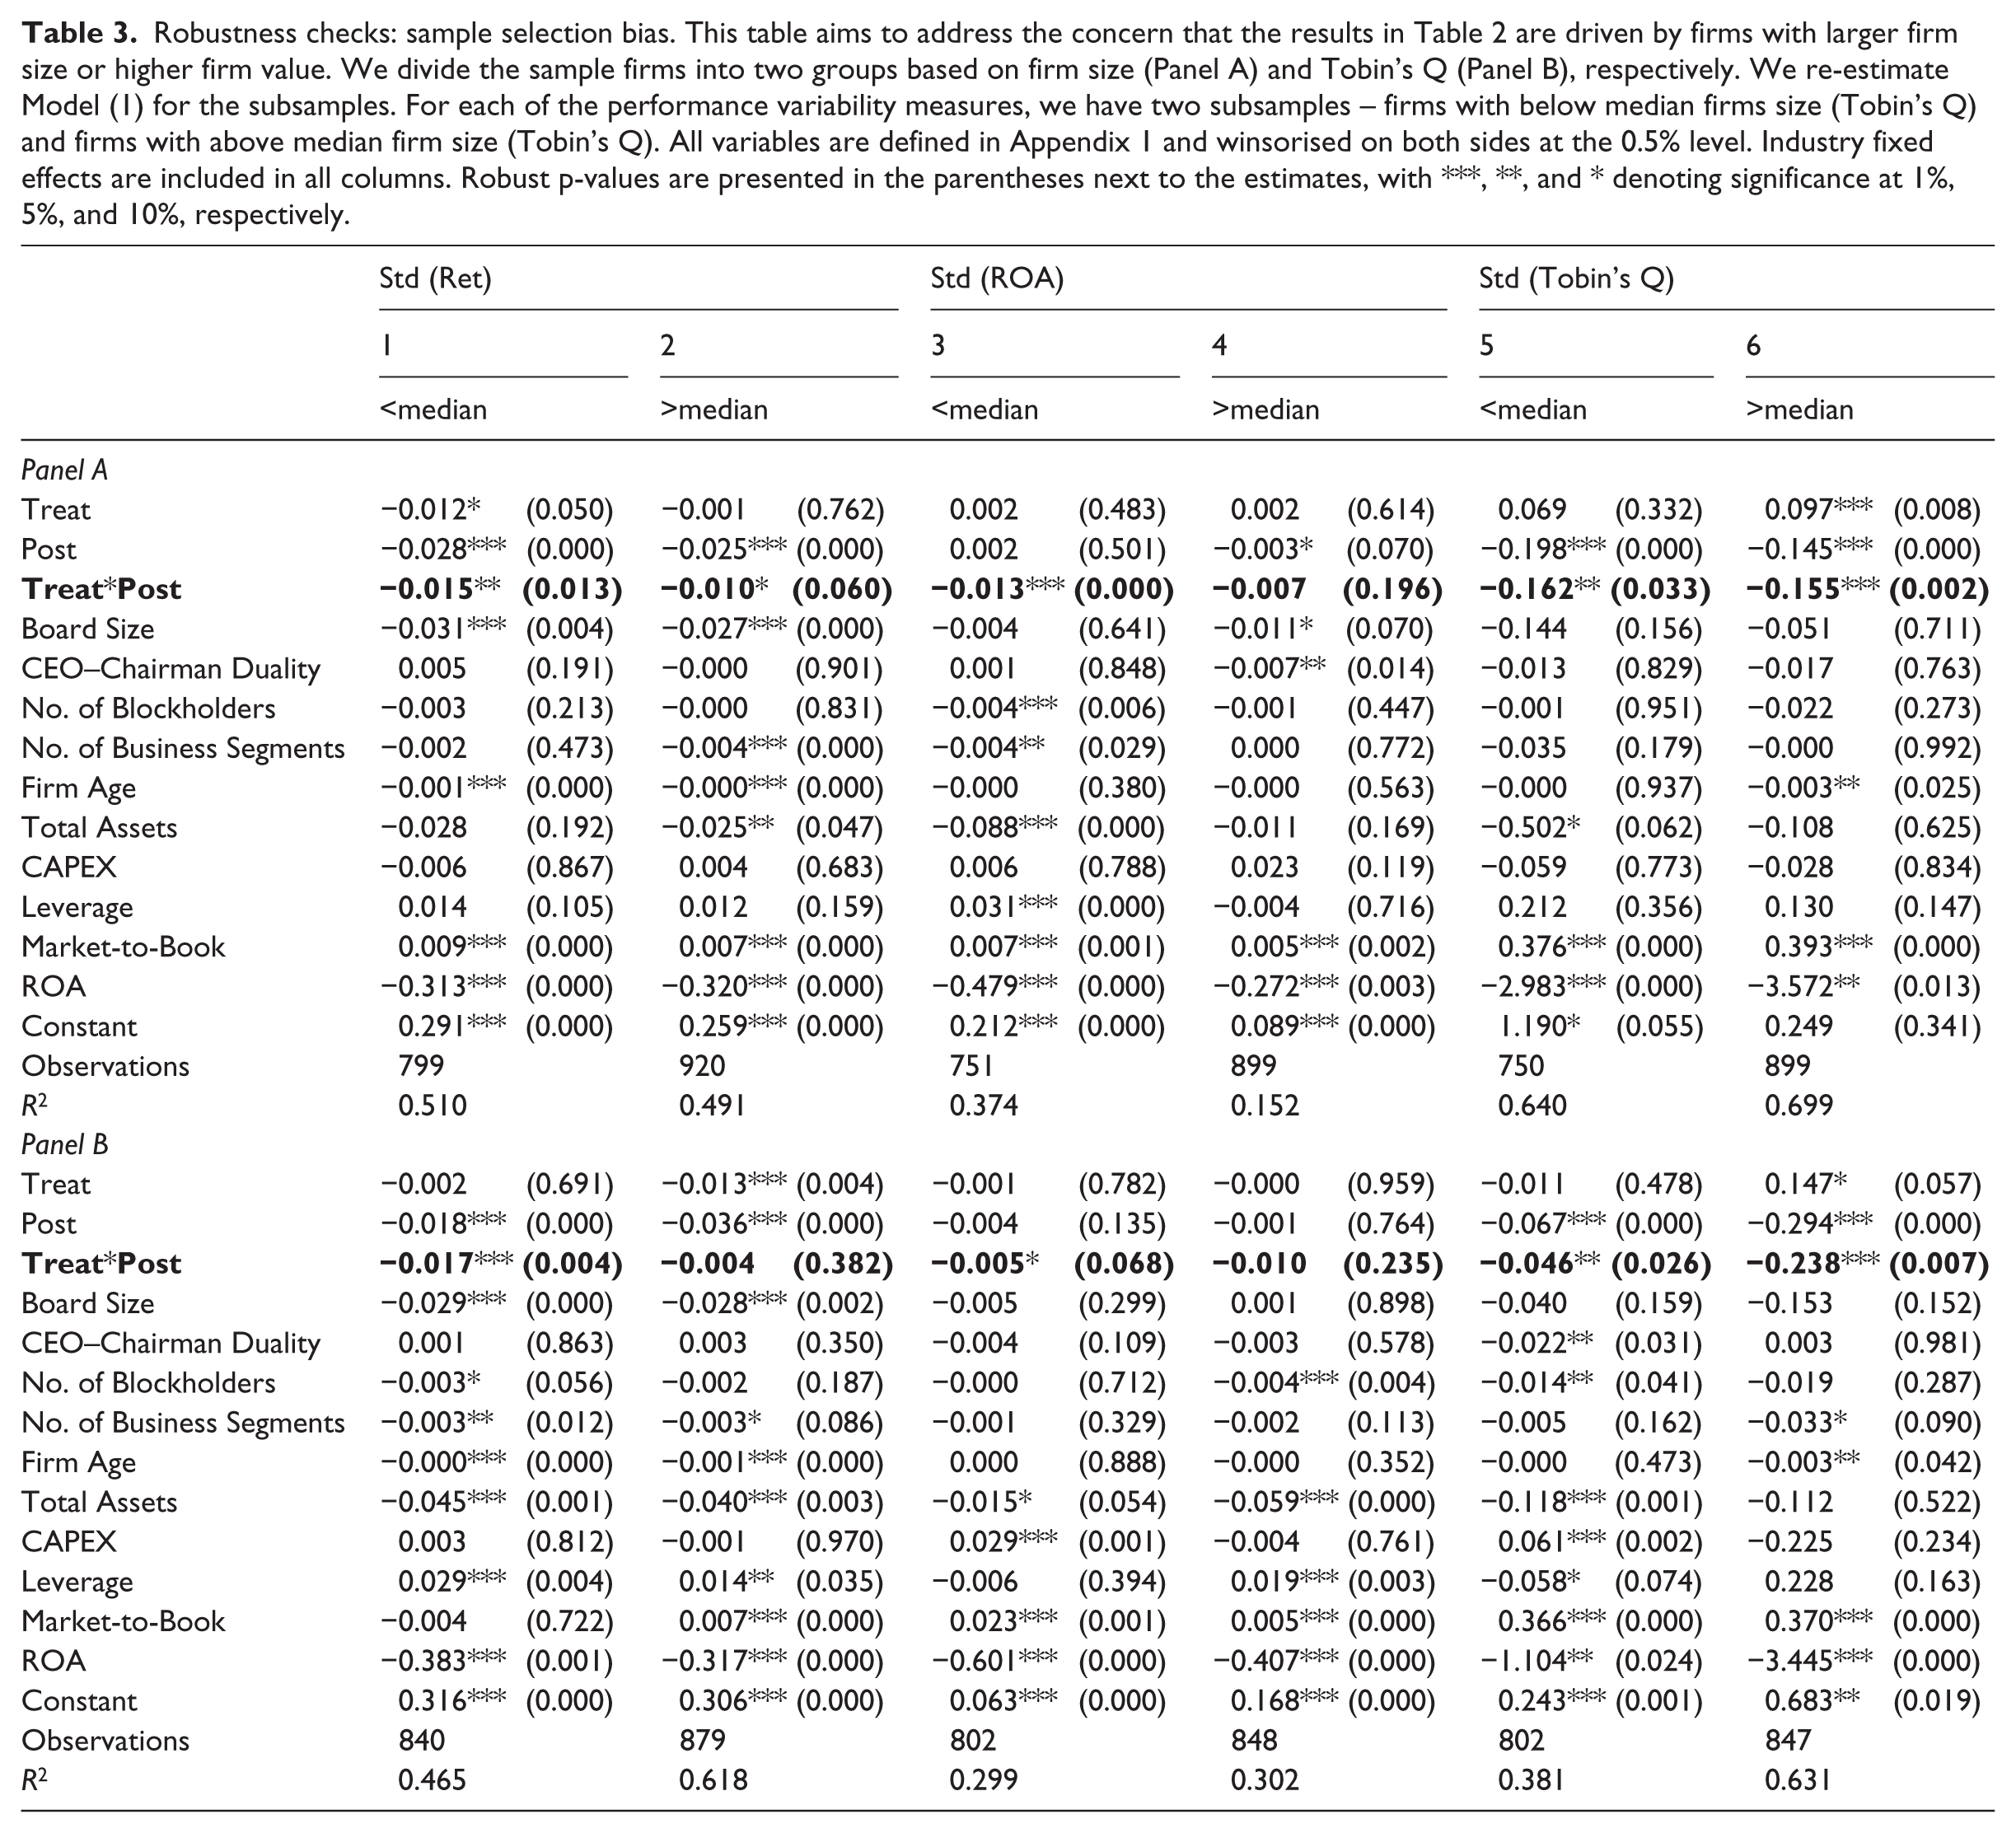
The results are reported in Table 3. Panel A is based on firm size as measured by the total book assets and Panel B is based on firm value as measured by Tobin’s Q. The results for the subsamples are largely consistent with those in Table 2. In terms of firm size, the coefficient estimate for the key variable Treat*Post is consistently and significantly negative across the six columns, except for larger firms in the ROA column (the coefficient is still negative with a p-value less than 20%), suggesting that in the post-SOX period, treatment firms experience significantly lower variability of firm performance, irrespective of their firm size. We find similar results in terms of firm value. To summarise, the evidence in this part confirms our findings in Table 2 and mitigates the concerns related to sample selection bias.
Robustness checks: sample selection bias. This table aims to address the concern that the results in Table 2 are driven by firms with larger firm size or higher firm value. We divide the sample firms into two groups based on firm size (Panel A) and Tobin’s Q (Panel B), respectively. We re-estimate Model (1) for the subsamples. For each of the performance variability measures, we have two subsamples – firms with below median firms size (Tobin’s Q) and firms with above median firm size (Tobin’s Q). All variables are defined in Appendix 1 and winsorised on both sides at the 0.5% level. Industry fixed effects are included in all columns. Robust p-values are presented in the parentheses next to the estimates, with ***, **, and * denoting significance at 1%, 5%, and 10%, respectively.
4.2. Glejser’s tests
Section 3 has examined the effect of independent board requirement on within-firm, over-time variability of corporate performance and value. However, performance variability could also arise across firms. Hence, following Adams et al. (2005) and Cheng (2008), we perform the Glejser’s (1969) heteroskedasticity tests and use pooled time-series and cross-section data to examine the effect of board independence on performance variability in two steps.
In step 1, we estimate ordinary least squares (OLS) regressions of corporate performance and value on standard predictors. We then obtain the residuals and use their absolute values as dependent variables to re-estimate Model (1) using panel data in step 2. The absolute values of the residuals from step 1 serve as reasonable proxies for the variability of firm performance and value, in that these residuals largely represent ‘unexpected’ firm performance and value.
Specifically, to obtain the residuals of monthly stock returns in step 1, we estimate the three-factor Fama and French (1993) model without intercept for each firm from 1996 to 2006

where MKTRF is the excess monthly market return over the risk-free rate, with the market return being the value-weighted return on all stocks; SMB is the difference in return between small firms and big firms; and HML is the difference between high book-to-market equity returns and low book-to-market equity returns. 6
To obtain the residuals of the annual ROA, we estimate panel regression using firm-year observations
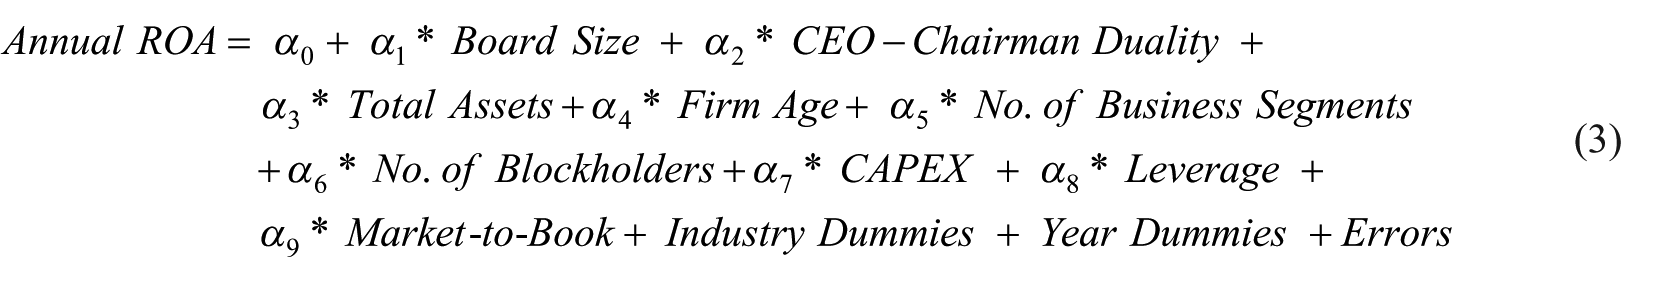
Similarly, to obtain the residuals of Tobin’s Q, we estimate the following regression
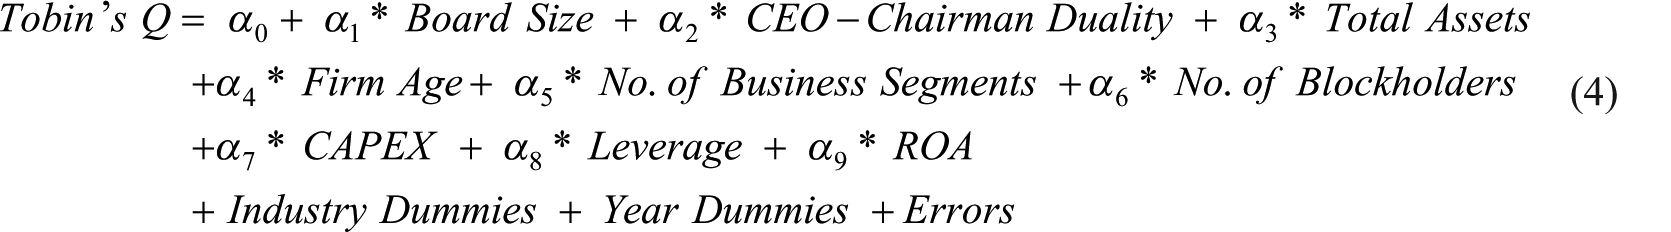
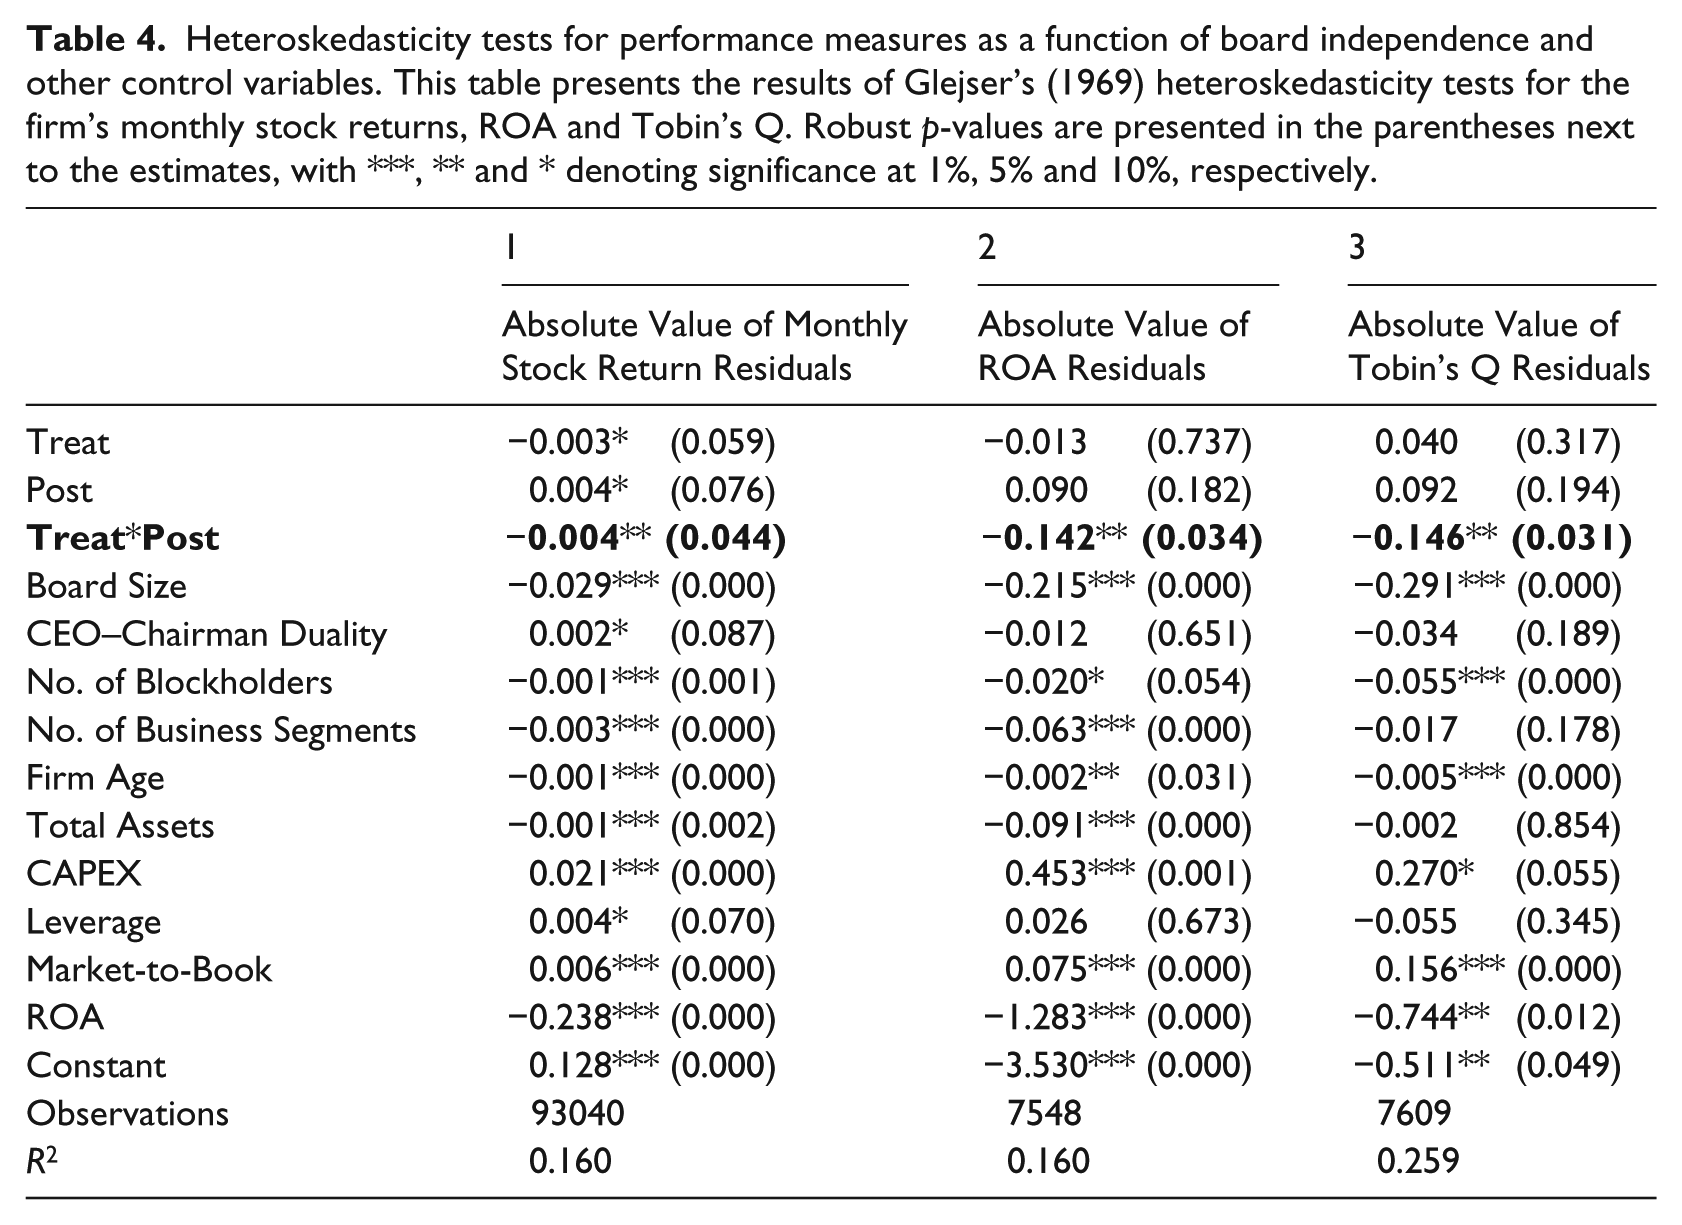
We take the absolute values of the residuals from Models (2), (3) and (4) as ‘abnormal’ stock returns, ‘abnormal’ ROA and ‘abnormal’ Tobin’s Q, respectively, and use them as dependent variables to re-estimate Model (1). Table 4 presents the step 2 results of Glejser’s (1969) heteroskedasticity tests. They are consistent across the three columns. In particular, the key independent variable Treat*Post is significantly negative at the 5% level for all three regressions, indicating that in the post-SOX period, treatment firms experience less variable performance and value.
Heteroskedasticity tests for performance measures as a function of board independence and other control variables. This table presents the results of Glejser’s (1969) heteroskedasticity tests for the firm’s monthly stock returns, ROA and Tobin’s Q. Robust p-values are presented in the parentheses next to the estimates, with ***, ** and * denoting significance at 1%, 5% and 10%, respectively.
4.3. Board independence versus board cooption
Coles et al. (2014) show that board cooption is another relevant measure of board characteristics. They argue that board cooption captures the board’s bargaining power relative to the CEO and independent directors who joined the board during the rein of the CEO are likely to feel indebted to the CEO and thus be beholden to the CEO. If as per SOX, a firm increases its board’s independence by bringing in new board members, this actually increases the degree of board cooption, making the board more beholden to the CEO and weakening its bargaining power relative to the CEO. Thus, the ‘cooption’ interpretation could be viewed as a competing theory of the interpretation in this article. Given the opposite possible interpretations, cooption works against finding any significant effect of board independence on the variability of firm performance.
To empirically address this concern, we add the cooption variable into our regressions as a control variable to see whether the inclusion of this variable attenuates the effect of board independence. Specifically, we follow Coles et al. (2014) to calculate ‘cooption’ as the percentage of independent directors who were appointed after the CEO took office. Results are reported in Table 5.
Addressing the concern on board cooption. This table presents the results on the relation between board independence, board cooption and within-firm, over-time variability of the firm’s stock performance, accounting performance and corporate value. The independent variables are averaged over the pre- and post-SOX periods, respectively. The dependent variables are the standard deviations of corresponding performance measures, calculated over the pre- and post-SOX periods, respectively. Each firm has only one observation for the pre-SOX period and one for the post-SOX period. Industry fixed effects are included in all columns. Robust p-values are presented in the parentheses next to the estimates, with ***, ** and * denoting significance at 1%, 5% and 10%, respectively.
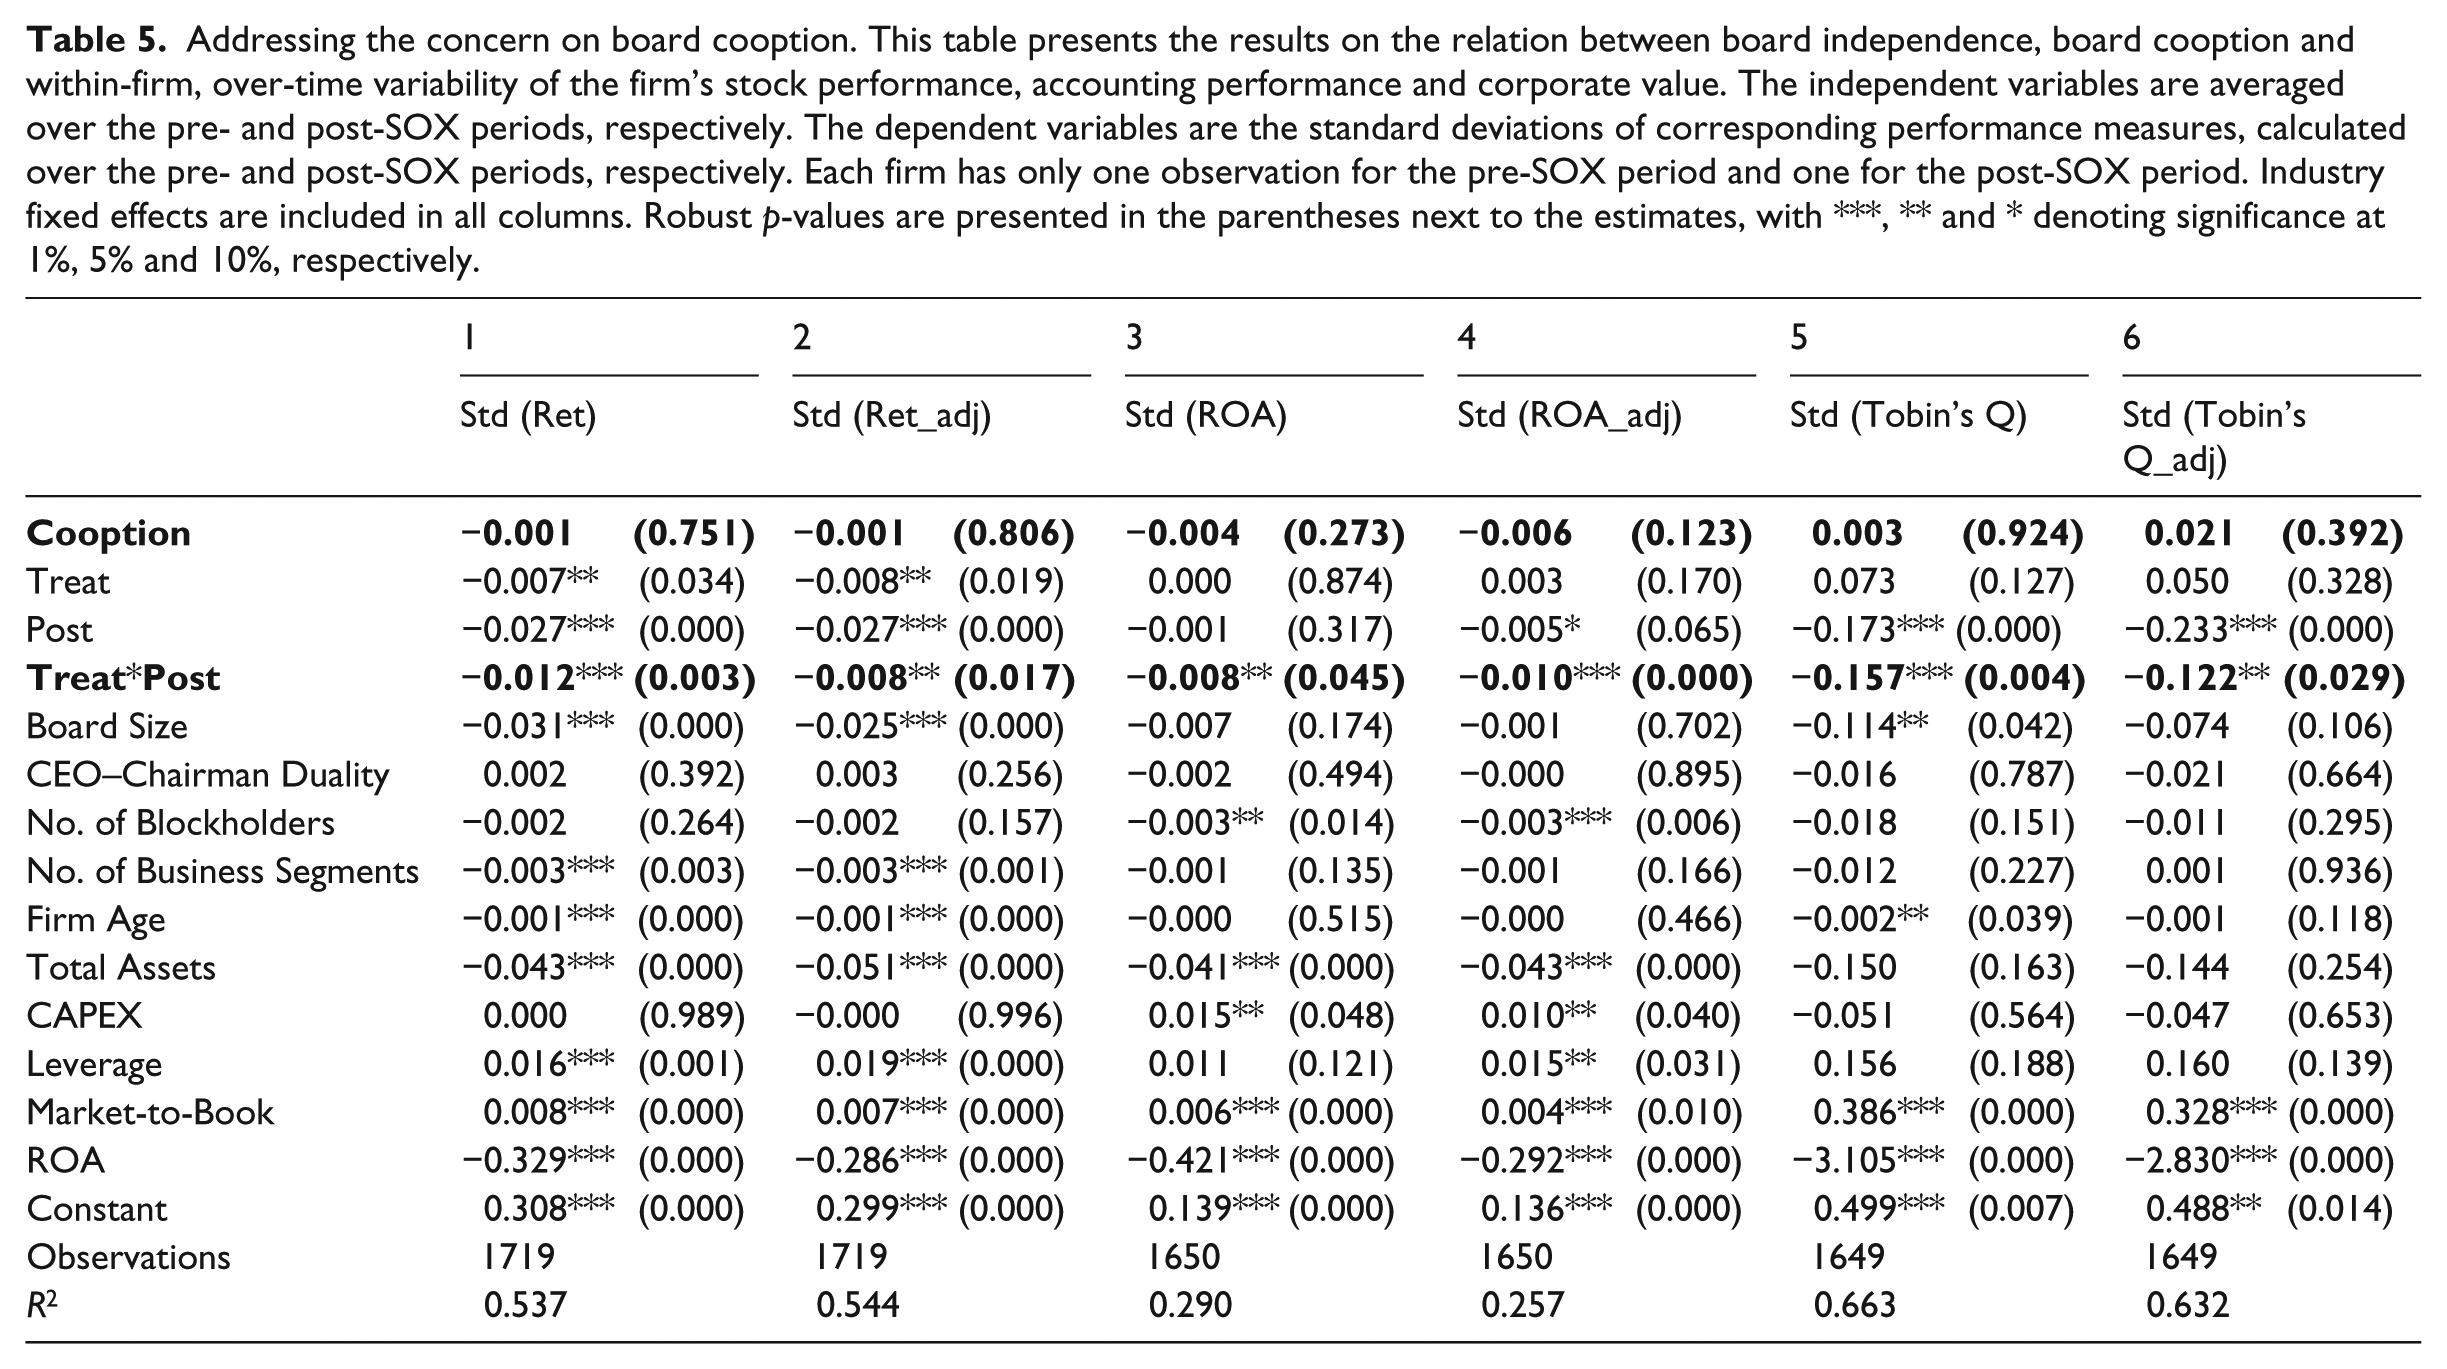
Comparing the results with those in Table 2, we find that the inclusion of the cooption variable does not change the sign, the economic magnitude or the significance of the estimated coefficients on other independent variables. Specifically, the cooption variable itself is insignificant in all the six columns. Our main variable of interest, the interaction term, is significantly negative across the six columns, suggesting that the treatment firms experience significantly lower variability of firm performance in the post-SOX period due to the mandated increase in board independence. This effect is not affected or attenuated by the cooption variable.
Overall, the results in sections 3 and 4 show a significantly negative association between board independence and firm performance variability, in both within-firm and panel data analyses.
5. Underlying channels of performance variability
Our results reported above indicate that the mandated independence rule has a significantly negative effect on the variability of firm performance. However, the reported results have not identified any channels through which board independence can potentially impact performance variability. This section aims to shed light on this question by examining several factors that are found to be associated with performance variability – namely, analyst forecast inaccuracy, accounting accruals, extraordinary items, R&D expenditures, capital expenditures, cash holdings and acquisition activities (Cheng, 2008). We focus on both the levels and variances of these factors, as both are potentially related to the variability of firm performance.
5.1. Analyst forecasting
Analyst forecast inaccuracy could be a possible source of the variability of firm performance. Powerful CEOs are more likely to make extreme decisions (Adams et al., 2005) so that it is more difficult for analysts to make accurate forecast. When actual earnings deviate from analyst forecast, stock market reactions can be dramatic, leading to volatility in the firm’s stock performance (Degeorge et al., 1999). To the extent that board independence reduces the power of CEOs, we posit that firms with more independent boards have more stable operations, so that they experience less variable analyst forecast inaccuracy.
Analyst forecast inaccuracy (AFI) is defined as the absolute value of the difference between actual and forecasted earnings per share, scaled by the absolute value of actual earnings per share. Also, we take into consideration the industry effects by calculating industry-adjusted AFI. Specifically, for each firm-quarter, we calculate the adjusted measure by subtracting the median value of AFI for firms in the same two-digit SIC code industry for the same quarter from the firm’s AFI. Furthermore, we also calculate both the means and standard deviations of AFI and industry-adjusted AFI and use them as dependent variables to re-estimate Model (1).
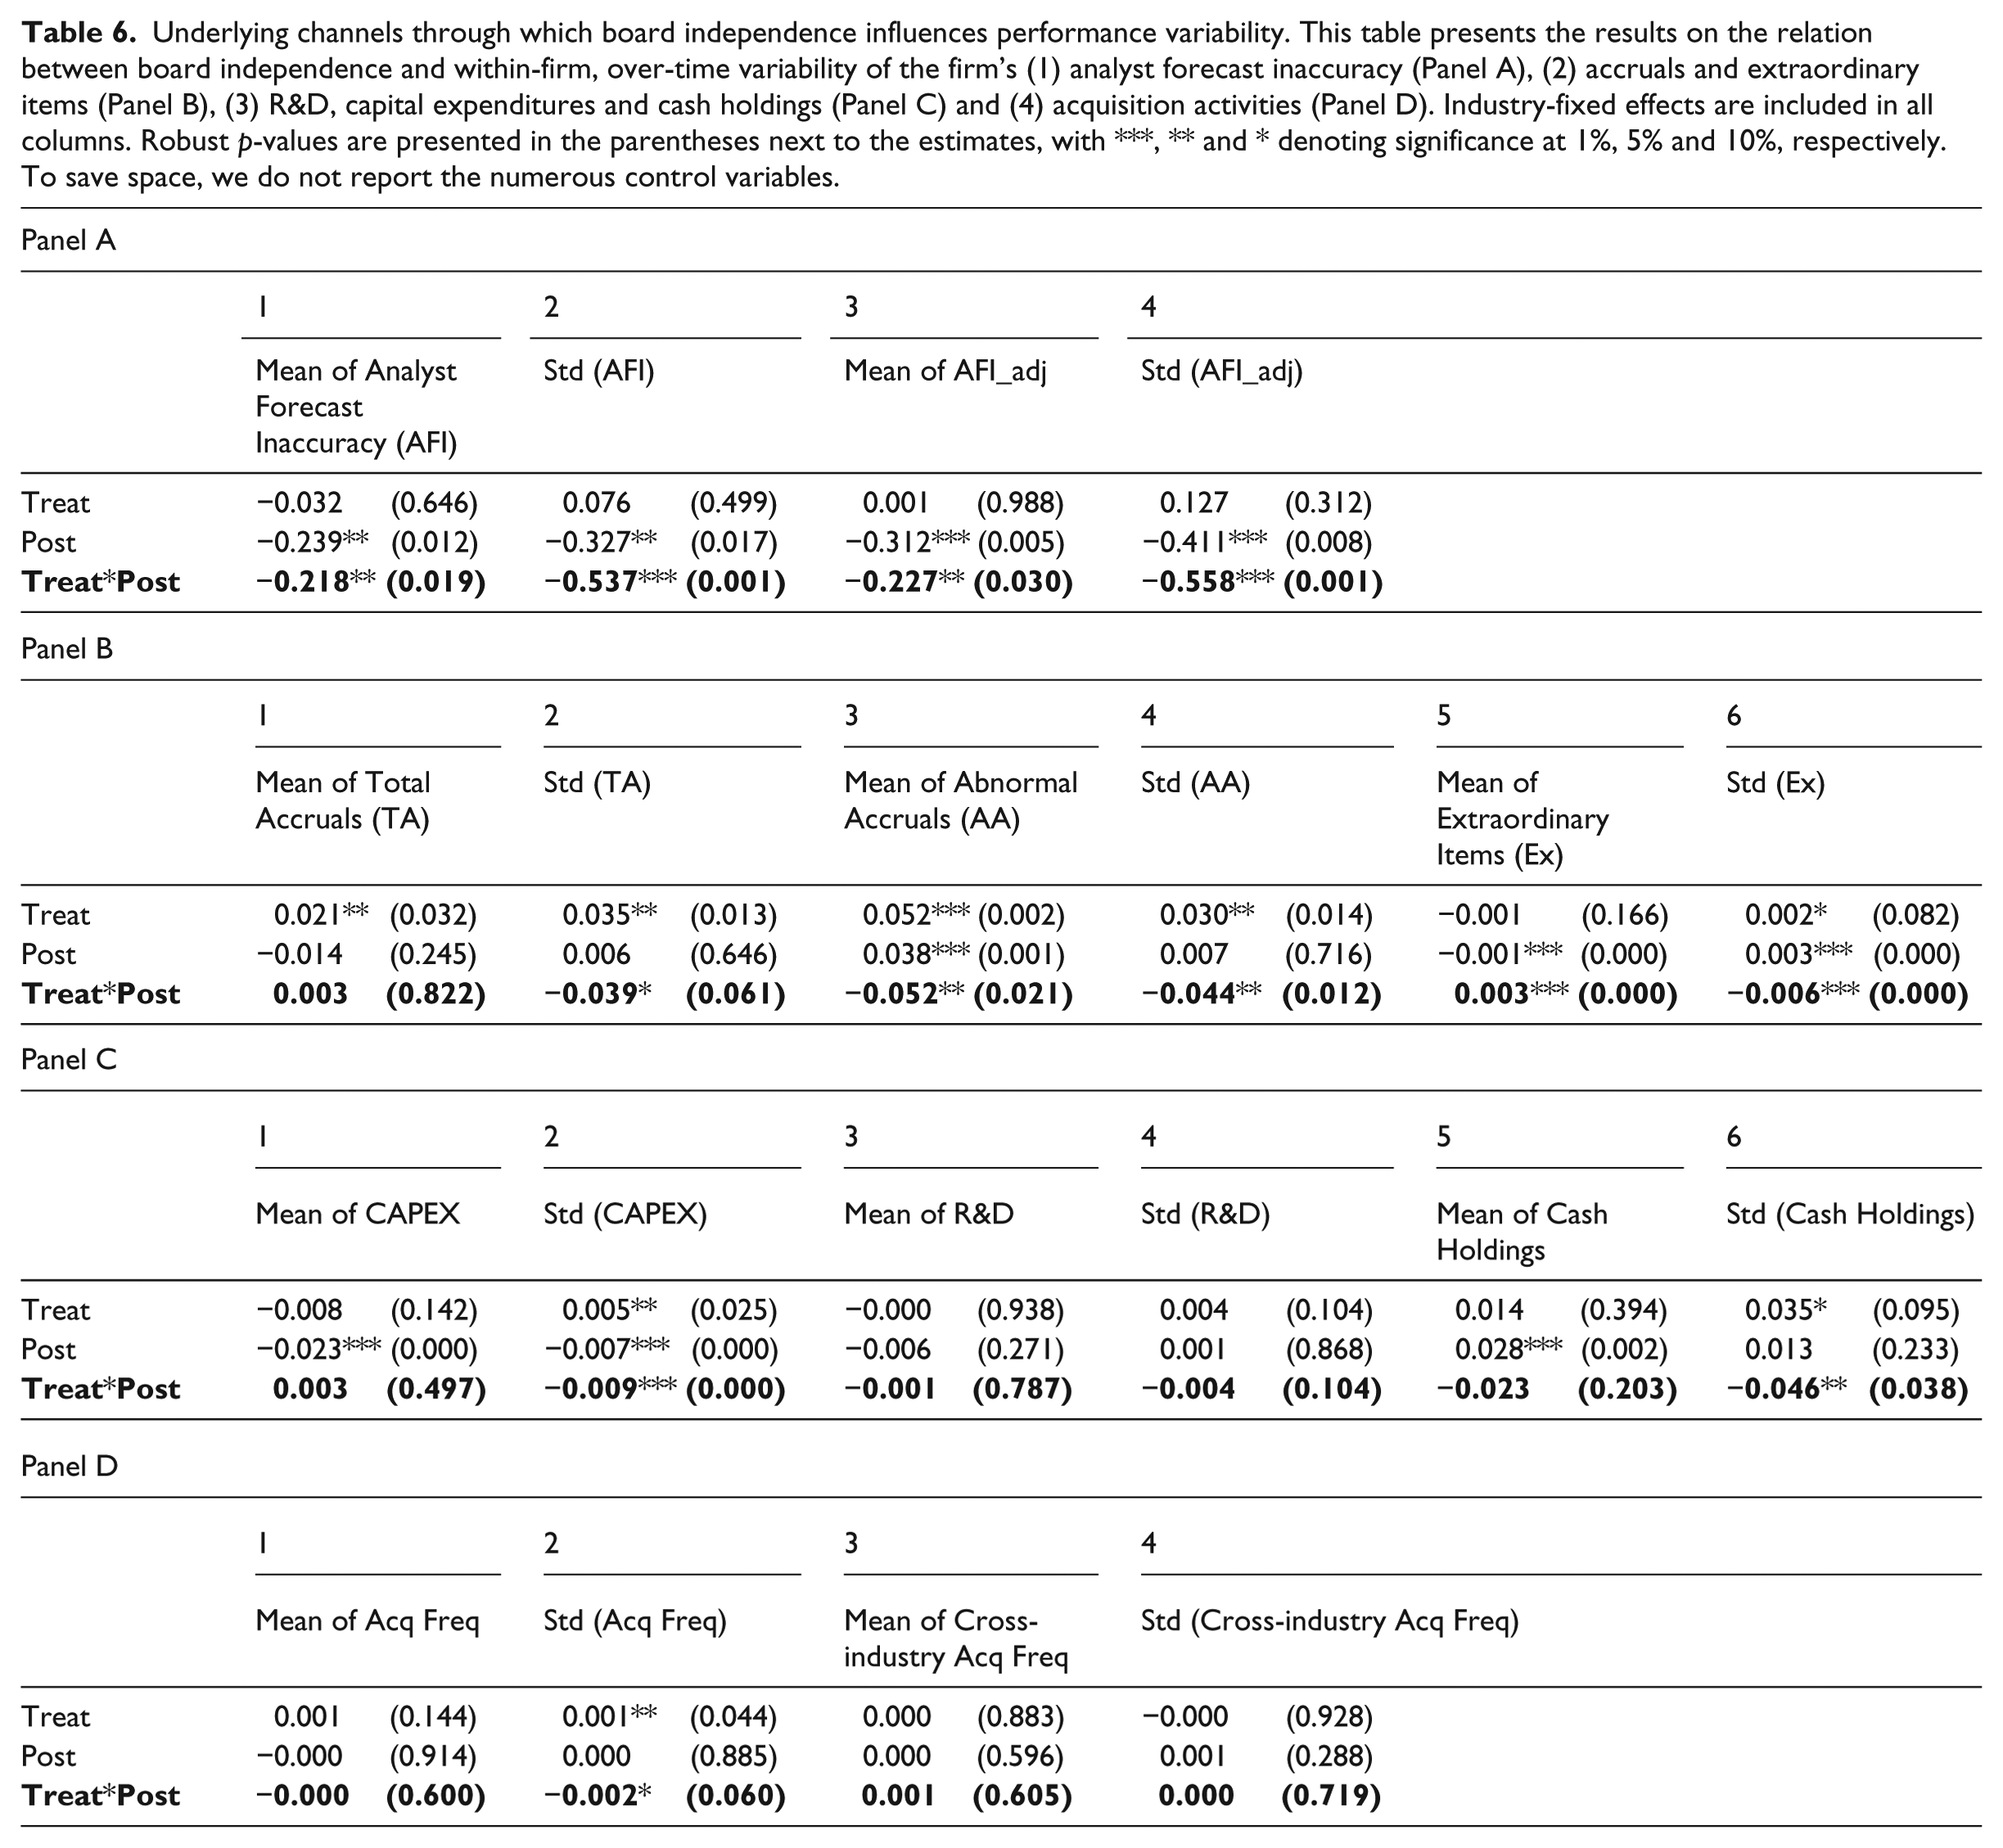
The results are presented in Table 6 (Panel A), which are consistent across all columns. For the treatment firms in the post-SOX period, board independence is associated not only with lower AFI but also with less variable AFI. Specifically, the coefficient estimate on the key independent variable Treat*Post is significantly negative at the 1% level for the standard deviation of AFI and industry-adjusted AFI, and at the 5% level for the mean of AFI and industry-adjusted AFI. Interestingly, as in Cheng (2008), we also document insignificant coefficient estimate on the number of business segments, indicating that the degree of corporate diversification does not have any significant effect on AFI or its variability. Overall, evidence in this subsection suggests that firms with more independent boards are more likely to have accurate analyst forecast, which is consistent with them having less variability in firm performance.
Underlying channels through which board independence influences performance variability. This table presents the results on the relation between board independence and within-firm, over-time variability of the firm’s (1) analyst forecast inaccuracy (Panel A), (2) accruals and extraordinary items (Panel B), (3) R&D, capital expenditures and cash holdings (Panel C) and (4) acquisition activities (Panel D). Industry-fixed effects are included in all columns. Robust p-values are presented in the parentheses next to the estimates, with ***, ** and * denoting significance at 1%, 5% and 10%, respectively. To save space, we do not report the numerous control variables.
5.2. Accruals and extraordinary items
As suggested in prior literature, firms may use total accruals and abnormal accruals, as well as extraordinary items, to manage earnings and their variability (see, for example, Dechow and Skinner, 2000). For example, firms can manipulate the reported earnings through either positive or negative abnormal accruals. If CEOs would like to boost perceived firm performance and stock price in order to meet/exceed analysts’ forecast, they can use positive abnormal accruals to increase the reported earnings. In contrast, if CEOs anticipate that there is a significant performance fall in the future, then they are likely to use negative abnormal accruals as a cushion to smooth earnings.
Consistent with the prior literature, we define total accruals as

To obtain abnormal accruals, we follow Dechow et al. (1995) in using the modified Jones’ (1991) model. Specifically, we first estimate the following regression separately for every combination of two-digit SIC code industry and year

and define abnormal accruals as the residuals from this regression. Extraordinary items are obtained directly from Compustat and are scaled by total assets at the beginning of the fiscal year.
We re-estimate Model (1) by using the means and standard deviations of (1) total accruals, (2) abnormal accruals and (3) extraordinary items as the dependent variable, respectively. The results are presented in Table 6 (Panel B), with columns 1, 3 and 5 representing levels and columns 2, 4 and 6 representing standard deviations. Except for column 1, the key explanatory variable Treat*Post is significant and negative for all other columns, indicating that in the post-SOX period, treatment firms observe significantly lower variability of total accruals, abnormal accruals and extraordinary items, as well as lower levels of abnormal accruals and extraordinary items. This result is consistent with the prior finding that treatment firms have less variable ROA in the post-SOX period. To the extent that the means and standard deviations of the above earnings components reflect earnings management, the results suggest that in the post-SOX period, treatment firms that were forced to adopt a board with a majority of independent directors are less likely to manage their earnings by using accounting accruals and extraordinary items. 7
5.3. R&D, capital expenditures and cash holdings
Long-term expenditures and investments are associated with firms’ uncertainty and thus can potentially affect the variability of firm performance. We thus examine both R&D expenditures and capital expenditures (CAPEX). As is standard in the literature, we take the missing values of R&D and CAPEX as zero. Furthermore, cash holdings are also related to firm performance variability, as they partly reflect a firm’s risk-taking attitude on one hand and fund adequacy for investments on the other hand. We compute the means and standard deviations of these three variables as in the previous part and use them as dependent variables to re-estimate model (1), respectively.
The results are reported in Table 6 (Panel C). Evidence shows that in the level regressions (columns 1, 3 and 5), the coefficient estimates on the key independent variable Treat*Post are all insignificant, indicating that the independence rule does not have any material impact on the level of a firm’s investments or cash holdings. However, in the standard deviations’ regressions (columns 2, 4 and 6), the coefficient estimate on Treat*Post is significantly negative at the 1% level for CAPEX, at the 5% level for cash holdings and at the 10% level for R&D. These results suggest that in the post-SOX period, treatment firms have less variable capital expenditures, R&D expenditures and cash holdings. This finding can partially explain the phenomenon that treatment firms experience less variable firm performance after the enactment of SOX, in that when a firm has less variable investments or cash holdings, it is likely that its performance becomes less variable as well.
5.4. M&As
Mergers and acquisitions (M&As) are major corporate decisions made by firms that can significantly influence firm performance variability. As the board of directors is of vital importance in approving a firm’s M&A activities, we expect that boards are able to affect firm performance and its variability through the avenue of M&A activities. To examine whether and how board independence affects acquisition decisions, we identify all acquisitions conducted by the sample firms during the sample period and calculate the frequency of acquisitions for a firm-year as the number of acquisitions made by the firm during the year divided by the total number of acquisitions of firms in the same two-digit SIC code industry in the same year. Similarly, we obtain the frequency of cross-industry acquisitions. We then use the means and standard deviations of these two variables as dependent variables to re-estimate Model (1).
Table 6 (Panel D) reports the results. The coefficient estimate on the key variable Treat*Post is significantly negative at the 10% level for the standard deviation of the frequency of acquisitions. However, it is insignificant for the mean of the frequency of acquisitions, the mean of the frequency of cross-industry acquisitions or the standard deviation of the frequency of cross-industry acquisitions. Evidence in this part is weak relative to that in the previous parts, but in the post-SOX period, treatment firms observe less variability in the frequency of acquisitions.
Overall, evidence in this section consistently suggests that in the post-SOX period, treatment firms experience significantly lower variability in the factors that are related to firm performance. These results further support and confirm the findings in section 3 that board independence is negatively associated with the variability of firm performance. Furthermore, these results per se are of interest. As mentioned before, variability is a traditional measure of corporate risk-taking. Results here indicate that firms significantly reduce their risk levels as board independence increases. The reduced risk-taking suggests increased conservatism in CEO’s decision-making, which results from the increased role played by independent directors. When a more independent board conducts more rigorous CEO monitoring, there would be increased numbers of necessary approvals and intensified needs for the CEO to document her actions, which will lead to delays and reduce opportunities for risky and time-sensitive projects. Given the more careful oversight from the board, CEOs are better restrained from spending money on risky projects with great uncertainty, which reduces the opportunities for both best performance and worst performance, resulting in more stable corporate operations. This helps explain why firms have reduced variability in capital expenditure and cash holdings. In addition, the increased managerial conservatism also means that CEOs are now less likely to use accruals and extraordinary items to manage the earnings to meet or beat analyst expectations. To summarise, increased board independence leads to more rigorous CEO monitoring. As the CEO’s power weakens, her decision-making and thus corporate operational behaviour become more conservative. Therefore, the risk levels are reduced and the performance becomes less variable.
6. Conclusion
This article provides evidence on the relation between board independence and firm performance variability. Changes in listing rules in the NYSE and NASDAQ subsequent to the passage of the SOX require that corporate board should be composed of a majority of independent directors. However, the benefits and costs of the mandates are controversial (e.g. Romano, 2005). Moreover, prior studies focus on the level of firm performance and document no convincing evidence on the effect of board independence on firm performance. Using the enactment of SOX as a quasi-natural experiment, we examine the effect of board independence on the variability of firm performance. We provide statistically convincing evidence on a casual relation between board independence and performance variability and the causation goes from board independence to performance variability. In particular, we document that treatment firms that were forced to adopt a majority of independent directors on boards experience less variable firm performance in the post-SOX period. Furthermore, we identify channels through which board independence can affect firm performance variability. Our findings suggest that board independence is negatively associated with the variability of (1) analyst forecast inaccuracy, (2) total and abnormal accounting accruals, (3) extraordinary items, (4) capital expenditures, (5) cash holdings and (6) the frequency of acquisition activities. Overall, the findings highlight that increased board independence weakens the power of CEOs and reduces corporate risk-taking; thus, a more independent board results in less variability of firm performance.
Depending on whether a firm had adopted value-maximising board structure prior to the enactment of SOX mandates and the different levels of risk appetite between the CEO and shareholders, the evidence documented in this article could have different implications for shareholder wealth. From the perspective of agency theory, the corporate board is usually unduly captured by the CEO and the main problem with the board is that it is an ineffective internal control mechanism (Guo and Masulis, 2015). In this sense, the exogenous shock of increasing board independence should benefit shareholders as it improves the effectiveness of board oversight. The reduced risk levels and performance variability could be welcome by investors who are more risk averse than the CEOs and thus prefer more stable operations. However, from the perspective of optimal contracting theory, a firm’s board structure is optimally determined by the trade-off between the firm’s monitoring and advising needs. Adding more independent directors could improve board monitoring on one hand, and on the other hand, the board may lose valuable advisory services. This could hurt shareholder’s wealth. In addition, if the CEOs are more risk averse than shareholders want them to be, 8 then SOX could aggravate this problem when firms take less risks and the corporate operational behaviour becomes more conservative after SOX. This will lead to value destruction. We document the causal relation between board independence and firm performance variability in this article. However, we do not make any judgment as to whether the mandated board independence and the caused reduction in risk-taking are socially efficient. Future research could address this issue by examining whether reduced risk-taking and performance variability are value-enhancing to shareholders, or it is just a trade-off between shareholder’s wealth and performance variability. This interesting issue awaits further investigation.
Footnotes
Appendix
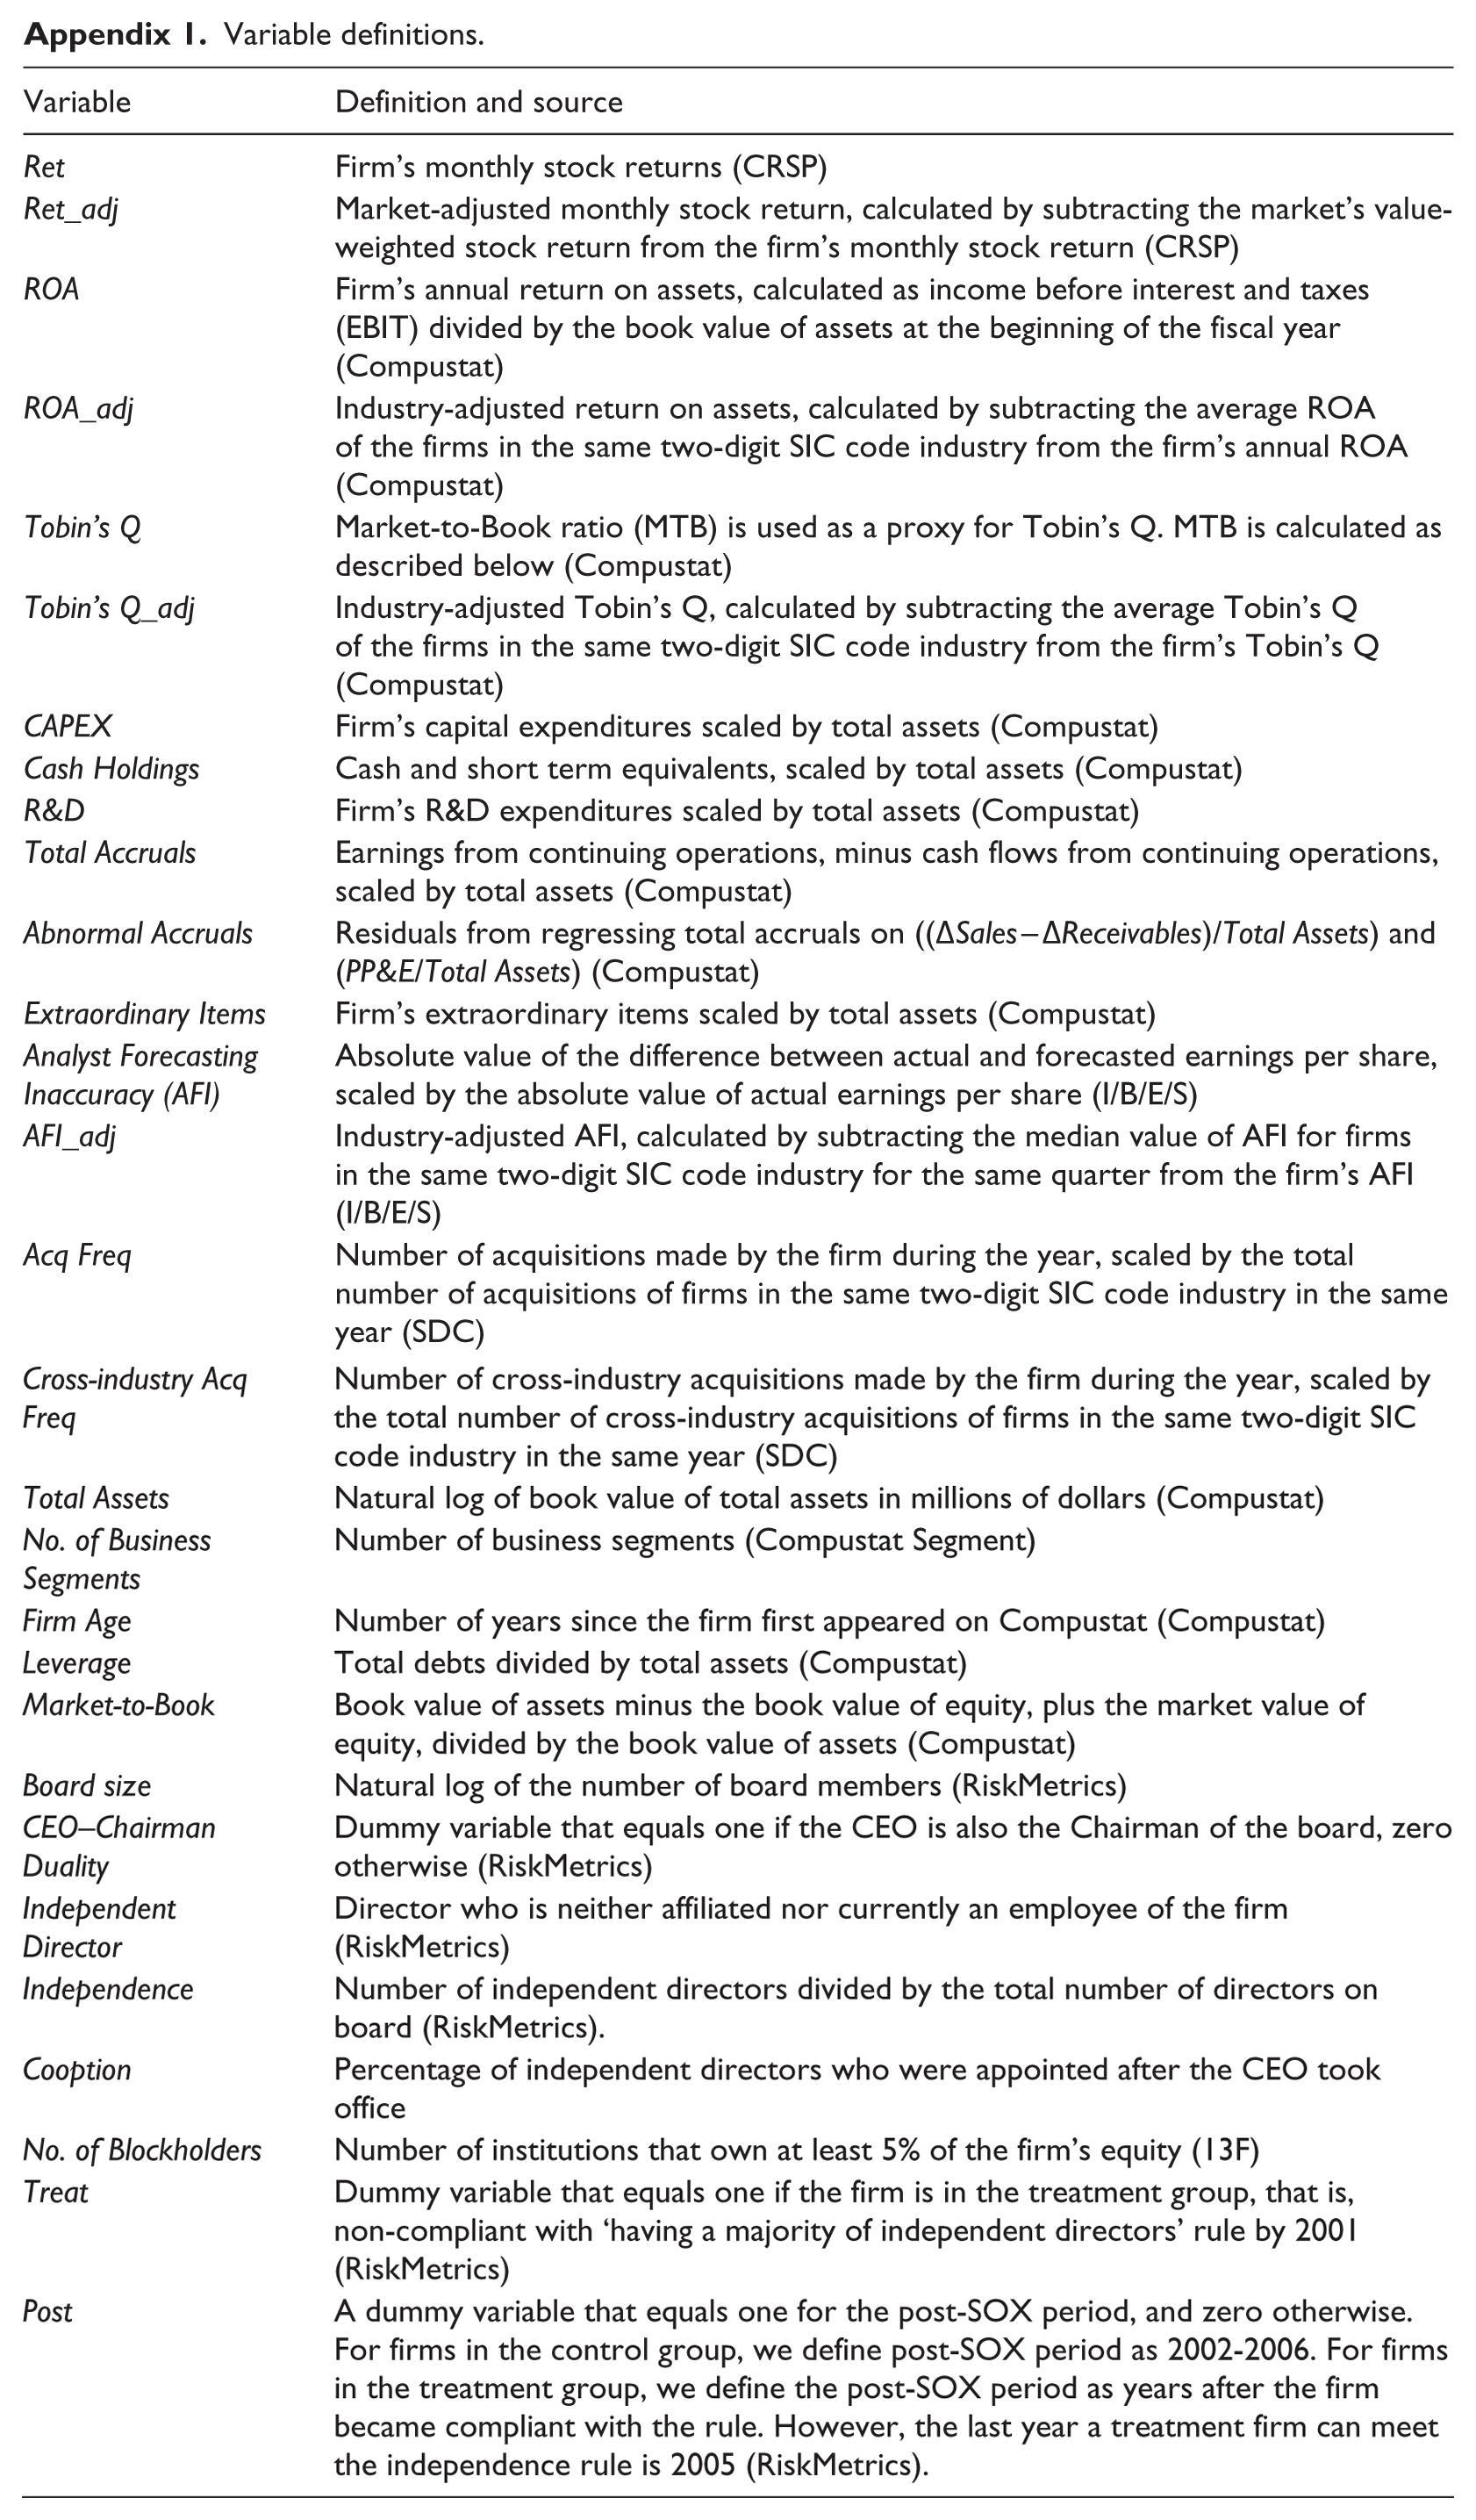
Variable definitions.
| Variable | Definition and source |
|---|---|
| Ret | Firm’s monthly stock returns (CRSP) |
| Ret_adj | Market-adjusted monthly stock return, calculated by subtracting the market’s value-weighted stock return from the firm’s monthly stock return (CRSP) |
| ROA | Firm’s annual return on assets, calculated as income before interest and taxes (EBIT) divided by the book value of assets at the beginning of the fiscal year (Compustat) |
| ROA_adj | Industry-adjusted return on assets, calculated by subtracting the average ROA of the firms in the same two-digit SIC code industry from the firm’s annual ROA (Compustat) |
| Tobin’s Q | Market-to-Book ratio (MTB) is used as a proxy for Tobin’s Q. MTB is calculated as described below (Compustat) |
| Tobin’s Q_adj | Industry-adjusted Tobin’s Q, calculated by subtracting the average Tobin’s Q of the firms in the same two-digit SIC code industry from the firm’s Tobin’s Q (Compustat) |
| CAPEX | Firm’s capital expenditures scaled by total assets (Compustat) |
| Cash Holdings | Cash and short term equivalents, scaled by total assets (Compustat) |
| R&D | Firm’s R&D expenditures scaled by total assets (Compustat) |
| Total Accruals | Earnings from continuing operations, minus cash flows from continuing operations, scaled by total assets (Compustat) |
| Abnormal Accruals | Residuals from regressing total accruals on ((ΔSales – ΔReceivables)/Total Assets) and (PP&E/Total Assets) (Compustat) |
| Extraordinary Items | Firm’s extraordinary items scaled by total assets (Compustat) |
| Analyst Forecasting Inaccuracy (AFI) | Absolute value of the difference between actual and forecasted earnings per share, scaled by the absolute value of actual earnings per share (I/B/E/S) |
| AFI_adj | Industry-adjusted AFI, calculated by subtracting the median value of AFI for firms in the same two-digit SIC code industry for the same quarter from the firm’s AFI (I/B/E/S) |
| Acq Freq | Number of acquisitions made by the firm during the year, scaled by the total number of acquisitions of firms in the same two-digit SIC code industry in the same year (SDC) |
| Cross-industry Acq Freq | Number of cross-industry acquisitions made by the firm during the year, scaled by the total number of cross-industry acquisitions of firms in the same two-digit SIC code industry in the same year (SDC) |
| Total Assets | Natural log of book value of total assets in millions of dollars (Compustat) |
| No. of Business Segments | Number of business segments (Compustat Segment) |
| Firm Age | Number of years since the firm first appeared on Compustat (Compustat) |
| Leverage | Total debts divided by total assets (Compustat) |
| Market-to-Book | Book value of assets minus the book value of equity, plus the market value of equity, divided by the book value of assets (Compustat) |
| Board size | Natural log of the number of board members (RiskMetrics) |
| CEO–Chairman Duality | Dummy variable that equals one if the CEO is also the Chairman of the board, zero otherwise (RiskMetrics) |
| Independent Director | Director who is neither affiliated nor currently an employee of the firm (RiskMetrics) |
| Independence | Number of independent directors divided by the total number of directors on board (RiskMetrics). |
| Cooption | Percentage of independent directors who were appointed after the CEO took office |
| No. of Blockholders | Number of institutions that own at least 5% of the firm’s equity (13F) |
| Treat | Dummy variable that equals one if the firm is in the treatment group, that is, non-compliant with ‘having a majority of independent directors’ rule by 2001 (RiskMetrics) |
| Post | A dummy variable that equals one for the post-SOX period, and zero otherwise. For firms in the control group, we define post-SOX period as 2002-2006. For firms in the treatment group, we define the post-SOX period as years after the firm became compliant with the rule. However, the last year a treatment firm can meet the independence rule is 2005 (RiskMetrics). |
Acknowledgements
This paper has greatly benefited from numerous helpful suggestions from the Deputy Editor Karen Benson, the Associate Editor Millicent Chang, and an anonymous reviewer. We have also received helpful comments from Ye Cai, Lixiong Guo, Fei Xie, and seminar participants at University of Waikato. All errors remain ours.
Final transcript accepted 30 March 2017 by Millicent Chang (AE Finance).
Funding
The author(s) received no financial support for the research, authorship and/or publication of this article.