
Abstract
This article exploits a large panel to study trends in, and determinants of, the decisions made by the four largest Australian banks about whether to establish or maintain branch- and automated teller machine (ATM)-level presence in a local market between 2002 and 2013. These decisions are potentially important for competition in local banking markets. Our analysis suggests that past presence is the most important factor for explaining current presence in a particular local market. Moreover, we present evidence that the four largest banks co-locate branches. The relationship between the location of other (smaller) banks and the location of the four largest banks is less clear; there is some limited evidence that this relationship is negative for two of the four largest banks. Our results also suggest that the four largest banks displayed changed behaviour in terms of their branch location decisions after the global financial crisis and that the changes differed between banks. Our analysis of ATM location decisions reveals that the four largest banks follow different strategies. These results suggest that Australian banks did not shy away from this limited form of competition, either before or after the global financial crisis (GFC).
JEL Classification:
Keywords
1. Introduction
This article studies the trends in, and determinants of, the decisions made by the four largest Australian banks about whether to establish or maintain branch-level and automated teller machine (ATM)–level presence in a local market. The aim of our analysis is to understand how competition between the four largest banks manifests itself through their location decisions after controlling for population characteristics and the presence of other financial institutions.
We exploit a data set that tracks bank presence in 2241 local markets (postcodes) between 2002 and 2013. We describe the expansion of banking operations during this period and estimate a dynamic model of branch/ATM presence. The focus of our analysis is on the location decisions of the four largest banks (the Big 4 banks) and includes an investigation of how their behaviour differed before and after the global financial crisis (GFC).
The probability that a Big 4 bank has a branch/ATM in a particular location is modelled as a function of lagged presence, presence of other Big 4 banks, presence of non–Big 4 banks, and a small number of demographic variables. The main findings are that the Big 4 banks agglomerate branches, and that they changed their behaviour differently in the period following the GFC.
Our approach is complementary to a more direct investigation of competition in retail banking. A secondary aim of this article is to determine whether some of the concerns expressed by the Australian Senate about competition, particularly in regional areas, are justified. The evidence that we provide is suggestive of a competitive environment, at least as measured by the patterns of location decisions.
There are many aspects to studying competition in the banking sector. From a consumer’s perspective, bank competition can have a direct impact on the costs associated with some of the most important individual lifetime financial decisions such as obtaining a mortgage. From an industrial organisation perspective, the banking sector is particularly affected by technological change, such as automation from the 1970s with the advent of ATMs, home banking via the phone or other devices from the 1980s and Internet banking from the mid-1990s, as well as more recent innovations in payment systems platforms for smartphones.
Importantly, the interest in banking competition is necessarily intertwined with concerns about financial stability. The potential trade-off between competition and financial stability is well known and has been widely studied. As Allen and Gale (2014) point out, ‘greater competition may be good for (static) efficiency, but bad for financial stability’. Concerns about bank risk and financial stability have increased following the GFC (Hoang et al., 2014; Pathan et al., 2016).
In Australia, this trade-off between competition and financial stability is behind the ‘Four Pillars’ policy. This policy aims to maintain competition by preventing mergers between the Big 4 banks: the Australia and New Zealand Banking Group (ANZ), the Commonwealth Bank of Australia (CBA), National Australia Bank (NAB) and Westpac Banking Corporation (Westpac).
The Four Pillars policy is controversial (Davis, 2011) and is varyingly credited with helping to shield Australia from the GFC (Lewis, 2013) and with reducing competition and harming consumers (Centre for International Finance and Regulation (CIFR), 2015). An Australian Senate Economics References Committee (2011) inquiry into competition within the Australian banking system also raised concerns about a reduction in banking competition in the wake of the GFC. 1 In addition, the Senate Committee’s Final Report highlighted the importance of branch networks as a potential barrier to entry and raised concerns that ‘banks may not be competing to provide a good service in remote areas’ (p. 63, 70).
The importance of branch location decisions for bank strategy and the analysis of competition are well recognised (see Amel et al., 2008; Meidan, 1984). Branch location decisions may be driven by a number of strategic considerations. For example, Chang et al. (1997) propose a model of ‘rational herding’ in which banks locate branches close to the branches of other banks due to a lack of information about likely performance, even though aggregate results from clustering may be suboptimal. They use a cross-sectional model and data from New York City to find evidence consistent with rational herding.
Richards et al. (2008) find evidence of incentives for co-location of banks in a non-metropolitan region of the United States. These are linked to the complementarity of prices (which encourages tacit collusive behaviour) and consumer transport costs, which are found to be significant. The authors link these factors to the agricultural economic base of the region of interest, since agricultural businesses are particularly reliant on bank finance and face significant funding information asymmetries that advantage local banks. The importance of bank finance for small- and medium-sized agricultural businesses is also a feature of the Australian agricultural industry (McCarthy et al., 2015), so some of these factors may also be relevant in parts of Australia.
The link between branch location and competition is also explored by Cohen and Mazzeo (2010). These authors find that competition and potential competition with multimarket banks induce banks of all types to expand their branch networks, suggesting that this is consistent with strategic attempts to deter entry. Ho and Ishii (2011) find that consumers prefer banks active across many markets, and that approximately two-thirds of the welfare gains from deregulation of nationwide branching in the United States can be linked to bank branches being located closer to consumers.
Location decisions of these types are not restricted to the banking industry. For example, Toivanen and Waterson (2005) and Thomadsen (2007) study the fast-food industry. Both studies find evidence that at least some firms prefer to agglomerate, and Toivanen and Waterson (2005) link this to strong learning effects. Both studies are concerned with duopolies and estimate separate firm-specific equations to allow for differences in firm behaviour. We adopt a similar approach for the oligopolistic Australian banking industry.
Davis (2006) studies the market for movie theatres and emphasises the role of consumer transportation costs in driving location decisions. Like Davis (2006), Aguirregabiria and Vicentini (2015) acknowledge the importance of consumer transportation costs. They also argue that consumers may prefer agglomerated stores because a common location reduces searching and shopping costs, although this may be less relevant to banking because bank customers do not choose between banks each time they visit a branch or ATM. Similarly, Holmes’ (2011) emphasis on distribution benefits may be more important for Walmart (the company of interest in that study), although Holmes (2011) also identifies reduced management and marketing costs from network density, which may be more relevant for banking.
Our study fits within this broader literature by studying how the presence of competitors influences location decisions. We focus exclusively on first-time entry and final exit decisions with a view to understanding their dynamics. Our approach is to first document how the branch-level presence of the Big 4 banks has changed over time. Then, we estimate a series of dynamic panel probit regressions, following Wooldridge (2005), to explain the first-time entry and final exit decisions of the Big 4 banks. Our analysis takes into account the impact of the demographic characteristics of the population on banking location decisions. 2
Our analysis suggests that, perhaps not surprisingly, past presence is the most important factor for explaining current presence in a particular postcode. Moreover, we present compelling evidence that the Big 4 banks agglomerate branches. The relationship between the locations of non–Big 4 banks and the locations of the Big 4 banks is less clear; there is some limited evidence that this relationship is negative for 2 of the Big 4 banks. This limited evidence does not seem to be enough to give credence to concerns about branch presence in areas where larger banks are less likely to locate due to, for example, a small population base or a low level of economic activity. Our results are also suggestive of institution-specific changes in Big 4 behaviour in terms of their branch location decisions before and after the GFC.
Our analysis of ATM location decisions reveals a divergence of behaviour among the Big 4 banks, with different banks following different strategies. These include targeting postcodes that are poorly served by non–Big 4 institutions with larger populations and less income reported from businesses, to targeting postcodes with larger populations and higher average taxable income. This diversity of strategies also undermines concerns about lack of competition by the Big 4 banks in the location of ATMs. It suggests that the Big 4 banks react to each other’s location decisions in different ways, which is often a characteristic of competitive markets. 3
Competition in banking services is complex, and branch and ATM networks are only part of the picture. In addition, the location literature summarised above identifies a number of causes for agglomeration, not all of which are clearly pro-competitive and not all of which are necessarily welfare improving. As a result, it is too simplistic to point to location decisions in isolation and draw broader conclusions about competition. We cautiously interpret our evidence as suggestive of pro-competitive outcomes. This is partly a response to concerns about branch network size like those raised by the Australian Senate. Nonetheless, we emphasise that when we discuss ‘competition’, we are referring to a restricted form of competition (specifically, competition in network size) that is only one element of broader competition in banking services.
This article is organised as follows. Section 2 describes some standard measures of competition in the banking sector and explains how our approach complements existing measures of competition. Section 3 provides an analysis of recent trends in the location of bank branches in Australia, relating these to the trends in the location of ATMs. Section 4 presents the data and empirical approach. Section 5 presents the empirical results, while Section 6 concludes with a discussion of bank behaviour in terms of first-time entry and final exit.
2. Measuring competition in the Australian banking sector
Competition analysis has traditionally focused on measures of concentration, such as market shares, as proxies for competition (in banking see, for example, Cetorelli and Strahan, 2006). The more recent approaches, however, recognise that market shares are of limited use in understanding how competition constrains the behaviour of firms in a market and, instead, focus on direct measures of market power such as the Lerner index (Lerner, 1934), the adjusted Lerner index (Koetter et al., 2012), the H statistic (Panzar and Rosse, 1987), and the profit elasticity (Boone et al., 2005).
However, directly measuring competition (or market power) in the banking sector is not straightforward given that prices, quantities and costs data, the backbone of most studies of competition, are usually not publicly available. Thus, often, the degree of competition is measured indirectly. For example, in a seminar paper, Keeley (1990) developed a theoretical framework, based on the ‘charter value’ of a bank, to measure the market power of banks. He then used this framework to show empirically that the US banking regulation of the 1970s and 1980s had increased competition and led to a reduction in monopoly rents.
More recently, the availability of some data on prices and quantities in the banking sector (e.g. through Bankscope) has allowed some inroads in the direct estimation of market power. Nevertheless, it remains the case that data on marginal costs need to be estimated econometrically. For example, Clerides et al. (2015) estimate the degree of competition in the banking sectors of 148 countries over the period 1997–2010 using three methods: the Lerner index, the adjusted Lerner index, and the profit elasticity. Marginal cost estimates required for all methods are obtained using a flexible semi-parametric methodology. These authors show that all three indices point to a deterioration of banking competition during the period 1997–2006, an improvement until 2008, and further deterioration post-GFC.
Clerides et al. (2015) show that the levels of competition differ across regions and income groups, but there is gradual convergence over time. For Australia, for example, their estimated Lerner index is reproduced in Table 1.
Lerner index for the Australian banking sector.
Source: Clerides et al. (2015).
This suggests that the mean markup over marginal costs (as a percentage) for the 1997–2010 period is equal to 20.9%. Given the reliance on estimates of marginal costs, it is difficult to know how accurate such predictions are. Taking this evidence at face value, it suggests that the Australian banking sector is on average more competitive than the UK and US sectors but less competitive than Canada’s. We note, however, that the profitability of the banking sector implied by these numbers is consistent with that observed in practice. For example, the Reserve Bank of Australia (RBA) reports that the major banks’ return on assets averaged around 0.9% and the post-tax return on equity averaged about 15% from 1992 to 2010. 4
Competition in the banking sector is potentially quite complicated. Banks can compete on price or on product and service range. They may also compete on service quality, including the size of their branch or ATM networks. However, the competitive implications of increased network size may not be clear in all circumstances. The placement of branches or ATMs in a new area may increase choices for customers in that area, with pro-competitive effects. By contrast, some network expansion may represent undesirable overbanking (Beimborn, 2008).
We focus on a narrow aspect of competition: the breadth (distinct from the density) of a bank’s branch and ATM networks. We consider competition to have increased in a local market (postcode) when the number of distinct institutions that consumers have access to increases. Thus, we restrict our attention to first-time entry (which adds a new institution) and final exit (which removes an institution) and exclude entry that adds to an existing stock of branches or ATMs. While we acknowledge that this subsequent entry is one aspect of bank service offerings that is potentially important for competition, the drivers of further entry may not be the same as for first entry, and the implications for competition may be less clear.
The analysis in this article can be seen as complementary to the direct estimation of measures of market power. For example, if the Big 4 banks were to systematically avoid agglomerating, this could be construed as circumstantial evidence of lack of competition. The analysis in sections 4 and 5 below reveals a pattern of location decisions that is consistent with the prevalence of competitive behaviour, with the largest banks’ likelihood of entering a market increasing with the number of competitors.
3. Data and trends in the number of bank branches
3.1. Data
Our analysis exploits a new panel data set based on points of presence data at postcode level collected by Australian Prudential Regulation Authority (APRA, 2015). These data are provided to APRA by Authorised Deposit-Taking Institutions (ADIs) 5 and released annually on the APRA website. Postcodes in Australia are spatial units 6 defined by Australia Post to facilitate delivery of postal services. They are also widely used in the collection of data and are generally the smallest spatial units for which statistical data are available. 7 For each postcode, our panel contains measures of ADI presence derived from the APRA data set, as well as various demographic characteristics taken from Australian Taxation Office (ATO) data. A total of 2705 distinct postcodes appear at least once in the APRA data, of which 2241 have demographic data available.
Our analysis assigns presence to postcodes and uses postcodes as the basic unit of analysis. This precludes an effective spatial approach because spatial analysis using arbitrarily imposed spatial units leads to discretization bias (Huysentruyt et al., 2013). It is also unclear how proximity could be meaningfully understood in the context of postcodes, some of which are very large. Previous studies have overcome this using point pattern analysis (Duranton and Overman, 2005) or similar methods (Huysentruyt et al., 2013). These solutions are limiting for our data set as they require identification of precise location (through, for example, addresses). In future work, we will seek to augment the database to add the addresses of branches and their actual geographic location in latitude and longitude. 8
For each postcode, the annual APRA releases contain raw data which consists of entries corresponding to each of the different types of point of presence of an institution in a particular postcode. Each entry gives a name for the point of presence type and includes a description of the service offered. APRA compiles this information from surveys by ADIs in which they report all of their points of presence. ADIs are required to provide this information in accordance with APRA Reporting Form ARF 396.0 (APRA, 2008). ADIs are responsible for naming and describing reported points of presence, although there are some guidelines (e.g. ADIs report whether a point of presence offers a specified minimum range of services considered to be ‘branch-level’).
Each annual release contains raw data from the year of release and the two preceding years. Inconsistencies between data for the same year from different releases are resolved using the data from the most recent release. Points of presence are reclassified into 16 groups. There are many cases of ambiguity to resolve. These are limited for ATMs, and assignment of branches is aided by the branch-level service indication. Assignment of other points of presence is challenging as clear descriptions are not always available. There is also evidence of inconsistent reporting of some points of presence types (e.g. one ADI may report a large number of one point of presence type, while a similar institution reports none or very few). This is particularly true for points of presence for which the meaning of location is unclear (e.g. electronic funds transfer at point of sale (EFTPOS)). In late 2008, the non–Big 4 banks, The Bank of Western Australia (operating as Bankwest) and St George, were acquired by the CBA and Westpac, respectively. We treat the acquired banks’ points of presence as belonging to the relevant acquiring bank from 2009 onwards.
A significant but unavoidable shortcoming of our data is that ADIs only report postcodes where they have points of presence. This causes two problems. The first is that the panel is unbalanced, with data ‘missing’ for many postcodes for some years. We argue that where the postcode in question appears at least once in another year (i.e. an ADI reports at least one point of presence in the postcodes in at least 1 year), these ‘missing’ observations are more likely to be zeros (i.e. no ADIs are present). Consequently, we insert zeros for the presence variables for these postcodes to make the panel balanced.
We recognise that this approach excludes the possibility that new postcodes are introduced or old postcodes retired. To test whether the results are affected by inserting these zero values, we run two tests of robustness. 9 In the first test, we re-estimate all models using a data set that treats no ‘missing’ observations as zeros. This is the same as including only those postcodes where at least one point of presence (of any type) was reported in every year. For the second test, we re-estimate again, this time relaxing the condition by excluding only those postcodes with no observations in more than 4 years.
The second problem is that some postcodes do not appear in the data. Consider a postcode where no ADI points of presence are reported between 2002 and 2013. Such a postcode will not appear in the data at all. Ideally, we would like to include these postcodes because the persistent absence of bank presence is useful information. However, this would require a list of all postcodes in Australia in each year from 2002 to 2013 (since postcodes may be added or removed over time). In the absence of such a list, we must work with a data set that excludes these postcodes.
3.2. Trends in the number of bank branches
Bank branch numbers in Australia rose throughout the 1970s and 1980s, largely due to the entry of new institutions, then declined from the late 1980s into the 1990s (RBA, 1996). Despite the increase in branch numbers until the 1980s, the number of bank branches per head of population declined steadily between the early 1970s and mid-1990s, excepting a short period of levelling-off in the late 1980s (RBA, 1996).
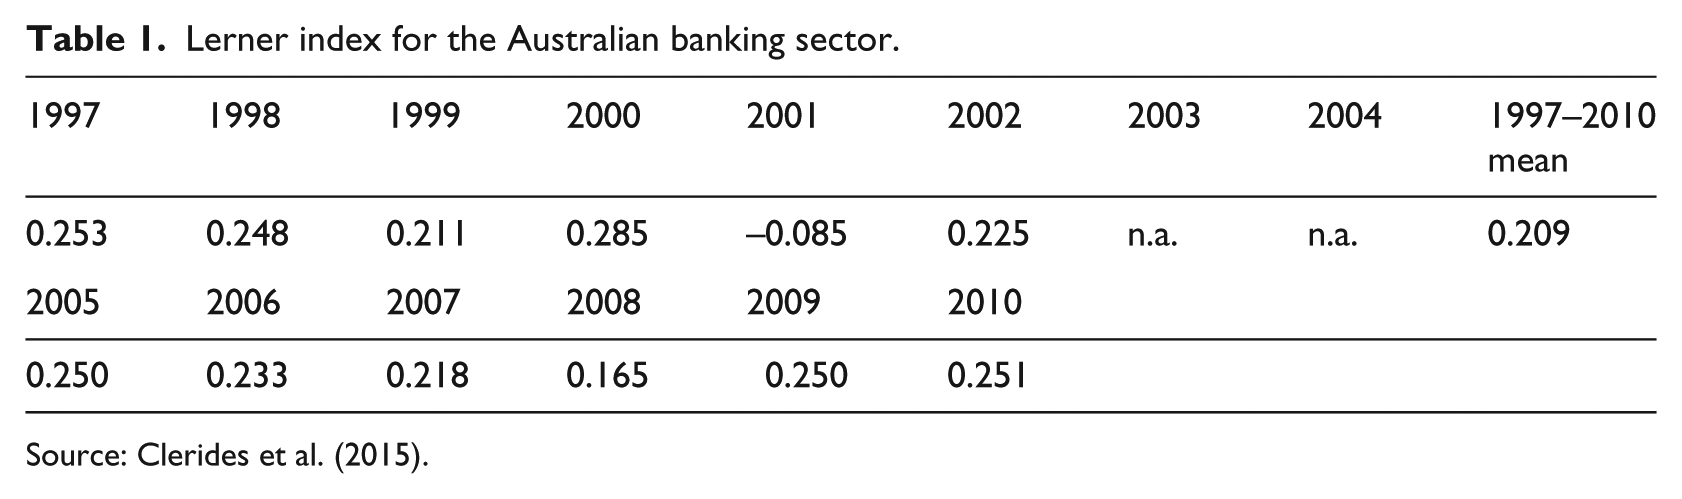
Figure 1 shows the number of branches present Australia-wide for the 2002–2013 period, based on APRA data. ‘AI’ refers to all ADIs, and ‘B4’ refers to Big 4 banks. Although the numbers are not directly comparable to those from earlier RBA reports (slightly different institutions are included), it is clear that branch numbers have ended the downward trend observed in the 1990s and have instead stabilised. There is a spike in branch numbers for non–Big 4 institutions in 2005–2006, but otherwise, there appears to be a gradual upward trend. Big 4 branch numbers have remained stable, increasing slightly in 2005–2006 and in 2008–2009 (the latter increase corresponds to the acquisitions of The Bank of Western Australia and St George, two smaller banks, by the CBA and Westpac, respectively).
Number of bank branches in Australia.
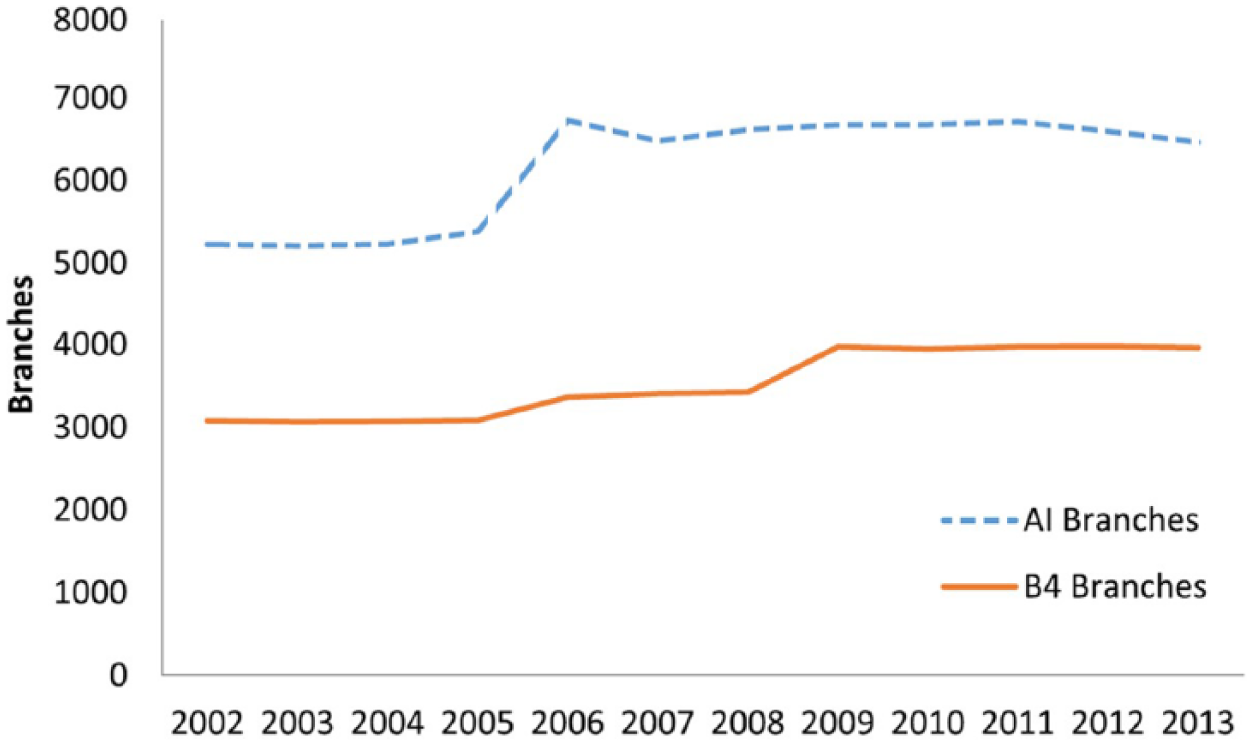
The decline in the number of branches per head of population also appears to have ended. Figure 2 shows the number of branches per million inhabitants of Australia from 2012 to 2014. Branches per head of population are stable for the Big 4 banks over the period, and although a spike is observed for non–Big 4 institutions in 2005–2006, the ratio gradually returns to the 2002 level by 2014. This suggests that at least at an aggregate level, the 2000s and early 2010s have been a period of stability in contrast to the large changes of the late 20th century.
Number of bank branches per population (million).
Finally, we document the relationship between the evolution of branches and ATMs. In 1996, the RBA noted the increasing importance of ATMs as an alternative service delivery channel to branches, reporting that the number of ATMs first exceeded the number of branches in that year (RBA, 1996).
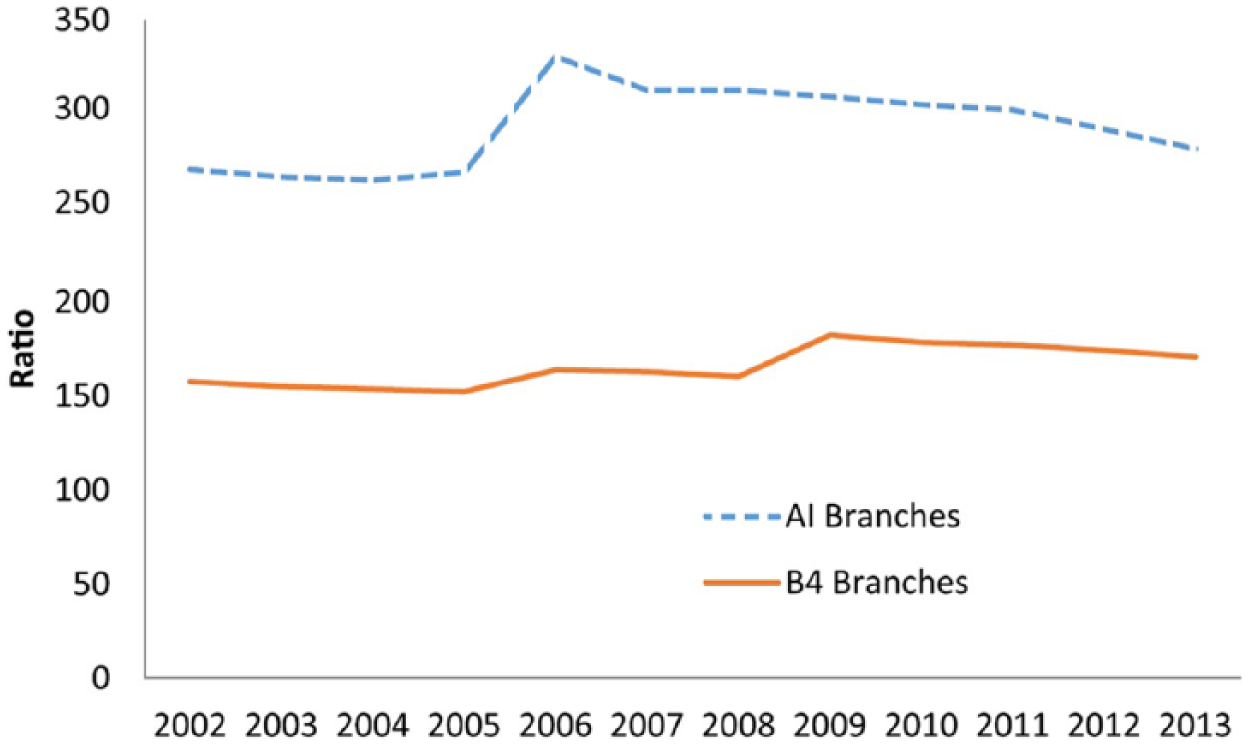
Figure 3 compares the number of branches and number of ATMs per head of population over the 2002–2013 period. It is clear that the number of ATMs increased rapidly in the late 1990s and early 2000s, from comparable to the number of branches in the mid-1990s (RBA, 1996) to over twice the number of branches in 2002. From 2002 to 2013, however, the ratio of ATMs to branches was quite stable. The number of ATMs appears to have increased slightly faster than branches up to 2010 but declined more rapidly from 2011 to 2013. The overall result is that, in 2013, the ratio of branches to ATMs was virtually unchanged from the ratio in 2002. The rapid growth in ATM presence, and any associated displacement of branch banking, appears to have ended. Figure 3 also highlights that at least at an aggregate level, the effect of the 2007–2008 GFC on the Australian retail banking sector was relatively mild. This is consistent with observations made by the RBA (Donovan and Gorajek, 2011).
Branches and ATMs per million people.
4. Empirical approach
Our empirical approach consists of estimating a number of versions of an econometric model designed to study whether postcode demographics and levels of local competition predict first-time entry and final exit dynamics. The basic framework is the dynamic panel probit regression of Wooldridge (2005). The panel dimension allows us to control for unobserved effects.
A probit model entails a non-linear relationship, and thus, first differencing cannot be used to remove any unobserved effects. A common solution then is to assume that the unobserved effect is a function of an independent variable. Adding the independent variable controls for the unobserved effect. This approach is often referred to as the Mundlak–Chamberlain method (Chamberlain, 1980; Mundlak, 1978). Wooldridge (2005) uses Mundlak’s (1978) approach to design an estimator for the dynamic panel probit regression. Like Heckman’s (1981) approach, it also builds on the random effects (RE) specification. However, Woolridge’s approach is simpler as it can be estimated with standard RE software. The instruments are the set of nonredundant explanatory variables in all periods, that is, strictly exogenous variables that vary over time. The initial condition is assumed fixed, and the dynamics correctly specified.
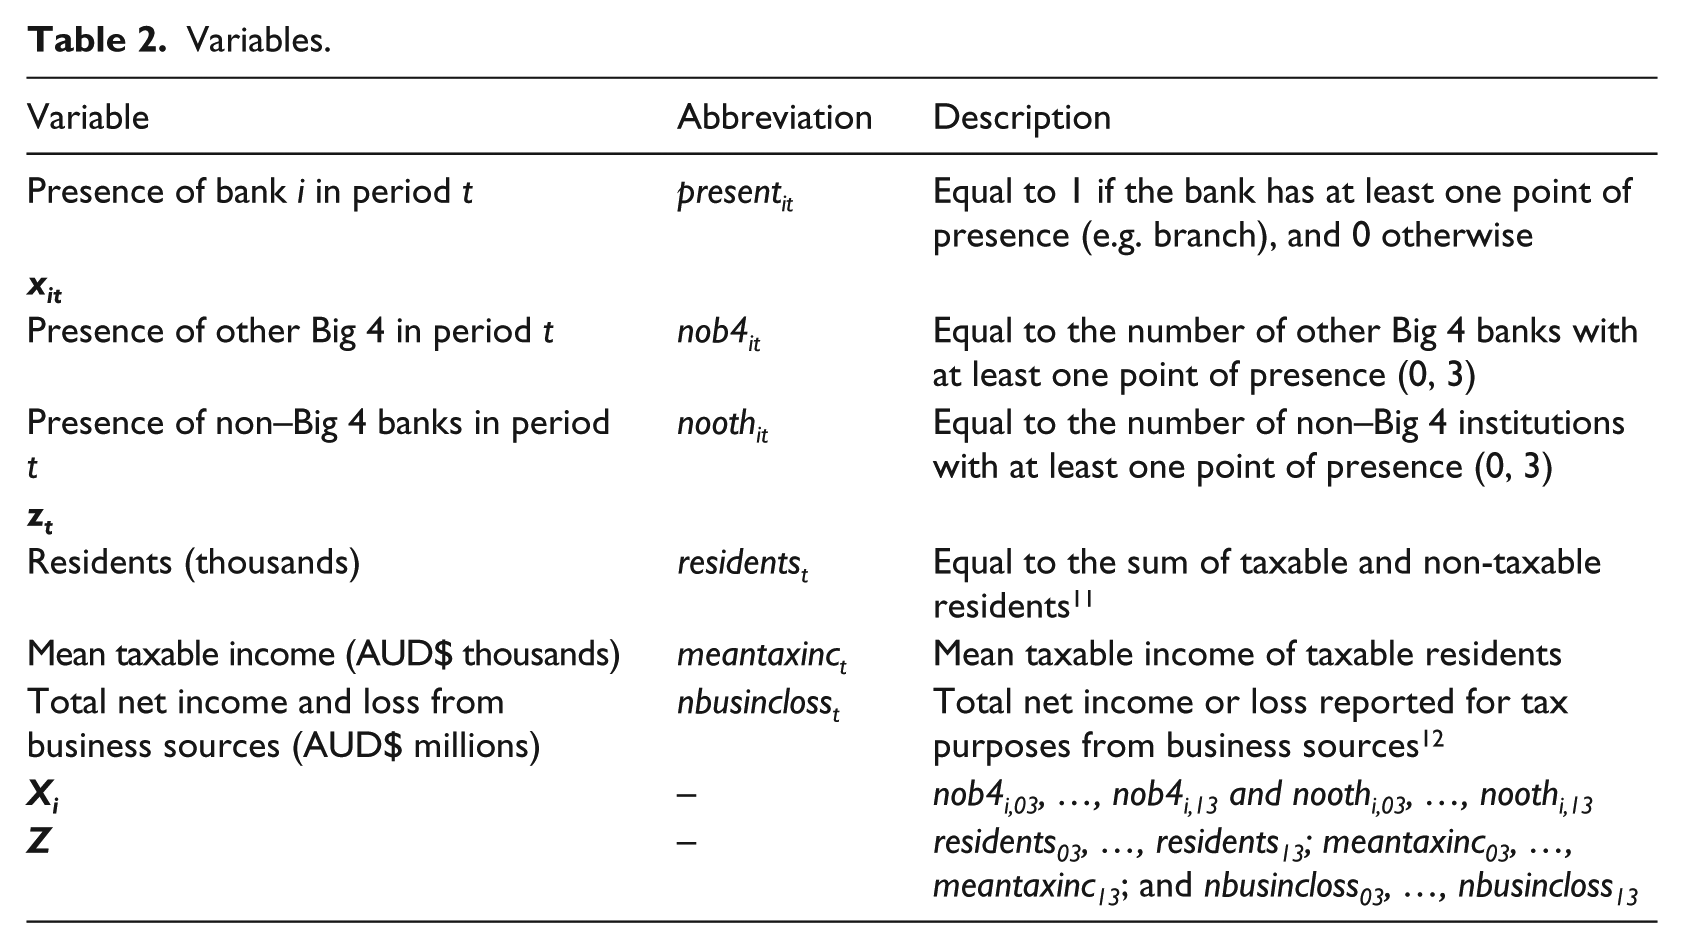
While this framework allows us to control for unobserved postcode level effects, we are unable to estimate the effect of time-invariant variables. The approach taken is to suppose that institutions decide each year whether or not to have a branch-level presence in a particular postcode (a binary variable equal to 1 if the institution is present, and 0 otherwise). We include as explanatory variables a full set of time dummies, the lagged presence variable for the institution of interest, the number of the other Big 4 with a branch-level presence in the postcode and the number of other (non–Big 4) institutions with a branch-level presence in the postcode. In addition, a number of demographic variables are included in the model as controls, which are discussed below.
This approach is not without its limitations. It assumes that bank decisions are independent of each other at any particular time. That is, it assumes that when a bank makes a decision, it takes as given the location decisions of other banks. As such, our approach documents, but does not model, equilibrium behaviour. We note that the inclusion of year dummies may capture particular events that led to the Big 4 banks occasionally making decisions to either expand or contract their network, as shown by the bunching of entry and exit that is depicted in Figure 4.
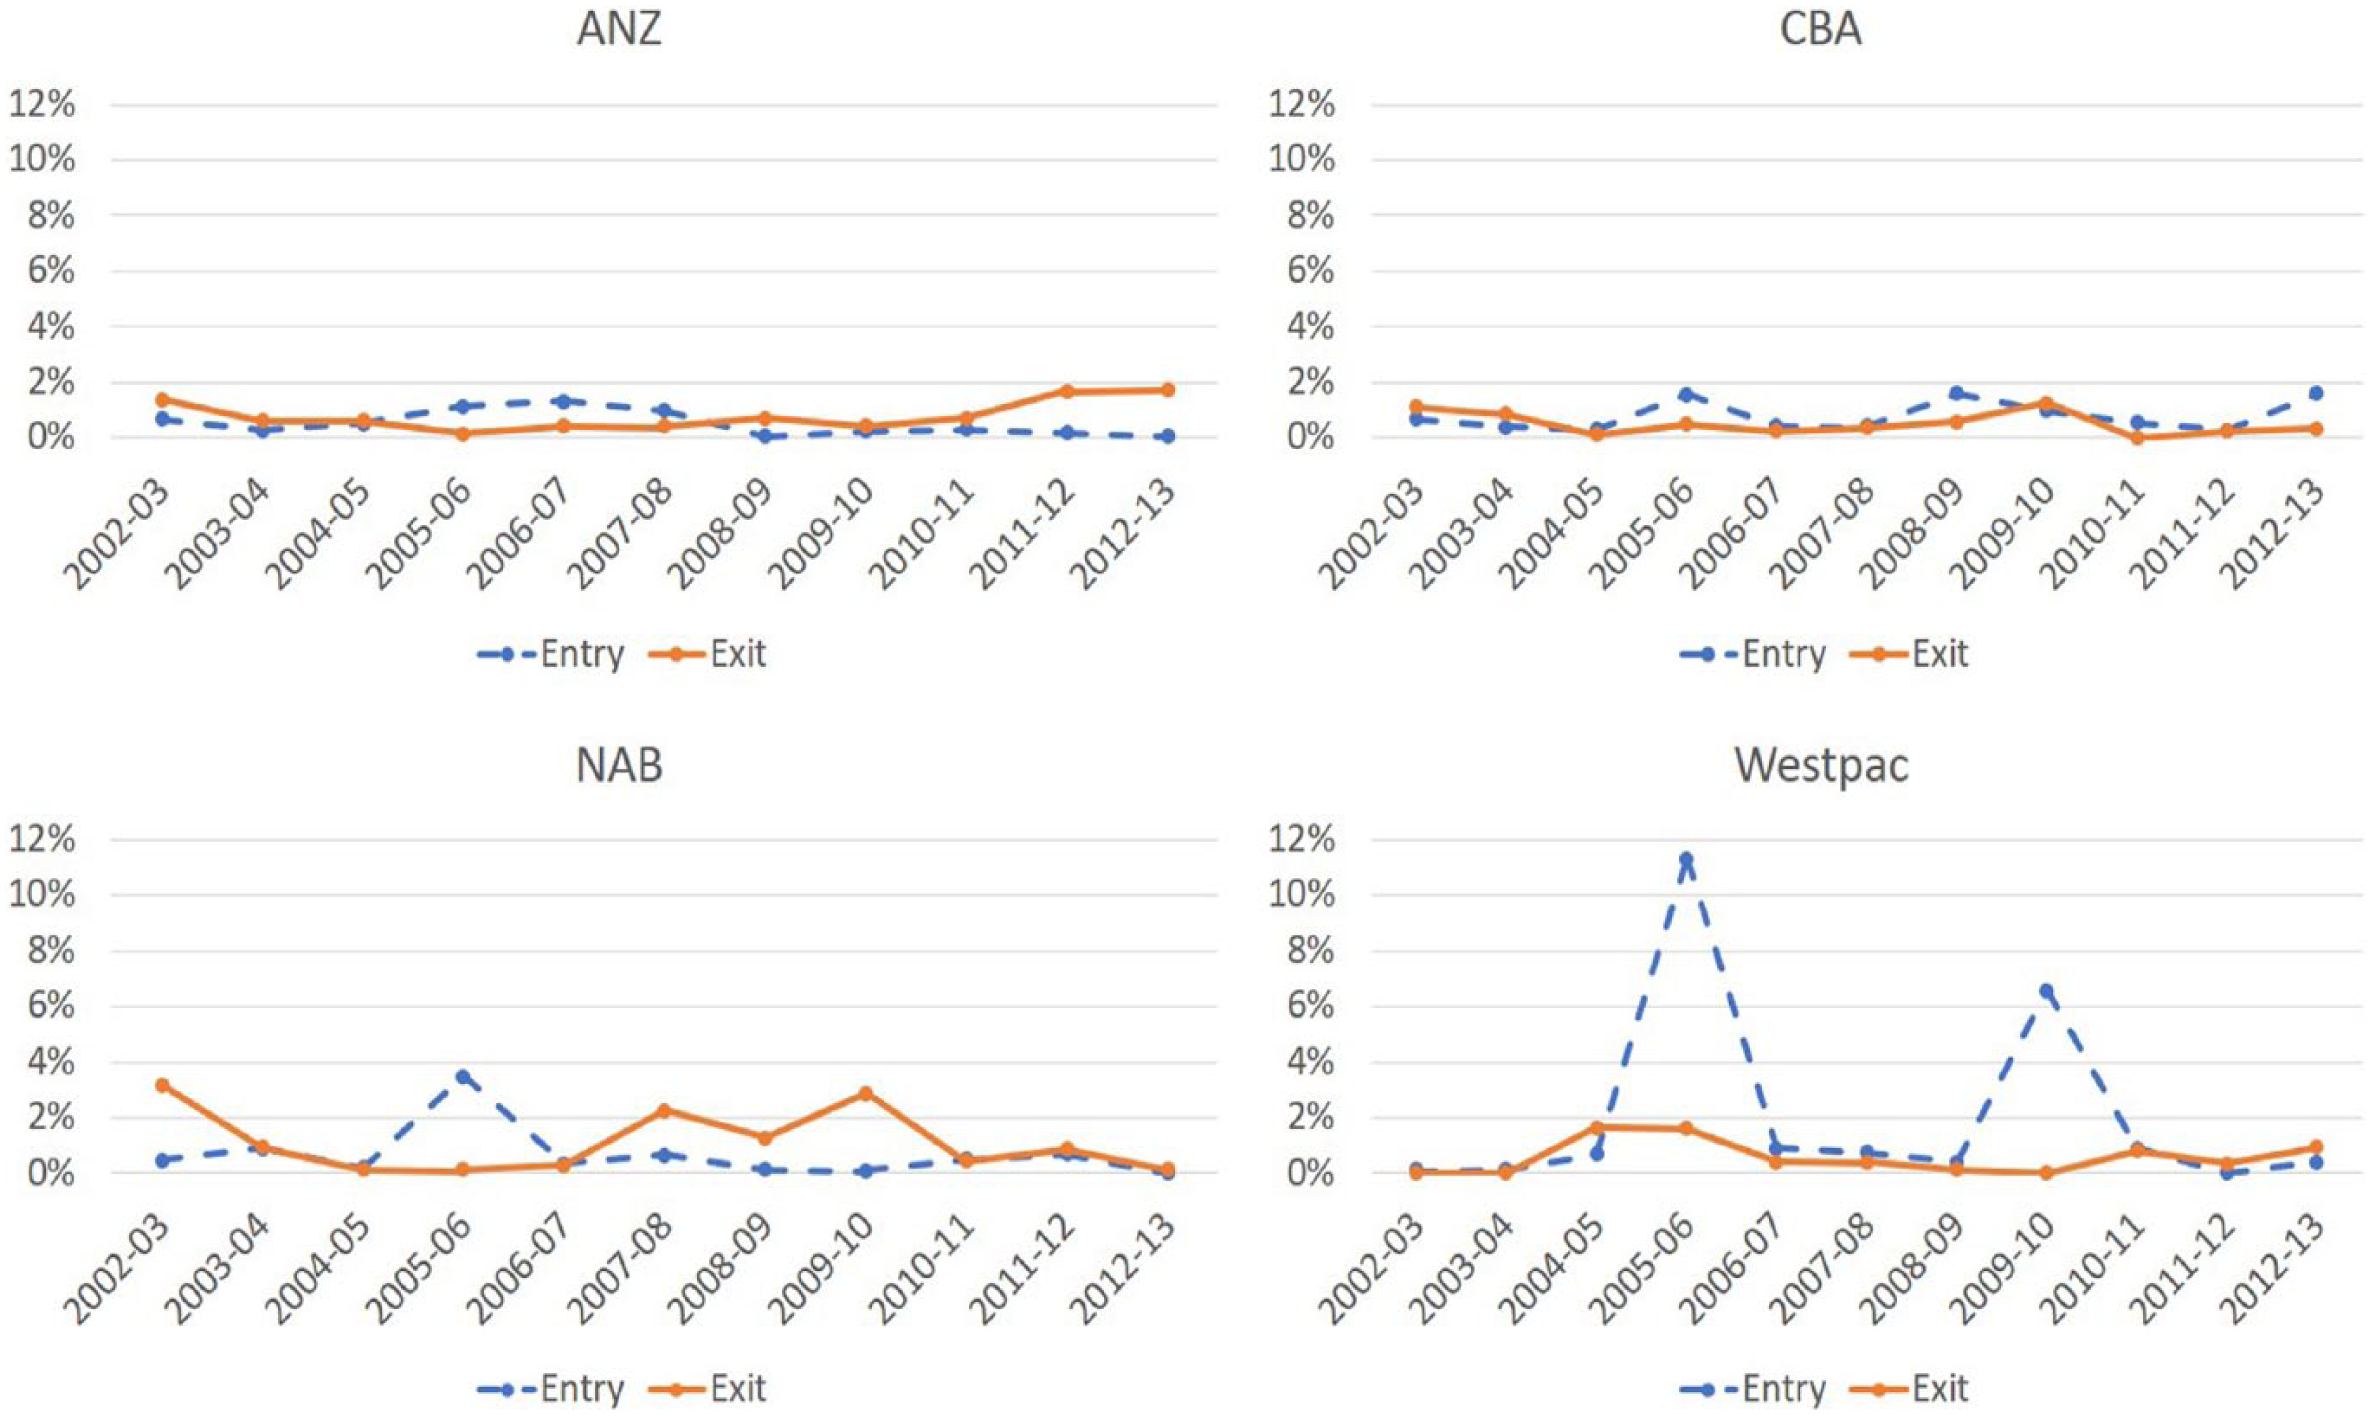
Big 4 entry and exit frequencies 2002–2013.
The econometric model is of the following form 10
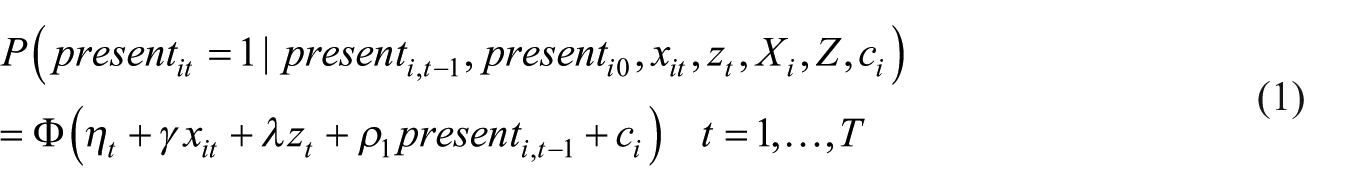
where t = 1 corresponds to 2003 and t = T corresponds to the final year in the sample (2013 in this case) and i indicates the institution of interest. The unobserved effect, ci, is assumed to satisfy the assumptions outlined in Wooldridge (2005). This approach yields a consistent estimator of the average partial effects conditional on an initial condition, which in this case is given by
Variables.
We also estimate analogous regressions for ATM presence. To improve efficiency and to formally test for inter-bank heterogeneity, we then estimate pooled models (combining all Big 4 into a single regression), however, we do not report these results. 13 We then extend the analysis by studying whether there are changes in dynamics linked to the acquisitions in late 2008 or in the post-GFC period. This is achieved by adding interactions between the presence variables and the appropriate year dummies.
4.1. Demographic control variables and descriptive statistics of model data
The presence data (see section 3.1) are supplemented by demographic data from the ATO which report information about personal taxation at postcode level on an annual basis. The variables included are the number of residents, mean taxable income and total net income or loss reported from business sources. The first is included to control for population (residents and population reported in the Census are highly correlated with r = 0.99) and the second to control for socioeconomic factors. The rationale for including total net income and loss from business sources is that business owners may live close to their businesses, and therefore, business income or loss reported in a postcode may be correlated with economic activity in that postcode. Both total net income and loss from business sources and mean taxable income are adjusted for inflation using Australian Bureau of Statistics (ABS) Consumer Price Index (CPI) data. All values are in 2013 Australian dollars.
Table 3 reports descriptive statistics for the variables included in the model. The large standard deviations suggest a high level of inter-postcode variability. There are as few as five residents and as many as 59,765, and mean taxable income ranges from less than AUD$7000 to over AUD$250,000, so there is considerable variation in demographic characteristics.
Descriptive statistics.
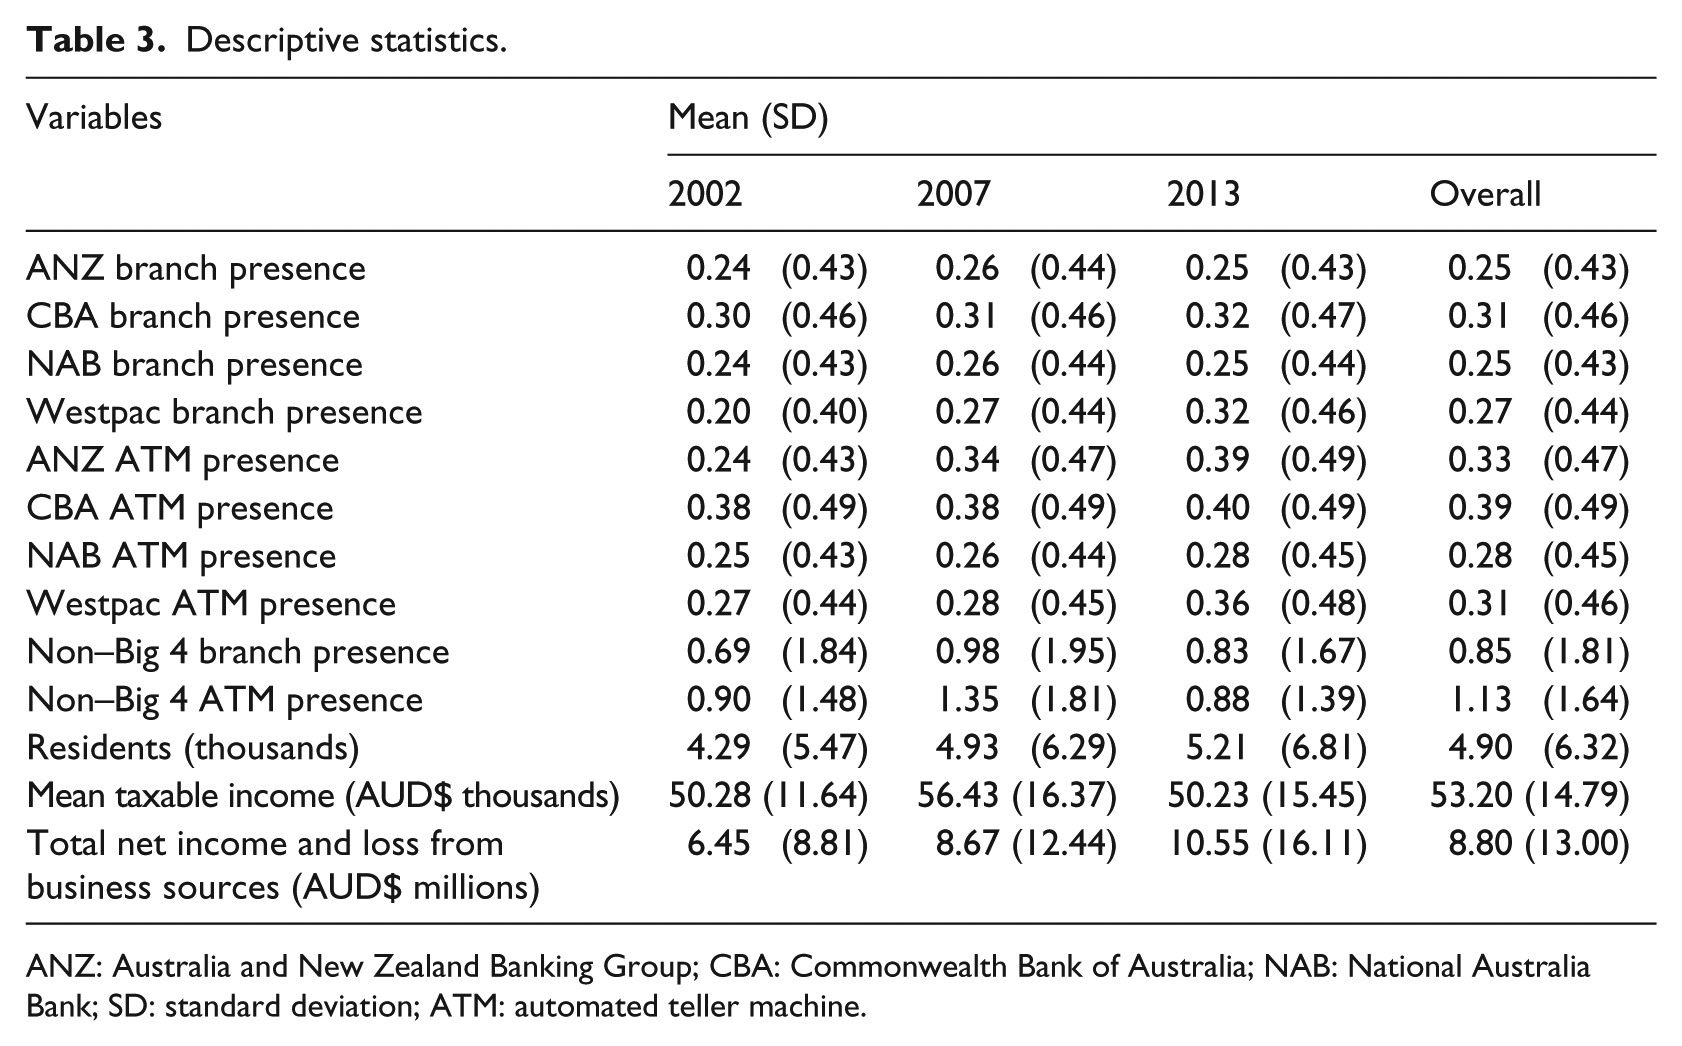
ANZ: Australia and New Zealand Banking Group; CBA: Commonwealth Bank of Australia; NAB: National Australia Bank; SD: standard deviation; ATM: automated teller machine.
Overall, our set of explanatory variables is quite limited. This is an unfortunate consequence of the fact that location is captured by postcode in our data. While we have attempted to include as many explanatory variables as possible, the possibility of omitted variable bias will be an important caveat to the results.
One main objective of the study is to understand the Big 4 banks’ decisions to first enter or finally exit (or stay) in a market. To this end, Figure 4 shows the frequencies of first-time entry and final exit for each of the Big 4 banks from the raw data. Generally, first-time entry frequencies were relatively high (compared with final exit frequencies) in earlier years, while final exit frequencies were relatively high after 2007. The exceptions are CBA and Westpac in 2008–2009 when these banks acquired The Bank of Western Australia and St George, respectively. The spike in first-time entries for the CBA in 2008–2009 is followed in 2009–2010 by a spike in final exits, perhaps suggesting consolidation following the merger. ANZ and the CBA had comparable volatility (all frequencies between 0% and 1.8%), NAB had several years where transition frequencies were between 1% and 3.5%, and Westpac’s trends were dominated by very large spikes in first-time entry frequency in 2005–2006 and 2009–2010 (11% and 7%, respectively). These results highlight the differences between the behaviour of the Big 4 banks, suggesting that first-time entry and final exit decision-making may differ across institutions.
5. Empirical results
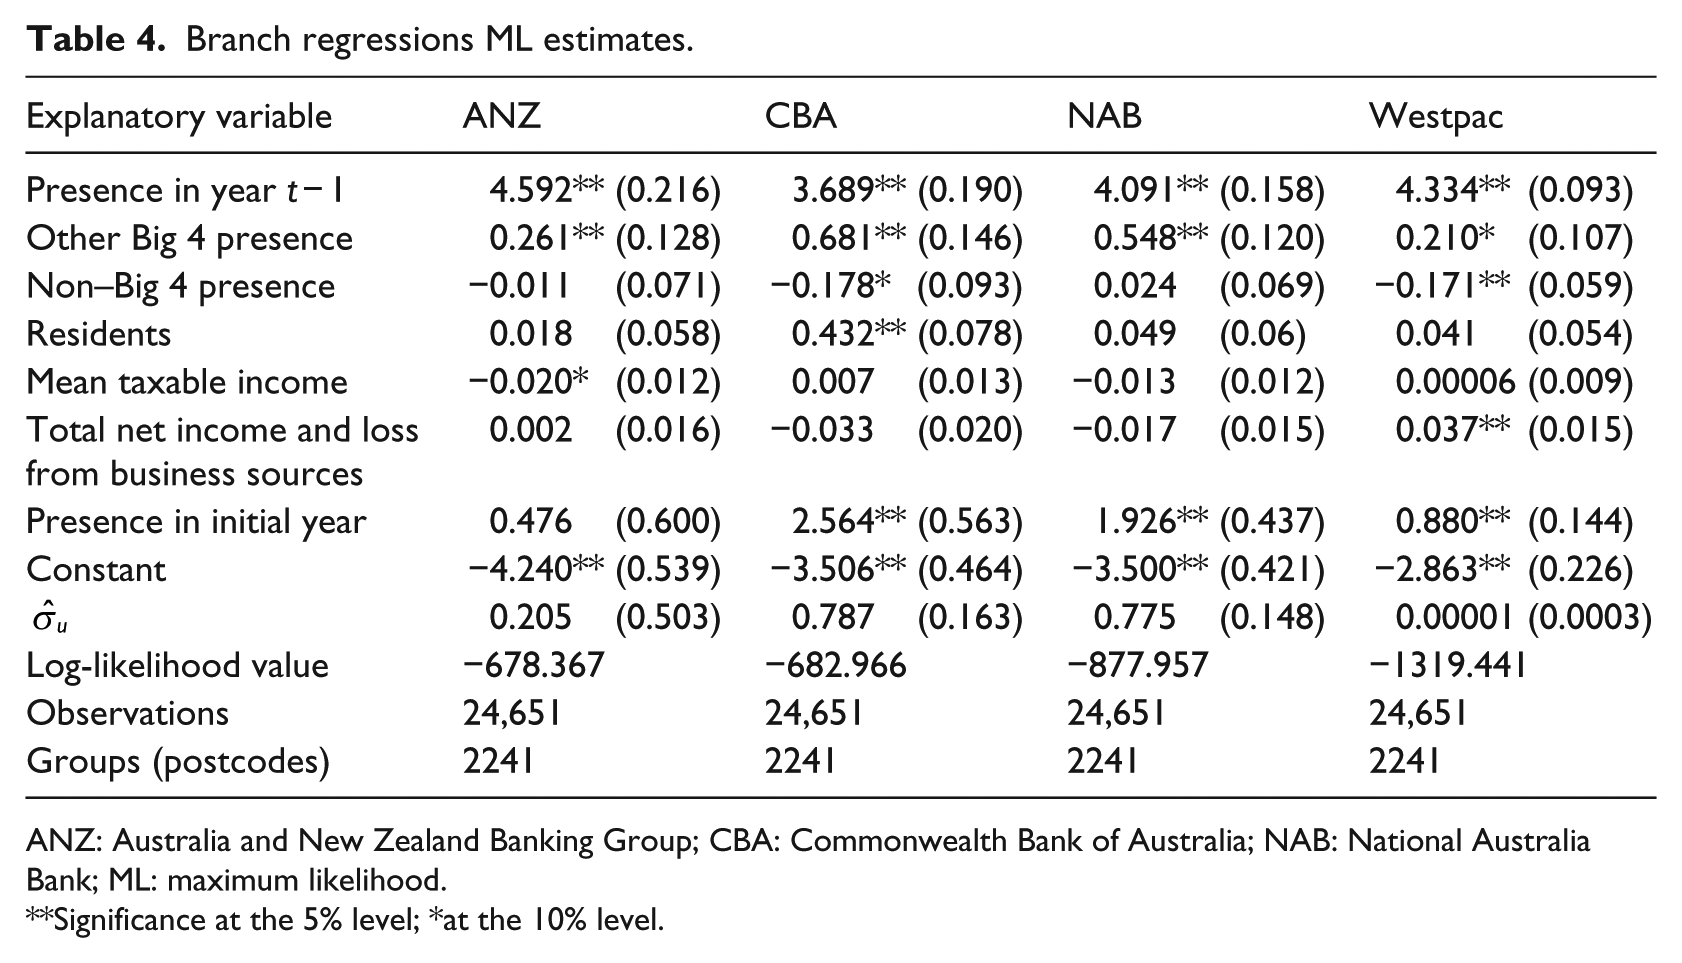
Table 4 reports the maximum likelihood estimates of equation (1). The coefficients of the variables from all periods that are included to account for unobserved heterogeneity (
Branch regressions ML estimates.
ANZ: Australia and New Zealand Banking Group; CBA: Commonwealth Bank of Australia; NAB: National Australia Bank; ML: maximum likelihood.
Significance at the 5% level; *at the 10% level.
Recall that in this framework, the final exit probability is the probability that the institution chooses not to have a branch-level presence in a postcode in year t, conditional on having a branch-level presence in the postcode in year t − 1. Similarly, the first-time entry probability is the probability that the institution chooses to have a branch-level presence in the postcode in year t, conditional on not having a branch-level presence in year t − 1.
Table 4 reveals that lagged presence has a large, positive and significant coefficient for all of the Big 4 banks, and the magnitude of the coefficients is comparable across institutions. There is also evidence that the Big 4 banks agglomerate branches, since the coefficients of nob4t are positive and significant for all four banks. The coefficients for the CBA and NAB are larger than those for ANZ and Westpac.
We find that the coefficient of non–Big 4 institution presence is negative for Westpac (at the 5% level of significance) and there is some evidence (significant at the 10% level) of a negative effect for CBA. The negative coefficients are similar in size, but in the Westpac regression, the coefficient is about 80% of the magnitude of the coefficient of Big 4 bank presence, while for CBA, the Big 4 bank presence coefficient is almost four times as large.
Moreover, the number of residents has a positive coefficient in the CBA regression (and is not significant in the other regressions), and total net income and loss from business sources has a positive coefficient in the Westpac regression. That is, CBA displays a preference for postcodes with relatively high populations, while Westpac displays a preference for postcodes with more economic activity (at least as measured by personal income from businesses). These results may suggest differences in the strategic behaviour of different banks.
The lack of statistical significance of some variables in the individual regressions may be due to data limitations, and more precise estimates may overcome these issues. Estimating a pooled regression with all four institutions may produce more efficient estimates. However, running pooled regressions did not improve the precision of our estimates. As the coefficients of the pooled regressions are similar to those from the individual regressions, we do not report them.
5.1. ATM presence
Besides branches, the other major point of presence for the Big 4 banks is ATMs. As discussed above, the number of ATMs in Australia grew rapidly in the late 1990s but appears to have stabilised since. In this section, we repeat the analysis above using ATM-level presence rather than branch-level presence. The regression equations are unchanged, except that the criterion for presence is now that an institution reports at least one ATM in a postcode.
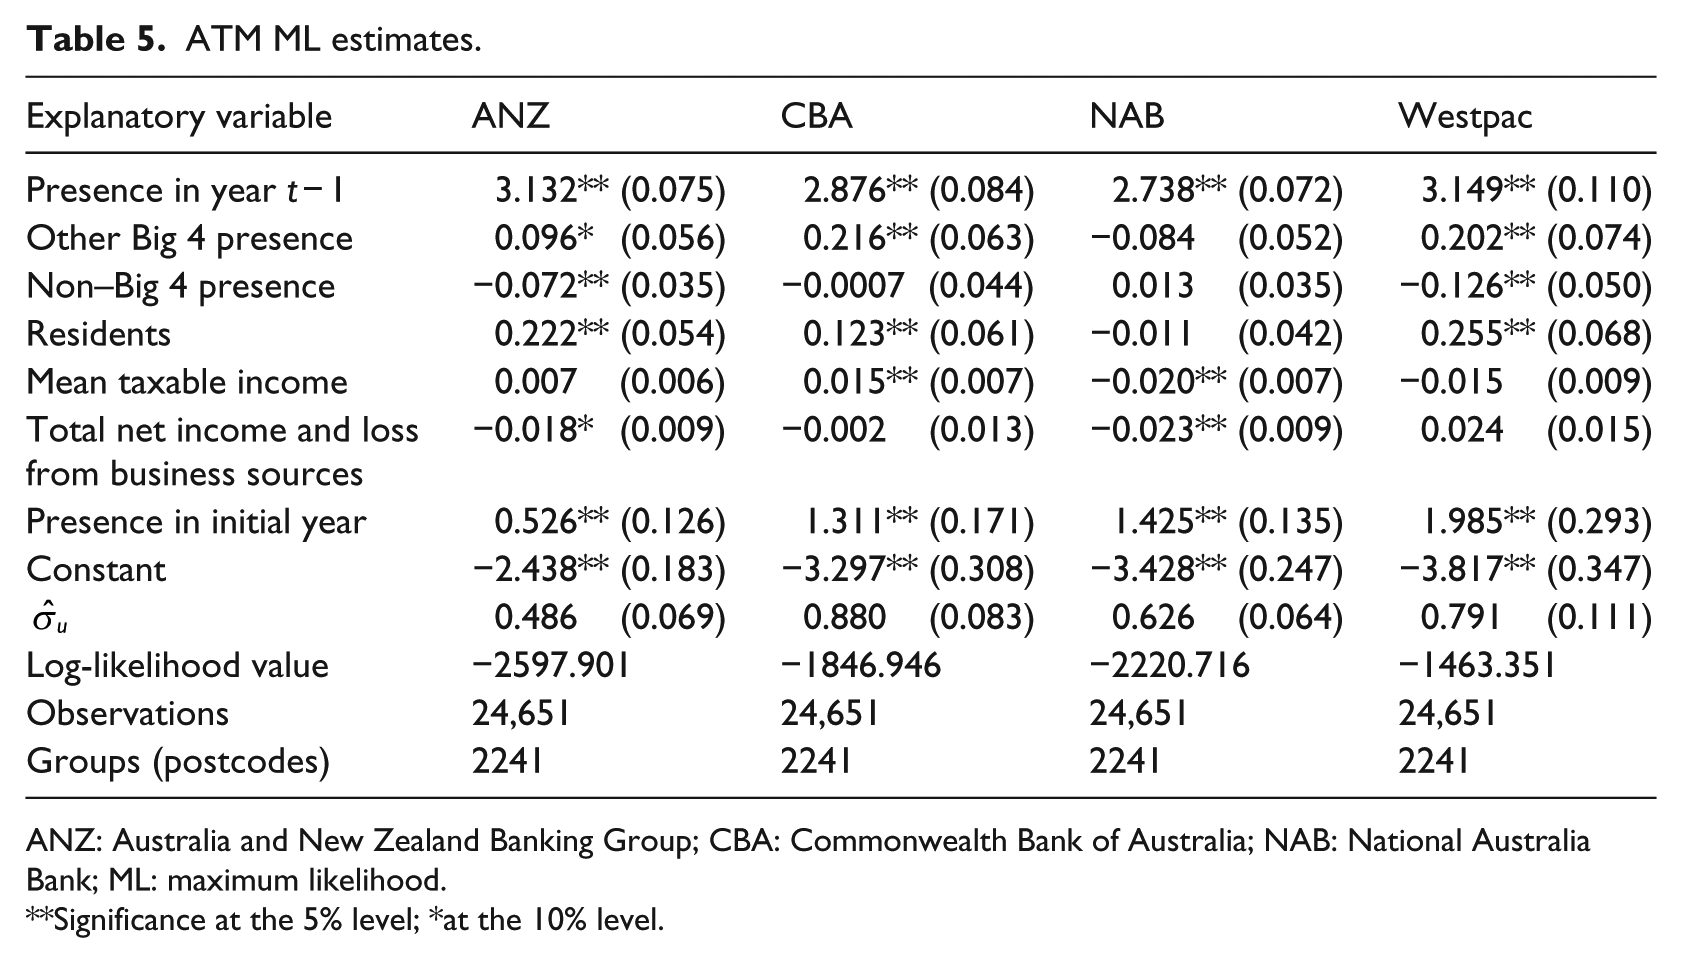
Table 5 reports the maximum likelihood estimates of separate regressions for each of the Big 4 banks (analogous to the results in Table 4 above). As before, we omit the coefficients on the variables included to control for unobserved heterogeneity and the year dummies in order to simplify the output.
ATM ML estimates.
ANZ: Australia and New Zealand Banking Group; CBA: Commonwealth Bank of Australia; NAB: National Australia Bank; ML: maximum likelihood.
Significance at the 5% level; *at the 10% level.
The ATM regression results suggest that ATM presence is more sensitive to market characteristics than branch presence (measured by the number of demographic variables with significant coefficients). It is possible to construct profiles of the postcodes where each of the Big 4 banks is most likely to first enter or least likely to completely exit.
ANZ appears to target postcodes that are poorly served by non–Big 4 institutions, with larger populations and less income reported from businesses. CBA appears to target postcodes where the population is larger and income is higher. By contrast, NAB prefers postcodes with lower taxable income. It is interesting that NAB, alone among the Big 4 banks, does not appear to be affected by the presence of other Big 4 banks when making ATM location decisions. Finally, Westpac appears to target postcodes with fewer non–Big 4 institutions present and larger populations (similar to ANZ).
This interpretation, which focuses on the decision-making of the Big 4 banks, is only one of the possible interpretations. For example, it seems plausible that non–Big 4 institutions would make location decisions to avoid being present in regions with an existing Big 4 presence. This would also appear as a negative coefficient on ‘non–Big 4 presence’ in the regressions. The fact that this pattern is not observed in all four regressions suggests that our results may represent a mixture of Big 4 and non–Big 4 decision-making.
We also ran a pooled regression. While we do not report the detailed results here, the regression results confirm that the lagged presence, number of other Big 4 with ATMs present, total number of residents and number of non–Big 4 institutions with ATMs present affect ATM location decisions differently across the Big 4 banks.
5.2. Acquisitions
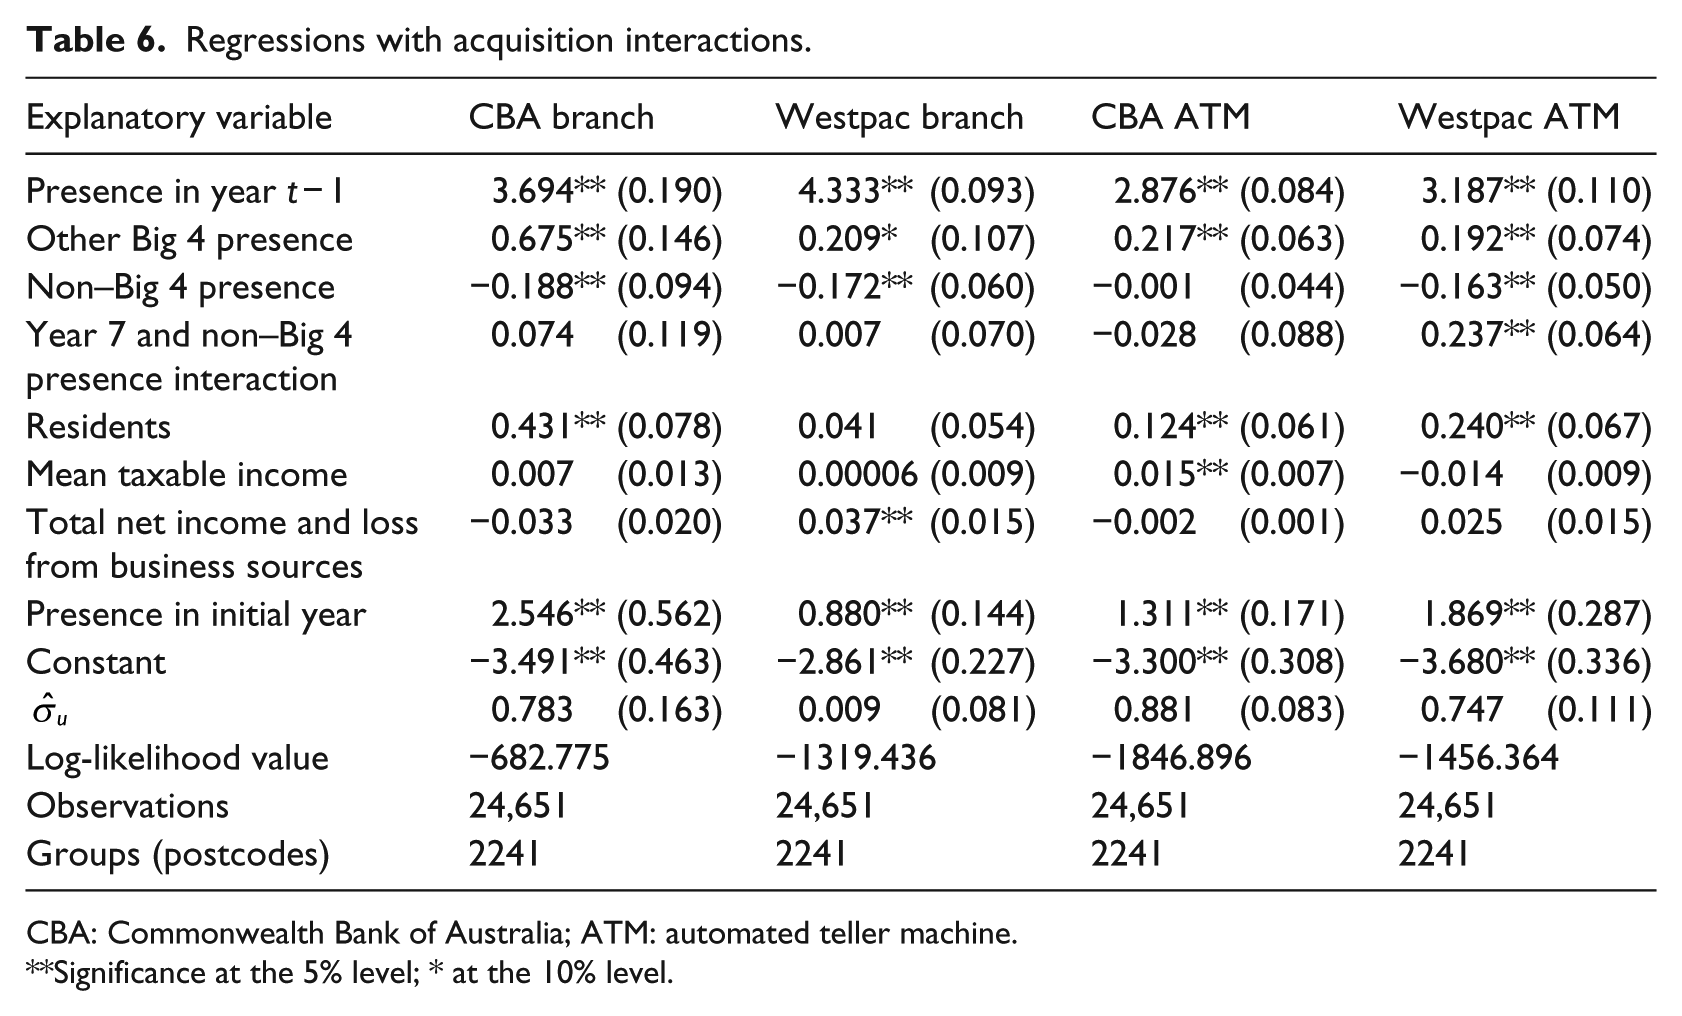
One possible explanation for the negative coefficients on non–Big 4 presence in the Westpac and CBA results is the acquisitions. The acquisitions mean that, in 2009, Westpac and CBA branches ‘enter’ in postcodes where non–Big 4 presence decreases (because St George or The Bank of Western Australia branches ‘exit’). To test whether this might be a reason for the result, we re-estimate the CBA and Westpac regressions adding an interaction between the 2010 dummy variable and non–Big 4 presence. The rationale is that the coefficient on these interactions should capture any change in the non–Big 4 presence coefficient due to the immediate effects of the acquisition (distinct from gradual changes such as consolidation). Table 6 reports the maximum likelihood estimates.
Regressions with acquisition interactions.
CBA: Commonwealth Bank of Australia; ATM: automated teller machine.
Significance at the 5% level; * at the 10% level.
The addition of the acquisition interaction leaves the coefficients unchanged for CBA branches and ATMs and for Westpac branches. The interactions themselves lack significant coefficients in these regressions. The interaction does have a significant coefficient for Westpac ATMs, but it is positive, and including the interaction term increases the magnitude of the negative coefficient on noothatm. The negative effect of non–Big 4 presence on CBA branch presence and on Westpac branch and ATM presence cannot be explained by the acquisitions.
5.3. Other points of presence
The APRA data contain a number of points of presence which are not branches or ATMs. These include agencies of various types, business development managers and offices (e.g. head offices without branch facilities), as well as facilities such as EFTPOS and electronic banking (e.g. phone and Internet banking).
One challenge with analysing the data is that reporting of these points of presence appears to be inconsistent, and the boundaries between different points of presence types can be ill-defined. Consequently, analysis focusing on single point of presence types may lead to misleading conclusions. However, it is possible that important trends in bank behaviour cannot be seen in branches and ATMs alone. To investigate this possibility, we estimate another group of regressions based on the presence of any of several point of presence types. In particular, we repeat the analysis above for branches and ATMs, but now, define an institution as being present if it has at least one point of presence which is one of the several types. We exclude ATMs and also exclude points of presence for which location is not meaningful (e.g. electronic banking).
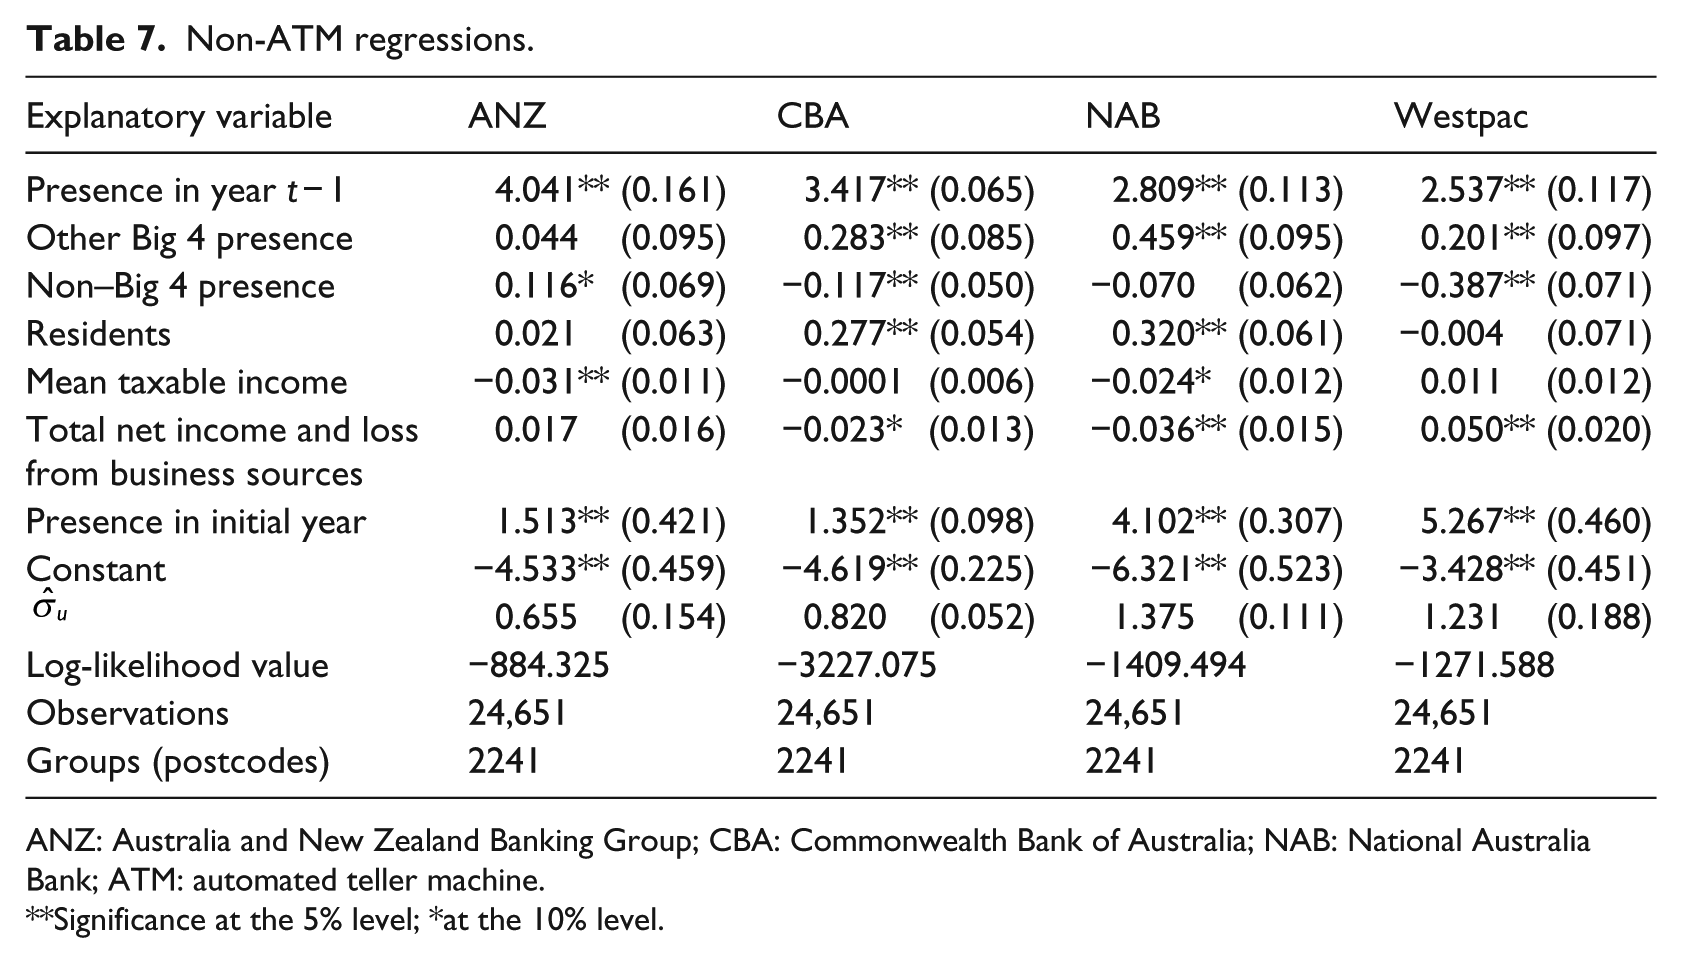
Table 7 reports the maximum likelihood estimates of separate regressions for each of the Big 4 banks (analogous to the results in Table 4 above). As before, we omit the coefficients on the variables included to control for unobserved heterogeneity and the year dummies in order to simplify the output.
Non-ATM regressions.
ANZ: Australia and New Zealand Banking Group; CBA: Commonwealth Bank of Australia; NAB: National Australia Bank; ATM: automated teller machine.
Significance at the 5% level; *at the 10% level.
The results reported in Table 7 reveal that as with branches and ATMs, past presence is the key determinant of the decision to remain present in a given location. We have also run a pooled regression, which is omitted but confirms that coefficients differ between the Big 4 banks for lagged presence, number of other Big 4 banks present, number of non–Big 4 banks present and total number of individuals. These results (beyond just past presence) are broadly similar to those obtained for branches, which suggests that there are unlikely to be dramatically different location patterns for other points of presence that warrant further investigation.
5.4. Behaviour before and after the GFC
Australian ADIs appear to have been relatively mildly affected by the GFC, at least at the levels of aggregate ATM and branch presence. The most notable consequences are the two large acquisitions in late 2008. 14 However, Australian ADIs were not immune to profit downturns and funding challenges after 2008 (Donovan and Gorajek, 2011). To examine whether dynamics changed in the post-GFC environment, we create a new variable gfc which takes the value 1 if the year is 2008 or later, and 0 otherwise. We then run new regressions adding interactions between gfc and both Big-4 presence and non–Big 4 presence. The results are reported in Table 8 (for branches) and Table 9 (for ATMs). There is evidence of different post-GFC behaviours for branch placement for all of the Big 4 banks except NAB. ANZ showed agglomeration before the GFC (Big 4 presence had a positive coefficient), but this ceased after the GFC. Non–Big 4 presence does not have significant coefficients in the CBA or Westpac regressions before the GFC but has negative coefficients after the GFC.
GFC branch regressions.
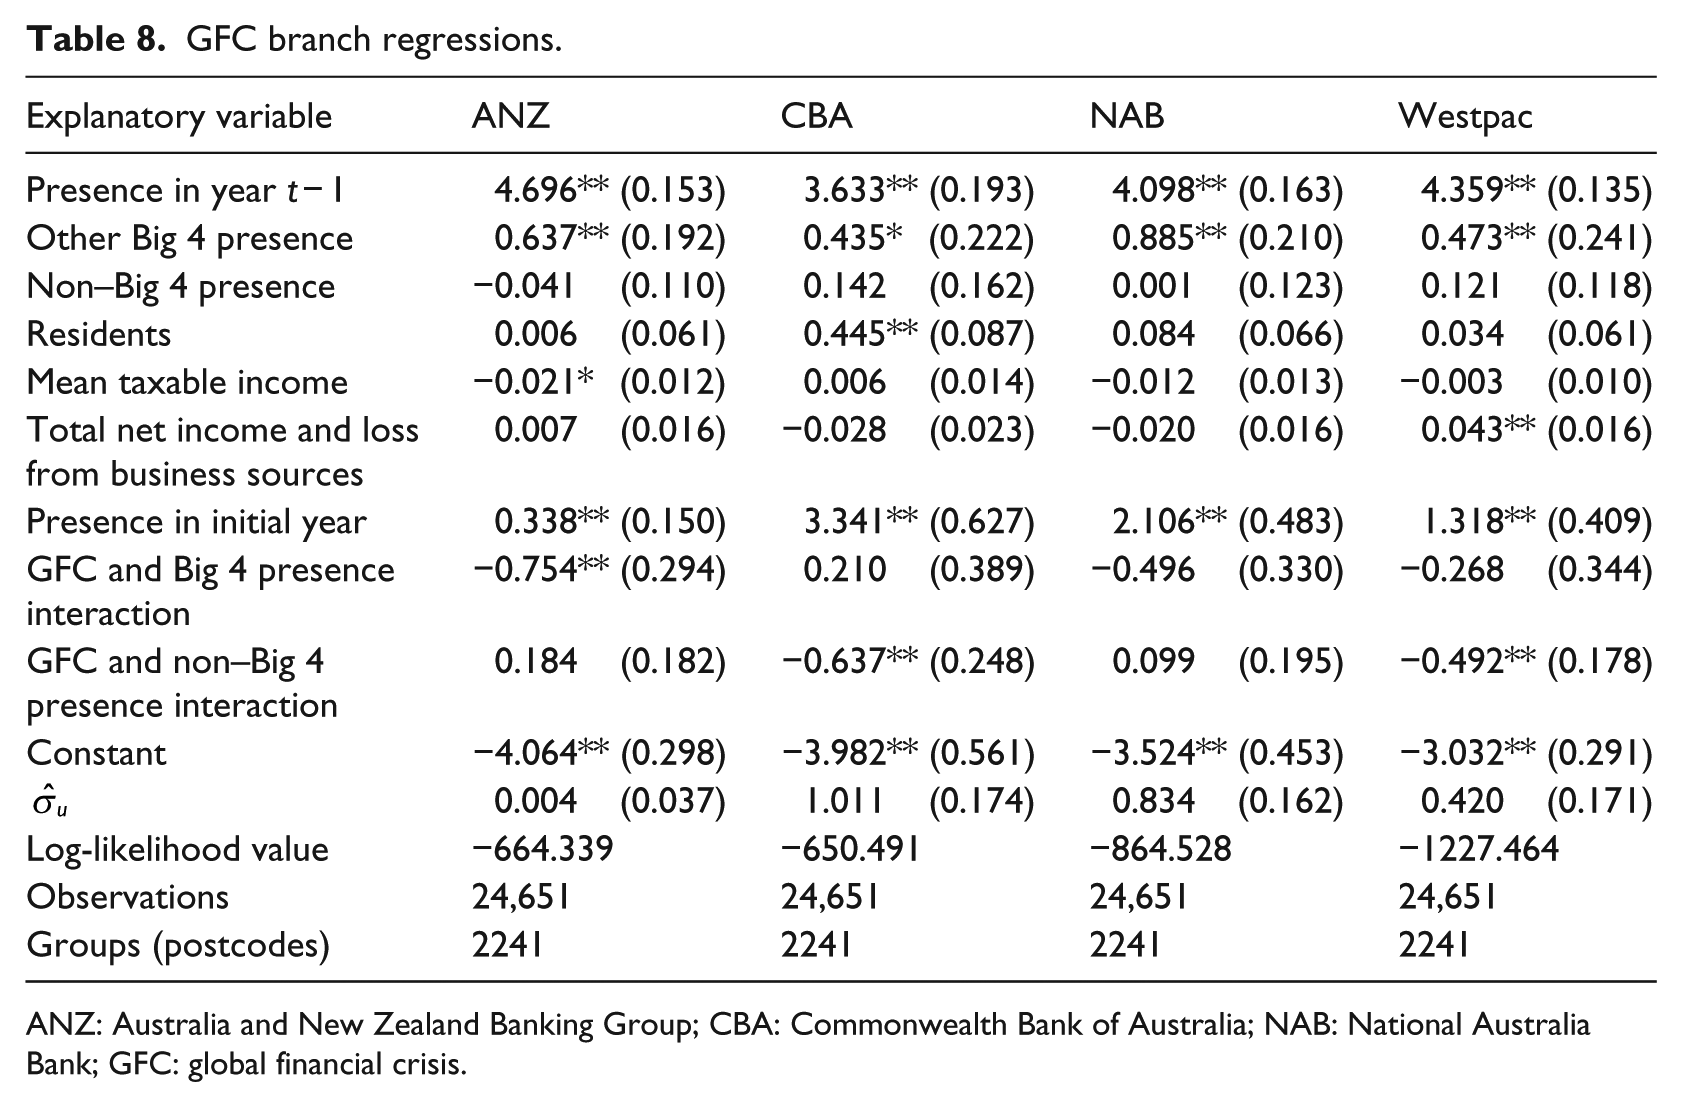
ANZ: Australia and New Zealand Banking Group; CBA: Commonwealth Bank of Australia; NAB: National Australia Bank; GFC: global financial crisis.
GFC ATM regressions.
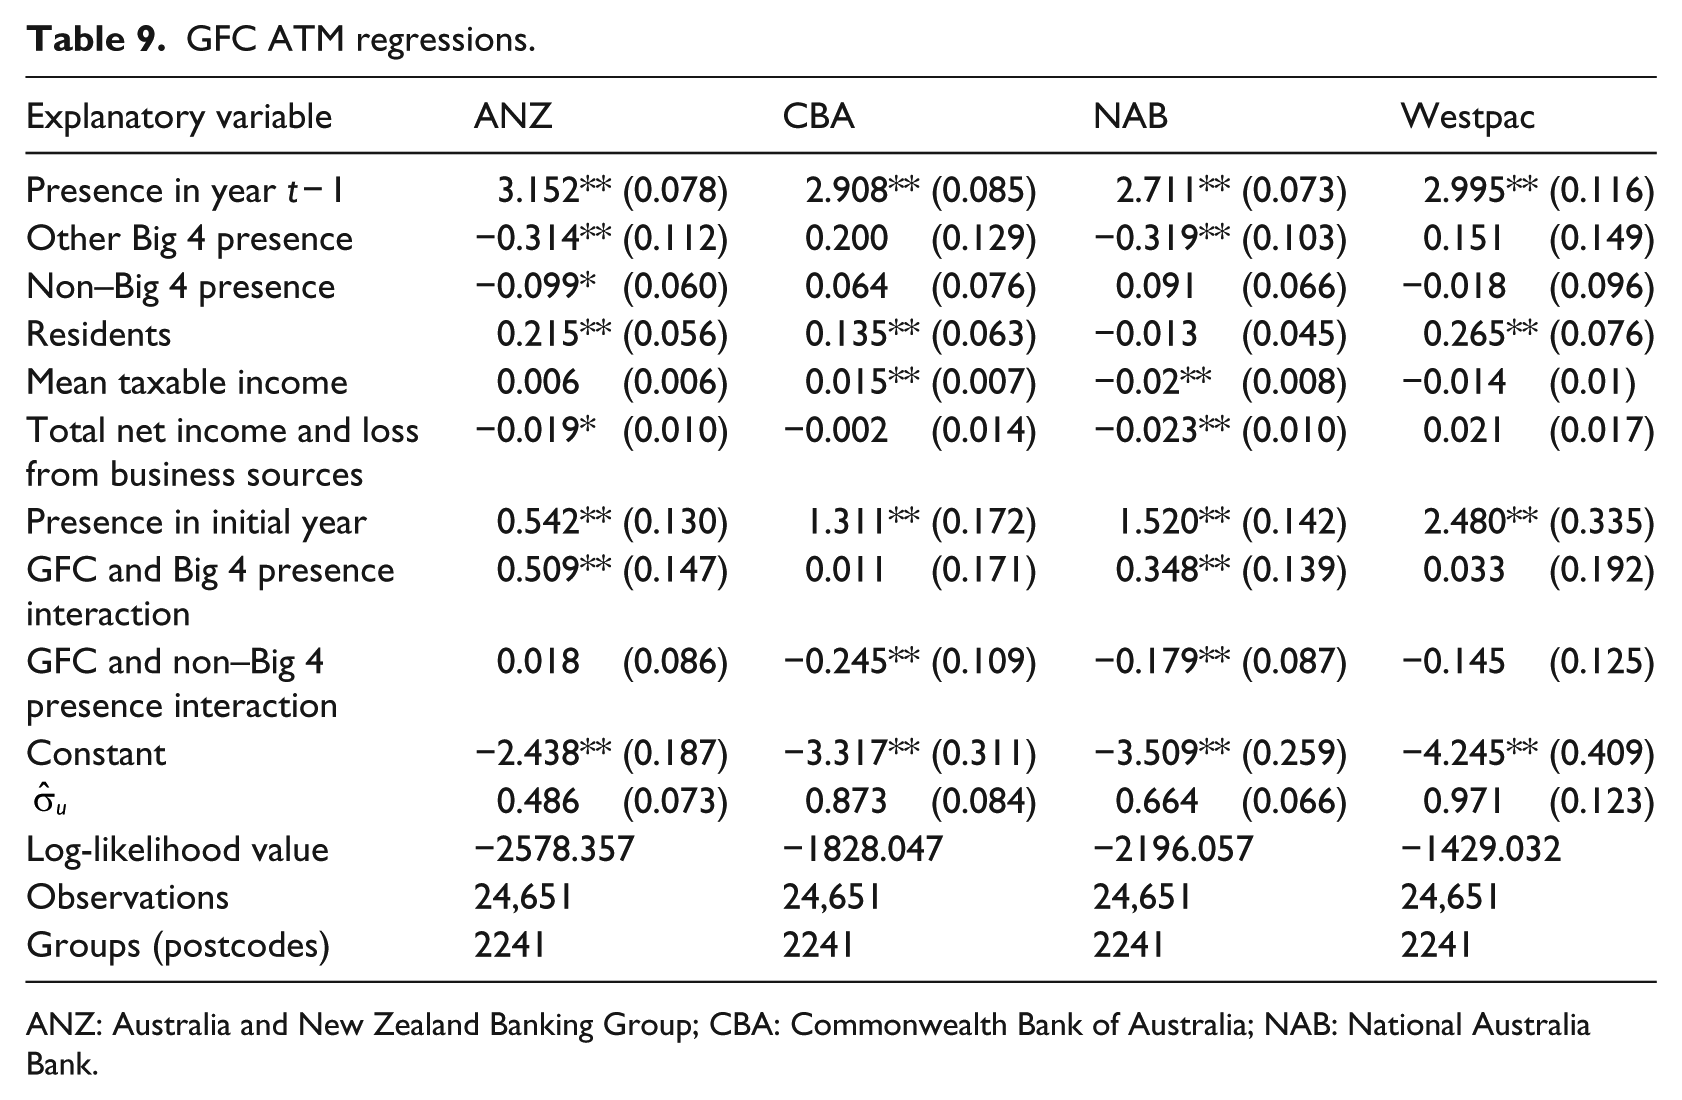
ANZ: Australia and New Zealand Banking Group; CBA: Commonwealth Bank of Australia; NAB: National Australia Bank.
For ATM placement, there is evidence of changed behaviour for all of the Big 4 banks except Westpac. ANZ located ATMs away from other Big 4 before the GFC, but not afterwards, while the CBA responded negatively to non–Big 4 presence only after the GFC. NAB presence was negatively affected by other Big 4 before the GFC, but not after, when non–Big 4 presence instead becomes important (with a negative coefficient). Although there are some cases where pro-competitive behaviour appears to be lower during the post-GFC period (notably the placement of ANZ branches), there does not appear to have been a systematic retreat from competition.
Despite this evidence of changed behaviour, our data do not allow us to establish a causal link with the GFC. The period of interest was a dynamic one for the banking industry and other factors, such as technological change, are likely to have been driving some behavioural change. However, a link to the GFC does suggest an explanation for some of the results. As we have argued, the GFC was a factor contributing to the acquisitions of St George and The Bank of Western Australia. Having acquired The Bank of Western Australia, with its extensive network of regional branches and ATMs, the CBA might have been expected to consolidate in following years by closing some regional points of presence or slowing the rate at which new ones were opened. If regional postcodes have higher levels of non–Big 4 presence, this consolidation would be consistent with the pattern of coefficients in the CBA regressions. A similar explanation may be behind the Westpac branches result.
Note, however, that the implications of the acquisitions for competition overall are unclear; CBA and Westpac may be closing branches in regional areas during consolidation (which could be bad for competition), but at the same time, the acquisitions themselves may mean a Big 4 presence in markets previously served only by smaller banks. If The Bank of Western Australia was in a weak position, then its ability to be a robust competitor might have been in question anyway.
5.5. Estimates of entry and exit probabilities
Further evidence of the divergence of behaviour by the Big 4 banks can be found in the estimates of first-time entry and final exit probabilities, which are presented below. Such evidence may be interpreted as a sign of competitive tension among the largest banks. The method for estimating probabilities is described by Wooldridge (2005).
We estimated first-time entry and final exit probabilities for four representative postcodes as follows. P1 has no other institutions of any type present, P2 has one other Big 4 bank and two non–Big 4 institutions present, P3 has two other Big 4 banks and three non–Big 4 institutions present and P4 has three other Big 4 banks and four non–Big 4 institutions present. These representative postcodes describe market structures that can be ranked from lowest amount of competition (P1) to highest (P4). We computed first-time entry and final exit probabilities for 3 years 2005–2006, 2009–2010 and 2012–2013.
In order to compute first-time entry and final exit probabilities, we need to choose representative values for taxable income, residents and net personal income or loss reported from businesses. These are based on the mean values for the relevant year. The values used are AUD$43,000, AUD$4600 and AUD$6.4 million in 2006; AUD$56,000, AUD$5000 and AUD$8.8 million in 2010; and AUD$50,000, AUD$4900 and AUD$10 million in 2013. Table 10 shows the estimated entry and exit probabilities for branches.
Estimated transition probabilities branches.
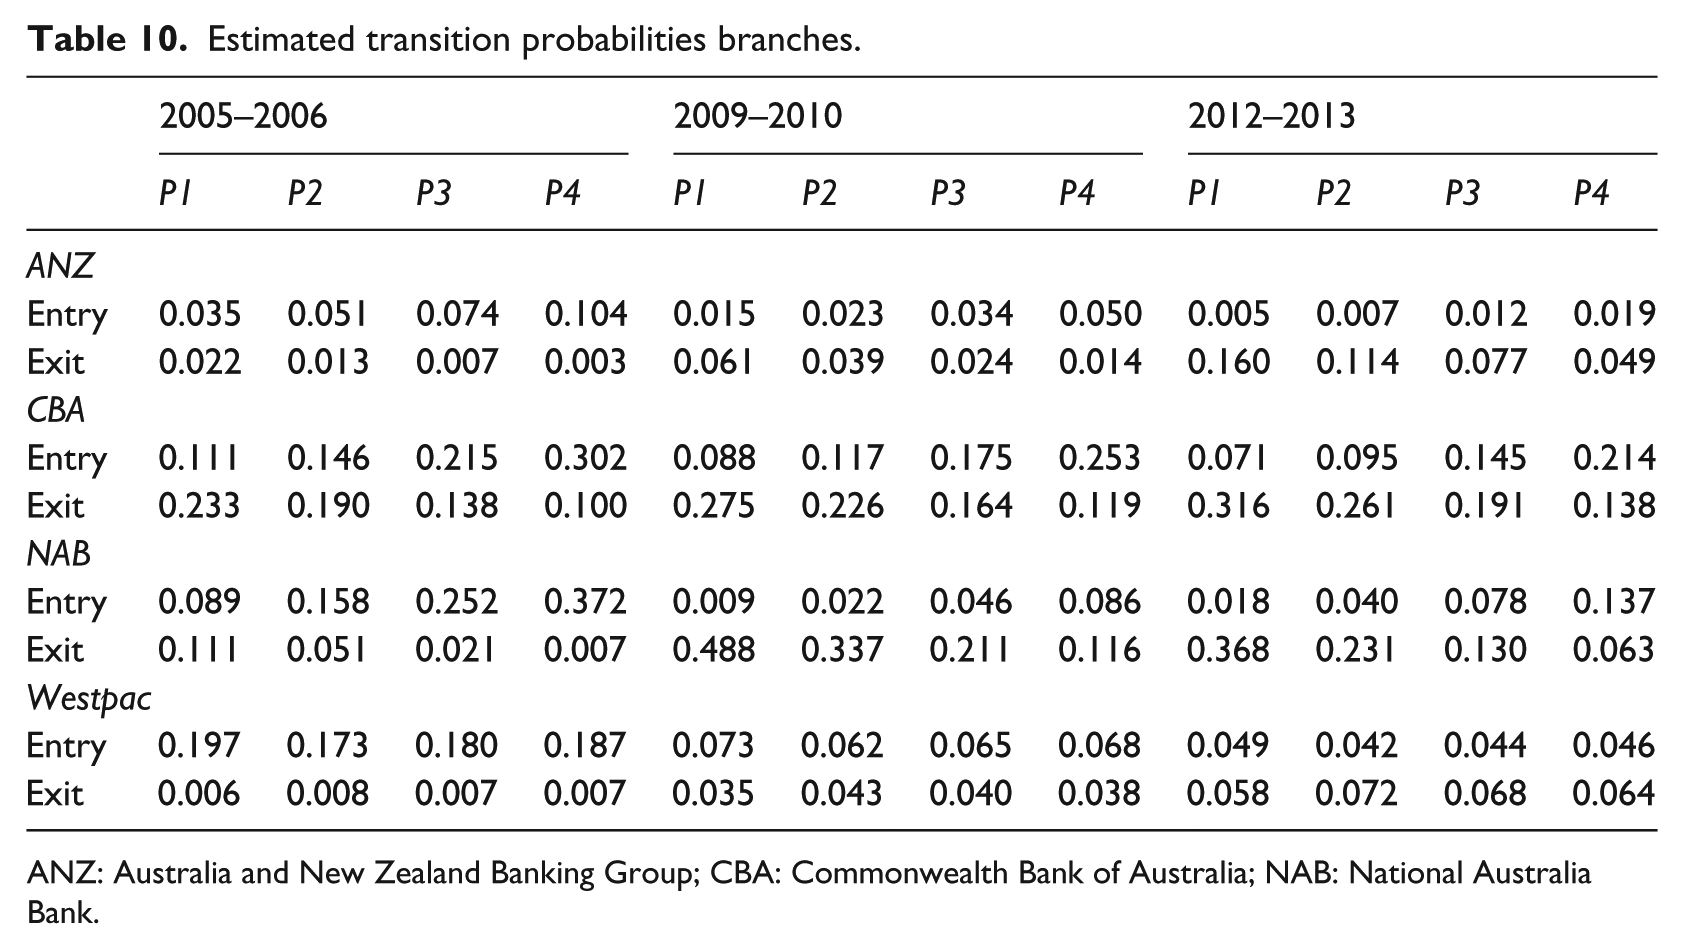
ANZ: Australia and New Zealand Banking Group; CBA: Commonwealth Bank of Australia; NAB: National Australia Bank.
Table 10 suggests that, with the exception of Westpac, the behaviour of Australia’s largest banks, while quantitatively different, is qualitatively similar. The behaviour of Westpac was most likely impacted by its acquisition of St George in 2008–2009.
In particular, the estimated probability of first-time entry increases monotonically as the market becomes more competitive and the probability of final exit decreases monotonically with competition. These two stylised facts taken together suggest that the Big 4 banks, with the exception of Westpac, are more likely to be located in more competitive markets.
The estimated probabilities can also be seen as circumstantial evidence that the concern that banks may not be competing in remote areas may not be related to the competitiveness of the banking sector but may rather be driven by fundamentals such as low economic activity. The estimated probabilities suggest that Australia’s banks do not shy away from competition.
5.6. Robustness tests
We re-estimate all results twice to test whether they are affected by our construction of the data set. In particular, we are interested in whether the decision to replace ‘missing’ values with zeros for postcodes that appear in at least 1 year changes the results. To test this, we re-estimate excluding all postcodes missing from any year and then re-estimate again excluding all postcodes missing from at least 4 years.
The re-estimated results are largely unchanged. 15 In a small number of cases, the significance (but not the sign or magnitude) of the coefficients of interest is different. Overall, however, we conclude that our results are robust to the construction of the data.
6. Concluding comments
Our analysis of the location decisions of Australian banks suggests that past presence is the most important factor for explaining current presence in a particular postcode. The impact of economic variables on location decisions is less clear and varies between the Big 4 banks. While this result may reflect differences in how the Big 4 banks respond to different variables such as number of residents or business activity, the nature of the data available at the postcode level limits our ability to draw definite conclusions.
Importantly, we present evidence that the four largest banks agglomerate branches. That is, we do not find convincing evidence to support concerns about the willingness of the Big 4 banks to compete in branch or ATM placement, either after the GFC or in the 2002–2013 period as a whole. Concerns about service levels in regional areas may reflect fundamentals rather than an insufficiently competitive banking system.
Finally, the impact of the location of other banks on the location of the four largest banks is less clear; there is some limited evidence that this impact is negative for two of the four largest banks. However, this evidence is not sufficient to conclude that the existing branch networks act as a potential barrier to entry, a possibility that was raised in the Senate Inquiry (p. 63).
Footnotes
Acknowledgements
The authors thank the Associate Editor and a referee for many useful comments. The usual disclaimer applies. Flavio Menezes acknowledges his senior research fellowship with AIBE.
Final transcript accepted 29 May 2017 by Hodaka Morita (AE Economics).
Funding
The authors disclosed receipt of the following financial support for the research, authorship, and/or publication of this article: This work is financially supported by the Australian Institute of Business and Economics.