
Abstract
Decision-making in property investment by superannuation funds is an important investment decision, but it is different to their decision-making on other asset classes included in their asset portfolios. The large value and heterogeneous nature of individual pieces of real estate make the market for real estate relatively illiquid and subject to larger transaction costs than other asset classes. Based on interview surveys of Australian superannuation funds, using the analytical hierarchical process (AHP), we identified strategic decision-making as being the most important factor used by the superannuation funds when making decisions on the management of their property investment portfolio. Comments during the interviews indicated that their decisions were influenced by restrictions in their fund’s investment mandate and the level of funds that they had to invest. The AHP technique has allowed this research to provide a more in-depth understanding of the management of decision-making factors than previous surveys.
1. Introduction
Research has shown that it is beneficial to include property in mixed-asset portfolios for institutional investors, such as superannuation funds. The unique characteristics of property, such as its large size, heterogeneity and illiquidity, can allow investments in property to achieve favourable returns in the long run (Hoesli and MacGregor, 2000). The low correlation between returns on property investment and the returns generated by other asset classes, as well as the ability for property investments to hedge against inflation, make mixed-asset portfolios more diversified when property is included (Hudson-Wilson et al., 2003). Empirical studies have found that institutional investors should allocate between 6% and 12% of their mixed-asset portfolio to property (Chun et al., 2004). Post global financial crisis references about property in Australian superannuation funds have largely focused on optimal allocations to property and property-allocation strategies as part of the fuller investment context, often using asset allocation models; see Reddy (2012) and Reddy et al. (2014). Areas such as the role of different property types and property investment decision-making criteria have not been assessed. Very little research has been undertaken on the factors that institutional investors use when deciding on the management of their property investments. The motivation for this article is to identify the main factors that are currently being used in decision-making on property investment by the largest group of institutional investors in Australia, which are superannuation funds. These factors may differ from factors identified in previous studies due to advancements in knowledge and technology.
A unique characteristic of superannuation funds, 1 over other types of institutional investors in Australia, is that the introduction of the Superannuation Guarantee Charge in 1992 made it compulsory for people in the Australian workforce to contribute to a superannuation scheme. In 2016, the Organisation for Economic Co-operation and Development (OECD) reported that total assets held by Australian superannuation funds was the third largest holding, after the United States and United Kingdom, by pension funds across the world. 2 The assets under management (AUM) held by funds regulated by the Australian Prudential Regulation Authority (APRA) increased by 232.3% from $388.9 billion in June 2001 to $1292.2 billion in June 2016. 3 At the same time, the number of APRA regulated funds decreased by 80.3% from 11,794 to 2324. 4 This clearly showed a smaller number but larger superannuation funds now forming the superannuation sector. The 10 largest Australian superannuation funds (by AUM) in June 2016 are given in Table 1 (APRA, 2017).
The 10 largest Australian Superannuation funds by AUM as at June 2016.
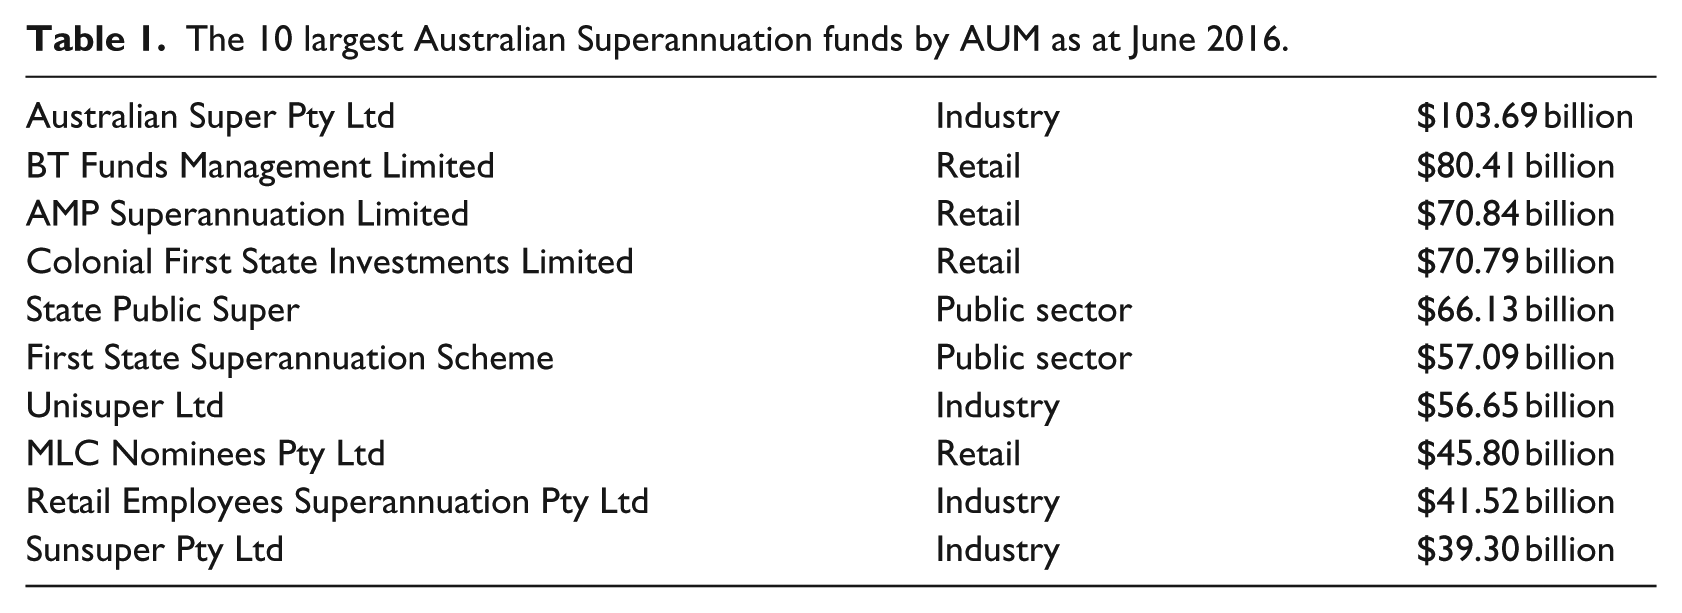
The large amount of funds held with Australian superannuation funds, along with the fact that workers are unable to access their superannuation prior to retirement, means that superannuation funds are one type of institutional investor that would benefit from including property in their investment portfolio. The long-term nature of superannuation funds means that they will be looking to diversify this large amount of funds across asset classes that can achieve high returns over the long run and are not highly correlated with the other asset classes, such as equity. Property is one such asset class. Currently, as at December 2016, the asset allocation by Australian superannuation funds was 50% in equity, fixed income 20%, cash 12%, property 9%, infrastructure 5% and other 4%. 5 There has been very little change in this asset allocation over the past few years.
In Australia, as an institutional setting, superannuation funds invest in property via direct investment, unlisted property funds and real estate investment trusts (REITs). The allocation among these three types of property investment is influenced by the superannuation fund’s AUM and experience in property investment, as well as their overall mandate. A detailed breakdown by property investment style is not provided by APRA. Typically, direct investment and unlisted property funds are preferred due to their stronger link to direct property performance, with REITs being more strongly linked to overall stock market performance. This sees REIT investments as managed by both the property team and equity team; depending on the fund’s mandate and investment philosophy.
The focus of the property investments by superannuation funds is on office, retail and industrial property. Residential property investment is not favoured due to the small size considerations, difficulties in establishing a substantive residential portfolio and typically residential property not being able to deliver sufficient yield or income return to the superannuation fund in comparison to the main property sectors. While the property focus remains core, reflecting their low risk mandates, some superannuation funds have recently shown interest in the alternate property sectors such as healthcare and self-storage. This reflects the increased availability of unlisted property funds in these alternate property sectors, as well as the sharp pricing on core property assets and intense investor competition from both local and international property investors.
This article investigates the decision-making by Australian superannuation funds when investing in property. When superannuation funds decide on what property to invest in, they typically consider a number of independent factors. Most of these factors cannot be quantified as they involve personal judgements. Surveys can be used to obtain information on these personal judgements. This type of information cannot be derived from datasets (Salmona et al., 2014). Previous surveys identified property type, office, retail, industrial or residential property and geographical location as the main factors used in decision-making on property investment. However, we regard strategic decision-making as one factor that has become more important than both these factors. This is because superannuation funds attract members by assuring them that the contributions they make over their working life are invested in a way that will provide them with the best possible income stream when they retire. To do this, the superannuation funds need to adopt a diversified investment strategy that incorporates the return potential as well as the riskiness of the properties they invest in. Simply choosing a certain property type or geographical location to invest in will not ensure that superannuation funds achieve the best return on their property portfolio. The annual reports of Australian superannuation funds show their typical property strategies include direct property investment, by larger superannuation funds, and the use of unlisted property funds, by smaller superannuation funds. The strategy used is influenced by the superannuation fund’s AUM and level of expertise in property investment. This increased focus on direct property reflects the desire for control and alignment of interest by the larger superannuation funds in managing their property portfolio. It also reflects the inability of smaller superannuation funds to acquire direct property assets (typically exceeding $200 million) and the need to access unlisted property funds (typically only requiring $5 million to $10 million minimum investment).
In order to investigate the relative importance of strategic decision-making over the other factors used by superannuation funds when investing in property, we use the analytic hierarchy process (AHP). AHP is a multi-criteria decision-making process that organises factors into a hierarchical structure (Saaty, 1987). The hierarchy is made up of several levels where the factors on each level are independent or homogeneous and sub-factors on lower levels are decompositions of the factors on the level above. So, rather than calculating a quantity value for each of the factors, the relative importance, or weight, of each of the factors in terms of the other factors is determined in the context of decision-making in the management of their property investments.
The article will start by reviewing previous survey studies on property decision-making by institutional investors. The AHP research method and hierarchical structure will then be described. This will be followed by explanations of the AHP survey design and how the survey participants were selected. The results and findings from the survey responses are then evaluated. Finally a conclusion and management implications will be made on the research findings.
2. Literature review
Research on decision-making by institutional investors when managing property portfolios did not begin until the early 1970s. Wiley’s (1976) mail survey in 1972 of real estate investment in the United States and Canada was the first survey that focused on property decision-making by institutional investors. Wiley (1976) argued that investors would be using certain methods and techniques when making decisions on whether or not to invest in property. The survey asked respondents’ questions on the type of property they invested in, their use of investment return evaluation measures, risk adjustment techniques and computer programmes, and their planned holding periods.
It was not until a decade later that institutional investors were again surveyed on their decision-making in property portfolio management. Over the decade, real estate values in the United States had continued to rise rapidly and several significant economic and financial environment changes occurred. By the 1990s, real estate had become an accepted alternative asset class due to its diversification benefits in mixed-asset portfolios. The surveys used questions similar to those in Wiley’s (1976) survey, as well as additional questions on areas such as how institutional investors invested in real estate, the composition of their portfolios and the level of international investments. The majority of surveys have been undertaken in the United States (Farragher, 1982; Farragher and Kleiman, 1996; Farragher and Savage, 2008; Louargand, 1992; Page, 1983; Webb, 1984; Webb and McIntosh, 1986; Worzala and Bajtelsmit, 1997). Only a few surveys have been undertaken in Australia (Boyd et al., 1995; Newell, 2008; Newell et al., 1993; Reddy, 2012; Reddy et al., 2014 and Rowland and Kish, 2000). The three earlier Australian studies by Newell et al. (1993), Boyd et al. (1995) and Rowland and Kish (2000) were similar to the overseas studies in that their main objective was to identify the key criteria used in property investment decision-making. The remaining Australian studies were completed during or after the global financial crisis. In the uncertain environment created by the global financial crisis, Newell (2008) investigated whether there had been changes in the property asset allocation by superannuation funds. The most recent studies by Reddy (2012) and Reddy et al. (2014) surveyed institutional investors on decision-making on property asset allocation strategies and policies.
The surveys differ in terms of the economic and financial environment over the period being surveyed, the categories of institutional investors surveyed, the country where the respondents reside, the questions they included and how they asked the questions. This prevents the findings from the majority of surveys being directly compared. However, three common findings existed in the surveys. First, they found that property type and geographical location were the main criteria considered in property investment decisions. Second, institutional investors invest more in office and retail property than the other property types, industrial and residential. Finally, the increased use of computers has seen a greater use of more sophisticated quantitative measures on return and risk, such as internal rate of return, net present value, and scenario and sensitivity analysis, when deciding on whether or not to invest in property. However, quantitative analysis of the return on real estate investments was still regarded as more important than risk analysis. These findings indicate that the major criteria used in property investment decision-making have not changed since the 1970s. Responses to survey questions in the three Australian studies, Newell et al. (1993), Boyd et al. (1995) and Rowland and Kish (2000), which focused on identifying the key criteria, support the common findings. The only question in the three later studies that related to the common findings was the importance of return and risk analysis. The surveys in all these studies supported the common finding that return analysis was more significant than risk analysis. In addition during the global financial crisis period, Newell (2008) found the majority of superannuation funds they surveyed had increased their allocation to direct property over listed and unlisted property funds and were mainly investing in core property. The survey respondents to Reddy (2012) and Reddy et al. (2014) also indicated they were investing more in direct property. In terms of asset allocation strategies and policies, most of the respondents indicated that while strategic asset allocation was their dominant strategy, the global financial crisis had seen them increase their use of the shorter term strategy dynamic asset allocation.
This article adopts a different survey technique to the previous surveys. While the decision-making factors in the questions in the previous surveys influenced what factors would be included in this article’s survey, the question format is not the same. The previous surveys required respondents to consider a group of factors at the same time and to either select the preferred factor or rank them based on a certain benchmark. For some respondents, this can be cognitively difficult and lead them to disproportionally favour one factor over the other factors (Saaty and Vargas, 2012). The question format in this survey requires respondents to indicate their preference for one factor over another factor, rather than to select the preferred factor from a group of factors. This allows respondents to provide more consistent responses so that more reliable degrees of preference for each factor can be obtained. The survey is also undertaken in Australia with superannuation funds after the global financial crisis, several years later than most of the other surveys which may have an impact on the survey responses.
3. Research method
A survey questionnaire was constructed to identify the major factors and sub-factors used by superannuation funds when making decisions on the management of their property investment portfolio. Two sources were used to select the factors and sub-factors to be included in the questionnaire. First, a list was written up of the factors identified by previous surveys on property investment by pension funds as having a major influence on property selection. Second, advice from two academics that extensively publish in the area of property investment and have considerable property industry insight was used to select the factors from this list. The academics’ advice ensured that all the factors are independent.
The questionnaire was prepared so that the survey responses could be analysed using the analytical hierarchy process (AHP), as the questions are qualitative not quantitative. AHP is a multi-factor decision-making methodology developed by Saaty (1977) that allows the qualitative survey responses to be analysed by organising the factors into a value tree hierarchy. The general factors are placed on the upper level of the tree and the sub-factors that each general factor can be broken down into on the lower level. Survey respondents rank the importance of one factor over another factor and one sub-factor over another sub-factor using a pairwise comparison approach. This allows each factor or sub-factor to be compared to each of the other factors or sub-factors independently. In addition, it is easier for people to make relative judgements, as occurs with pairwise comparisons, than absolute judgements, which occurs when choosing between several factors at the same time. The eigenvalue method is then applied to a judgemental matrix of the pairwise comparisons to generate the relative weights for each of the factors and sub-factors in the value tree. The complex mathematics required was undertaken using ExpertChoiceTM software. Saaty and Vargas (2012) provide a detailed explanation of each step of the mathematical procedure for AHP.
To analyse the survey responses, the relative importance of each pairwise comparison for the respondents is aggregated. This reduces the bias that can occur when the judgements of only one of the respondents is considered. The average weight for each factor and sub-factor are calculated from the respondent’s weights on each factor and sub-factor. The averages of the weights are then used to rank how important the factors and sub-factors are in decision-making by the superannuation funds. The higher the average weight, the more important the factor or sub-factor will be in the decision-making process.
The AHP methodology has been used in multi-criteria decision-making studies in the property industry for more than a decade. For example, stigma assessment in property valuation (Chan, 2002); location value of residential property (Kauko, 2003); risk scoring procedures for property investments (Hutchison et al., 2005); the quality of central business district (CBD) office buildings (Ho et al., 2005); decision-making on hotel investments (Newell and Seabrook, 2006); risk in property development (Newell and Steglick, 2006); development in office buildings (Adnan et al., 2009); construction technical innovation by small and medium enterprises (Hardie and Newell, 2011); and risk assessment in office property valuation (Gupta and Tiwari, 2016). These studies used AHP, instead of other modelling techniques, as it allowed them to use qualitative factors to determine the best alternative decision or the relative importance of the alternative decisions (Saaty, 2008).
4. Survey design
It is important to ensure the survey respondents will not be overwhelmed by the number of factors and sub-factors they will be comparing and likely to make less judgemental and consistent responses towards the end of the survey (Millet and Harker, 1990). Consequently, the number of factors and sub-factors included in the survey was limited to an amount that allowed respondents to comfortably complete the survey in 30 minutes. This time limit would also make it easier to attract respondents holding several senior managerial positions that had very little spare time to complete the survey. In addition, the maximum number of factors and sub-factors for each factor was restricted to seven (Saaty, 1977). Psychological experiments by Millar (1956) showed that individuals found it difficult to simultaneously compare more than seven items (±2).
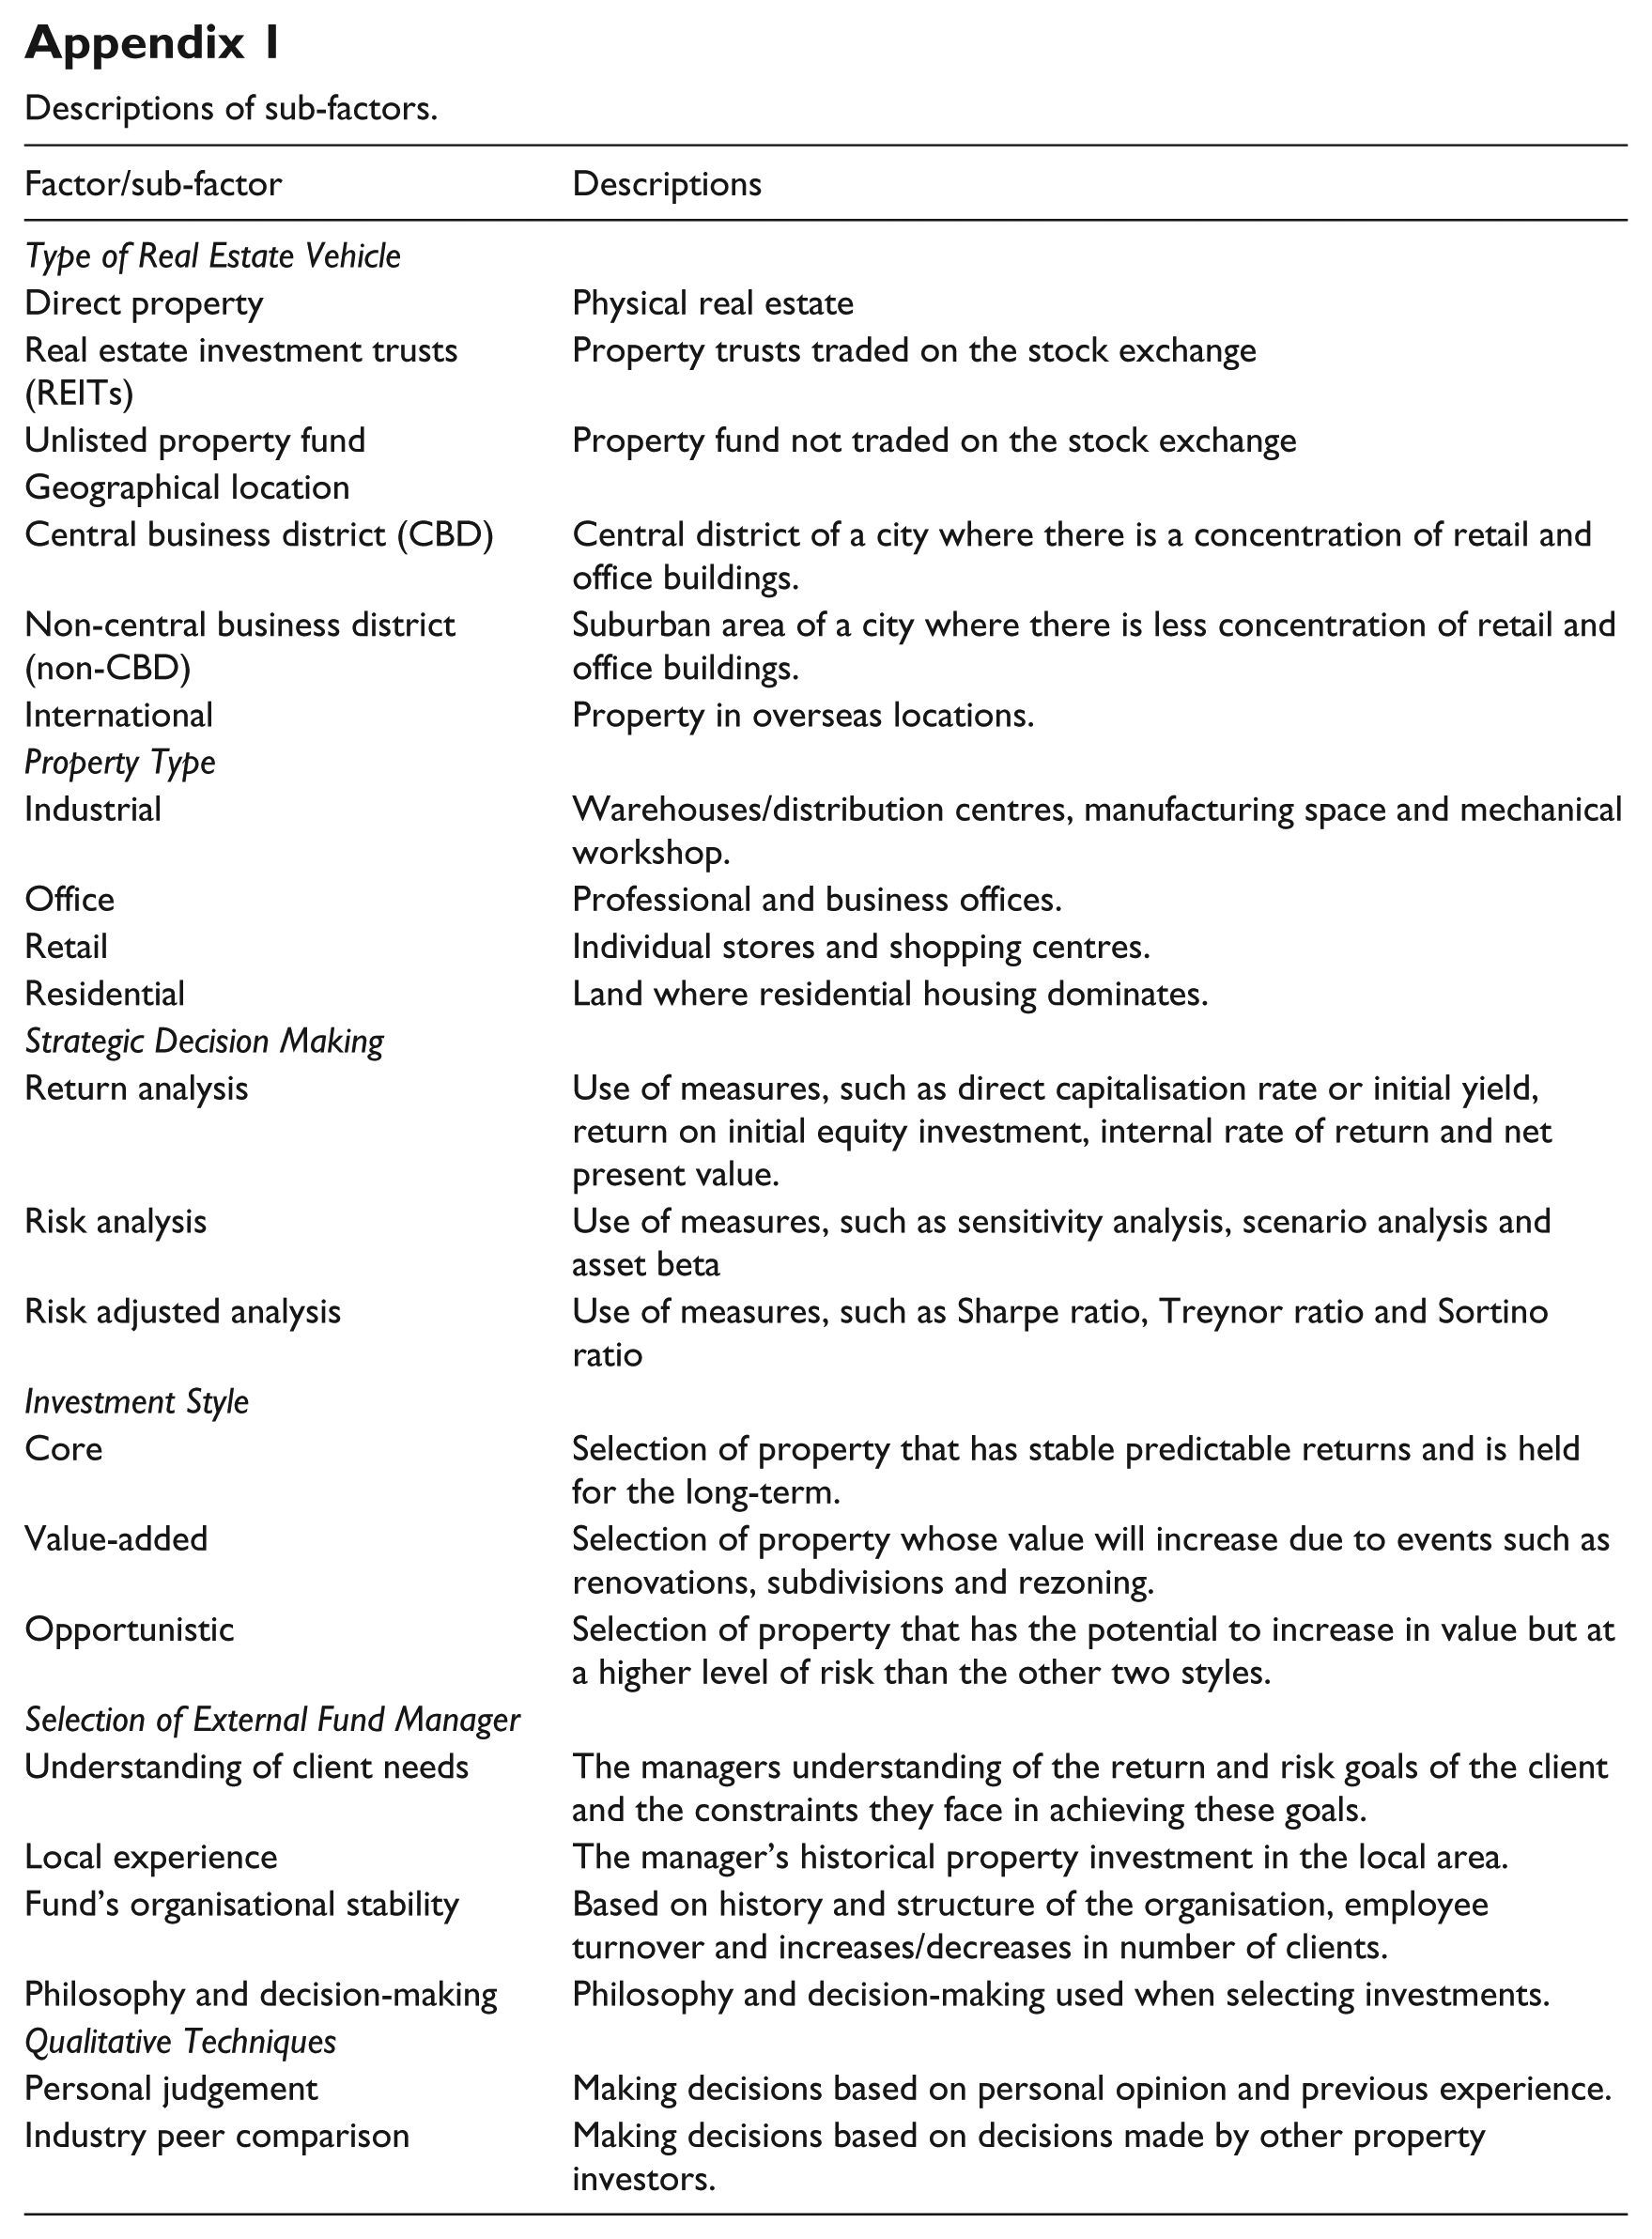
The resulting final selection was of seven factors: type of real estate vehicle, geographical location, property type, strategic decision-making, investment style, selection of external fund manager and qualitative techniques. For each factor, between 2 and 4 sub-factors were selected, resulting in 22 sub-factors. Pairwise comparisons were created for all the factors and sub-factors. Covering all possible pairings allows AHP to confirm that the respondents make reliable and consistent responses (Forman and Selly, 2001). In total, 21 pairs were created from the seven factors and the 22 sub-factors spread across the seven factors generated 25 pairs. In total, the survey questionnaire contained 46 questions covering the 21 factor pairs and 25 sub-factor pairs. The factors and sub-factors are listed in Table 2 along with the number of pairs. Descriptions of the sub-factors are provided in Appendix 1; this ensured consistency of terms for all survey participants.
The factors and sub-factors.
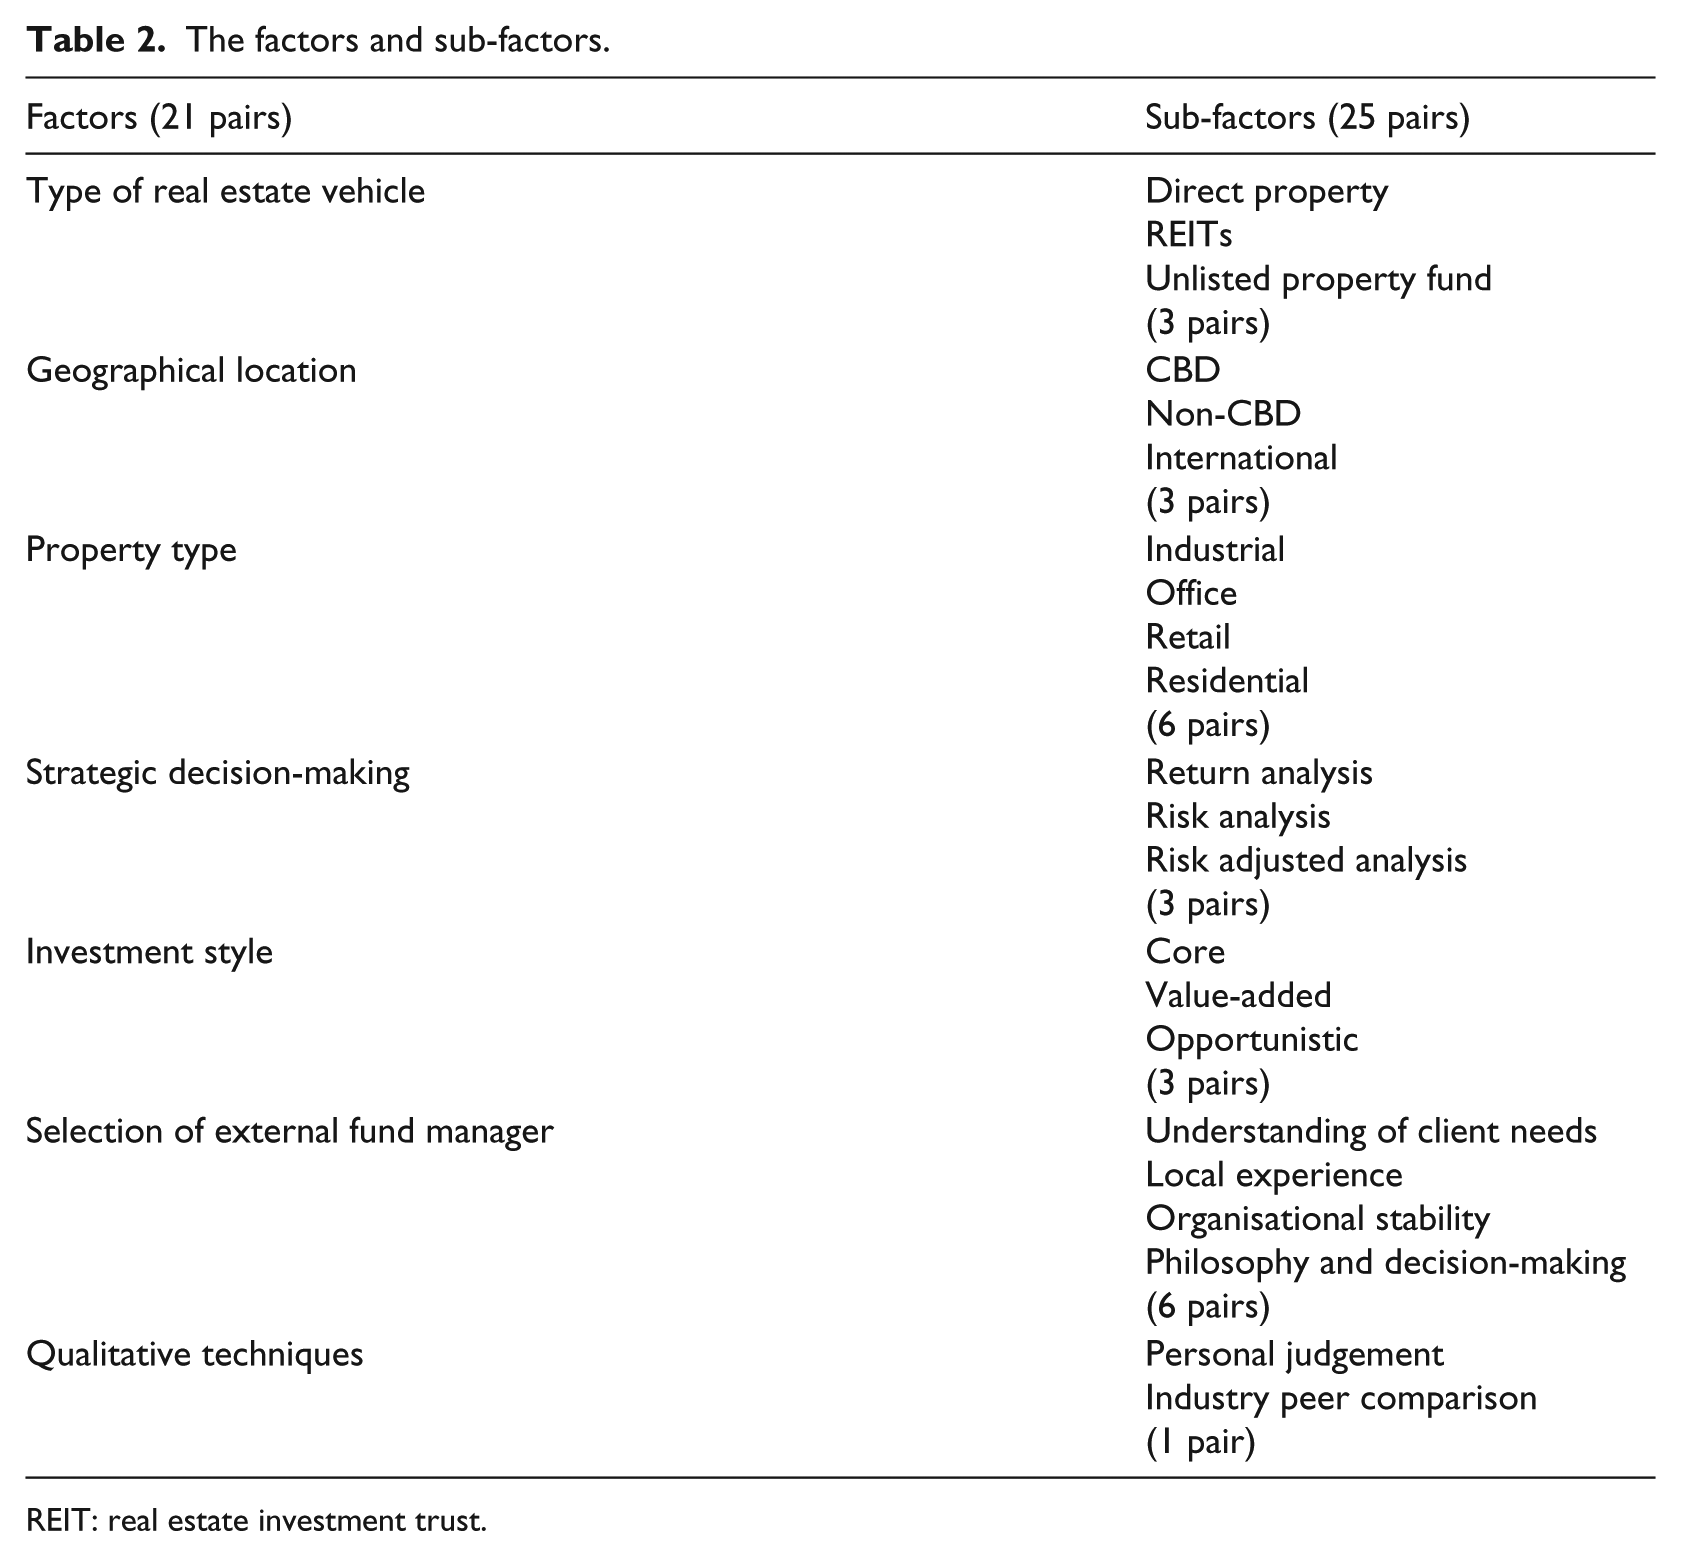
REIT: real estate investment trust.
The relative importance of each alternative in a pair will be determined using a 9-point number scale, with number 5 being the upper limit for an alternative in each pair and 1 the lower limit. If a respondent regards one alternative to have absolute importance over the other alternative, they will give it a ranking of 5. However, they will give a ranking of 1 if they regard both alternatives to be of equal importance. At the start of the survey, detailed definitions and explanations are provided to the survey respondents, verbally and in written form, on what level of feeling each number in the scale reflects. This ensured all the survey respondents understood what each number on the scale represents. Similarly, descriptions of the various factors and sub-factors were provided to ensure respondent consistency.
5. Survey participants
The questionnaire surveys were completed between September 2015 and April 2016. A face-to-face interview was used to complete all but one of the surveys. A telephone interview had to be arranged for one survey due to difficulties encountered in arranging a face-to–face interview. Face-to-face interviews are regarded as the best way to undertake the AHP research. They ensure respondents are more likely to correctly respond to the questions and that there would be a high response rate. The privacy of respondents was maintained by not recording the name of the respondent on their completed survey.
Selection of the survey respondents was based on the criterion that they made decisions on property investment in a non-profit superannuation fund, such as a chief investment officer or investment manager. In Australia, industry funds, corporate funds and public sector funds are non-profit while retail funds set up by financial institutions are for profit. Only non-profit superannuation funds were surveyed as they focus on the long-term investment interests of their members. Retail funds, however, are also interested in making a profit for the financial institutions that establish them. As such, the survey respondents included the major non-profit superannuation funds in Australia that had significant levels of property investments.
The Annual Fund-Level Superannuation Statistics June 2015 report published by the APRA revealed that 214 Australian superannuation funds invested in property (APRA, 2016). Of them, 85 were short-listed as they were non-profit and managed by independent chief investment officers. From this pool, the contact details for 22 were found over a period of 6 months from their website, LinkedIn, ZoomInfo or property fund managers. 6 This sample of 22 only makes up 26% of the pool of 85. However, it is a very broad sample, as it includes industry, corporate and public superannuation funds, as well as a wide range of AUM. For each of these types of superannuation funds, wherever possible, small, medium and large superannuation funds were selected. As at June 2015, the total AUM for the 20 superannuation funds interviewed ranged from $1.95 to $118.4 billion, with the average AUM being $27.86 billion. 7 The percentage of their AUM that they invest in property ranged from 6% to 14%, leading to the property AUM varying from $1.76 million to $8.53 billion with an average of $2.46 billion. While the funds had similar investment benchmarks and mandates, they differed in their level of usage of asset consultants when selecting external fund managers. This characteristic was used to determine whether they should be classified as small, medium or large. The small superannuation funds only used the advice of asset consultants and had total property AUM of less than $1 billion. The large superannuation funds had property AUM of more than $7 billion, rarely used asset consultants and often had highly experienced internal property teams. The medium superannuation funds had property AUM between $1 and $7 billion. The AHP analysis was undertaken on the total survey responses and then separately on the responses from the small, medium and large funds. Overall, the 20 superannuation fund respondents had a total AUM of $557 billion and total property AUM of $49.2 billion, creating an average property exposure of 8.8%.
Two of the public sector funds contacted by the researcher said that they were not allowed to participate in surveys. Consequently, the response rate was 90%, with 1 public sector fund, 2 corporate funds and 17 industry funds being interviewed. Nine of these were small funds, eight medium size superannuation funds and three large superannuation funds. The concentration of industry funds in the sample is reflective of the majority of Australian non-profit funds being industry funds. While 20 superannuation funds may be regarded as a small sample size, AHP does not require input from a large sample. The use of pairwise comparisons of independent factors organised in a hierarchical manner allows AHP to generate robust and reliable results from a small sample. Choosing between a pair of factors, rather than all factors at the same time, significantly reduces the cognitive load for the survey respondents.
6. Evaluation of results and findings
The average weights generated by AHP for the factors and sub-factors and the rankings based on these weights are shown in Table 3. There is a considerable difference in the weight of the highest ranked factor, ‘Strategic Decision Making’, and the weights of the other six factors. This reflects the fundamental need for fund managers to invest in the assets that will perform the best. The annual reports of the surveyed superannuation funds all state that their intention is to ensure their members enjoy financial security when they retire. Consequently, their main investment objective is to maximise long-term investment returns without being exposed to inappropriate levels of risk. Their ‘Strategic Decision Making’ will ensure this investment objective is met.
AHP weightings for factors and sub-factors: 20 superannuation funds.
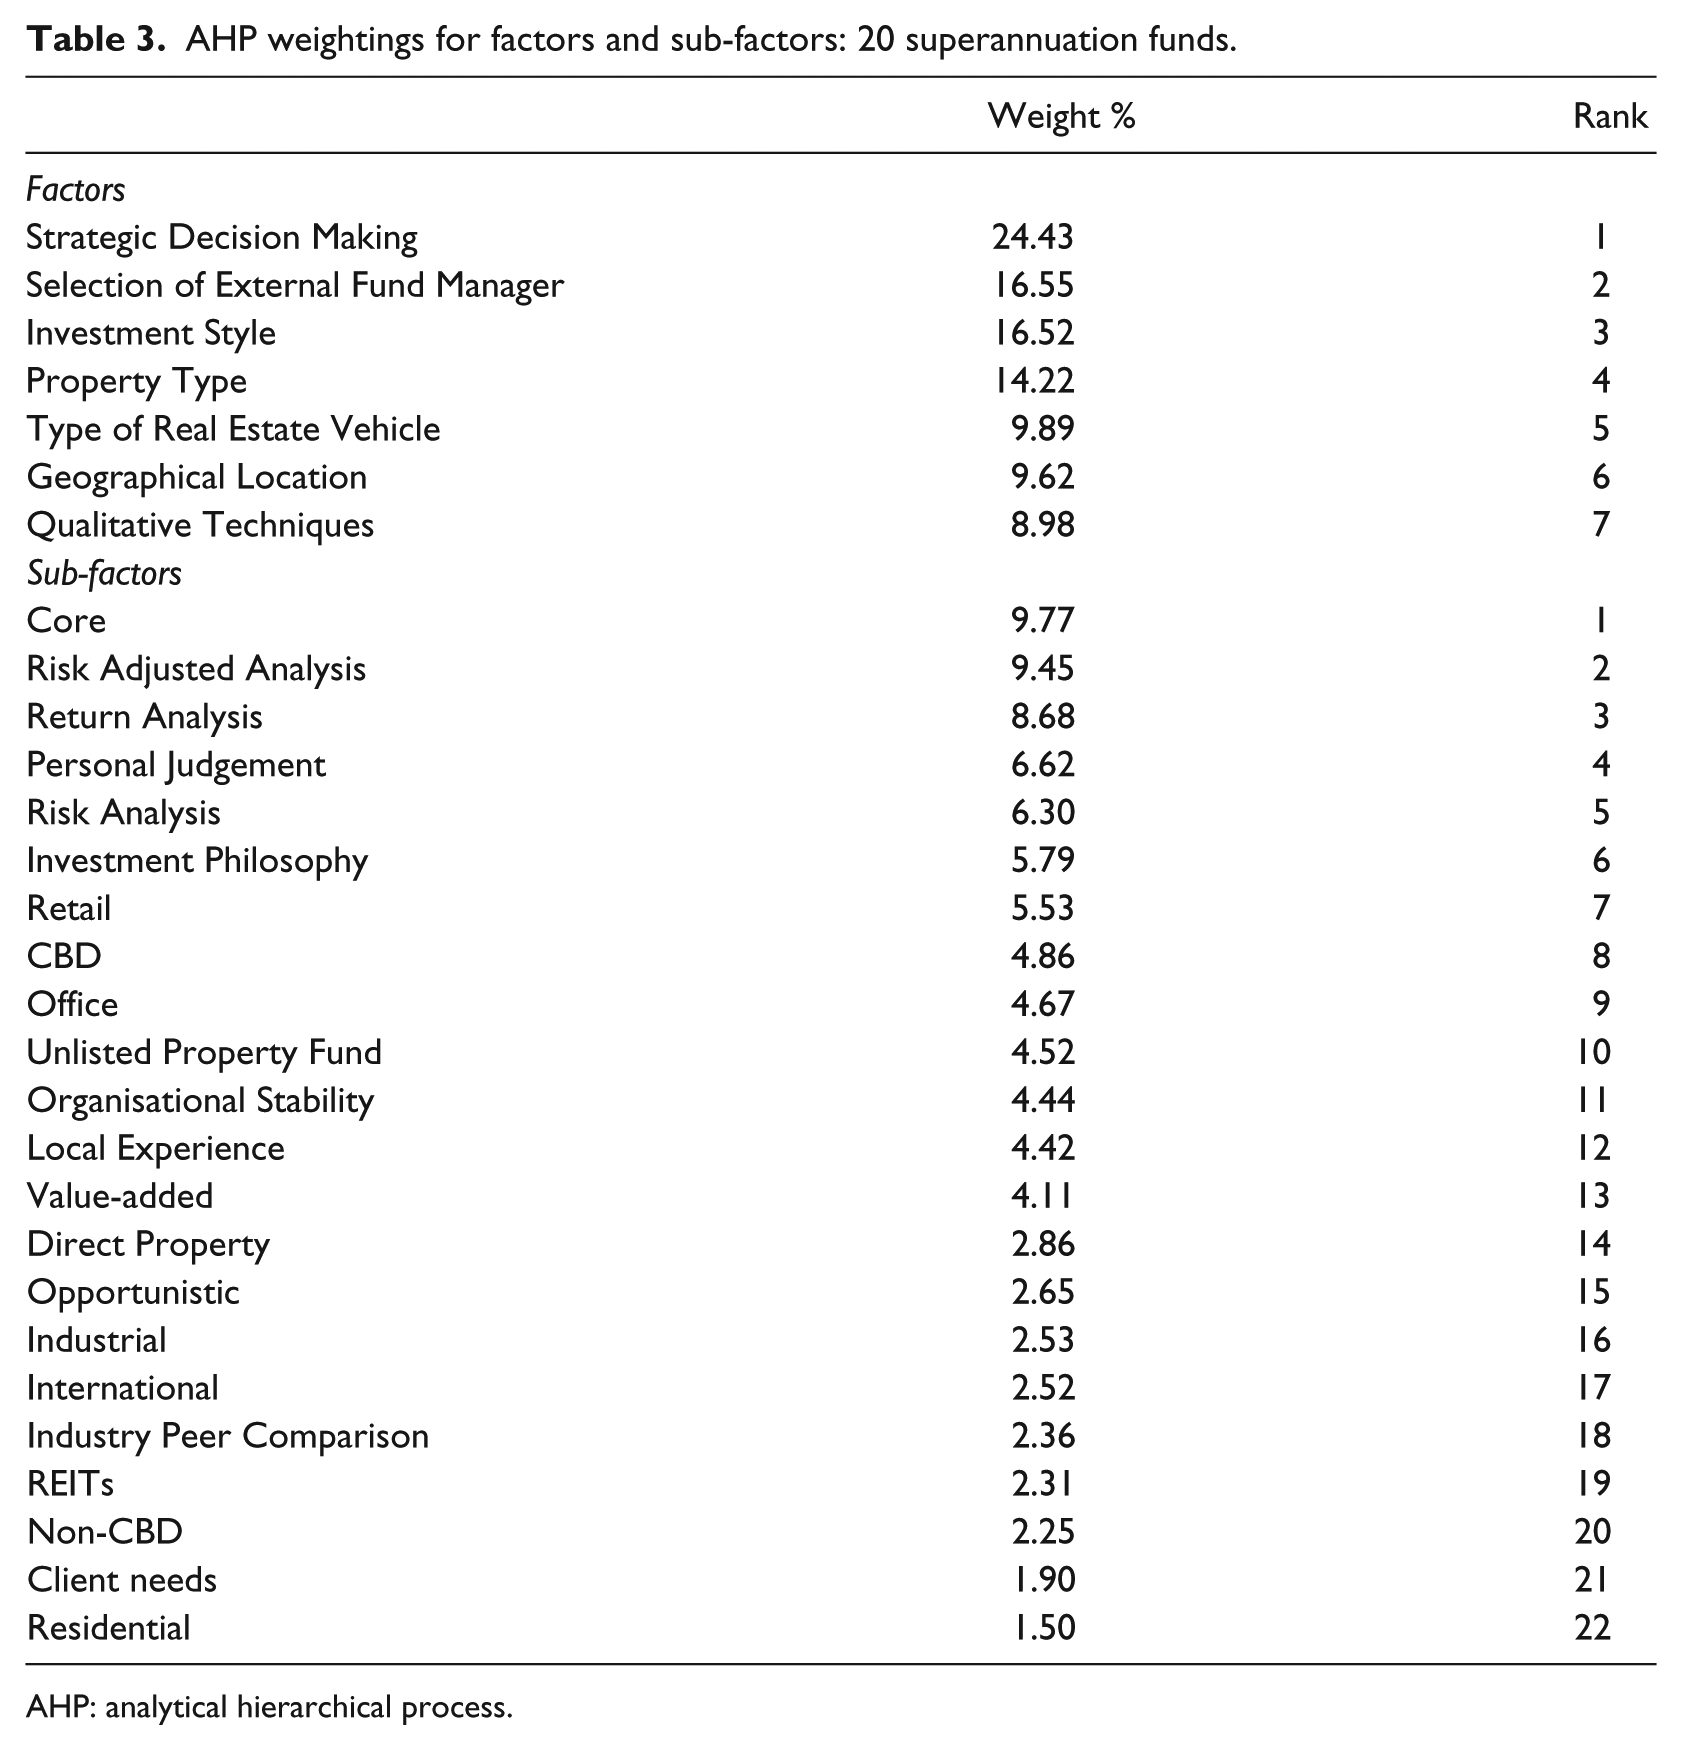
AHP: analytical hierarchical process.
The weightings of the 22 sub-factors have a smaller range than the seven factor weightings. This is to be expected as there are considerably more of them. However, large differences in the size of the weights still exist for the sub-factors. The highest ranked sub-factor, ‘Core’, is a sub-factor of the second highest ranked factor, ‘Investment Style’. This ranking is consistent with the annual reports of all the surveyed superannuation funds. The reports state that they currently mainly invest in core property. Of the three ‘Investment Style’ sub-factors, the weighting on ‘Core’ is more than double that of ‘Value-added’ and nearly four times greater than that of ‘Opportunistic’. During the interviews, several respondents commented that since the global financial crisis, they have only invested in core property; being lower risk. The next two ranked sub-factors, ‘Risk Adjusted Analysis’ and ‘Return Analysis’, are two of the three sub-factors of the highest ranked factor, ‘Strategic Decision Making’. The third sub-factor, ‘Risk Analysis’, is separated from these by ‘Personal Judgement’, a sub-factor of ‘Qualitative Techniques’. The slightly higher weighting on ‘Risk Adjusted Analysis’ over ‘Return Analysis’ supports the basic investment criteria that return and risk of investments cannot be considered in isolation of each other (Markowitz, 1959). The greater importance of ‘Return Analysis’ over ‘Risk Analysis’ could be due to the need for superannuation funds to ensure that investments generate strong positive returns. During the interviews, the majority of respondents commented that it was a lot easier to measure the return than the riskiness of alternative real estate investments. This is because the characteristics of real estate, such as infrequent trading and heterogeneous nature, make it difficult to gather a large enough data set of property value observations needed to generate statistical measures of risk.
‘Qualitative Techniques’ is the lowest ranked factor. It covers the subjective tools typically used to select between alternative investments after quantitative analysis is undertaken. However, one of its two sub-factors, ‘Personal Judgement’, is the fourth ranked sub-factor. All but one of the respondents ranked ‘Personal Judgement’ as more important than ‘Industry Peer Comparison’. One respondent commented that ‘Personal Judgement’ was essential as they did not want to ‘chase the herd’, while other respondents said ‘Personal Judgement’ was needed so that they could outperform other superannuation funds. The respondent who preferred ‘Industry Comparison’ over ‘Personal Judgement’ commented that members will always prefer to contribute to the superannuation fund that generated the highest return.
While doing the survey interviews, it became apparent that the relative importance of some of the factors and sub-factors differed across the different-sized superannuation funds. Consequently, the AHP survey responses were put into three sub-groups based on AUM size and their degree of reliance on asset consultants; small, medium and large. Table 4 shows their priority rankings. They are only uniform for one of the factors, ‘Strategic Decision Making’, which, like the whole sample, they all ranked as the most important factor. For 2 of the remaining 6 factors and 2 of the 22 sub-factors, substantial differences are found to exist.
AHP rankings by group size.
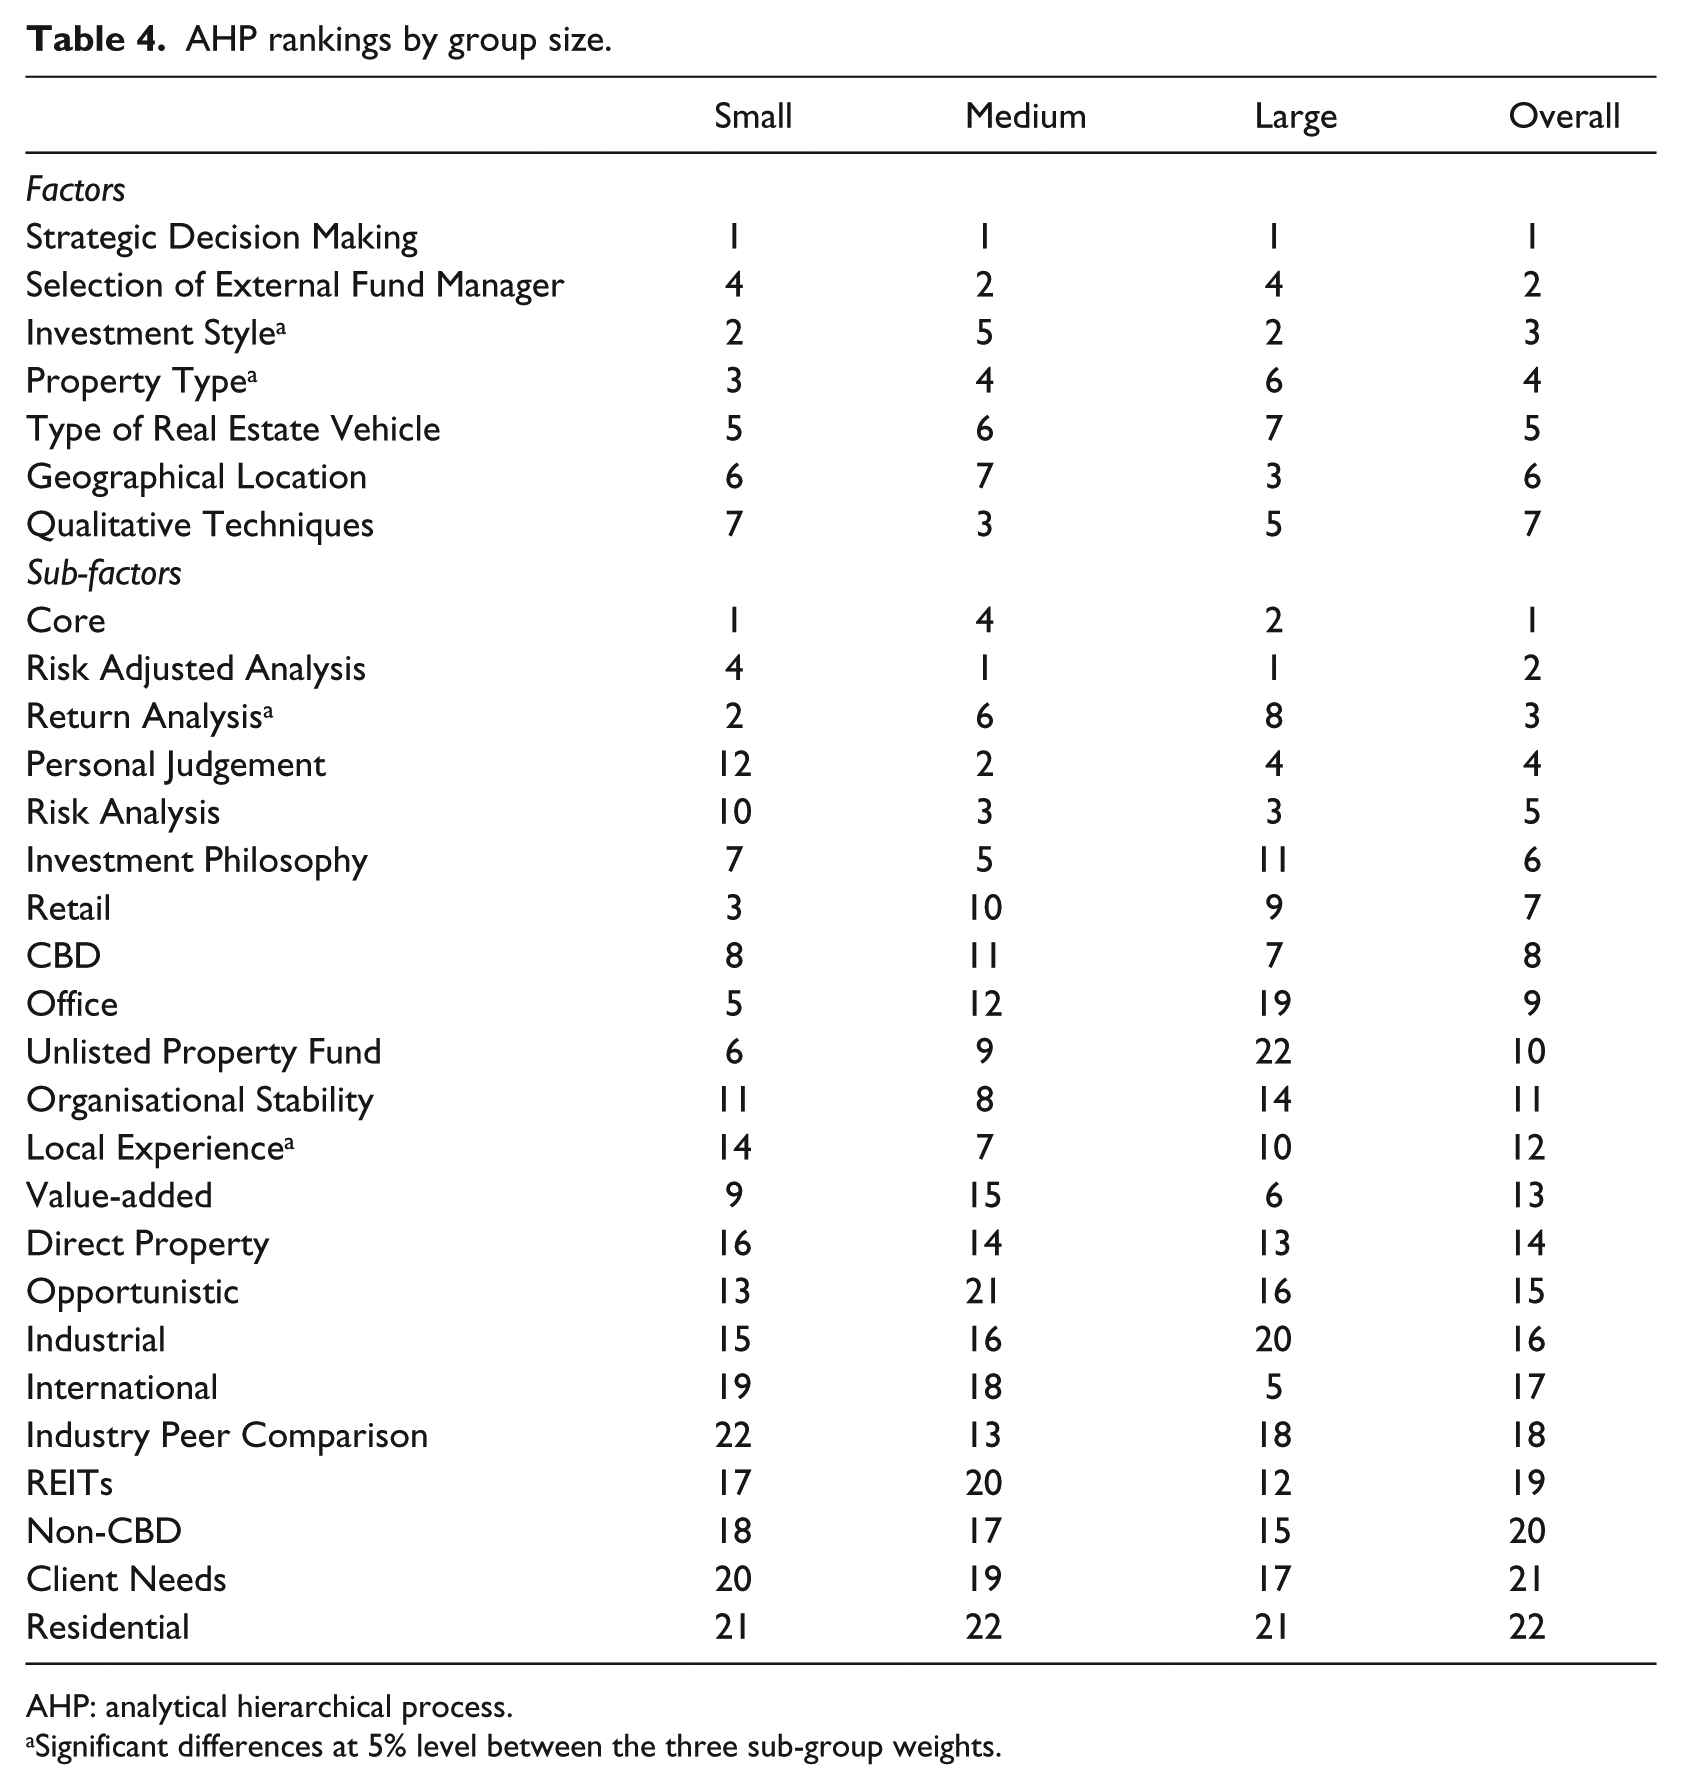
AHP: analytical hierarchical process.
Significant differences at 5% level between the three sub-group weights.
‘Investment Style’ and ‘Property Type’ are the two factors that considerably differed across the sub-groups. They are the third and fourth highest ranked factors overall. During the interviews, several of the respondents commented that their fund’s mandate controlled their decision-making on both of these factors. These mandates specified that they only invest in certain property types of a particular investment style. However, the small and large funds gave ‘Investment Style’ a substantially higher weight than the medium funds, ranking it as their second highest factor. On the other hand, there are no considerable sub-group differences for any of the four ‘Investment Style’ sub-factors. As already explained, the superannuation funds surveyed mainly invest in core property. For the other factor, ‘Property Type’, the weighting by the small funds was substantially larger than that of both the medium and large funds. Some of the small funds commented that they only invest in office, while some medium and large funds said they invested in both office and retail property. These interview comments could explain why sub-group differences exist for the ‘Property Type’ sub-factor ‘Office’. The small funds have a considerably higher weighting on ‘Office’ than the medium and large funds.
One of the two sub-factors, ‘Return Analysis’, where there are sub-group differences is a sub-factor of the highest ranked factor, ‘Strategic Decision Making’. The small funds have a stronger preference for ‘Return Analysis’ than the medium and large sub-groups. They ranked it above ‘Risk Adjusted Analysis’ and ‘Risk Analysis’. Both the medium and large funds give ‘Risk Adjusted Analysis’ the highest ranking across the sub-factors followed by ‘Return Analysis’ and then ‘Risk Analysis’. A reason for this could be that small funds are more likely to buy and hold property investments than the larger superannuation funds. In their interviews, two of the large superannuation funds commented that, unlike the smaller funds, they hold a large enough amount of funds to actively trade their property portfolio to take advantage of mispricing. Consequently, they need to consider the risk-adjusted returns on their property investments. The small superannuation funds do not have enough funds to engage in active trading, so focus on investing in property that is likely to generate stable long run returns.
The other sub-factor where there are sub-group differences is ‘Local Experience’. It is one of the sub-factors of ‘Selection of External Fund Manager’ which is ranked as the second most important factor overall. Although there are no substantial differences between the sub-groups rankings of this factor, the medium funds ranked it as their second most preferred factor, while the small and large funds ranked it as their fourth. Interview comments imply there may be a closer relationship between the medium funds and external fund managers compared to the small and large funds. Respondents from the larger superannuation funds commented that the majority of their property investment decisions were made in-house by a team of internal investment managers and their use of specialist external fund managers was minimal. The smaller superannuation funds, on the other hand, commented that they could not afford an in-house internal investment management team, so they had to invest through external fund managers. Furthermore, two of the smaller funds commented that their Board required them to invest in the property investments recommended to them by asset consultants chosen by their Board. So they had very little control over the external fund managers they used.
This closer relationship between the medium funds and external fund managers could explain why the medium funds weighted ‘Local Experience’ as substantially higher than the small and large funds. Some respondents from the medium funds commented that ‘Local Experience’ is important, as external fund managers often had more experience than them in investing in different locations. Particularly when they were interested in investing in a city they had never invested in before. The lower ranking of ‘Local Experience’ by the small and large funds could be because their relationship with external fund managers is not as close as it is for medium funds. An interesting observation is that ‘Client Needs’, one of the other sub-factors of ‘Selection of External Fund Manager’, was given a low ranking by all the sub-groups. Several respondents commented that they would be one of many funds investing with any particular external fund manager. Consequently, the external fund manager would not invest purely to meet the needs of only one superannuation fund. This reflects the lack of control via investing in unlisted property funds.
While no substantial sub-group differences were found for the two factors, ‘Type of Real Estate’ and ‘Geographical Location’ and their sub-factors, comments made during the interviews can explain why their sub-group rankings are not uniform. With respect to ‘Type of Real Estate’, respondents from the medium and small funds commented that they did not have enough funds to purchase direct property, so invested in real estate mainly through unlisted property funds. The respondents from the large funds said they did have sufficient funds and were directed by their mandates to mainly invest in direct property. Any unlisted property fund investment by the large funds was typically part of a joint venture, where the fund had the majority ownership. One of the large funds commented that their preference for joint ventures over unlisted property funds was due to it being difficult to get out of an unlisted property fund when there were a large number of investors. This is because not all of the investors would want to dissolve the fund at the end of its life. This preference for direct property explains why the large funds gave ‘Unlisted Property Fund’, a sub-factor of ‘Type of Real Estate’, their lowest ranking while the small and medium funds gave it a higher ranking. The substantial amount of funds held by the large funds relative to the small and medium funds can also explain why the large funds rank ‘Geographical Location’ higher than the small and medium funds. In their interviews, the large superannuation funds commented they had enough funds to freely choose the ‘Geographical Location’. The small and medium funds did not have this freedom. The considerably higher ranking given by the large funds to ‘International’, a sub-factor of ‘Geographical Location’, relative to the small and medium funds, reflects the inability for these two groups to invest in overseas property due to insufficient funds. While home bias is often argued to be the reason why Australian superannuation funds mainly invest in domestic assets, a lack of funds can also be a barrier to investing overseas (Warren, 2010). The level of AUM for the larger superannuation funds increases their ability to invest internationally in property.
In order to investigate if a relationship exists between the rankings given by the three sub-groups, Spearman rank correlation coefficients are calculated for each of the sub-groups (see Table 5). Moderate positive correlation is found between the small and large funds’ factors and the sub-factors between the small and medium funds and the medium and large funds.
Sub-group correlations.
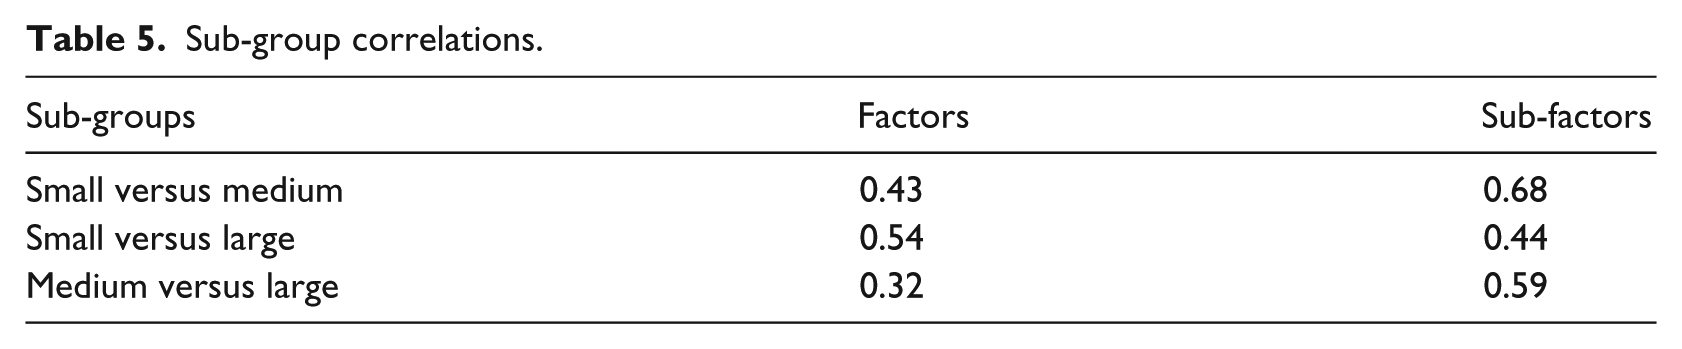
The correlation between the small and large factors relative to the medium funds could be due to the considerably higher weightings given by the small and large funds to ‘Investment Style’ and lower weightings for ‘Selection of External Fund Managers’. Correlation between the small and large fund’s sub-factors could be due to the substantially lower rankings they both have on ‘International’ and ‘REITs’. For the medium and large funds, the correlation between their sub-factors could be driven by the higher rankings they both give to ‘Risk Analysis’ and ‘Personal Judgement’ and lower rankings to ‘Return Analysis’ and ‘Office’.
7. Consistency
Saaty (1987) acknowledged that inconsistency can arise in human judgement. However, as long as there is a low level of inconsistency in the survey responses, then Saaty (1987) argued that the weights were acceptable estimates. Saaty created a measure of inconsistency, known as the consistency ratio (CR), to acknowledge that the weights are acceptable estimates. The CR is the variance of error occurring when the weights are estimated divided by an average consistency random index (Saaty and Vargas, 2012: 8). This index is calculated from a large number of randomly generated reciprocal matrices of the same number as the total number of factors or sub-factors being considered. 8 Consistency exists when the CR equals zero as the variance of error will be zero. Saaty (1987: 172) proposed that a CR of 10% or less indicates the weights are likely to be non-random and hence reliable as they will be consistent.
The average CR for the factors of the 20 superannuation funds is 12.85% and while slightly above the 10% threshold suggested by Saaty, it is still relatively low. One suggested way to reduce the CRs of the surveys with CRs greater than 10% is to redo the surveys and make sure that the respondents have a better understanding of the pairwise comparisons. However, at the interviews, the definitions of each of the factors and sub-factors were clearly explained to the respondents. Any intervention in how they responded would be a violation of their personal judgement. Another way is to not include the superannuation funds with CRs above 10%. However, as the rankings did not change when they were excluded, in this study, only the original responses of all 20 superannuation funds are used. The sub-factor CRs for each of the factors for all of the 20 superannuation funds were under 10%.
8. Conclusion
This article identifies several factors and sub-factors that have a major influence on the decision-making and management by Australian superannuation funds when they invest in property. Survey responses by chief investment officers or property investment managers from 20 Australian superannuation funds identified ‘Strategic Decision Making’ as considerably more important than other decision-making factors. This is reflective of the need for superannuation funds to invest in property that generates a high return over the long run with the minimal amount of risk. The factors ‘Selection of External Fund Manager’, ‘Investment Style’ and ‘Property Type’ were also important at a more moderate level. The finding confirms our expectation that strategic decision-making is now regarded as more important than the other factors, property type and geographical location, identified in earlier surveys. Three sub-factors, ‘Core’, ‘Risk Adjusted Analysis’ and ‘Return Analysis’, were found to have relatively higher weights than the other sub-factors. They are sub-factors of two of the preferred factors, ‘Investment Style’ and ‘Strategic Decision Making’. The finding that ‘Risk Adjusted Analysis’ was preferred to ‘Return Analysis’ is in contrast to earlier surveys that found when doing quantitative analysis, institutional investors mainly used return analysis. This reflects the increased focus today on incorporating risk with the return analysis of property investment decisions.
Differences in rankings of the factors and sub-factors, apart from ‘Strategic Decision Making’ and ‘Core’, were found to exist across the small, medium and large funds. Comments made during the interviews may be able to explain the sub-group differences. The comments indicated that the smaller funds had restrictive investment mandates, could only use external fund managers selected by board appointed asset consultants and held a significantly lower level of funds than the larger funds. The restrictive mandates and low level of funds reduced their ability to freely choose the properties that they invested in, as well as seeing a higher use of unlisted property funds instead of direct property investment. The larger funds used in-house investment managers, so did not have to rely on external fund managers, and had substantially more freedom in their decision-making than the smaller funds, hence their increased preference for direct property investment. All of the funds commented during their interviews that they mainly invested in core property which explains why there was no considerable sub-group difference in the weightings given to ‘Core’. For ‘Risk-adjusted Analysis’ and ‘Return Analysis’, the sub-group differences can be explained by the relatively lower level of funds held by the small funds compared to the medium and large funds. Large funds commented during their interviews that this meant the small funds adopted a buy-and-hold strategy to generate a stable return, while they were able to adopt a more active strategy. As a result, the small funds weighted ‘Return Analysis’ higher than ‘Risk Adjusted Analysis’, while the medium and large funds weighted it lower.
The finding in this article that property decision-making is not consistent for most of the factors across different size superannuation funds was not expected. The lack of freedom in decision-making by property investment managers of the smaller funds presents a case for future research. This difference in level of freedom in property investment behaviour between the sub-groups can be investigated to see if this leads to significantly different returns on property investments. This would also require that more in-depth research be undertaken on the level of investment by funds in direct property versus indirect property. The ability for large funds to mainly invest in direct property, while the small and medium funds typically are only able to invest in property funds, should be investigated to gain a greater understanding of the benefits of investing in either direct or indirect property.
Overall, using AHP, this research has highlighted the importance of different factors and sub-factors in the management of property investment decisions by superannuation funds in Australia. With the superannuation sector now accounting for over $1.3 trillion in AUM on behalf of Australia’s workers, this further highlights the importance of the role these factors have in decision-making. Particularly give the different features of property as an investment compared to the major asset classes (e.g. equity and fixed interest). Ranking ‘Strategic Decision Making’ as considerably more important than the other factors indicates that currently a major focus of property investment by superannuation funds is to construct a diversified property portfolio that can generate the highest return possible, as well as a stronger strategic focus to their property investment activities. The continued growth of the superannuation sector in Australia and the need to generate reliable returns for Australian employees further reflects the ongoing importance of this research into property investment decision-making.
Footnotes
Appendix 1
Descriptions of sub-factors.
| Factor/sub-factor | Descriptions |
|---|---|
| Type of Real Estate Vehicle | |
| Direct property | Physical real estate |
| Real estate investment trusts (REITs) | Property trusts traded on the stock exchange |
| Unlisted property fund | Property fund not traded on the stock exchange |
| Geographical location | |
| Central business district (CBD) | Central district of a city where there is a concentration of retail and office buildings. |
| Non-central business district (non-CBD) | Suburban area of a city where there is less concentration of retail and office buildings. |
| International | Property in overseas locations. |
| Property Type | |
| Industrial | Warehouses/distribution centres, manufacturing space and mechanical workshop. |
| Office | Professional and business offices. |
| Retail | Individual stores and shopping centres. |
| Residential | Land where residential housing dominates. |
| Strategic Decision Making | |
| Return analysis | Use of measures, such as direct capitalisation rate or initial yield, return on initial equity investment, internal rate of return and net present value. |
| Risk analysis | Use of measures, such as sensitivity analysis, scenario analysis and asset beta |
| Risk adjusted analysis | Use of measures, such as Sharpe ratio, Treynor ratio and Sortino ratio |
| Investment Style | |
| Core | Selection of property that has stable predictable returns and is held for the long-term. |
| Value-added | Selection of property whose value will increase due to events such as renovations, subdivisions and rezoning. |
| Opportunistic | Selection of property that has the potential to increase in value but at a higher level of risk than the other two styles. |
| Selection of External Fund Manager | |
| Understanding of client needs | The managers understanding of the return and risk goals of the client and the constraints they face in achieving these goals. |
| Local experience | The manager’s historical property investment in the local area. |
| Fund’s organisational stability | Based on history and structure of the organisation, employee turnover and increases/decreases in number of clients. |
| Philosophy and decision-making | Philosophy and decision-making used when selecting investments. |
| Qualitative Techniques | |
| Personal judgement | Making decisions based on personal opinion and previous experience. |
| Industry peer comparison | Making decisions based on decisions made by other property investors. |
Acknowledgements
The authors thank the chief investment officers and investment property managers who participated in the survey interviews and the anonymous academics who provided advice on the factors to be included in the survey.
Final transcript accepted 15 December 2017 by Millicent Chang (AE Finance).
Funding
The author(s) received no financial support for the research, authorship and/or publication of this article.