
Abstract
This study links the readability of 10-K reports to insider trading profitability. Using a sample of 102,060 insider transactions in the United States between 1994 and 2016, we empirically demonstrate that less readable 10-K reports increase profitability from insider trading. Consistent with the proprietary cost argument, we also document that readability impacts on insider trading profitability are more pronounced for research and development–intensive firms, for firms facing higher product market competition and trade secrecy, and for firms with lower levels of voluntary management disclosures. Overall, this study supports the proprietary cost and strategic information asymmetry channel of readability and suggests that less readable reports lead to the exploitation of information advantages by insiders.
JEL Classification:
Keywords
1. Introduction
Although 10-K reports are a primary source of information between company insiders (“insiders”) and external stakeholders (Loughran and McDonald, 2014), these reports are often opaque and difficult to digest. 1 Extant research links this poor readability to higher costs of borrowing (Ertugrul et al., 2017), greater analyst uncertainty and dispersion (Lehavy et al., 2011), a poor information environment and higher return volatility (Loughran and McDonald, 2014), less efficient investments (Biddle et al., 2009), more disagreement among small investors (Miller, 2010), and higher risk of a stock price crash (Kim et al., 2019). Regulators are paying increased attention to the consequences of complex and difficult-to-read annual reports, with the US Securities and Exchange Commission (SEC) having passed the Plain English Rule on 1 October1998, which requires companies to prepare financial reports that can be read and understood by investors. Despite this regulatory initiative, poor readability and complexity in annual reports have increased over time (Loughran and McDonald, 2014). The research idea of this article stems from this concern. We hypothesize that greater complexity in annual reports leads to insiders exploiting information advantages. 2
Insiders have informational advantages over external investors, and the annual report is considered an important and credible channel for disseminating information to outsiders. Although some of the key financial information is disclosed well in advance of the annual report filing date, the discussions and analyses in these reports are critical for understanding upcoming business prospects and future performance (Brown and Tucker, 2011; Feldman et al., 2010). Prior research indicates that if a firm writes a less readable annual report, it increases information opacity and makes it considerably easier for managers to exploit resources in a self-serving manner (Biddle et al., 2009; Huang and Zhang, 2012). Consistent with opportunistic motive of managers, Rahman et al. (2020) show that managers strategically increase information uncertainty around opportunistic insider trading. However, the accounting and finance literature has yet to explore whether insiders strategically make annual reports less readable and increase information opacity to exploit their information advantage. Given that less readable annual reports increase information opacity, we hypothesize that there is a positive association between less readable annual reports and insider trading profitability.
We draw a link between annual report readability and insider trading from the literature that discusses competition, proprietary costs, information opacity, and insider trading. We only consider insider purchases, as these are more informative than sales. 3 The notion that insiders strategically make annual reports less readable and extract rent from their purchases follows a proprietary cost argument. Verrecchia (1983) theoretically argues that information opacity is higher in a more competitive industry and proprietary costs induce firms to withhold private information, as higher levels of disclosure could damage their competitive position. Consistent with this proprietary cost argument, Peress (2010) and Tookes (2008) predict that higher competition leads to a higher level of information opacity, which enables more insider trading. Overall, based on the discussions of proprietary costs, information opacity, and strategic motives, we expect a positive association between less readable annual reports and insider trading profitability.
We directly test this association using a sample of 102,060 insider purchase transactions between 1994 and 2016 in the United States. 4 Firms can make their reports less readable in a number of ways. They can make reports more complex and less readable by changing the structure of sentences and using an ambiguous tone. We use the Bog index, developed by Bonsall et al. (2017), to measure readability. This is a multifaceted measure of plain English (capturing difficulty in words, sentences, and pep) 5 and more appropriate compared to other traditional measures such as the Fog index, developed by Gunning (1968). A higher value of the Bog index implies lower readability. For insider trading profitability, we use the event study approach and Carhart’s (1997) four-factor model to estimate 6 months and 12 months of cumulative abnormal returns.
We find a positive relationship between the readability index and insider trading profitability, which suggests that the lower the readability of annual reports, the higher the insider trading profitability. Our results are economically significant. A 1-standard-deviation increase in a less readable report leads on average to a 19% and 20.5% increase in the 6- and 12-month insider trading profitability, respectively.
A concern for our identification strategy is that the readability of annual reports and insider trading profitability are endogenous. For example, insiders can make reports less readable, while at the same time certain omitted variables can influence both readability and insider trading profitability. To mitigate this endogeneity concern, we consider the SEC’s 1998 Plain English Rule as an instrument to readability. Loughran and McDonald (2014) show that 10-K reports have become more readable since the introduction of this rule. We use this Plain English Rule as an instrument in our two-stage least squares (2SLS) regressions. We restrict our sample to 1996–2000 while excluding 1998 to ensure a clean setting. We find that the instrumented readability indices derived from the first-stage regressions have a positive and significant causal influence on insider trading profitability. To further address endogeneity, we follow Ertugrul et al. (2017) and use the average readability of annual reports for firms located within the same area as an instrument. We use this instrument as it is argued that firms locating in the same geographic area have similar reporting practices. We generate an instrumental variable, which is the average readability of annual reports for firms sharing the first three digits of their five-digit ZIP code in the United States. This instrumental variable approach in the second stage also shows that a less readable report increases insider trading profitability. Overall, all these results add support to our identification strategy.
In the next step, we conduct some cross-sectional tests to provide evidence that strategic information opacity related to a proprietary cost argument is related to the exploitation of informational advantage by corporate insiders. We perform several proprietary cost–related tests. First, prior research shows that research and development (R&D)-intensive firms operate in an uncertain environment and have higher proprietary information costs (Jones, 2007). In this uncertain environment, firms are reluctant to disclose information to retain their competitive advantage (Darrough and Stoughton, 1990; Gertner et al., 1988; Harris, 1998; Hayes and Lundholm, 1996; Verrecchia, 1983), while, on the contrary, insiders exploit such an opaque information environment and gain greater abnormal profits (Aboody and Lev, 2000). Collectively, we test this proposition and find that the effect of readability on insider trading profitability is more pronounced for R&D-intensive firms. Second, similar to R&D-intensive firms, prior literature (Verrecchia, 1983; Verrecchia and Weber, 2006) also documents that firms in a competitive environment reduce corporate disclosures. Such reductions in corporate disclosures could be in the form of less readable annual reports which we also consider as a strategic motive for insider trading profitability. We find that competition intensifies the relationship between annual report readability and insider trading profitability. Third, Dedman and Lennox (2009) argue that managers issue less voluntary earnings guidance (disclosures) when proprietary costs are high. Although it is evident that managers issue voluntary guidance to improve liquidity and shape the information environment, due to strategic motives of rent extraction we expect that insiders make more abnormal profits when levels of management voluntary disclosures are lower. Accordingly, in our cross-sectional analysis, we find that the relationship between annual report readability and insider trading profitability is more pronounced when managers issue less voluntary guidance. Finally, we also directly test the proprietary cost argument by using a trade secrecy measure developed by Glaeser (2018). Glaeser (2018) shows that trade secrecy increases information opacity for which we further expect that insiders essentially exploit this in their trading. Accordingly, we find that the effect of less readable annual reports on insider trading profitability is more pronounced for firms with greater trade secrecy.
Our study contributes to the growing literature on corporate disclosure and insider trading in several ways. First, there has been extensive research into strategic disclosures (e.g. Cheng and Lo, 2006; Edmans et al., 2018; Rahman et al., 2020) where the focus is on sentiment and news tone around insider trading. However, limited research has been conducted into strategic disclosures using readability and lexical characteristics. Prior studies show that firms strategically make reports less readable to mitigate litigation risk (Humphery-Jenner et al., 2019), to manage earnings (Kim et al., 2019; Lo et al., 2017), and to retain competitive advantage (proprietary information) in a higher level of product market competition (Rahman et al., 2019). We contribute and extend such literature by documenting a higher level of insider trading profitability for companies who strategically make less readable annual reports to protect proprietary information.
Second, we contribute to the literature that focuses on the negative view of insider trading (Bettis et al., 2000; Fishman and Hagerty, 1992; Jagolinzer et al., 2011; Seyhun, 1986). We draw the link between annual report readability and insider trading based on the proprietary cost argument. Prior literature documents that higher level of competition induces managers to withhold proprietary information because competitive rivals could opportunistically use that information to obtain a competitive advantage (Gertner et al., 1988; Rahman et al., 2019; Verrecchia, 1983; Verrecchia and Weber, 2006). However, linking this opaque information environment with insider trading, Peress (2010) and Tookes (2008) predict that product market competition increases insider trading. Overall, corroborating proprietary costs, information opacity and strategic disclosures, and insider trading, we extend the insider trading literature by supporting proprietary cost and strategic information asymmetry channel of readability. Consistent with a proprietary cost argument, we show that the readability impact on insider trading profitability is more pronounced for R&D-intensive firms, for firms facing higher product market competition and trade secrecy, and for firms with lower levels of management voluntary disclosures.
The remainder of this article is organized as follows. Section 2 develops the hypothesis, and Section 3 describes the data, sample selection, and variables. Section 4 outlines the empirical strategy. Section 5 presents the baseline results and identification strategy, and deals with endogeneity issues. Section 6 conducts robustness checks, and Section 7 presents cross-sectional tests, while Section 8 concludes.
2. Hypothesis development
This study is closely related to the incomplete revelation hypothesis, which Bloomfield (2002) introduced as an alternative to the efficient market hypothesis to take account of information asymmetry and the resulting under- and over-reactions of stock prices to different corporate events and announcements. According to the incomplete revelation hypothesis, complex information, which is hard to extract, is not immediately reflected in stock prices. Hong and Stein (1999) also show that complexity affects the speed at which information is diffused among investors. Consistent with the incomplete revelation hypothesis, the empirical literature shows that poor-quality disclosures increase information asymmetry (Brown and Hillegeist, 2007; Heflin et al., 2005; Welker, 1995).
There is a growing body of the literature on annual report readability and its significance. The annual report is a primary source of information connecting corporate insiders and outside stakeholders. Diamond (1985) theoretically argues that higher levels of public disclosures crowd out information asymmetry. Empirical literature also supports this theoretical argument. For instance, Heflin et al. (2005) show that well-regarded corporate disclosure policy improves liquidity in the market by reducing information asymmetry. However, it is also evident that a less readable report increases information asymmetry. Prior literature documents this information asymmetry as a channel that raises the cost of debt (Ertugrul et al., 2017), increases return volatility (Loughran and McDonald, 2014), reduces investment efficiency (Biddle et al., 2009), increases disagreement among investors (Miller, 2010), and lowers litigation risk (Humphery-Jenner et al., 2019).
Our research examines how corporate insiders exploit their information advantage in a strategic information asymmetric environment. Extant literature documents that higher levels of product market competition induce managers to disclose less as the firms become more concerned about proprietary information. (Gertner et al., 1988; Verrecchia, 1983; Verrecchia and Weber, 2006). Consistent with this view, Rahman et al. (2019) show that higher level of product market competition increases information opacity in the form of less readable annual reports. Along this line, Peress (2010) and Tookes (2008) theoretically show that product market competition essentially increases insider trading. Overall, based on all the discussions, we hypothesize in favor of the proprietary cost argument of information opacity (less readable annual reports) and insider trading profitability. In particular, we develop the following alternative hypothesis:
Hypothesis 1A. Lower annual report readability increases insider trading profitability.
3. Data, variable descriptions, and descriptive statistics
3.1. Data
To examine the relation between annual report readability and insider trading, we use data from COMPUSTAT, CRSP, I/B/E/S, Brian P. Miller’s webpage, and the Thomson Reuters Insiders Filings Database for 1994–2016. Since EDGAR reports 10-K filings from 1994 onward, we begin our sample from that date. For the readability of these 10-K filings, we obtain Bog index data for the period 1994–2016 from Bonsall et al. (2017). Data are available from Brian P. Miller’s webpage at Indiana University. 6 Our initial sample of insider trading variables includes all the open market purchase transactions. These transactions are identified across four different groups: CEOs, other top-level managers, directors and other managers, and large shareholders and others. Following Lakonishok and Lee (2001), we only include insider purchase transactions of at least 100 shares to reduce the chance of a liquidity motive and to allow for a meaningful analysis. We collect all accounting and financial variables from COMPUSTAT. For stock return–related observations, we restrict our sample to common stocks with share codes of 10 and 11 in CRSP and listed on three exchanges, namely, NYSE, AMEX, and NASDAQ. Following prior studies, we also exclude all regulated firms in the utilities and financial industries. We obtain analyst coverage data from I/B/E/S. After cleaning and filtering missing observations for all the variables and merging the data from all these databases, we finally obtain our regression sample of 102,060 insider transactions covering 1994–2016.
3.2. Variable descriptions 7
3.2.1. Readability
Our measure of annual report readability is the Bog index (BOG), which was developed by Bonsall et al. (2017). This index is a multifaceted measure and it considers the attributes of disclosures, including the passive voice, weak verbs, overused words, complex words, jargon, and document length. In addition, BOG corrects and modifies the standard annual report readability measures through a graded word list, rather than employing word length and syllable counts. The Bog index is made up of the following three components: Sentence Bog, Word Bog, and Pep. Sentence Bog and Word Bog consider issues related to sentence length and word difficulty, whereas Pep identifies whether writing attributes are understandable to readers. A higher value of this index implies a lower readability of annual reports. Following the wider literature (e.g. Biddle et al., 2009; Lawrence, 2013; Lehavy et al., 2011; Li, 2008), we also use the Fog index (FOG), Flesch–Kincaid index (KINCAID), and Flesch index (FLESCH) as three alternative measures of annual report readability.
3.2.2. Insider trading profitability
Our identification strategy is based on how annual report readability is associated with insider trading profitability. Because of the “short swing” rule, 8 we use investment horizons of 6 and 12 months of insider purchases. Following the event study approach (e.g. Wu, 2018) and Carhart’s (1997) four-factor model, we regress individual stocks’ excess returns on Carhart’s four-factor model. Our estimation window is from −250 to −50 trading days. We summarize the procedures in the following equations

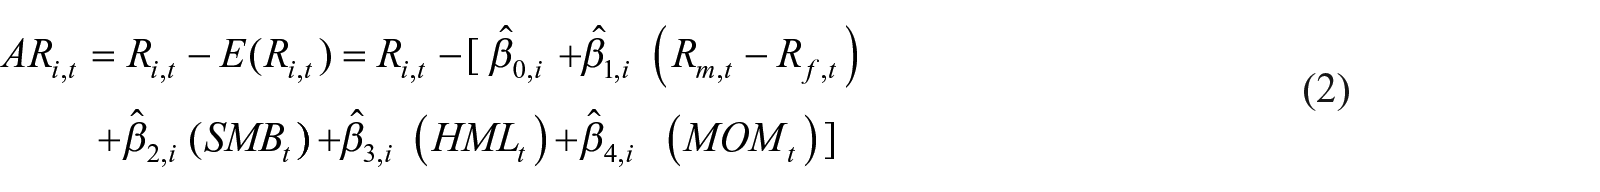
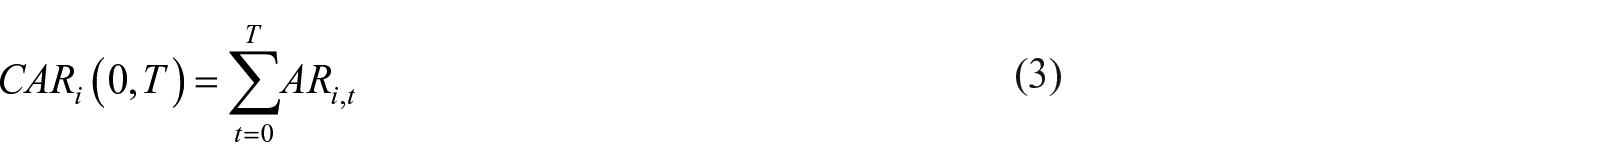
where Ri, t and Rf, t are the individual stock and risk-free returns, respectively. Rm, t, SMB, HML, and MOM are the market returns, size, value, and momentum factors of Carhart’s model, respectively. 9 Equation (2) shows the estimation procedure for abnormal returns (AR), and equation (3) calculates cumulative abnormal returns (CAR). The event windows are denoted by T, where 126 and 252 days are for the 6-month (CAR6MONTH) and 12-month cumulative abnormal returns (CAR12MONTH), respectively.
3.2.3. Control variables
We measure and use all our control variables at time t−1. SIZE_FIRM is estimated as the natural logarithm of the market value of equity. MARKET_BOOK is calculated by taking the ratio of the market value of equity to the book value of equity. R&D_DUMMY is an indicator variable that takes the value of 1 if a firm has positive R&D expenditure and 0 otherwise. LOSS_DUMMY is also an indicator variable taking the value of 1 if a firm reports loss in a particular year and 0 otherwise. PROFITABILITY is the ratio of income before extraordinary items and total assets. AGE_COMPANY is the natural logarithm of the number of years since a firm first appeared in CRSP. GROWTH_SALES is estimated by taking the average of the last 5 years of sales growth. VOLATILITY is the standard deviation of daily stock returns covering a 1-year period. TURNOVER is the average ratio of trading volume to shares outstanding covering a 1-year period. ANALYST_DIS is the standard deviation of the analysts’ forecasts divided by the absolute mean value of forecasts in a particular year. PASTRETURN is the1-month (21 days) cumulative abnormal returns for each insider purchase before the trade.
3.3. Descriptive statistics
Table 1 presents the summary statistics for the variables. In Panel A, we report the mean, median, and standard deviation of the readability (BOG) index. The mean value of BOG is around 82, which is consistent with prior studies (Bonsall and Miller, 2017; Hasan, 2020). In Panel B, we report the descriptive statistics for the firm-level characteristics. The variables SIZE_FIRM and MARKET_BOOK have mean values of 5.412 and 3.409, with standard deviations of 1.940 and 24.093, respectively. These and the other firm characteristic variables are also within reasonable levels. In Panel C, we report the summary statistics for insider profitability. Insiders, on average, earn 8.5% (CAR6MONTH) and 11.9% (CAR12MONTH) cumulative abnormal returns from their 6- and 12-month holding periods, respectively.
Key summary statistics.
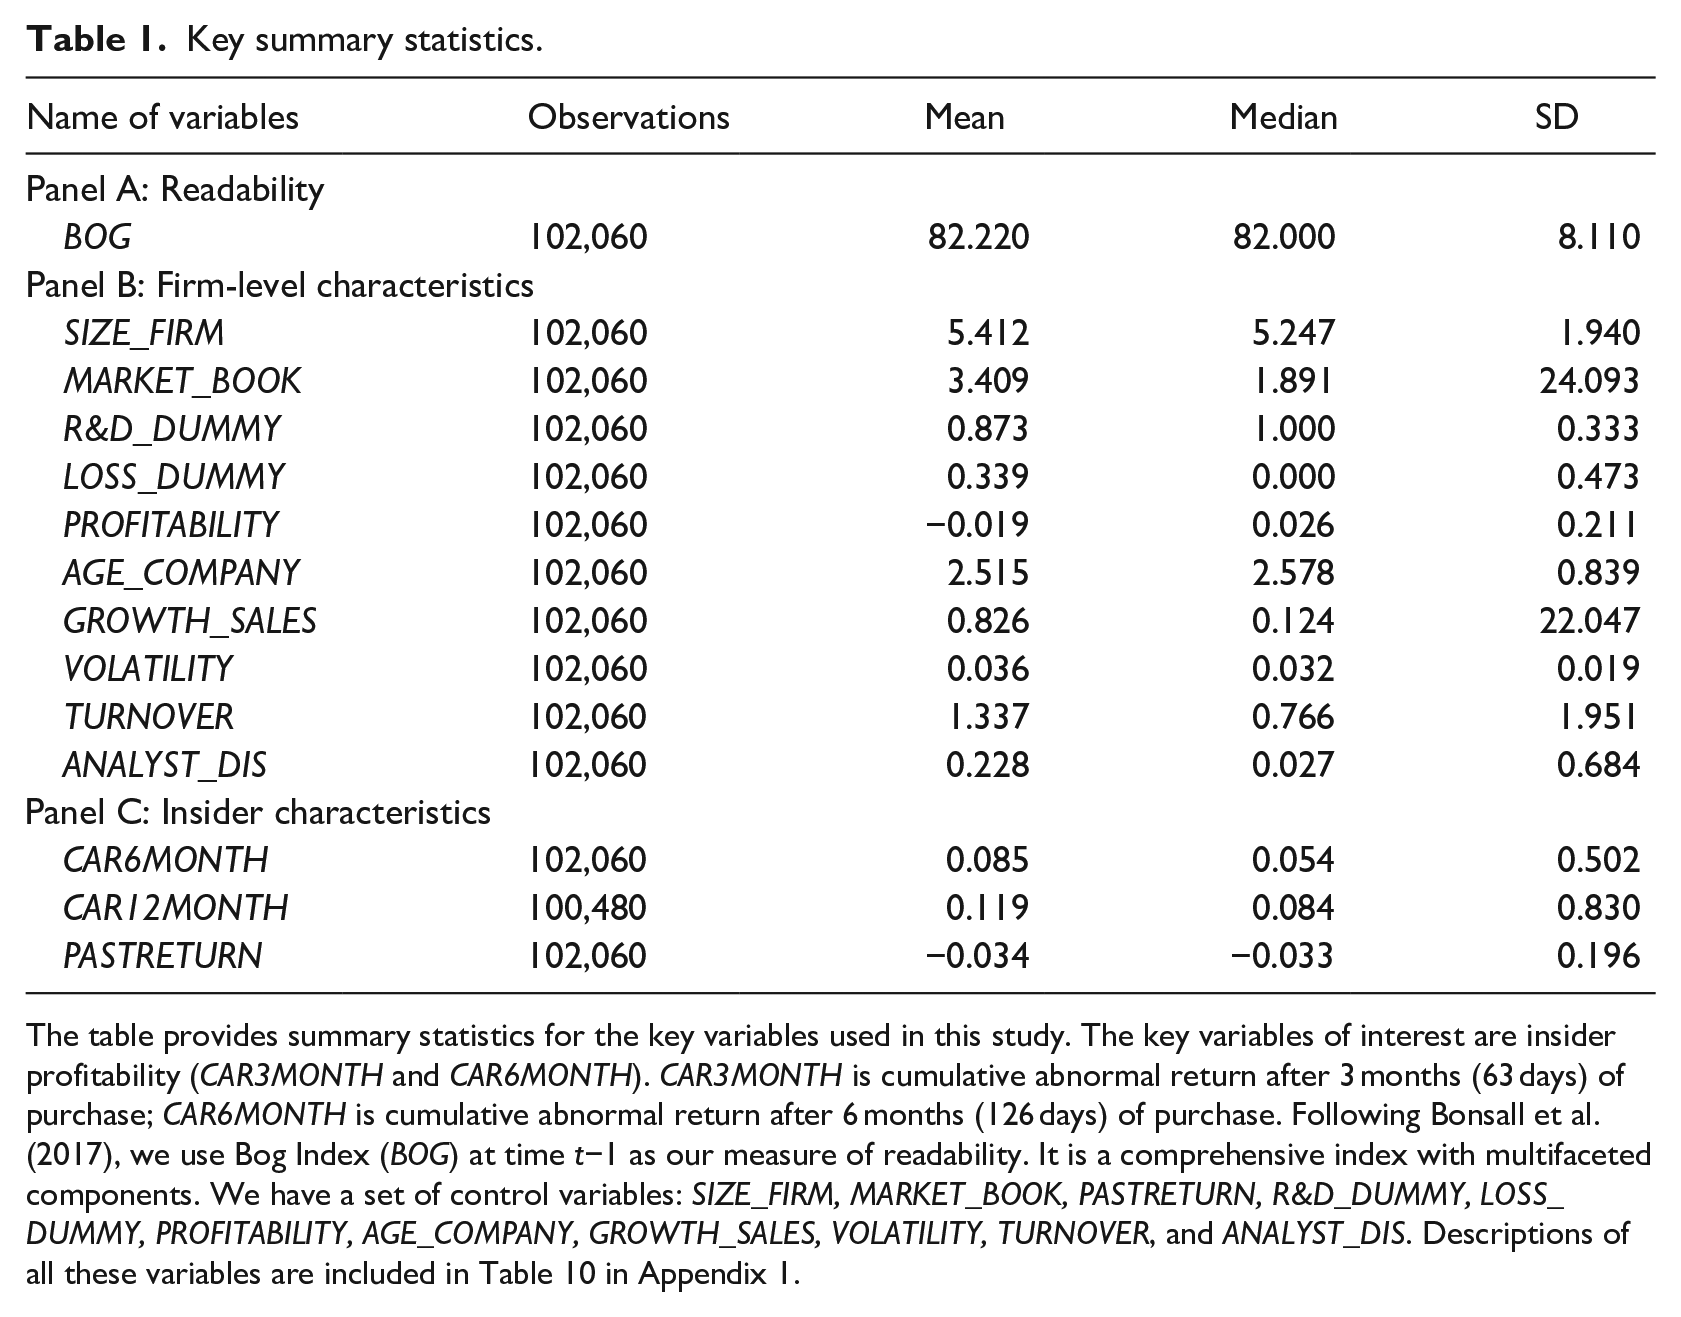
The table provides summary statistics for the key variables used in this study. The key variables of interest are insider profitability (CAR3MONTH and CAR6MONTH). CAR3MONTH is cumulative abnormal return after 3 months (63 days) of purchase; CAR6MONTH is cumulative abnormal return after 6 months (126 days) of purchase. Following Bonsall et al. (2017), we use Bog Index (BOG) at time t−1 as our measure of readability. It is a comprehensive index with multifaceted components. We have a set of control variables: SIZE_FIRM, MARKET_BOOK, PASTRETURN, R&D_DUMMY, LOSS_DUMMY, PROFITABILITY, AGE_COMPANY, GROWTH_SALES, VOLATILITY, TURNOVER, and ANALYST_DIS. Descriptions of all these variables are included in Table 10 in Appendix 1.
Table 2 presents the Pearson’s correlation matrix for the key variables used in this study. The Bog index is positively associated with CAR6MONTH (0.022) and CAR12MONTH (0.023). Both the correlations are statistically significant at the 1% level. The directions of the correlations are consistent with our prediction that corporate insiders make higher abnormal profits if annual reports are less readable.
Correlation matrix.
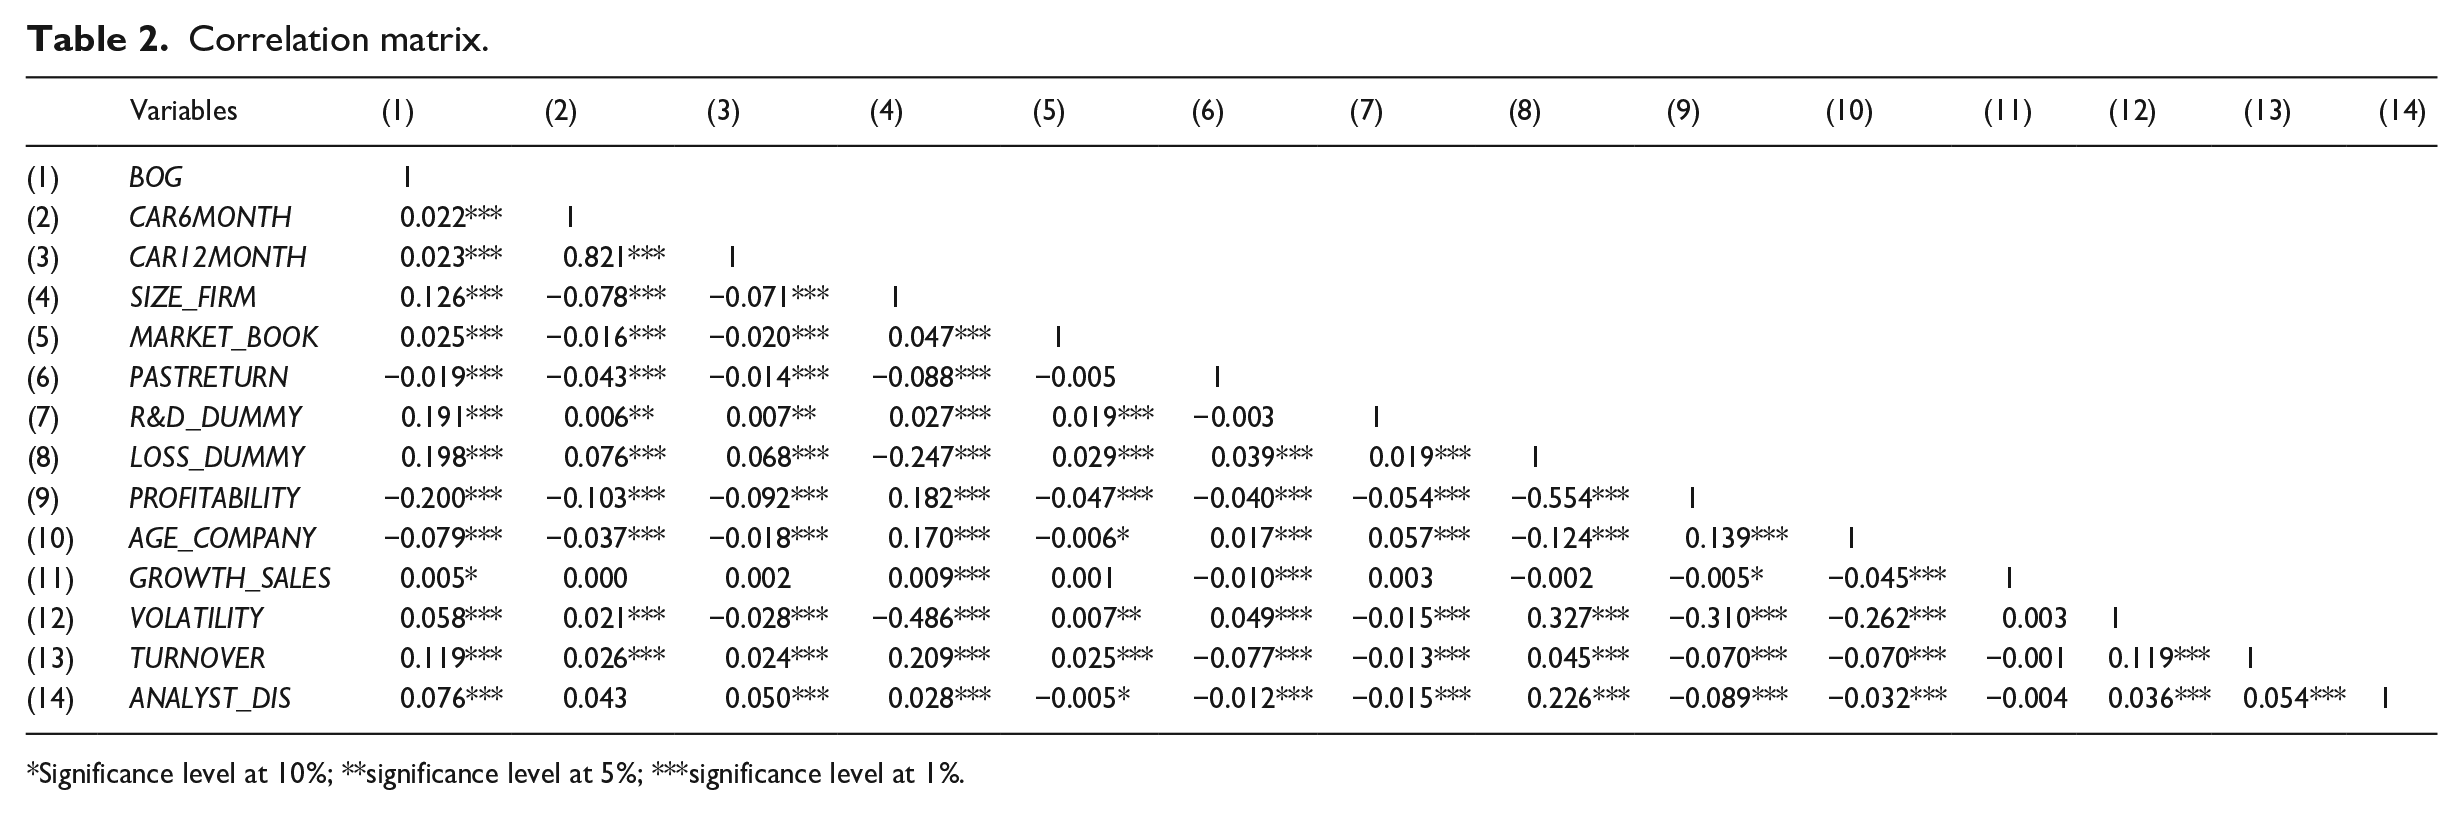
Significance level at 10%; **significance level at 5%; ***significance level at 1%.
4. Empirical strategy
For identification purposes, we test how insider trading profitability (CAR6MONTH and CAR12MONTH) is influenced by annual report readability. The following equations summarize our regression models:

where CAR6MONTH and CAR12MONTH are the cumulative abnormal returns for 6 and 12 months and BOG is the primary measure of READABILITY. The CONTROLS are SIZE_FIRM, MARKET_BOOK, PASTRETURN, R&D_DUMMY, LOSS_DUMMY, PROFITABILITY, AGE_COMPANY, GROWTH_SALES, VOLATILITY, TURNOVER, and ANALYST_DIS.
5. Results
5.1. Baseline
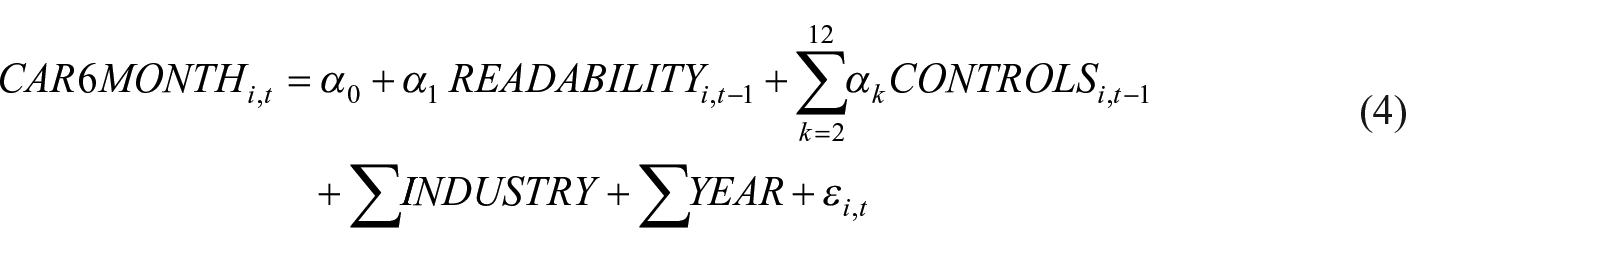
Our baseline results show how insider trading profitability is influenced by annual report readability. We use cumulative abnormal returns 6 months (126 days) after purchase (CAR6MONTH) and 12 months (256 days) after purchase (CAR12MONTH) as our main measures of profitability. We expect that CAR6MONTH and CAR12MONTH would be significantly higher for less readable annual reports (higher BOG). We report our results in Panels A and B of Table 3. Panel A shows the univariate test results of how the level of CAR6MONTH and CAR12MONTH differs between high and low levels of the BOG index. We classify high (low) level of BOG groups based on index value higher (lower) than sample median. We find that the mean and the median of CAR6MONTH and CAR12MONTH with high BOG group are significantly higher than the mean and median of CAR6MONTH and CAR12MONTH of the low BOG group. Overall, these results preliminarily suggest a positive relationship between BOG and insider trading profitability.
Readability and insider trading profitability.
The table shows how readability of 10-K reports (BOG index) affects insider trading profitability. We present univariate and multivariate results in Panel A and Panel B, respectively. We use cumulative abnormal return after 6 months (126 days) of purchase (CAR6MONTH) and cumulative abnormal return after 12 months (256 days) of purchase (CAR12MONTH) as our main measures of insider trading profitability. In Panel A, we identify high (low) level of readability based on whether BOG index is lower (higher) than sample median. In Panel B, we have a set of control variables: SIZE_FIRM, MARKET_BOOK, PASTRETURN, R&D_DUMMY, LOSS_DUMMY, PROFITABILITY, AGE_COMPANY, GROWTH_SALES, VOLATILITY, TURNOVER, and ANALYST_DIS. The definitions of all these variables are included in Table 10 in Appendix 1. The standard errors are clustered at firm level. We include four-digit SIC code for industry effect. The t-values are reported in parentheses.
Significance level at 10%; **significance level at 5%; ***significance level at 1%.
We present the multivariate results in Panel B of Table 3. Columns (1) and (2) in Table 3 show the ordinary least squares regression results for equations (4) and (5), respectively. We include industry and year-fixed effects to control for any omitted time-invariant industry characteristics. The t-values are reported in parentheses and standard errors are clustered at the firm level. We find that the coefficients of BOG are positive and significantly related to CAR6MONTH and CAR12MONTH. This result generally supports our hypothesis that a less readable annual report increases insider trading profitability. 10 In particular, the coefficients of BOG for CAR6MONTH (0.002 with p < 0.05) and CAR12MONTH (0.003 with p < 0.10) imply that a 1-standard-deviation change in readability increases insider trading profitability by around 19% and 20.5% in the 6- and 12-month periods, respectively. 11 This result is economically significant and meaningful compared with the prior literature. For instance, Wu (2018) documents around a 15% increase in 6-month cumulative abnormal returns for an increase in information asymmetry.
5.2. Addressing endogeneity and sensitivity analysis 12 : the Plain English Rule as an instrument to readability
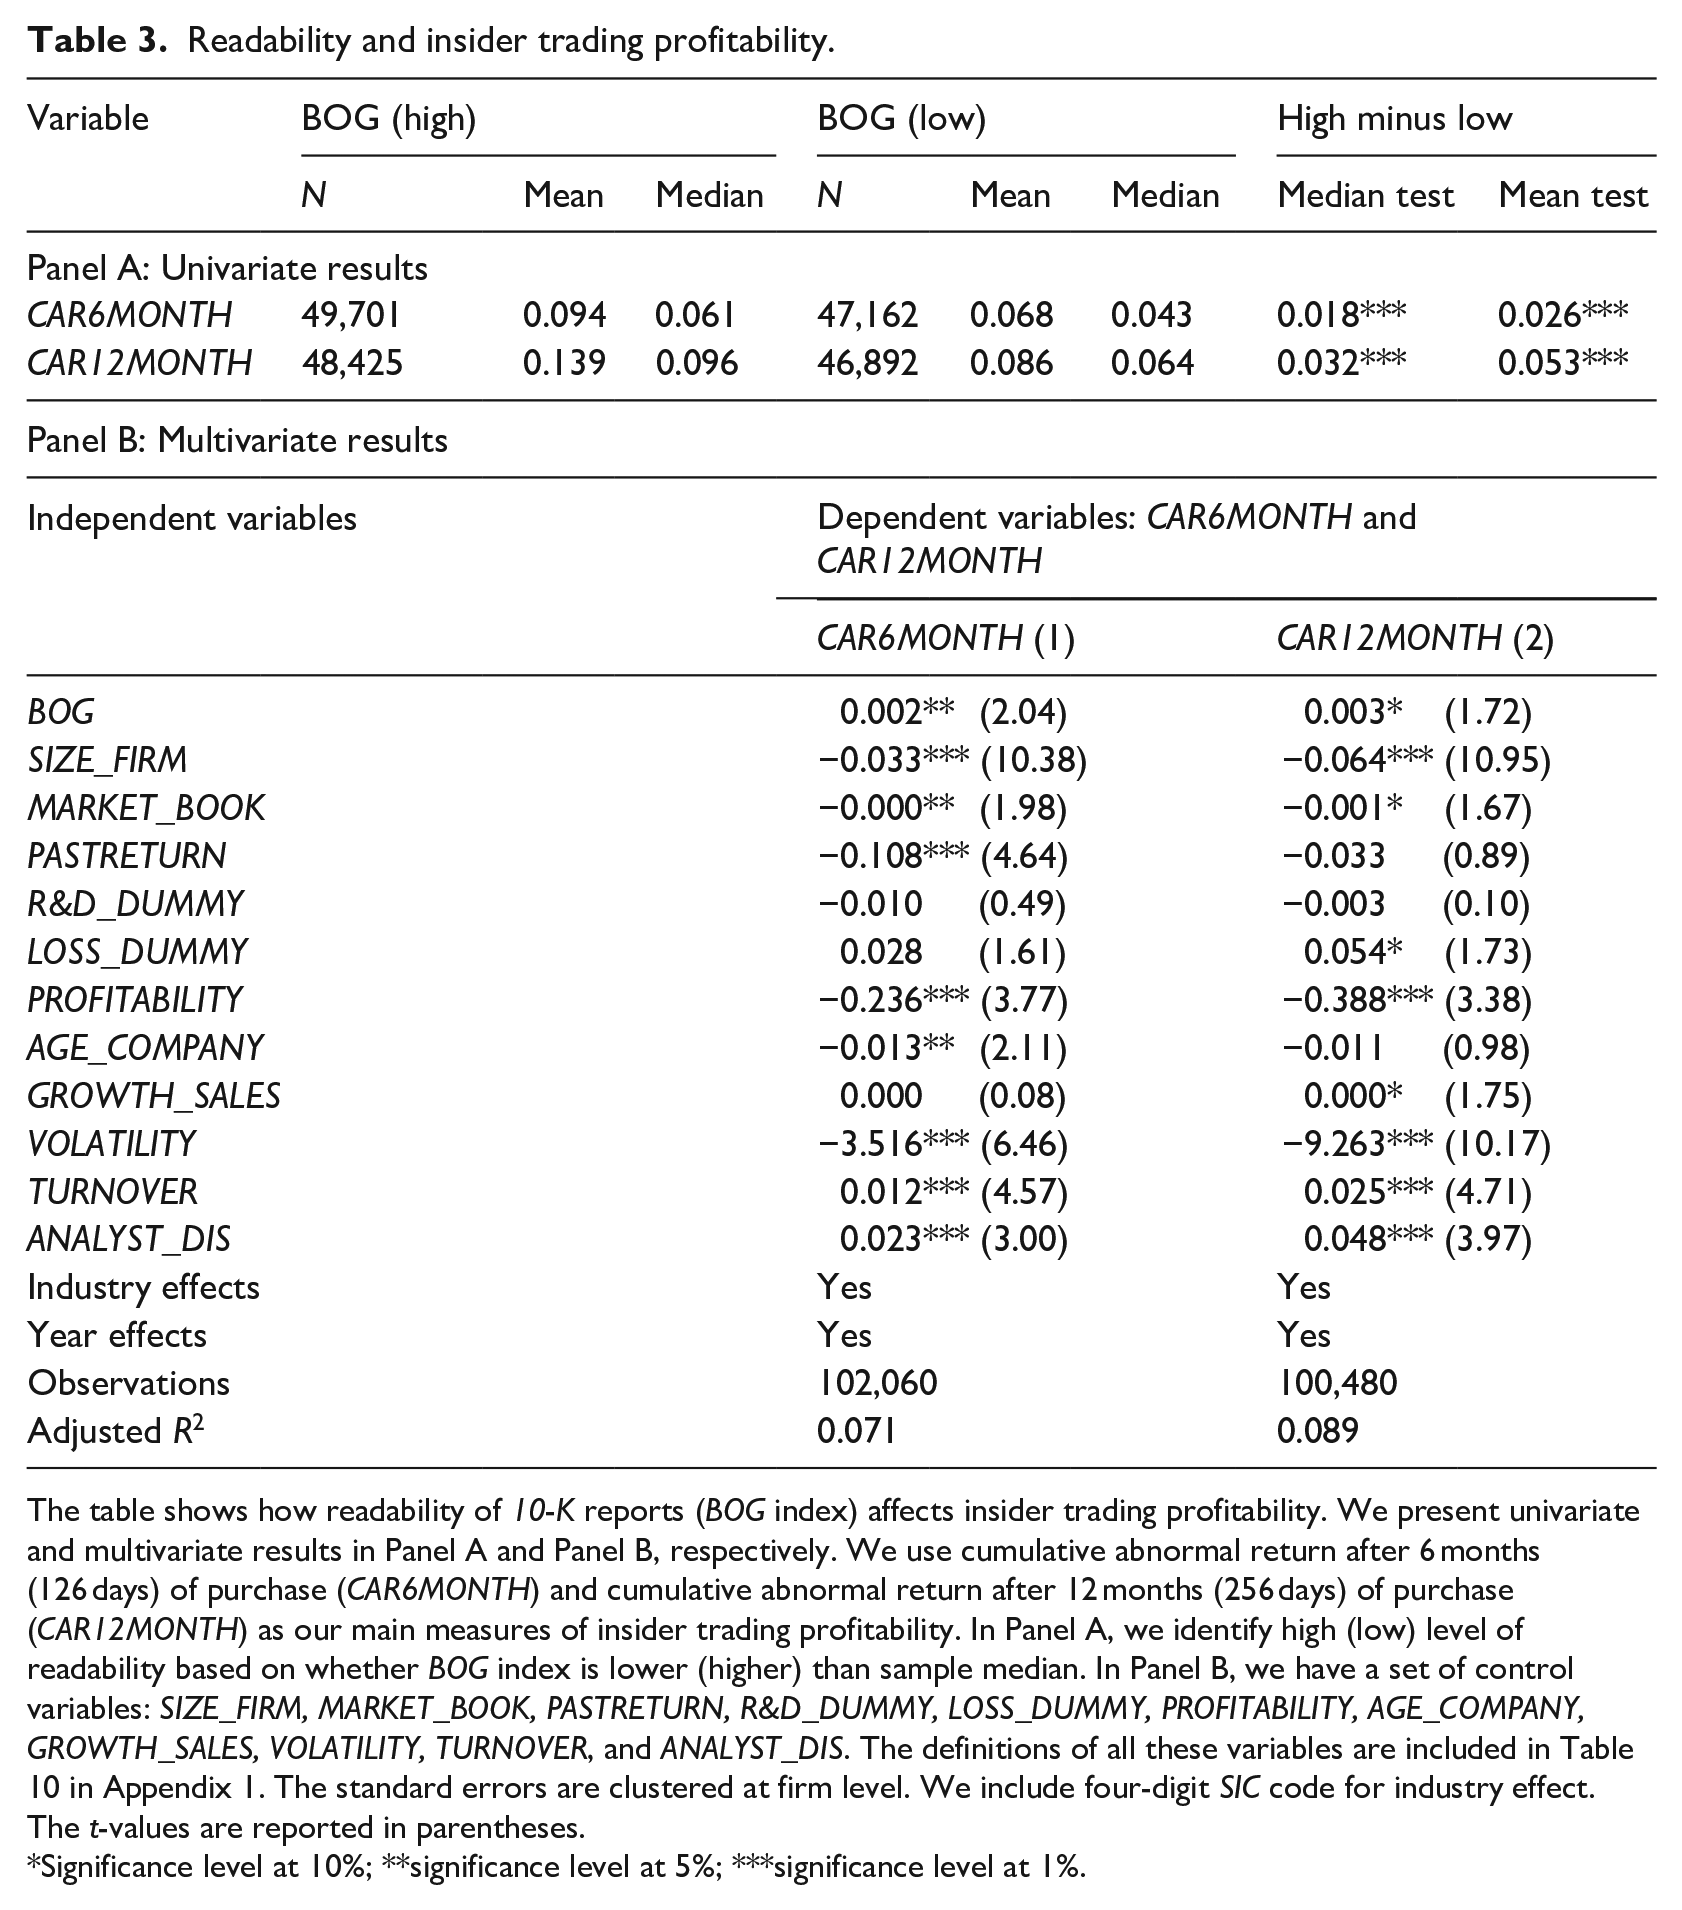
A caveat for our identification strategy is that the readability of annual reports and opportunistic insider trading are endogenous. For example, insiders can make reports less readable, while some omitted variables can also influence both readability and insider trading profitability. We address this endogeneity issue by considering the 1998 Plain English Rule to be an instrument for annual report readability. Loughran and McDonald (2014) argue that annual reports have become more readable since the introduction of this rule. Humphery-Jenner et al. (2019) also use this rule as an instrument to readability when examining the link between readability and litigation risk. Therefore, we use this rule as an instrument in the 2SLS models. We restrict our sample to 1996–2000 and create an instrumental variable, which is a dummy variable taking the value of 1 for observations after 1998 and 0 otherwise. To ensure a clean setting, we also exclude 1998, the year in which the rule was introduced. In the first stage (untabulated), we regress BOG and three alternative readability indices (FOG, KINCAID, and FLESCH) onto our instrument. We derive the predicted values of all our readability indices from the first-stage regressions and run the second-stage regressions with all these instrumented indices. Table 4 reports the second-stage regression results for insider trading profitability (CAR6MONTH and CAR12MONTH). We find that all the coefficients (in columns 1–6) for the instrumented readability indices (BOG, FOG, and KINCAID) are positive and significant, whereas the coefficients for the instrumented FLESCH index are negative and significant. 13 This implies that insider trading profitability increases for less readable annual reports. 14
Addressing endogeneity with Plain English Rule 1998 as an instrument.
LM: Lagrange multiplier.
The table shows the second stage of two-stage regression results for the relationship between annual report readability and insider trading using Plain English Rule 1998 as an instrument. We restrict our sample to 1996–2000 and create an instrument variable INSTRUMENT_1998, which is a dummy variable taking the value of 1 for observations after year 1998 and otherwise 0. For a clean setting, we also exclude 1998 when the rule is introduced. The dependent variables in the first stage are BOG, FOG, KINCAID, and FLESCH indices, and the key variable is INSTRUMENT_1998. Following in the spirit of Lo et al. (2017), we control for the determinants of readability indices: SIZE_FIRM, MARKET_BOOK, AGE_COMPANY, VOLATILITY, BUS_SEG, GEO_SEG, NON_MISS, SPECIAL_ITEM, M&A_DUMMY, and DELAWARE. The predicted values of these readability indices are used in second-stage regressions. The dependent variables in the second-stage regressions are CAR6MONTH and CAR12MONTH. The standard control variables are SIZE_FIRM, MARKET_BOOK, PASTRETURN, R&D_DUMMY, LOSS_DUMMY, PROFITABILITY, AGE_COMPANY, GROWTH_SALES, VOLATILITY, TURNOVER, and ANALYST_DIS. The definitions of all these variables are included in Table 10 in Appendix 1. We include four-digit SIC code for industry effect. The t-values are reported in parentheses.
Significance level at 10%; **significance level at 5%; ***significance level at 1%.
6. Robustness checks 15
6.1. Sensitivity analyses 16
We also check the robustness of our baseline results using additional controls and alternative specification. First, given that personal attributes can influence insider trading profitability, following Hillier et al. (2015), we include insiders’ trade size and their characteristics as additional controls. Trade size is estimated using the natural logarithm of the number of shares purchased by an insider on a particular transaction date. Insider characteristics are indicated by a dummy variable taking the value of 1 for CEOs, 2 for top-level managers, 3 for directors and other managers, and 4 for large shareholders and others. We re-run the regressions for equations (4) and (5) with these additional controls. The untabulated results show that our finding of increased insider profitability for less readable annual reports is robust and remains unchanged. Second, we also check the sensitivity of our results using the changes in annual report readability (BOG) as a key variable. We find that insider trading profitability also significantly increases for the increases in BOG index. In other words, for the positive change in readability (less readable annual reports), insider trading profitability increases.
6.2. Omitted variable bias
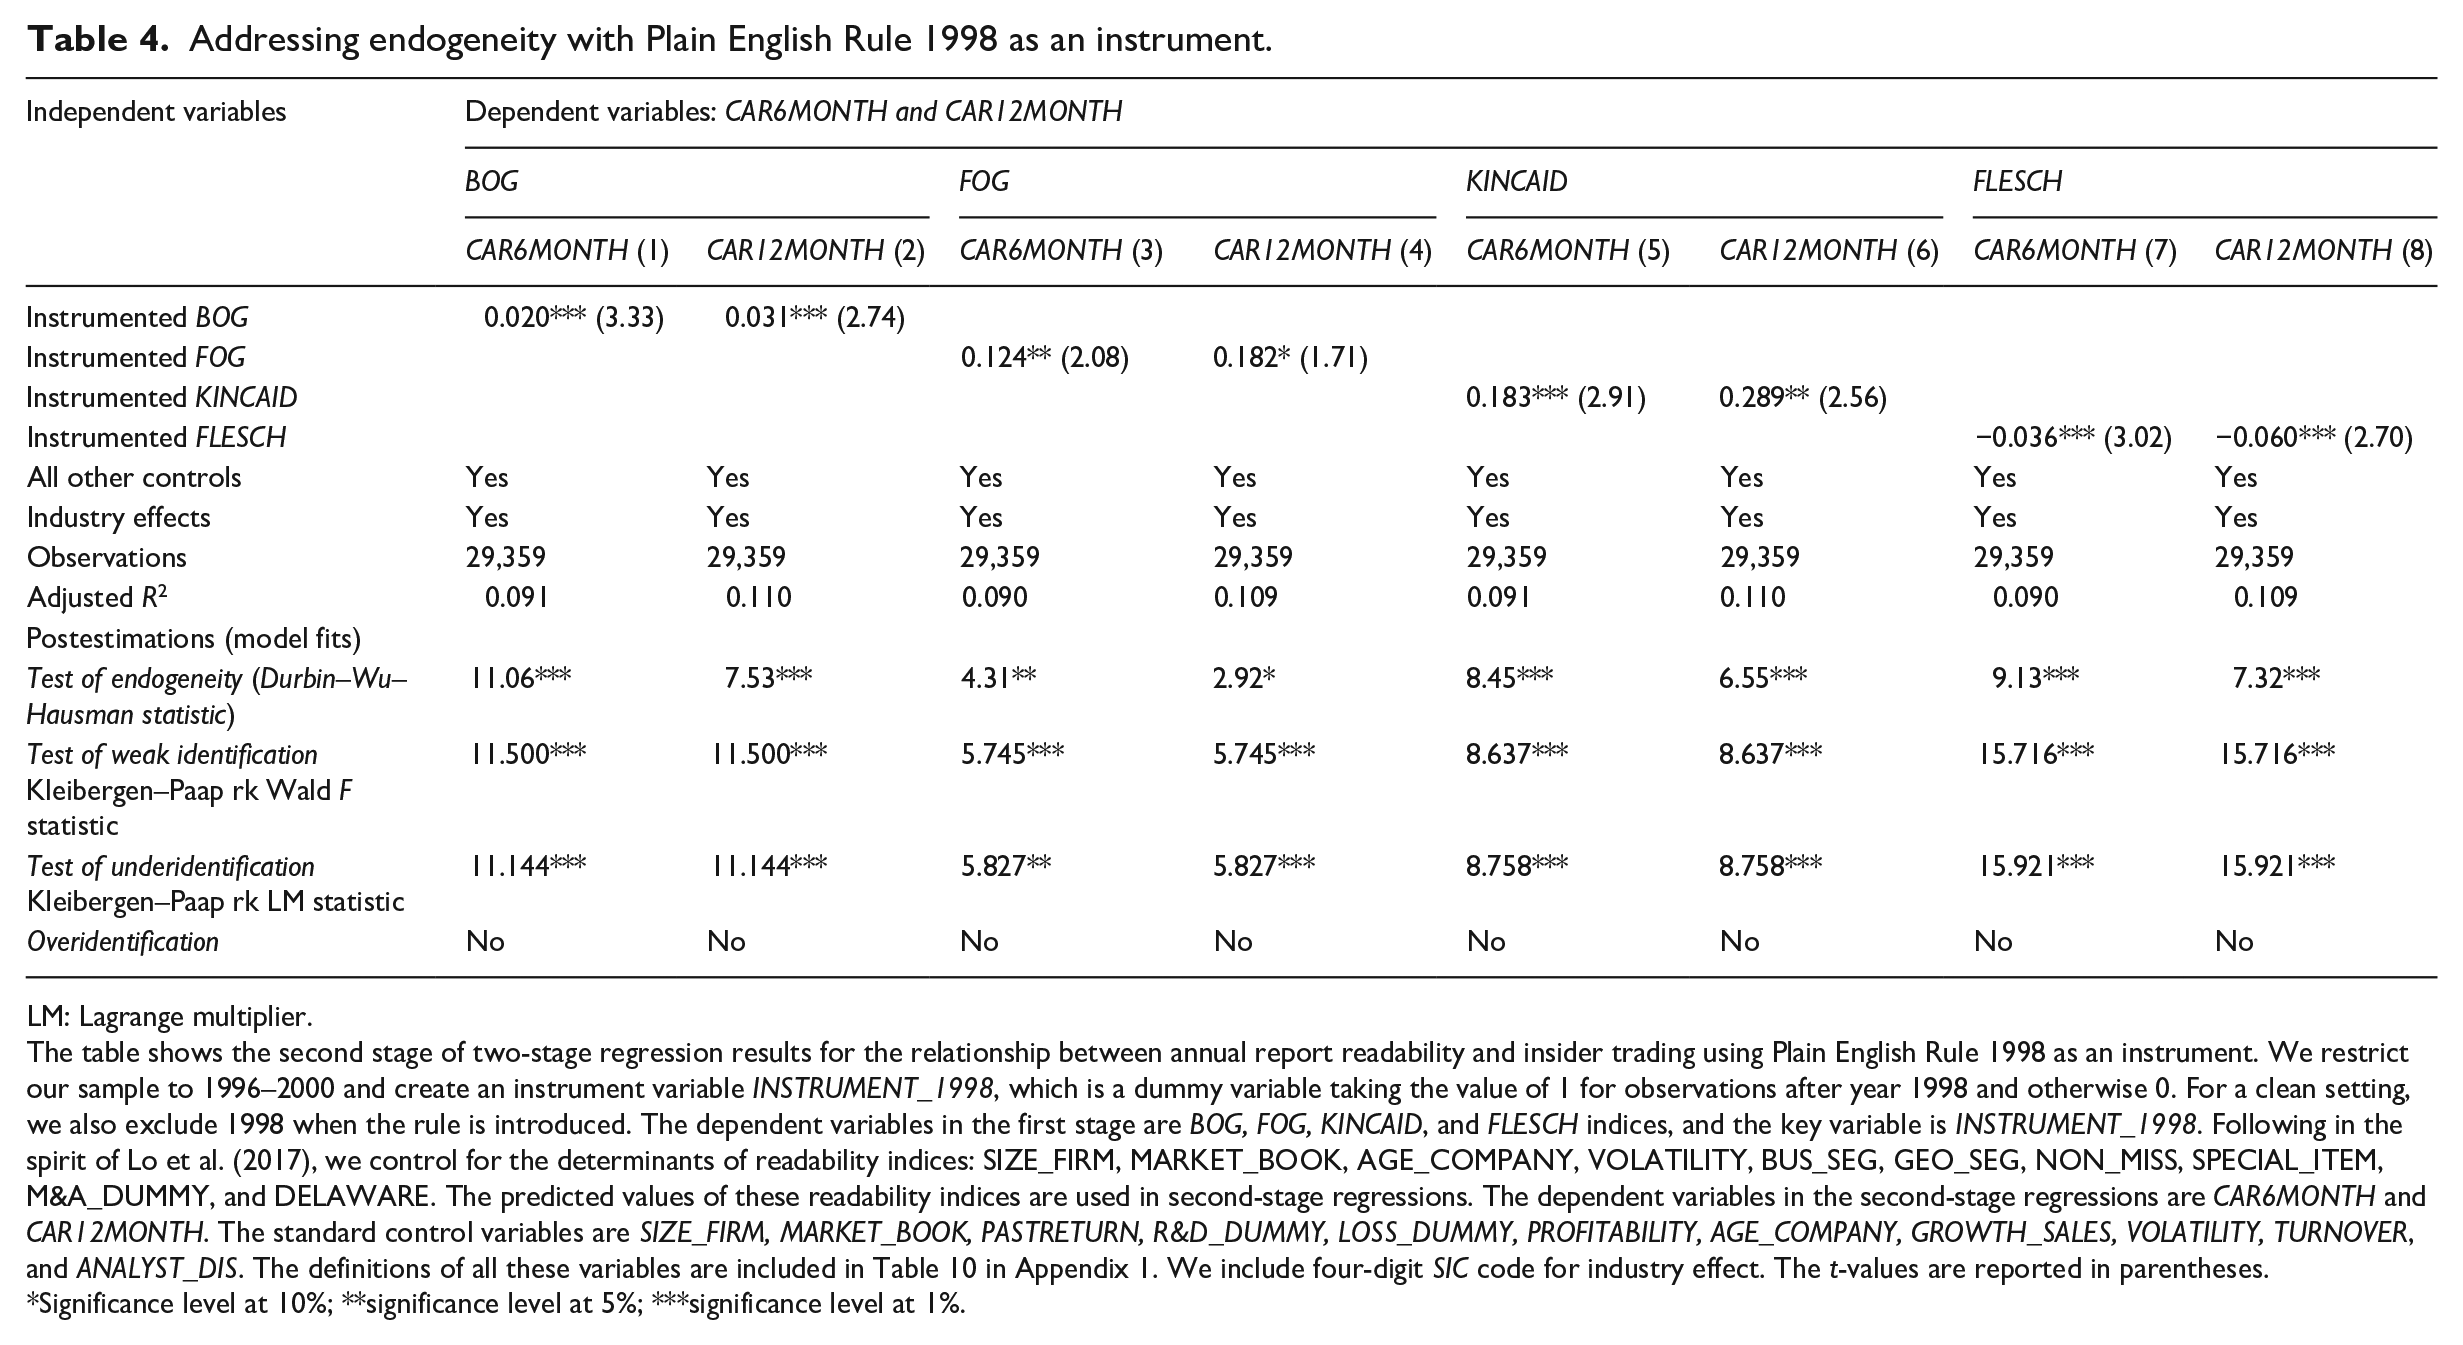
Although we use the instrumental variable approach in Section 5.2, our results may be biased for firm-related omitted variables. In this section, we address this problem and check the robustness of our results with firm and year-fixed effect regressions. These regressions control for omitted time-invariant firm-level characteristics. Table 5 shows the results. We find that the increase in insider profitability for less readable annual reports remains qualitatively unchanged, albeit a non-significant coefficient is reported for CAR12MONTH.
Addressing omitted variable bias with firm fixed-effects regressions.
The table shows the results for the relationship between readability and insider trading profitability with firm fixed-effects regressions. The dependent variables are CAR6MONTH and CAR12MONTH, and the readability measure is BOG index. The control variables are SIZE_FIRM, MARKET_BOOK, PASTRETURN, R&D_DUMMY, LOSS_DUMMY, PROFITABILITY, AGE_COMPANY, GROWTH_SALES, VOLATILITY, TURNOVER, and ANALYST_DIS. The definitions of all these variables are included in Table 10 in Appendix 1. The standard errors are clustered at firm level. The t-values are reported in parentheses.
Significance level at 10%; **significance level at 5%; ***significance level at 1%.
6.3. Addressing endogeneity further
We further mitigate our endogeneity concern using the average readability of annual reports for firms located within the same area as an instrument. Jha (2019) argues that firms operating in the same geographical area are likely to have similar financial reporting practices. In our setting, we expect that this instrument is highly (positively) correlated with firm-level readability measure (BOG) and it is less likely that insider trading profitability is influenced by average readability of a region. Following Ertugrul et al. (2017), we create an instrumental variable, INSTRUMENT_ZIP, which is the average readability of annual reports for firms sharing the first three digits of their five-digit ZIP code in the United States. We run 2SLS regressions, where, in the first stage, the dependent variable is the readability index (BOG) and the key variable is INSTRUMENT_ZIP. We derive the predicted values of BOG (instrumented BOG) from the first-stage regression and use those as the key explanatory variable in the second-stage regressions. The dependent variables in the second-stage regressions are CAR6MONTH and CAR12MONTH. The untabulated results 17 show that, in the first stage, INSTRUMENT_ZIP is positively and significantly associated with BOG and, in the second stage, instrumented BOG is positively and significantly related to CAR6MONTH and CAR12MONTH. This result further supports our identification strategy that a less readable annual report leads insiders to exploit greater abnormal returns from their trades.
7. Cross-sectional analyses
Our results support the notion that annual report readability influences insider trading profitability through the channel of proprietary costs and information asymmetry. This channel places insiders in an advantageous position that they can exploit when trading. To establish this proprietary costs and information asymmetry argument, we examine how insider trading profitability varies cross-sectionally in firms where proprietary costs are significantly high. In other words, we perform four tests to examine how the relationship between annual report readability and insider trading profitability varies cross-sectionally among firms with differing levels of R&D intensity, product market competition, management voluntary guidance, and trade secrecy.
7.1. R&D intensity
We argue that since R&D-intensive firms have higher levels of proprietary costs, insiders make more abnormal profits from less readable annual reports. Aboody and Lev (2000) find that R&D-intensive firms make more abnormal returns because of the higher proprietary cost of information and information asymmetry. Jones (2007) also document that R&D-intensive firms have higher proprietary costs and operate in an uncertain environment. Thus, with informational advantages over external investors, we hypothesize that increases in insider trading profitability for companies with less readable annual reports are more pronounced in highly R&D-intensive firms. Table 6 summarizes the results. We perform a subsample analysis that considers high/low R&D intensity. R&D intensity is measured using the ratio of R&D expenditure to total assets. We define R&D intensity as low if the intensity ratio is lower than the sample average and as high otherwise. Consistent with our prediction, we find that BOG is positive and significantly associated with insider trading profitability only in the subsample of high R&D-intensive firms.
Cross-sectional tests: readability, R&D intensity, and insider trading profitability.
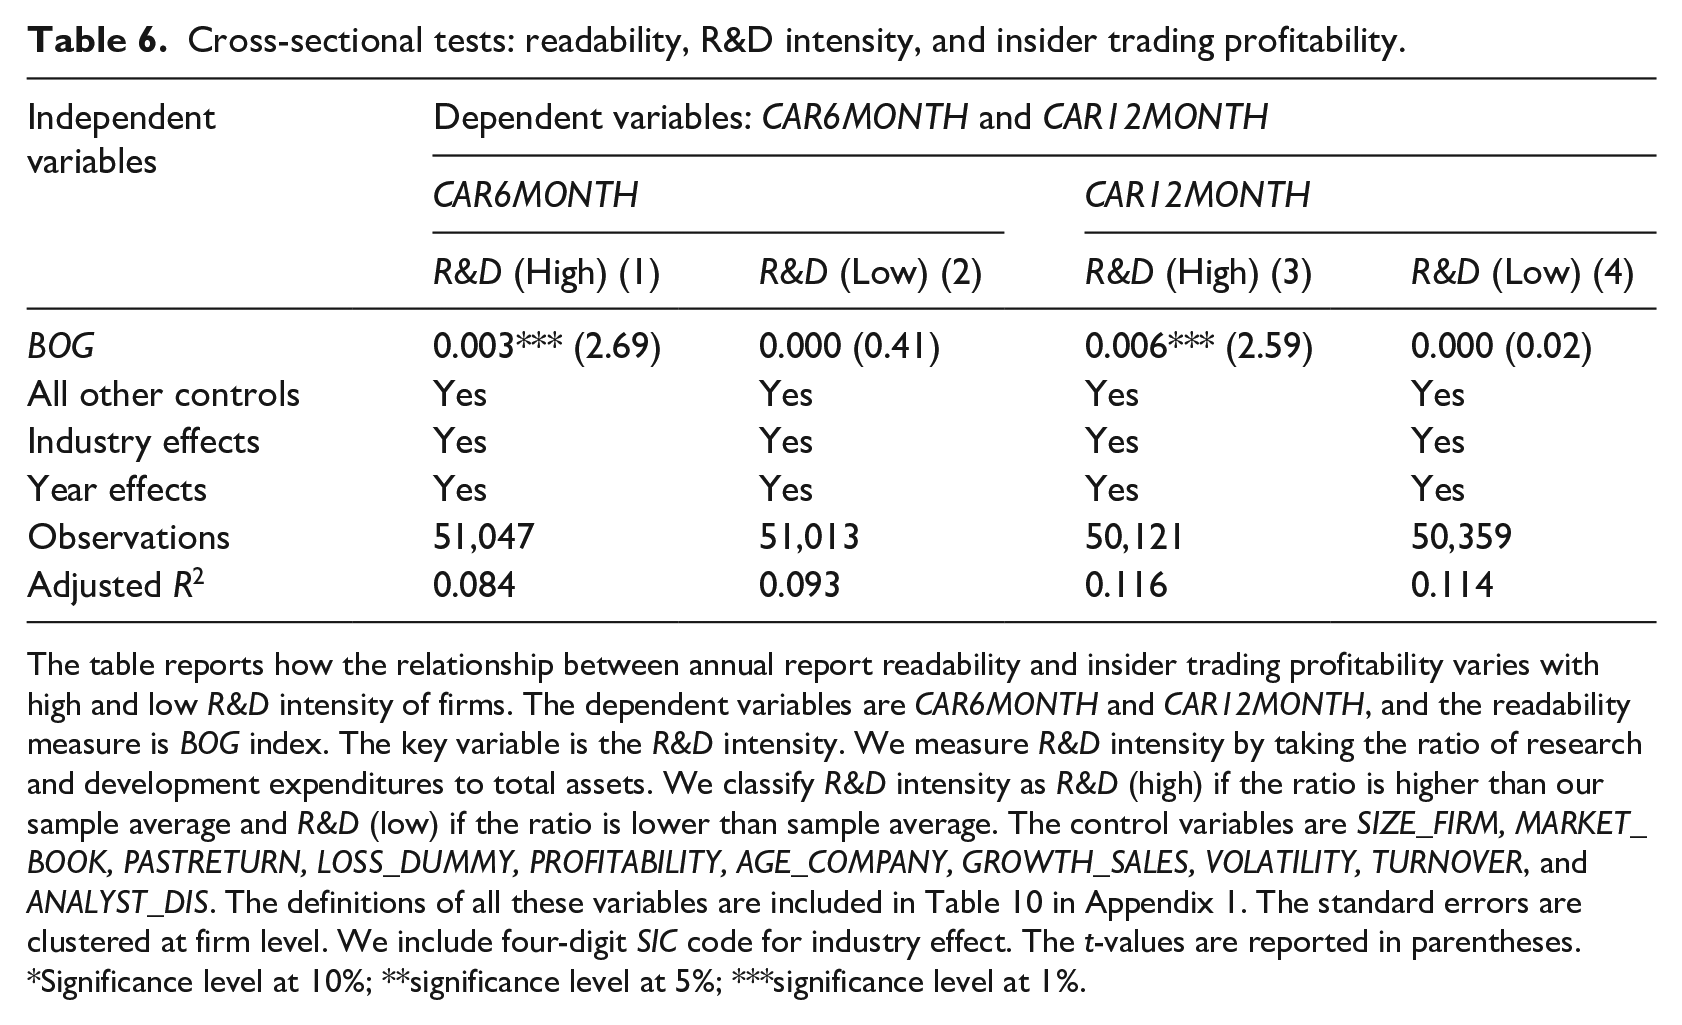
The table reports how the relationship between annual report readability and insider trading profitability varies with high and low R&D intensity of firms. The dependent variables are CAR6MONTH and CAR12MONTH, and the readability measure is BOG index. The key variable is the R&D intensity. We measure R&D intensity by taking the ratio of research and development expenditures to total assets. We classify R&D intensity as R&D (high) if the ratio is higher than our sample average and R&D (low) if the ratio is lower than sample average. The control variables are SIZE_FIRM, MARKET_BOOK, PASTRETURN, LOSS_DUMMY, PROFITABILITY, AGE_COMPANY, GROWTH_SALES, VOLATILITY, TURNOVER, and ANALYST_DIS. The definitions of all these variables are included in Table 10 in Appendix 1. The standard errors are clustered at firm level. We include four-digit SIC code for industry effect. The t-values are reported in parentheses.
Significance level at 10%; **significance level at 5%; ***significance level at 1%.
7.2. Product market competition
Product market competition (PMC) has the potential to increase insider trading profitability because of the higher level of information asymmetry. Verrecchia (1983) points out that competition increases information asymmetry because of higher proprietary costs. On the one hand, proprietary costs make firms reluctant to disclose value-relevant information, as this could damage their competitive position. On the other hand, the proprietary costs and increase in information asymmetry can lead insiders to exploit their information advantages (Shleifer, 2004). Hence, we expect insider trading profitability for companies with less readable annual reports to be more pronounced in highly competitive markets. Table 7 presents this result. Following Hoberg and Phillips (2016), we use the text-based network industry Herfindahl–Hirschman Index as a measure of PMC. A lower value for this index represents a higher level of competition. We create two subsamples: high PMC and low PMC. PMC is high (low) if the PMC index is lower (higher) than the sample average. We find that BOG is positive and significantly associated with insider trading profitability only under the condition of high PMC. This result suggests that insider trading profitability for less readable annual reports is due to increased information asymmetry.
Cross-sectional tests: readability, product market competition, and insider trading profitability.
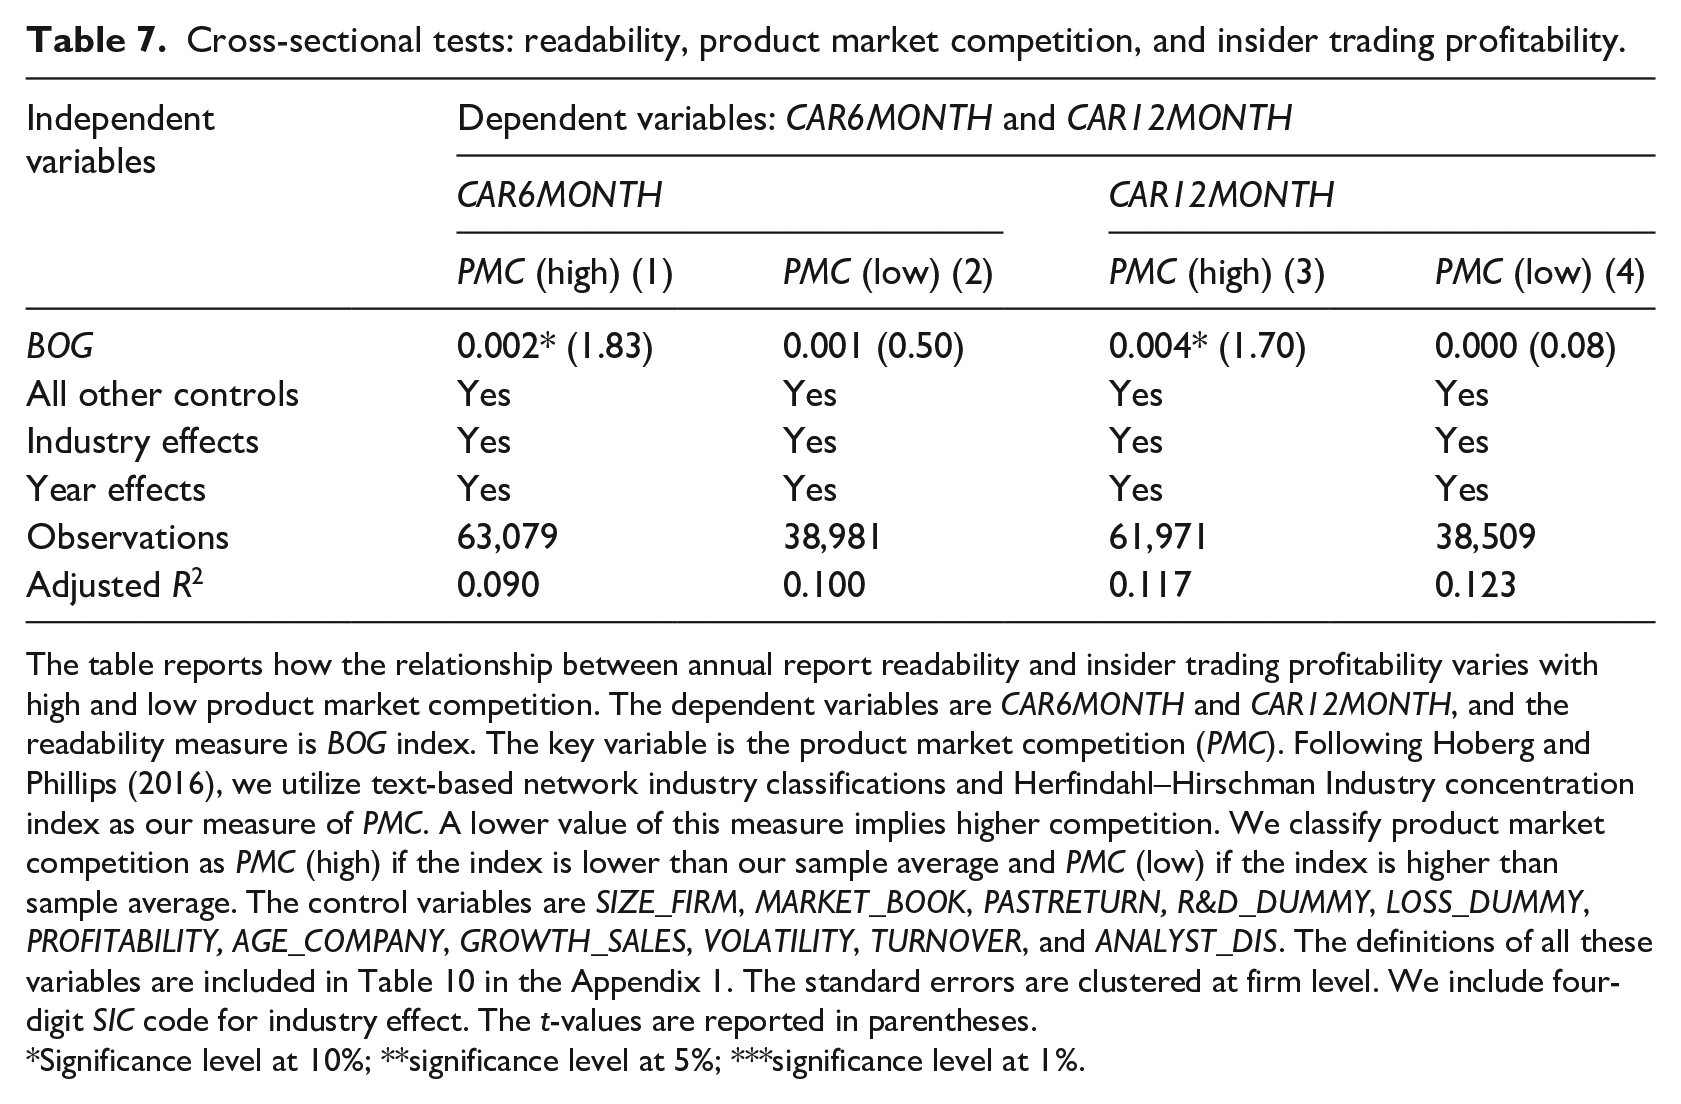
The table reports how the relationship between annual report readability and insider trading profitability varies with high and low product market competition. The dependent variables are CAR6MONTH and CAR12MONTH, and the readability measure is BOG index. The key variable is the product market competition (PMC). Following Hoberg and Phillips (2016), we utilize text-based network industry classifications and Herfindahl–Hirschman Industry concentration index as our measure of PMC. A lower value of this measure implies higher competition. We classify product market competition as PMC (high) if the index is lower than our sample average and PMC (low) if the index is higher than sample average. The control variables are SIZE_FIRM, MARKET_BOOK, PASTRETURN, R&D_DUMMY, LOSS_DUMMY, PROFITABILITY, AGE_COMPANY, GROWTH_SALES, VOLATILITY, TURNOVER, and ANALYST_DIS. The definitions of all these variables are included in Table 10 in the Appendix 1. The standard errors are clustered at firm level. We include four-digit SIC code for industry effect. The t-values are reported in parentheses.
Significance level at 10%; **significance level at 5%; ***significance level at 1%.
7.3. Management voluntary guidance
Voluntary disclosures by managers play a critical role in shaping the information environment of firms. Balakrishnan et al. (2014) show that managers issue more voluntary disclosures to shape liquidity and improve the information opacity. However, Dedman and Lennox (2009) argue that managers issue less voluntary earnings guidance (disclosures) when proprietary cost is high. Based on this proprietary cost argument, we hypothesize that the positive relationship between annual report readability and insider trading profitability is more pronounced when managers have less voluntary disclosures. We obtain management voluntary disclosure data from I/B/E/S and calculate VOL_DIS as the total number of voluntary disclosures in a year. We classify management voluntary disclosures as VOL_DIS (high) if the VOL_DIS is higher than sample average and VOL_DIS (low) if the variable is lower than sample average. Table 8 displays the results. We find that BOG is positive and significantly associated with insider trading profitability only in the subsample of low management voluntary disclosures.
Cross-sectional tests: readability, voluntary disclosures, and insider trading profitability.
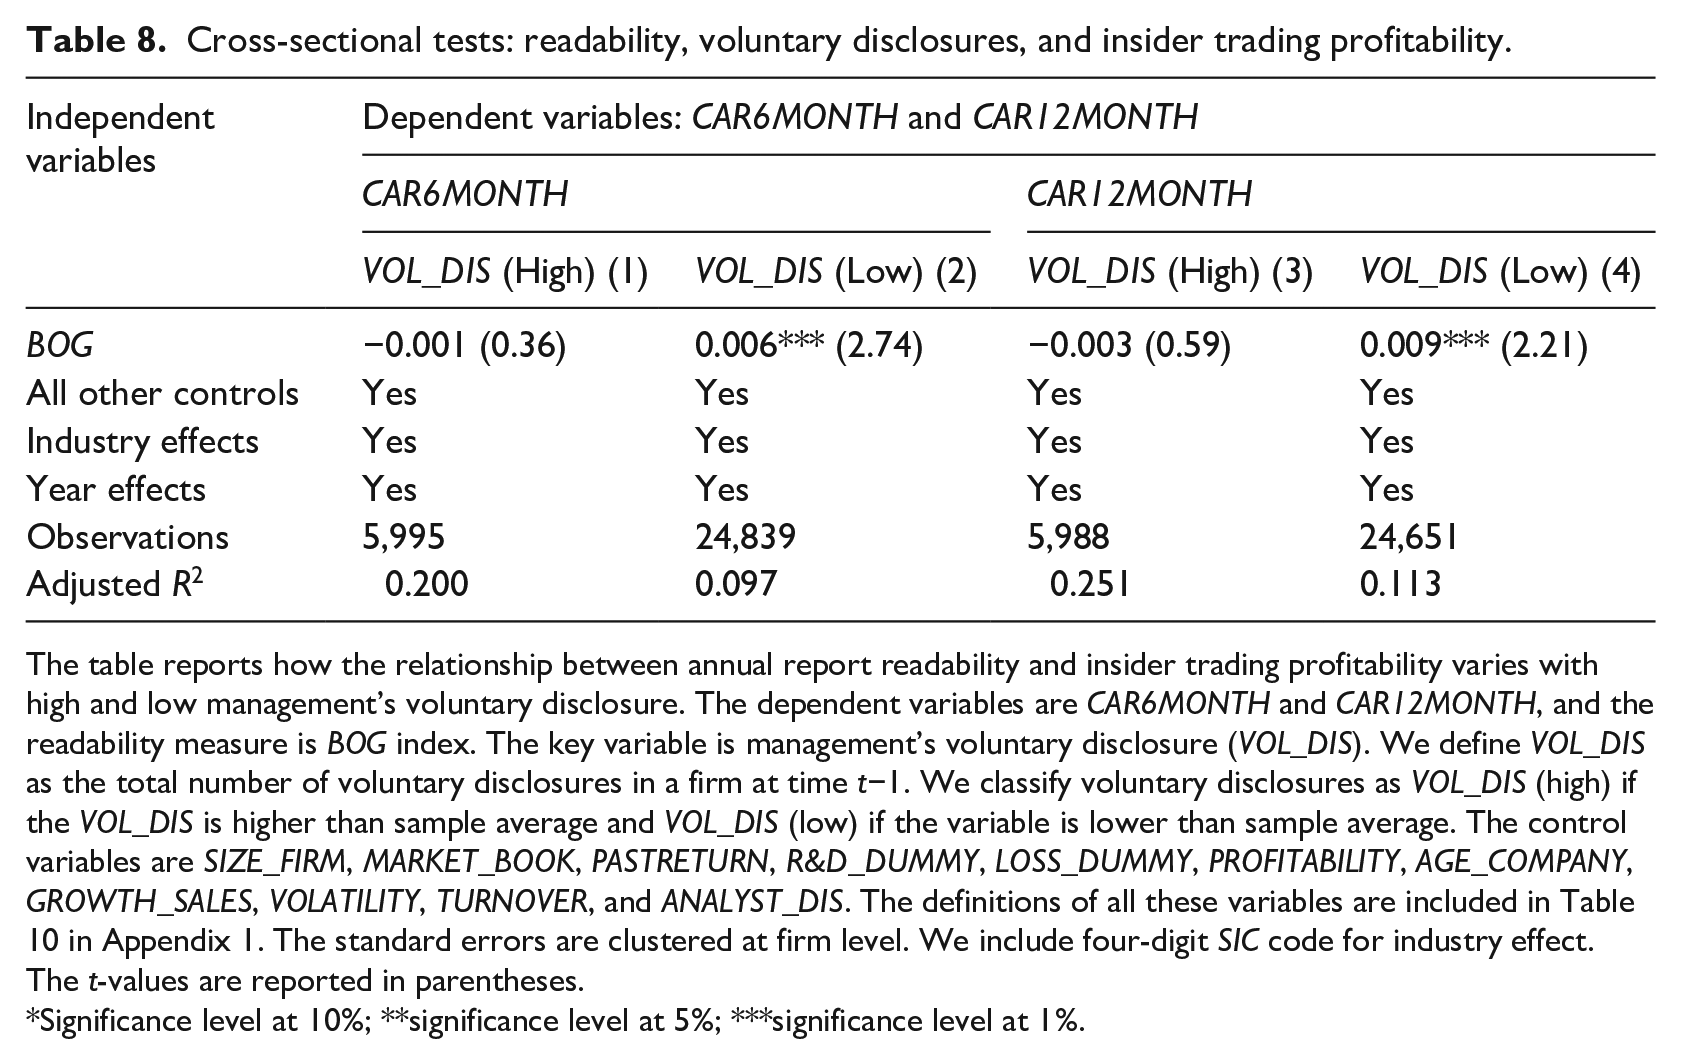
The table reports how the relationship between annual report readability and insider trading profitability varies with high and low management’s voluntary disclosure. The dependent variables are CAR6MONTH and CAR12MONTH, and the readability measure is BOG index. The key variable is management’s voluntary disclosure (VOL_DIS). We define VOL_DIS as the total number of voluntary disclosures in a firm at time t−1. We classify voluntary disclosures as VOL_DIS (high) if the VOL_DIS is higher than sample average and VOL_DIS (low) if the variable is lower than sample average. The control variables are SIZE_FIRM, MARKET_BOOK, PASTRETURN, R&D_DUMMY, LOSS_DUMMY, PROFITABILITY, AGE_COMPANY, GROWTH_SALES, VOLATILITY, TURNOVER, and ANALYST_DIS. The definitions of all these variables are included in Table 10 in Appendix 1. The standard errors are clustered at firm level. We include four-digit SIC code for industry effect. The t-values are reported in parentheses.
Significance level at 10%; **significance level at 5%; ***significance level at 1%.
7.4. Trade secrecy
According to Item 601 of Regulation S-K, firms with trade secrecy disclose their risk of not disclosing their proprietary information. Generally, firms who have unpatented innovations protect their innovation and proprietary information with trade secrets. Glaeser (2018) shows that trade secrecy increases information opacity. We expect that insiders strategically make reports less readable and exploit this trade secrecy from their trading. We obtain trade secrecy data from Glaeser (2018) and split our sample into two groups: TRADE_SEC (High) if a firm has trade secrecy and TRADE_SEC (Low) if a firm has no trade secrecy. Table 9 shows the results. We find that the effect of less readable annual reports on insider trading profitability is more pronounced for firms with high trade secrecy. In other words, when a firm has higher level of proprietary costs, insiders make more abnormal profits for less readable annual reports.
Cross-sectional tests: readability, trade secrecy, and insider trading profitability.
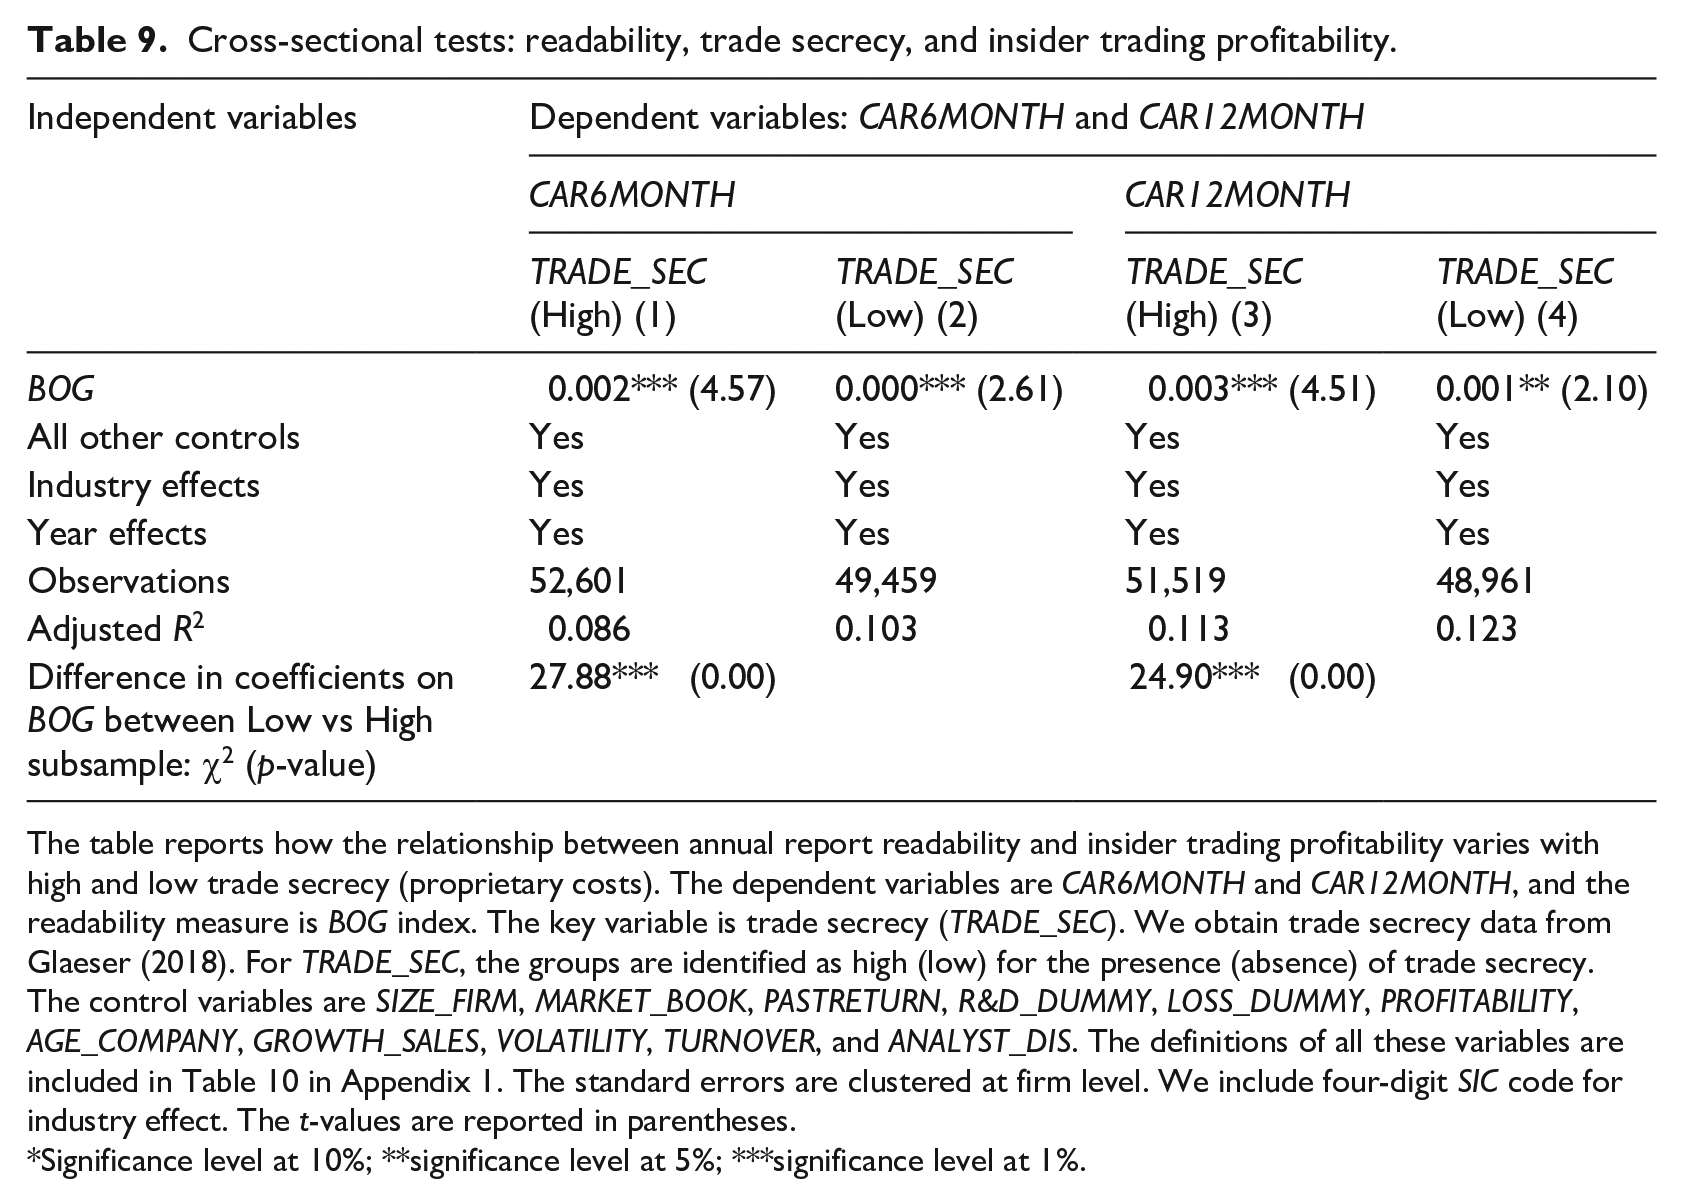
The table reports how the relationship between annual report readability and insider trading profitability varies with high and low trade secrecy (proprietary costs). The dependent variables are CAR6MONTH and CAR12MONTH, and the readability measure is BOG index. The key variable is trade secrecy (TRADE_SEC). We obtain trade secrecy data from Glaeser (2018). For TRADE_SEC, the groups are identified as high (low) for the presence (absence) of trade secrecy. The control variables are SIZE_FIRM, MARKET_BOOK, PASTRETURN, R&D_DUMMY, LOSS_DUMMY, PROFITABILITY, AGE_COMPANY, GROWTH_SALES, VOLATILITY, TURNOVER, and ANALYST_DIS. The definitions of all these variables are included in Table 10 in Appendix 1. The standard errors are clustered at firm level. We include four-digit SIC code for industry effect. The t-values are reported in parentheses.
Significance level at 10%; **significance level at 5%; ***significance level at 1%.
8. Conclusion
We analyze whether firms reduce the readability of annual reports to allow insiders to trade opportunistically on their information advantages. The research idea stems from the premise that increasing opacity in 10-K disclosures increases insiders’ scope to exploit more from their trading. Prior research shows major implications of less readable annual reports in terms of higher costs of borrowing (Ertugrul et al., 2017), greater analyst uncertainty and dispersion (Lehavy et al., 2011), a poor information environment (Loughran and McDonald, 2014), less efficient investments (Biddle et al., 2009), and higher risk of a stock price crash (Kim et al., 2019). However, an important area of research in this regard is gaining understanding from the insider trading perspective.
We show that insider trading profitability increases significantly for companies with less readable annual reports. Through a range of robustness checks and, more importantly, using the SEC’s 1998 Plain English Rule as an instrument, we document this exploitative motive of insiders. We cross-validate these results by focusing on proprietary cost arguments and find that the effect of readability on insider trading profitability is more pronounced for R&D-intensive firms, for firms facing higher product market competition and trade secrecy, and for firms with lower level of management voluntary disclosures.
Overall, these findings support the proprietary cost and information asymmetry argument of insider trading. Although we add significant contributions to the growing body of the literature on corporate disclosure and insider trading, we could not provide evidence as to whether insiders directly (exclusively) manipulate readability for making higher abnormal returns. In other words, we only provide evidence that insiders strategically worsen annual report to protect proprietary information which insiders otherwise exploit from their trading. Our results are important for regulators and firms so that they can act on potential opportunistic behavior of corporate insiders in cases of proprietary costs and less readable annual reports.
Footnotes
Appendix 1
Description of key variables.
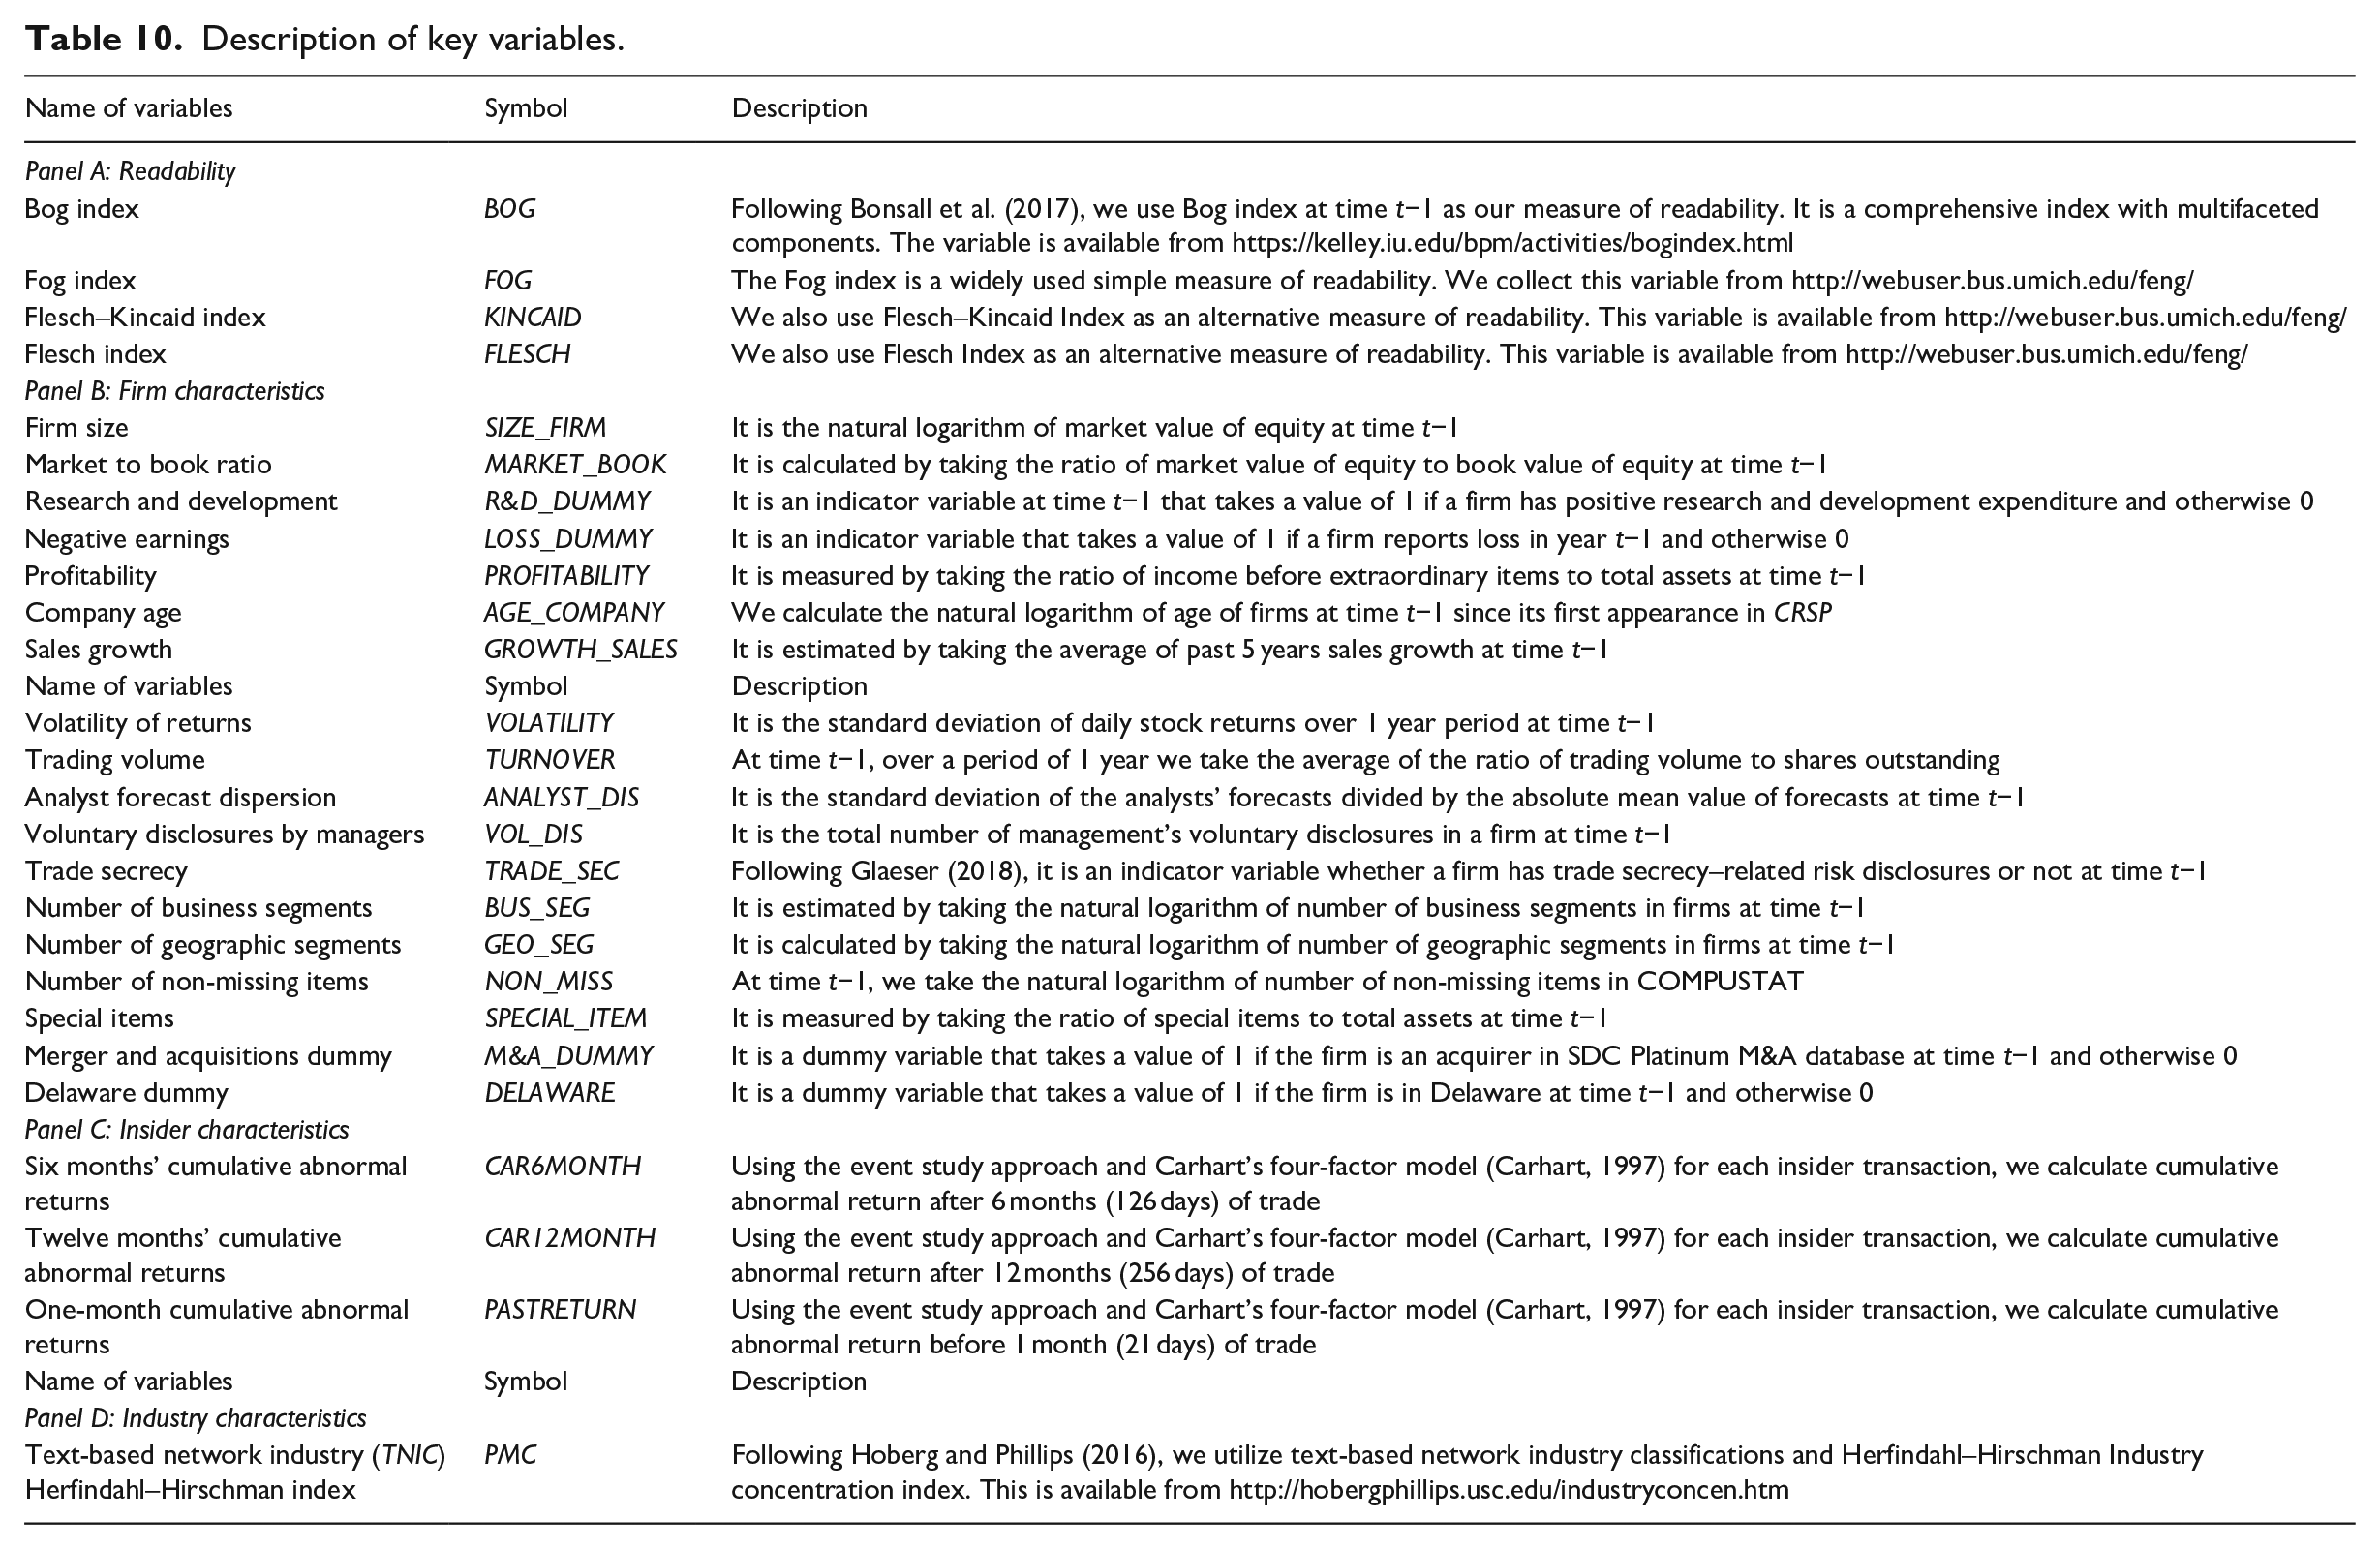
| Name of variables | Symbol | Description |
|---|---|---|
| Panel A: Readability | ||
| Bog index | BOG | Following Bonsall et al. (2017), we use Bog index at time t−1 as our measure of readability. It is a comprehensive index with multifaceted components. The variable is available from https://kelley.iu.edu/bpm/activities/bogindex.html |
| Fog index | FOG | The Fog index is a widely used simple measure of readability. We collect this variable from http://webuser.bus.umich.edu/feng/ |
| Flesch–Kincaid index | KINCAID | We also use Flesch–Kincaid Index as an alternative measure of readability. This variable is available from http://webuser.bus.umich.edu/feng/ |
| Flesch index | FLESCH | We also use Flesch Index as an alternative measure of readability. This variable is available from http://webuser.bus.umich.edu/feng/ |
| Panel B: Firm characteristics | ||
| Firm size | SIZE_FIRM | It is the natural logarithm of market value of equity at time t−1 |
| Market to book ratio | MARKET_BOOK | It is calculated by taking the ratio of market value of equity to book value of equity at time t−1 |
| Research and development | R&D_DUMMY | It is an indicator variable at time t−1 that takes a value of 1 if a firm has positive research and development expenditure and otherwise 0 |
| Negative earnings | LOSS_DUMMY | It is an indicator variable that takes a value of 1 if a firm reports loss in year t−1 and otherwise 0 |
| Profitability | PROFITABILITY | It is measured by taking the ratio of income before extraordinary items to total assets at time t−1 |
| Company age | AGE_COMPANY | We calculate the natural logarithm of age of firms at time t−1 since its first appearance in CRSP |
| Sales growth | GROWTH_SALES | It is estimated by taking the average of past 5 years sales growth at time t−1 |
| Name of variables | Symbol | Description |
| Volatility of returns | VOLATILITY | It is the standard deviation of daily stock returns over 1 year period at time t−1 |
| Trading volume | TURNOVER | At time t−1, over a period of 1 year we take the average of the ratio of trading volume to shares outstanding |
| Analyst forecast dispersion | ANALYST_DIS | It is the standard deviation of the analysts’ forecasts divided by the absolute mean value of forecasts at time t−1 |
| Voluntary disclosures by managers | VOL_DIS | It is the total number of management’s voluntary disclosures in a firm at time t−1 |
| Trade secrecy | TRADE_SEC | Following Glaeser (2018), it is an indicator variable whether a firm has trade secrecy–related risk disclosures or not at time t−1 |
| Number of business segments | BUS_SEG | It is estimated by taking the natural logarithm of number of business segments in firms at time t−1 |
| Number of geographic segments | GEO_SEG | It is calculated by taking the natural logarithm of number of geographic segments in firms at time t−1 |
| Number of non-missing items | NON_MISS | At time t−1, we take the natural logarithm of number of non-missing items in COMPUSTAT |
| Special items | SPECIAL_ITEM | It is measured by taking the ratio of special items to total assets at time t−1 |
| Merger and acquisitions dummy | M&A_DUMMY | It is a dummy variable that takes a value of 1 if the firm is an acquirer in SDC Platinum M&A database at time t−1 and otherwise 0 |
| Delaware dummy | DELAWARE | It is a dummy variable that takes a value of 1 if the firm is in Delaware at time t−1 and otherwise 0 |
| Panel C: Insider characteristics | ||
| Six months’ cumulative abnormal returns | CAR6MONTH | Using the event study approach and Carhart’s four-factor model (Carhart, 1997) for each insider transaction, we calculate cumulative abnormal return after 6 months (126 days) of trade |
| Twelve months’ cumulative abnormal returns | CAR12MONTH | Using the event study approach and Carhart’s four-factor model (Carhart, 1997) for each insider transaction, we calculate cumulative abnormal return after 12 months (256 days) of trade |
| One-month cumulative abnormal returns | PASTRETURN | Using the event study approach and Carhart’s four-factor model (Carhart, 1997) for each insider transaction, we calculate cumulative abnormal return before 1 month (21 days) of trade |
| Name of variables | Symbol | Description |
| Panel D: Industry characteristics | ||
| Text-based network industry (TNIC) Herfindahl–Hirschman index | PMC | Following Hoberg and Phillips (2016), we utilize text-based network industry classifications and Herfindahl–Hirschman Industry concentration index. This is available from http://hobergphillips.usc.edu/industryconcen.htm |
Acknowledgements
Thanks to Dr Kohinur Akter for the support.
Final transcript accepted 28 April 2021 by Millicent Chang (AE, Finance).
Funding
The author(s) disclosed receipt of the following financial support for the research, authorship, and/or publication of this article: This research was also supported by UQ Business School, The University of Queensland. The usual disclaimer applies.