






Abstract
This study aims to explore whether risk-taking in working capital management can explain the cash conversion cycle (CCC) anomaly documented in recent literature. By examining a dataset comprising non-financial US firms spanning from 1986 to 2022, this study finds that firms with lower CCC not only exhibit a higher level of operational risk, but they also allocate more resources towards capital expenditures during the CCC anomaly period. These findings suggest that the significantly positive abnormal returns of firms with low CCC in the CCC anomaly can be attributed to the undertaking of higher operational risk. Further analysis on the components of CCC is consistent with firms managing their inventory and accounts payable day policies to expose them to higher operational risk.
Keywords
1. Introduction
Recent empirical evidence has drawn attention to the interesting phenomenon of the cash conversion cycle (CCC) anomaly in US firms. This anomaly, as documented in studies by Wang (2019) and Lin and Lin (2021), reveals a connection between a firm’s CCC and its future stock returns. Firms with low CCC are documented to yield higher-than-average stock returns, while those with high CCC exhibit the opposite trend. The effect of CCC on abnormal stock returns persists up to 3 years after the CCC portfolio construction. Wang (2019) reports that an arbitrage trading strategy of taking a long position in firms within the lowest CCC decile and short-selling those in the highest CCC decile results in an annual abnormal stock return of 5% to 7%, which is robust to various risk-factor models and different measures of CCC. Interestingly, the CCC anomaly is not confined to the US markets alone, but it is also present in segmented international markets, albeit at a more moderate level (Chen et al., 2022). 1
To explain the source of the CCC anomaly, Wang (2019) and Chen et al. (2022) examine the funding risk and the mispricing hypotheses and find that their results are more consistent with the mispricing hypothesis, suggesting that investors may not fully grasp the implications of CCC on a company’s future earnings and are, therefore, taken by surprise when firms with low (high) CCC demonstrate higher (lower) earnings than expected. They draw this conclusion based on their empirical evidence that low (high) CCC firms have positive (negative) abnormal returns on the firms’ earnings announcements. Both studies also report that the stock mispricing tends to occur more prominently in stocks with higher limitations to arbitrage.
Wang’s (2019) and Chen et al.’s (2022) argument that the mispricing hypothesis is the root cause of the CCC anomaly appears to challenge the efficient market hypothesis, which presupposes that all relevant information is already priced into the market. This is particularly noteworthy given ample evidence in the literature, going back at least since 1996 (see, among others, Berg et al., 2024; Deloof, 2003; Jose et al., 1996; Shin and Soenen, 1998; Zeidan and Shapir, 2017) that a shorter (longer) CCC has consistently been linked to higher (lower) firm profitability and stock returns. Therefore, the premise that stock investors are not aware of the effect of CCC on a firm’s earnings giving rise to the CCC anomaly is debatable. Up to date, however, there has been no other study providing a different reason for the CCC anomaly. Therefore, this study attempts to present an alternative explanation to the anomaly.
This study posits that the CCC anomaly aligns with risk-taking in working capital management. Less investment in working capital can lead to lost sales, diminished customer retention, and missed trade discounts from suppliers. These factors can adversely affect a firm’s operational profitability, thereby elevating its operational risk. Therefore, it is plausible that firms that reduce their working capital are likely to take on higher operational risk. 2 Risk-taking in various corporate events or corporate activities has also been linked to higher firm stock returns (e.g. Cao and Wei, 2005; Chen and Ma, 2011; Cohen et al., 2012; Massa and Patgiri, 2009; Yim, 2013). Consequently, according to the risk-taking hypothesis, the CCC anomaly may arise from the fact that low-CCC firms embrace higher operational risk through their working capital strategies that eventually reflected in higher stock returns. This hypothesis, if validated, raises another empirical question: How or what mechanisms these firms use to take on higher operational risk? Until now, however, there is currently no study that has formally examined the link between CCC and operational risk-taking, let alone the mechanisms that underlie this risk-taking behaviour. This study aims to address these gaps in the literature.
By analysing a dataset of non-financial US firms from 1986 to 2022, this study begins by examining the relationship between CCC and firm operational risk measured as the standard deviation of earnings before interest and depreciation and amortisation expenses or EBITDA (John et al., 2008). The test results reveal a negative relation between CCC and this risk-taking indicator, suggesting that low-CCC firms exhibit higher operational risk during the CCC anomaly period. A closer examination on the components of CCC (inventory days, accounts receivable days, and accounts payable days) suggests that firms utilise a combination of inventory and accounts payable day policies to facilitate higher risk-taking (Kieschnick et al., 2013; Wu et al., 2019). This study then investigates how adopting a low-CCC policy relates to higher operational risk. In addressing this question, this study examines the relation between CCC and several proxies for the mechanisms for risk-taking such as cumulative capital expenditures (capex) and research and development (R&D) expenses (Coles et al., 2006; Guay, 1999; Khieu and Pyles, 2016; Ryan and Wiggins, 2002). The results show that CCC and its policy components have significantly negative relationships with investments in fixed assets.
In summary, the findings of this study suggest that firms with low CCC exhibit higher levels of risk-taking, as evidenced by their substantial investment in capital expenditures. Given that prior research has consistently linked greater risk-taking with higher stock returns, these findings offer a plausible explanation to the CCC anomaly: firms with low (high) CCC achieve higher (lower) abnormal returns because they assume more (less) operational risk. The findings of this study also offer two valuable contributions to the literature and practical implications for both stock investors and firm managers. First, this study demonstrates that low-CCC firms exhibit significantly higher operational risks during the CCC anomaly period. This finding suggests that the positive and significant abnormal stock returns of low-CCC firms, as documented in the CCC anomaly, can be attributed to the greater operational risks undertaken in managing the firms’ working capital. This finding is valuable for investors seeking to capitalise on the CCC anomaly, as it highlights the underlying risk dynamics associated with such firms. Second, this study provides empirical evidence that working capital policies play a critical role in influencing a company’s operational risk. The results suggest that firm managers can strategically benefit from managing their working capital policies to take on higher operational risk, redirecting the cash saved into long-term investments that enhance firm value. This approach underscores the potential for aligning operational efficiency with long-term strategic growth.
The remainder of this study is structured as follows. Section 2 discusses the literature leading to the development of the risk-taking hypotheses. Section 3 provides the methodology and the description of the sample. Section 4 provides the empirical results, and Section 5 concludes this article.
2. Theoretical underpinning and hypothesis
The CCC of a company is the company’s working capital policy that represents the number of days it takes for external financing or internal cash utilisation for its operational needs (Berk and DeMarzo, 2017; Leach and Melicher, 2017). CCC consists of inventory days, accounts receivable days and accounts payable days, and together they constitute the working capital policy of a company. Firms with longer CCC necessitate greater investments in working capital. While allocating more resources to working capital can help secure sales, it doesn’t necessarily indicate prudent working capital management. For instance, the literature documents that the incremental value of cash invested in net operational working capital is reported to be lower than when held in a cash account, and that excessive investment in working capital is linked to reduced firm value (Aktas et al., 2015; Kieschnick et al., 2013). 3 As CCC is the sum of inventory days and account receivable days minus accounts payable days, a firm can reduce its CCC by managing the components of the working capital policy, either by diminishing inventory and/or accounts receivables days, extending accounts payable days, or implementing a combination of these working capital strategies. 4
The effect of reducing working capital on a firm’s operational risk is mixed. While it can enhance a firm’s liquidity and better cost management (Berg et al., 2024; Richards and Laughlin, 1980) suggesting lower operational risk, it can also increase a firm’s operational risk (Deloof, 2003). For example, reducing inventory days can lead to stock-outs that can negatively impact sales and shortening accounts receivable days might mean offering less favourable terms or no trade credit to customers with lower credit ratings. These credit policies can potentially lead to customer loss. Similarly, extending accounts payable days may involve forgoing supplier-offered trade discounts, which can be costly, or, if payments are consistently deferred beyond the trade terms, the firm may lose trade credits from its suppliers.
Nevertheless, a lower CCC means less cash tied up in working capital. Firms can redirect the freed-up cash flows from reduced inventory and/or accounts receivable days and/or extended accounts payable days towards positive net present value projects. Previous studies suggest that firms may reduce their working capital to internally fund long-term investments. For example, Fazzari and Petersen (1993) find that firms in need of cash for capital expenditures can internally fund these expenses by reducing their investment in working capital (defined as current assets minus current liabilities), and Bates et al. (2009) document that firms prefer to internally finance their R&D expenses by reducing net working capital rather than seeking external capital. This preference arises because R&D investment opportunities typically involve lower asset tangibility, making external financing relatively costlier compared to internally generated financing sourced from reduced working capital. Since investments in capital expenditures and R&D are generally expected to enhance firm value, this finding helps explain why a low CCC is associated with higher firm profitability and increased firm value (Jalal and Khaksari, 2020; Shin and Soenen, 1998). Nonetheless, investments in capital expenditures and R&D also come with added risk, thus being considered as risk-taking mechanisms. 5
Given that reduced investment in working capital may lead to either lower or greater operational risk of a firm, and considering that capital expenditures and R&D expenses are often viewed as proxies for risk-taking mechanisms (Coles et al., 2006; Guay, 1999; Ryan and Wiggins, 2002), the higher or lower operational risk taken by firms is likely to manifest in the firms’ operational volatilities (John et al., 2008), as well as investments in capital expenditures and R&D expenses during the CCC anomaly period, which is up to 3 years after the CCC construction. Therefore, this study postulates the following hypotheses:
H1. CCC affects a firm’s operational risk during the CCC anomaly period.
H2. CCC is related to a firm’s risk-taking mechanisms during the CCC anomaly period.
3. Research design
3.1. Methodology
Wang (2019) documents that CCC can effectively predict abnormal stock returns for a period of up to 3 years following a CCC portfolio construction, indicating that firm risk-taking may occur during this period. Unlike prior studies that use stock return volatility as a proxy for risk-taking (Aktas et al., 2015), this study focuses on operational risk measured by the standard deviation of EBITDA from year t + 1 to t + 3. This is because stock return volatility may capture market-wide influences such as macroeconomic shocks and speculative behaviour (Ang et al., 2006; Schwert, 1989) which differ from firm-specific operational risk. It is also worth noting that CCC is known to exhibit variations across different industries (Berk and DeMarzo, 2017; Hawawini et al., 1996; Wang, 2019). Therefore, this study employs the following panel data regression model controlling for industry and year effects:

where Risk-Taking is the standard deviation of EBITDA (STDEBITDA). Following prior studies (Berg et al., 2024; Berk and DeMarzo, 2017; Deloof, 2003; Jose et al., 1996; Raddatz, 2006; Shin and Soenen, 1998; Tong and Wei, 2011), CCC is measured as inventories × 365/cost of goods sold + account receivables × 365/sales − account payables × 365/cost of goods sold. Thus, CCC is inventory days (INVDAYS) plus accounts receivable days (ARDAYS) minus accounts payable days (APDAYS). The variables used as control in the regression model are the natural logarithm of market capital (SIZE), market-to-book ratio (MTB), change in sales scaled by sales at t − 1 (ΔSALES), debt-to-equity ratio (LEVERAGE), return on assets (ROA), capital expenditures (CAPEX), fixed assets scaled by total assets (TANG), operating cash flows scaled by total assets (CASHFLOW), and the natural logarithm of 1 + the number of firm years from the date of incorporation (FIRMAGE). Standard errors are clustered at the firm level.
To assess the mechanism used for implementing corporate risk-taking, this study conducts the following regression analysis:

Proxies for Risk-Taking Mechanism are the sum of capital expenditures (CUMCAPEX) and the sum of R&D expenses (CUMRND) scaled by total assets, from years t + 1 to t + 3.
3.2. Data
Data for this study are obtained from the Refinitiv Workspace database. All firms falling under the financial industry category (SIC codes 6000-6999) are excluded from the sample. To ensure the accurate measurement of the CCC, it was essential for this study to have complete data for all components of CCC. Consequently, observations with missing component(s) were excluded from the analysis. The database provides access to the necessary variables for the analysis, spanning from 1986 to 2022. To mitigate the influence of outliers, all variables are winsorised at the 1st and 99th percentiles.
Table 1 presents the descriptive statistics for the variables used in the analysis. On average, firms require 67 days of short-term financing for their day-to-day operations. This figure exceeds the 42-day average reported by Wang (2019), likely due to the impact of the COVID-19 pandemic. The mean values for inventory days, accounts receivable days, and accounts payable days are 84, 61, and 86 days, respectively. The number of accounts payable days suggests that, on average, firms in the sample do not settle their trade debts within 30 days, but only around 25% of the sample (near the 25th percentile) take advantage of trade discounts offered by their suppliers. Cumulative capital expenditures and R&D expenses, on average, represent 17% and 30% of total assets, respectively.
Descriptive statistics.
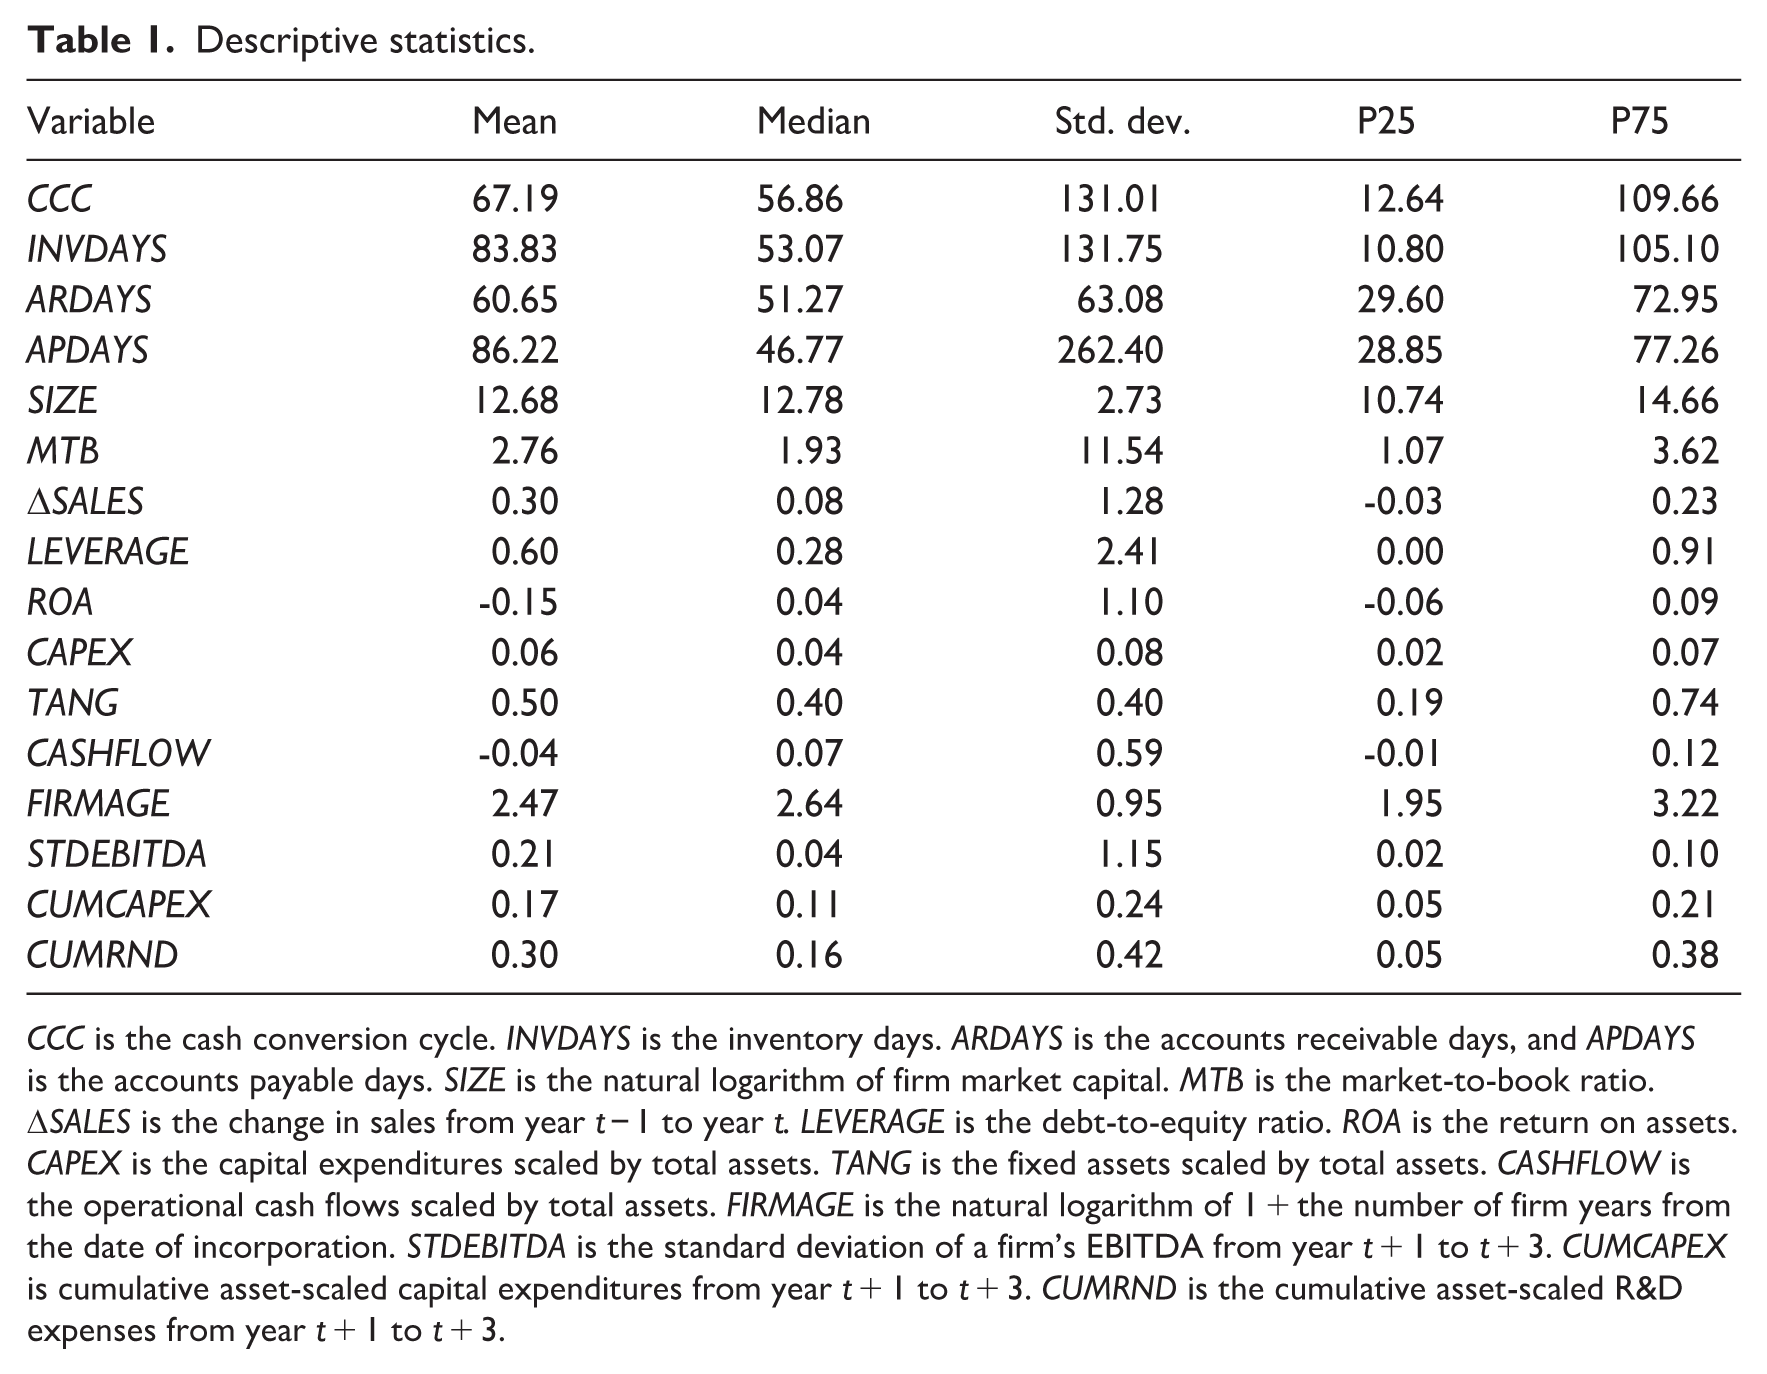
CCC is the cash conversion cycle. INVDAYS is the inventory days. ARDAYS is the accounts receivable days, and APDAYS is the accounts payable days. SIZE is the natural logarithm of firm market capital. MTB is the market-to-book ratio. ΔSALES is the change in sales from year t − 1 to year t. LEVERAGE is the debt-to-equity ratio. ROA is the return on assets. CAPEX is the capital expenditures scaled by total assets. TANG is the fixed assets scaled by total assets. CASHFLOW is the operational cash flows scaled by total assets. FIRMAGE is the natural logarithm of 1 + the number of firm years from the date of incorporation. STDEBITDA is the standard deviation of a firm’s EBITDA from year t + 1 to t + 3. CUMCAPEX is cumulative asset-scaled capital expenditures from year t + 1 to t + 3. CUMRND is the cumulative asset-scaled R&D expenses from year t + 1 to t + 3.
Table 2 provides an overview of the correlations between the variables employed in the analysis. These correlations shed light on the relationships between CCC and its components. Notably, CCC is found to be primarily correlated with inventory day policy, followed by cash collection policy, and, to a lesser degree, accounts payable day policy. The negative correlation observed between CCC and the proxy for operational risk (STDEBITDA) aligns with the notion that a shorter CCC is linked to increased risk-taking. The control variables exhibit relatively low correlations among themselves, suggesting that multicollinearity is unlikely to be a concern in the regression analysis.
Correlations.
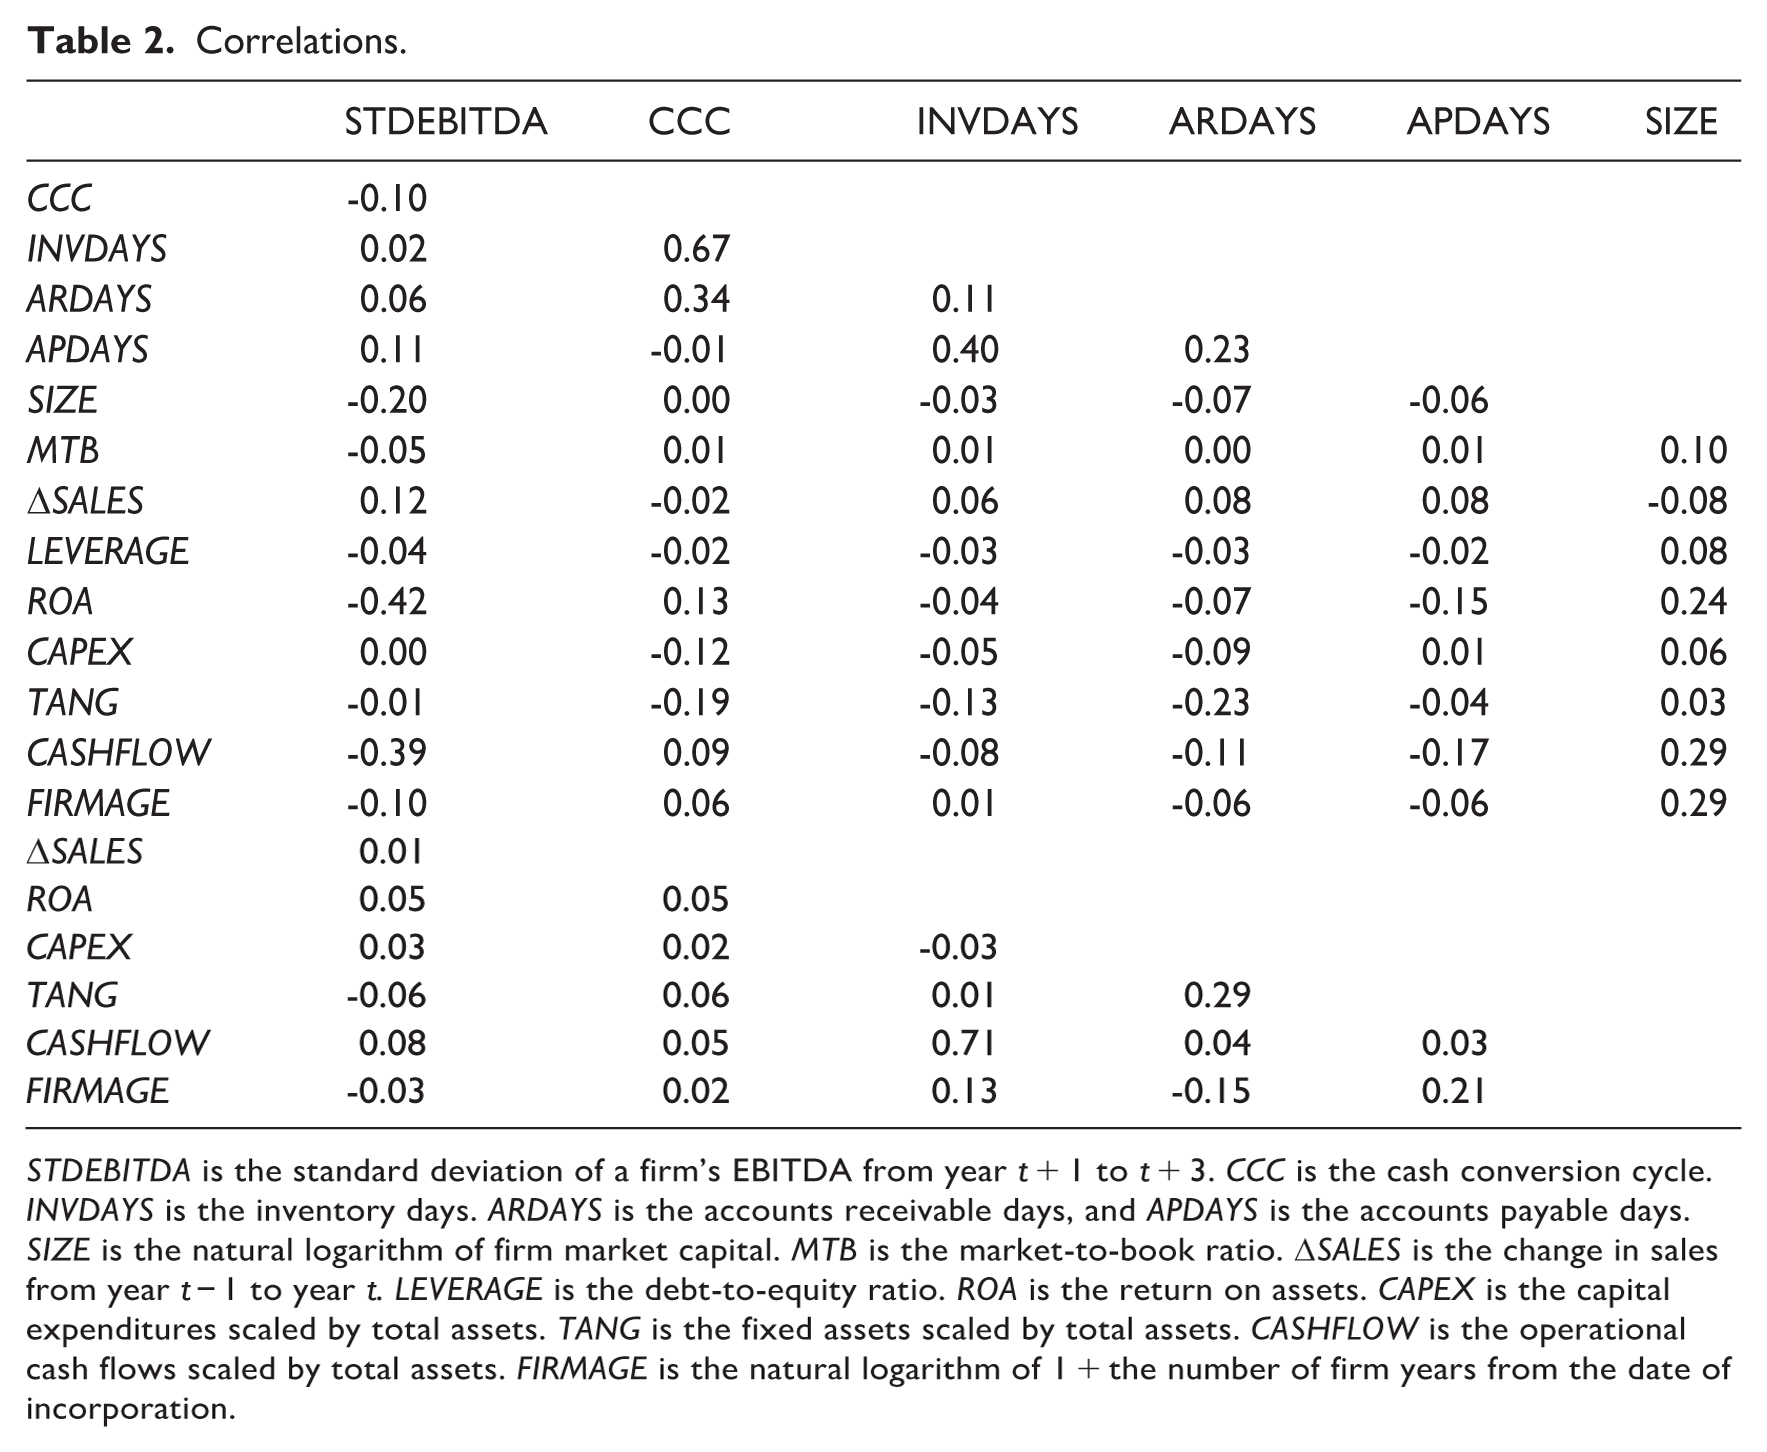
STDEBITDA is the standard deviation of a firm’s EBITDA from year t + 1 to t + 3. CCC is the cash conversion cycle. INVDAYS is the inventory days. ARDAYS is the accounts receivable days, and APDAYS is the accounts payable days. SIZE is the natural logarithm of firm market capital. MTB is the market-to-book ratio. ΔSALES is the change in sales from year t − 1 to year t. LEVERAGE is the debt-to-equity ratio. ROA is the return on assets. CAPEX is the capital expenditures scaled by total assets. TANG is the fixed assets scaled by total assets. CASHFLOW is the operational cash flows scaled by total assets. FIRMAGE is the natural logarithm of 1 + the number of firm years from the date of incorporation.
4. Empirical results
4.1. CCC and firm risk-taking
This subsection presents the empirical findings regarding the relationship between CCC and risk-taking, obtained by running Regression (1). The test results are reported in Table 3. In column 1, the coefficient on CCC concerning the operational risk (STDEBITDA) is negative and statistically significant at the 1% level. This result strongly supports the notion that a lower (higher) CCC is indicative of higher (lower) firm operational risk-taking, aligning with the risk-taking hypothesis. In other words, low-CCC firms are riskier than high-CCC firms. The higher 3-year future operational risk of low-CCC firms, according to the risk-taking hypothesis, explains the positive abnormal stock returns of low-CCC firms 3 years after the portfolio constructions as documented in the CCC anomaly (Wang, 2019). In addition, smaller firm size (SIZE) and operational cash flows (CASHFLOWS) are observed to be associated with heightened firm risk.
The relations between CCC and risk-taking.
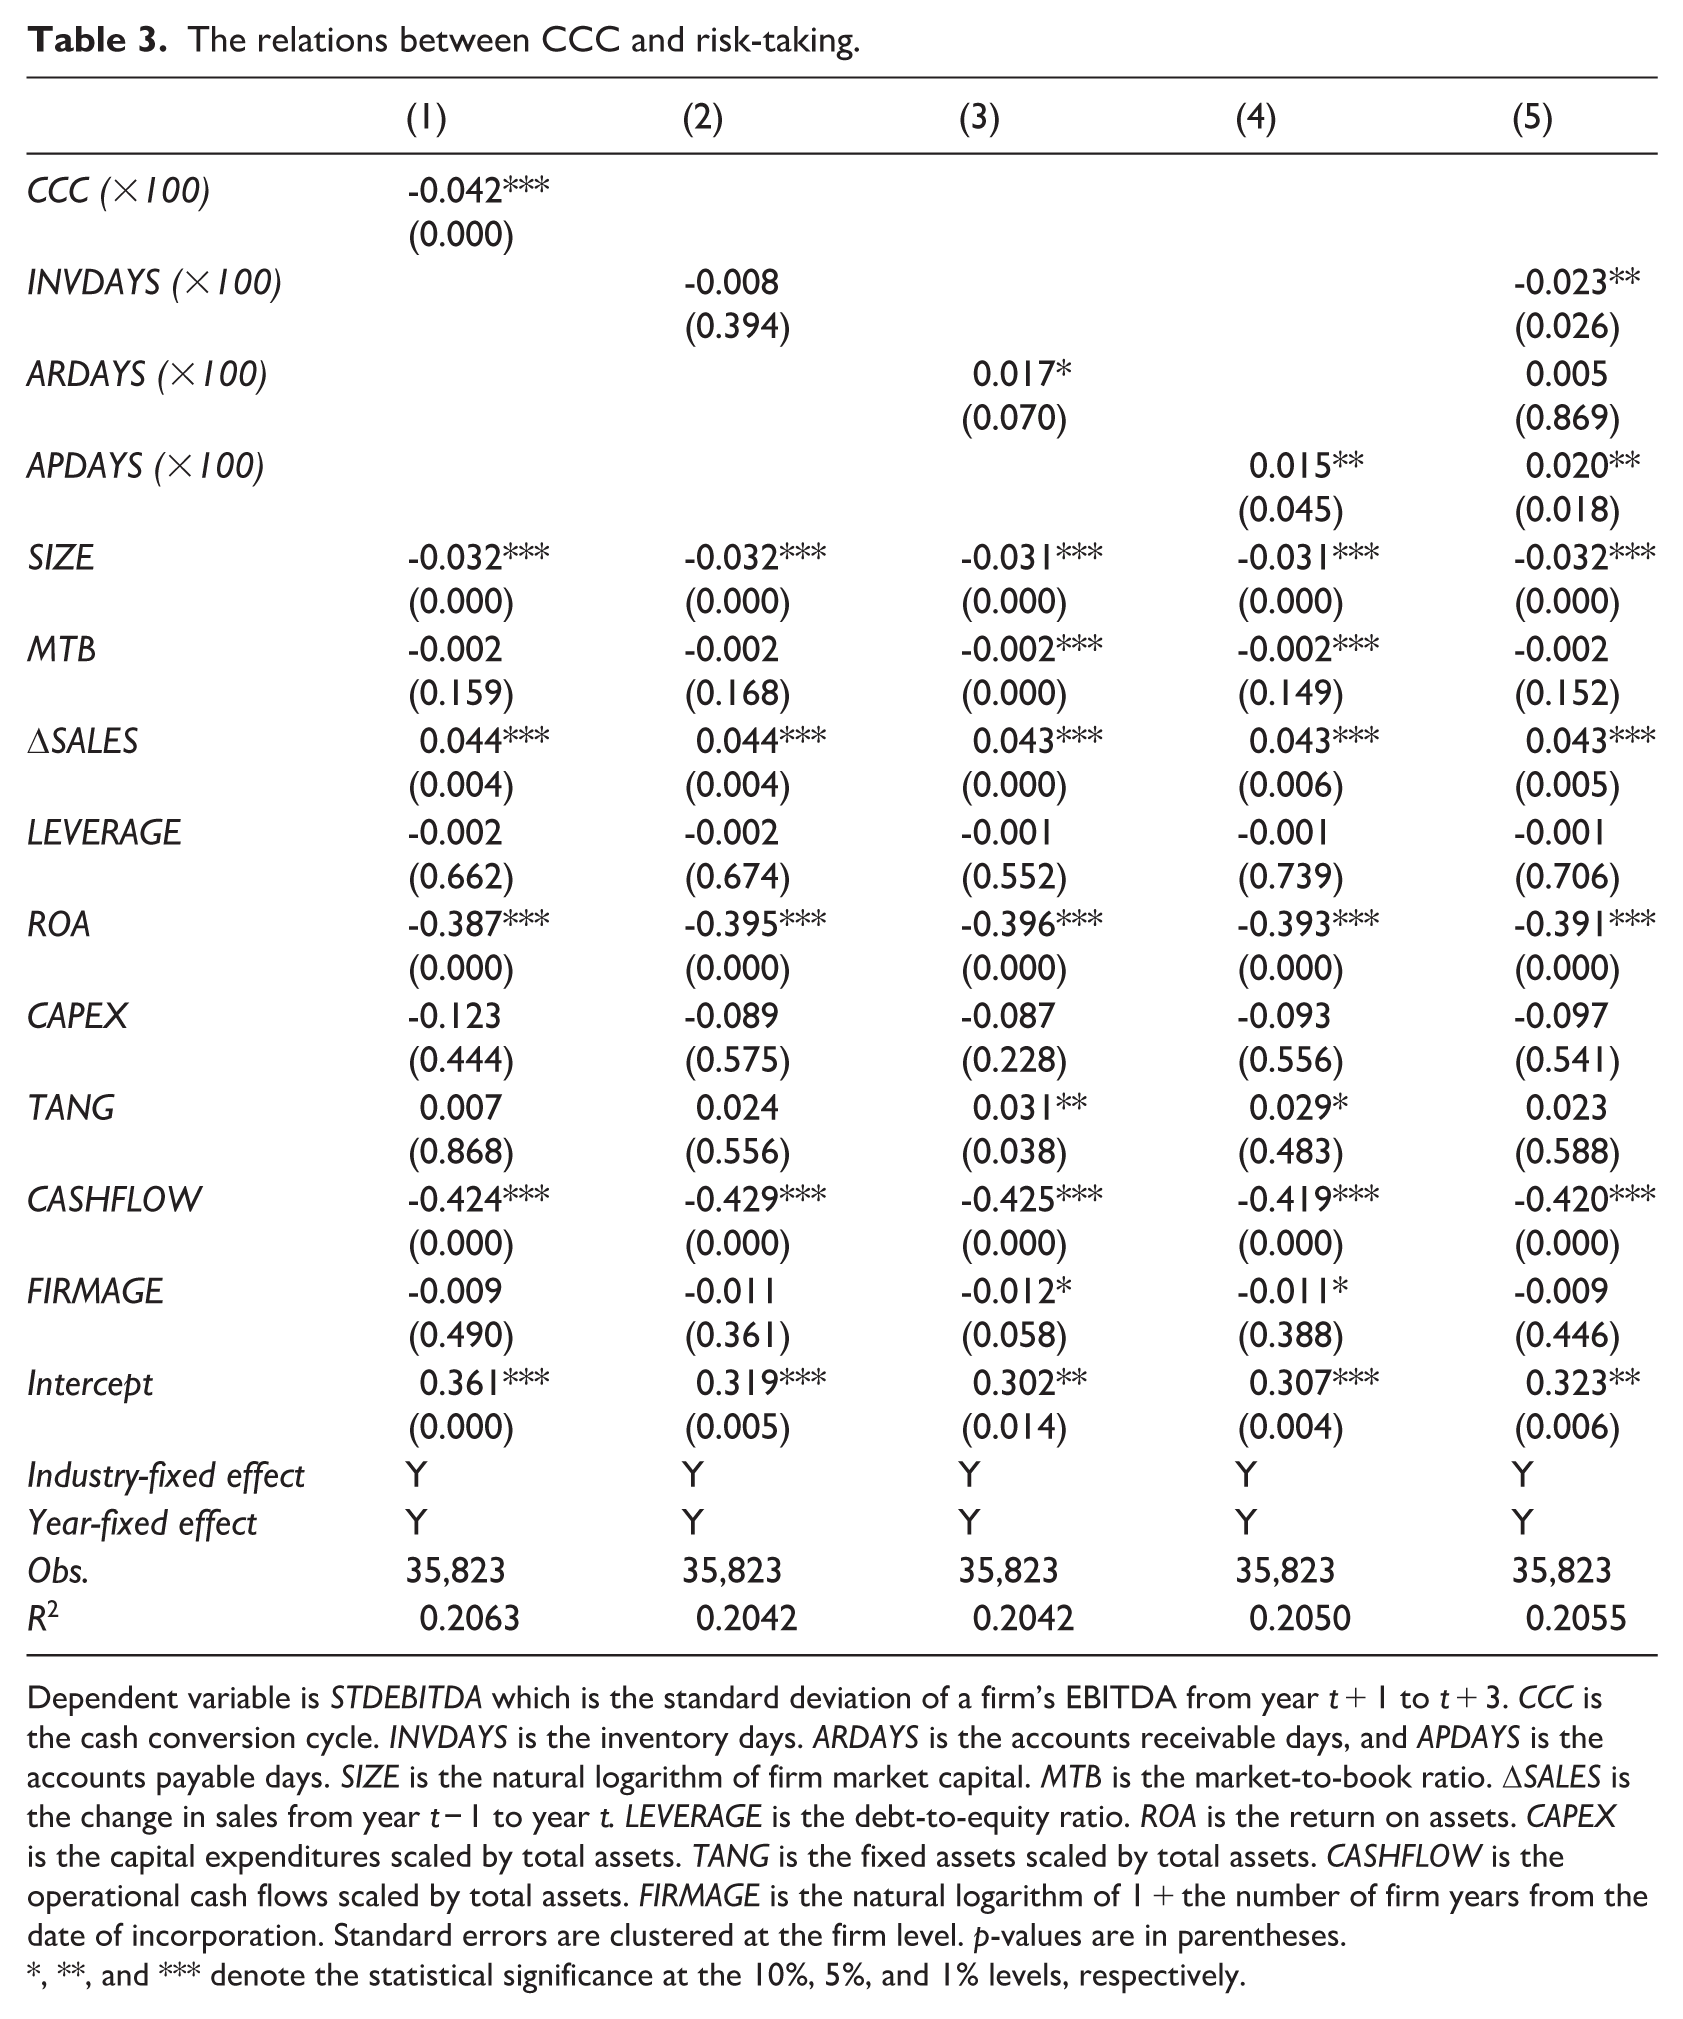
Dependent variable is STDEBITDA which is the standard deviation of a firm’s EBITDA from year t + 1 to t + 3. CCC is the cash conversion cycle. INVDAYS is the inventory days. ARDAYS is the accounts receivable days, and APDAYS is the accounts payable days. SIZE is the natural logarithm of firm market capital. MTB is the market-to-book ratio. ΔSALES is the change in sales from year t − 1 to year t. LEVERAGE is the debt-to-equity ratio. ROA is the return on assets. CAPEX is the capital expenditures scaled by total assets. TANG is the fixed assets scaled by total assets. CASHFLOW is the operational cash flows scaled by total assets. FIRMAGE is the natural logarithm of 1 + the number of firm years from the date of incorporation. Standard errors are clustered at the firm level. p-values are in parentheses.
, **, and *** denote the statistical significance at the 10%, 5%, and 1% levels, respectively.
CCC comprises three components: inventory days, accounts receivable days, and accounts payable days. Columns 2 to 5 in Table 3 present the results of the regression tests when CCC is disassembled into its parts. Columns 2 to 4 provide insights into the regressions of individual CCC components, separately analysed in relation to firm risk-taking. The result in column 2 shows that shorter (longer) inventory days, although not statistically significant, are negatively (positively) linked to risk-taking. However, when it comes to cash collection policy, it exhibits a weakly positive association with risk-taking (column 3). One possible explanation for this weakly positive association is that extending trade credit to customers with lower credit ratings could contribute to an increase in firm risk, and vice versa. Accounts payable day policy, ceteris paribus, positively contributes to firm risk-taking, as reported in column 4. This means deferring (or expediting) payments to suppliers increases (or decreases) risk. Prior research, however, suggests that working capital policies are interconnected and should not be effectively examined in isolation (Kieschnick et al., 2013; Kim and Chung, 1990; Sartoris and Hill, 1983; Schiff and Lieber, 1974). For instance, inventory management can be influenced by trade credit terms from suppliers, which are, in turn, affected by the cash collected from customers. Therefore, column 5 presents the results of the regression test where all three components of CCC are simultaneously included in the same regression. The findings consistently suggest that lower inventory and longer accounts payable day policies are associated with higher operational risk-taking.
4.2. CCC and the mechanism for risk-taking
Following the negative relationship between CCC and firm risk-taking, this section examines the mechanisms employed by low-CCC firms to take on more risk. Existing literature has established that capital expenditures and R&D expenses are used as the mechanisms for taking risk (Coles et al., 2006; Guay, 1999; Khieu and Pyles, 2016; Ryan and Wiggins, 2002). Thus, the first proxy for the risk-taking mechanism examined is cumulative capital expenditures, scaled by total asset, and the second proxy for the risk mechanism is cumulative R&D expenses scaled by total assets. Table 4 reports the results of the regression analyses pertaining to the relationships between CCC and the proxies for these risk-taking mechanisms. The coefficients on CCC in both cases are negative, suggesting that low-CCC firms tend to invest more in capital expenditures and/or R&D expenses. This result aligns with the notion that firms reduce their CCC to allocate resources towards fixed investments. Such investments are expected to enhance firm value and are, therefore, in line with the CCC anomaly.
Cash conversion cycle and the mechanism for risk-taking.
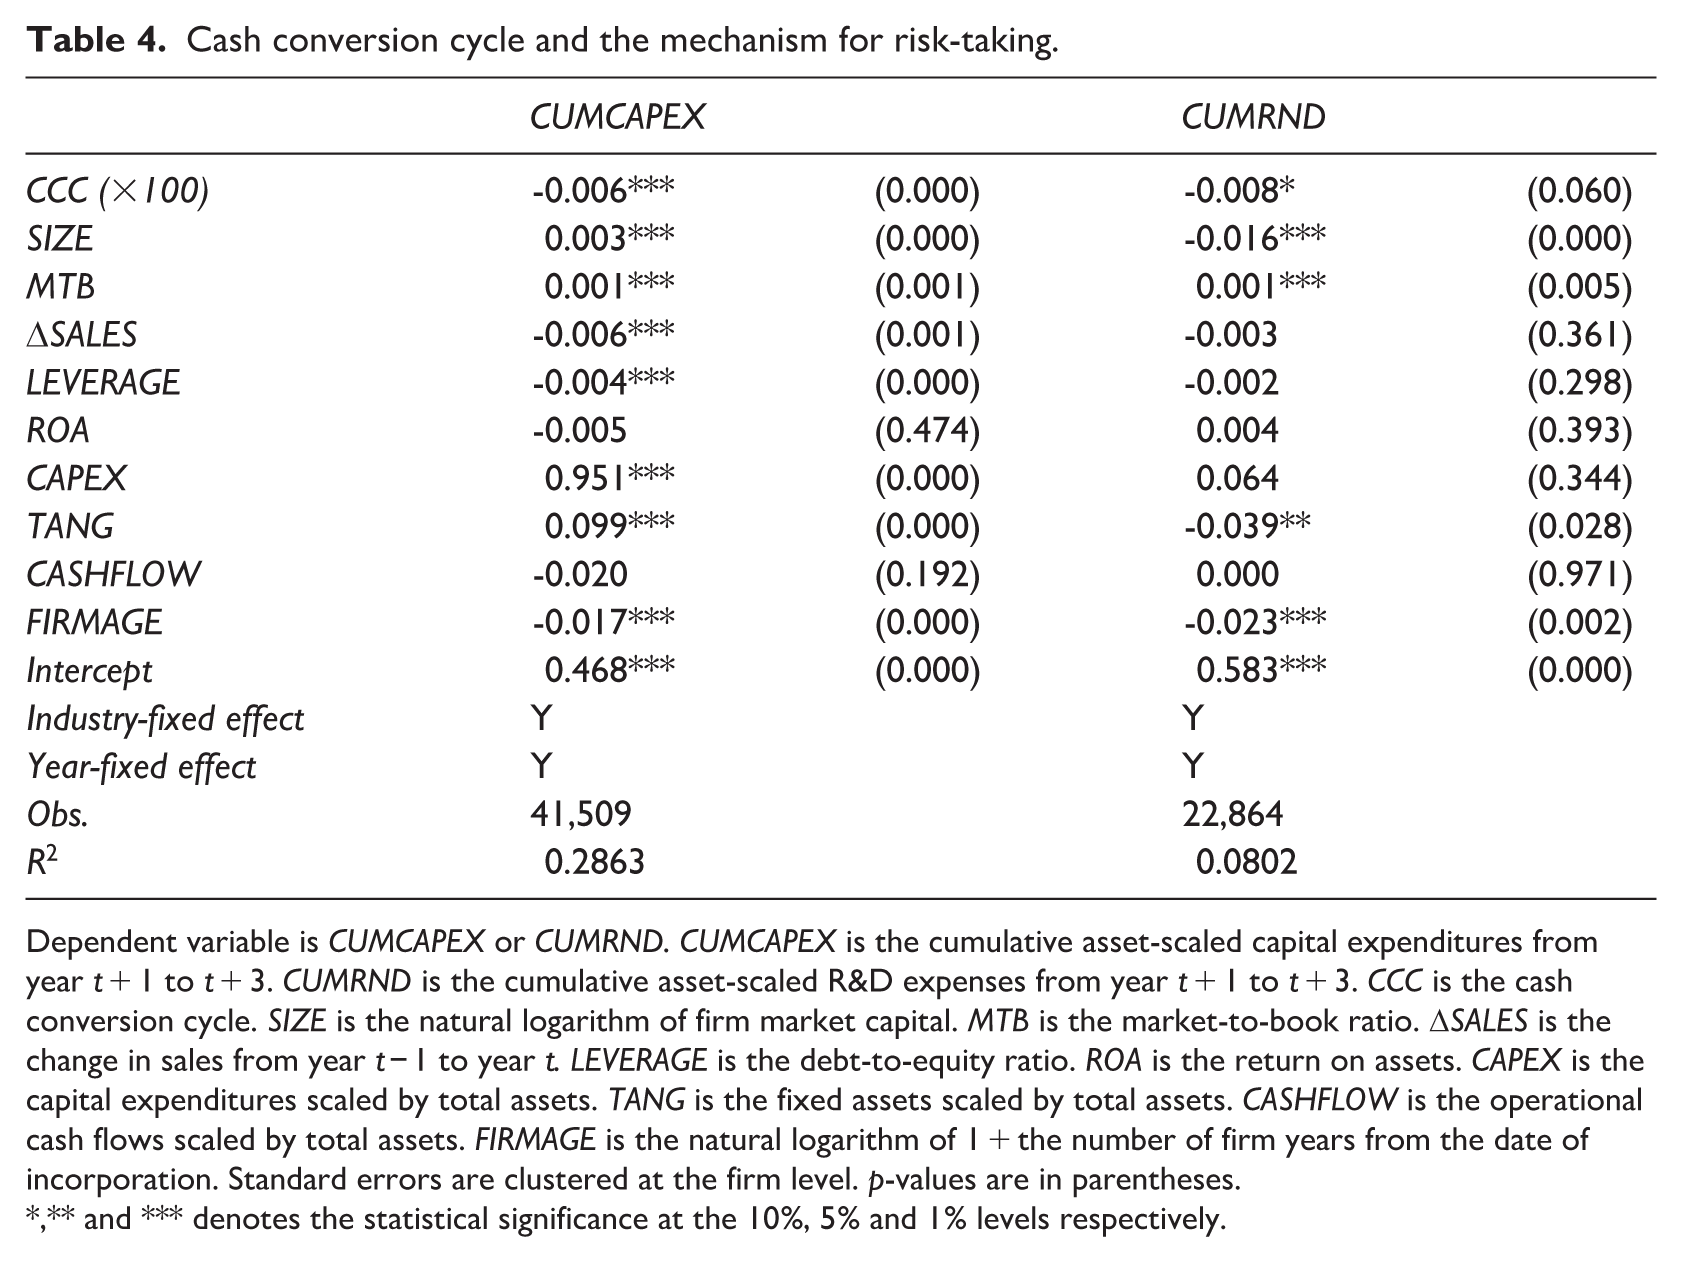
Dependent variable is CUMCAPEX or CUMRND. CUMCAPEX is the cumulative asset-scaled capital expenditures from year t + 1 to t + 3. CUMRND is the cumulative asset-scaled R&D expenses from year t + 1 to t + 3. CCC is the cash conversion cycle. SIZE is the natural logarithm of firm market capital. MTB is the market-to-book ratio. ΔSALES is the change in sales from year t − 1 to year t. LEVERAGE is the debt-to-equity ratio. ROA is the return on assets. CAPEX is the capital expenditures scaled by total assets. TANG is the fixed assets scaled by total assets. CASHFLOW is the operational cash flows scaled by total assets. FIRMAGE is the natural logarithm of 1 + the number of firm years from the date of incorporation. Standard errors are clustered at the firm level. p-values are in parentheses.
,** and *** denotes the statistical significance at the 10%, 5% and 1% levels respectively.
Panel A of Table 5 presents the results of the regression analyses where the components of CCC are regressed against the mechanisms of firm risk-taking. The results suggest that firms manage their working capital by reducing inventory and cash collection days and/or extending accounts payable days to allocate resources towards their fixed investments. These findings also align with the observed patterns in Table 3, reinforcing the notion that firms adjust their working capital policies to facilitate investments in long-term assets, resulting in raised risk exposure.
The components of cash conversion cycle and the mechanism for risk-taking.
Panel A.
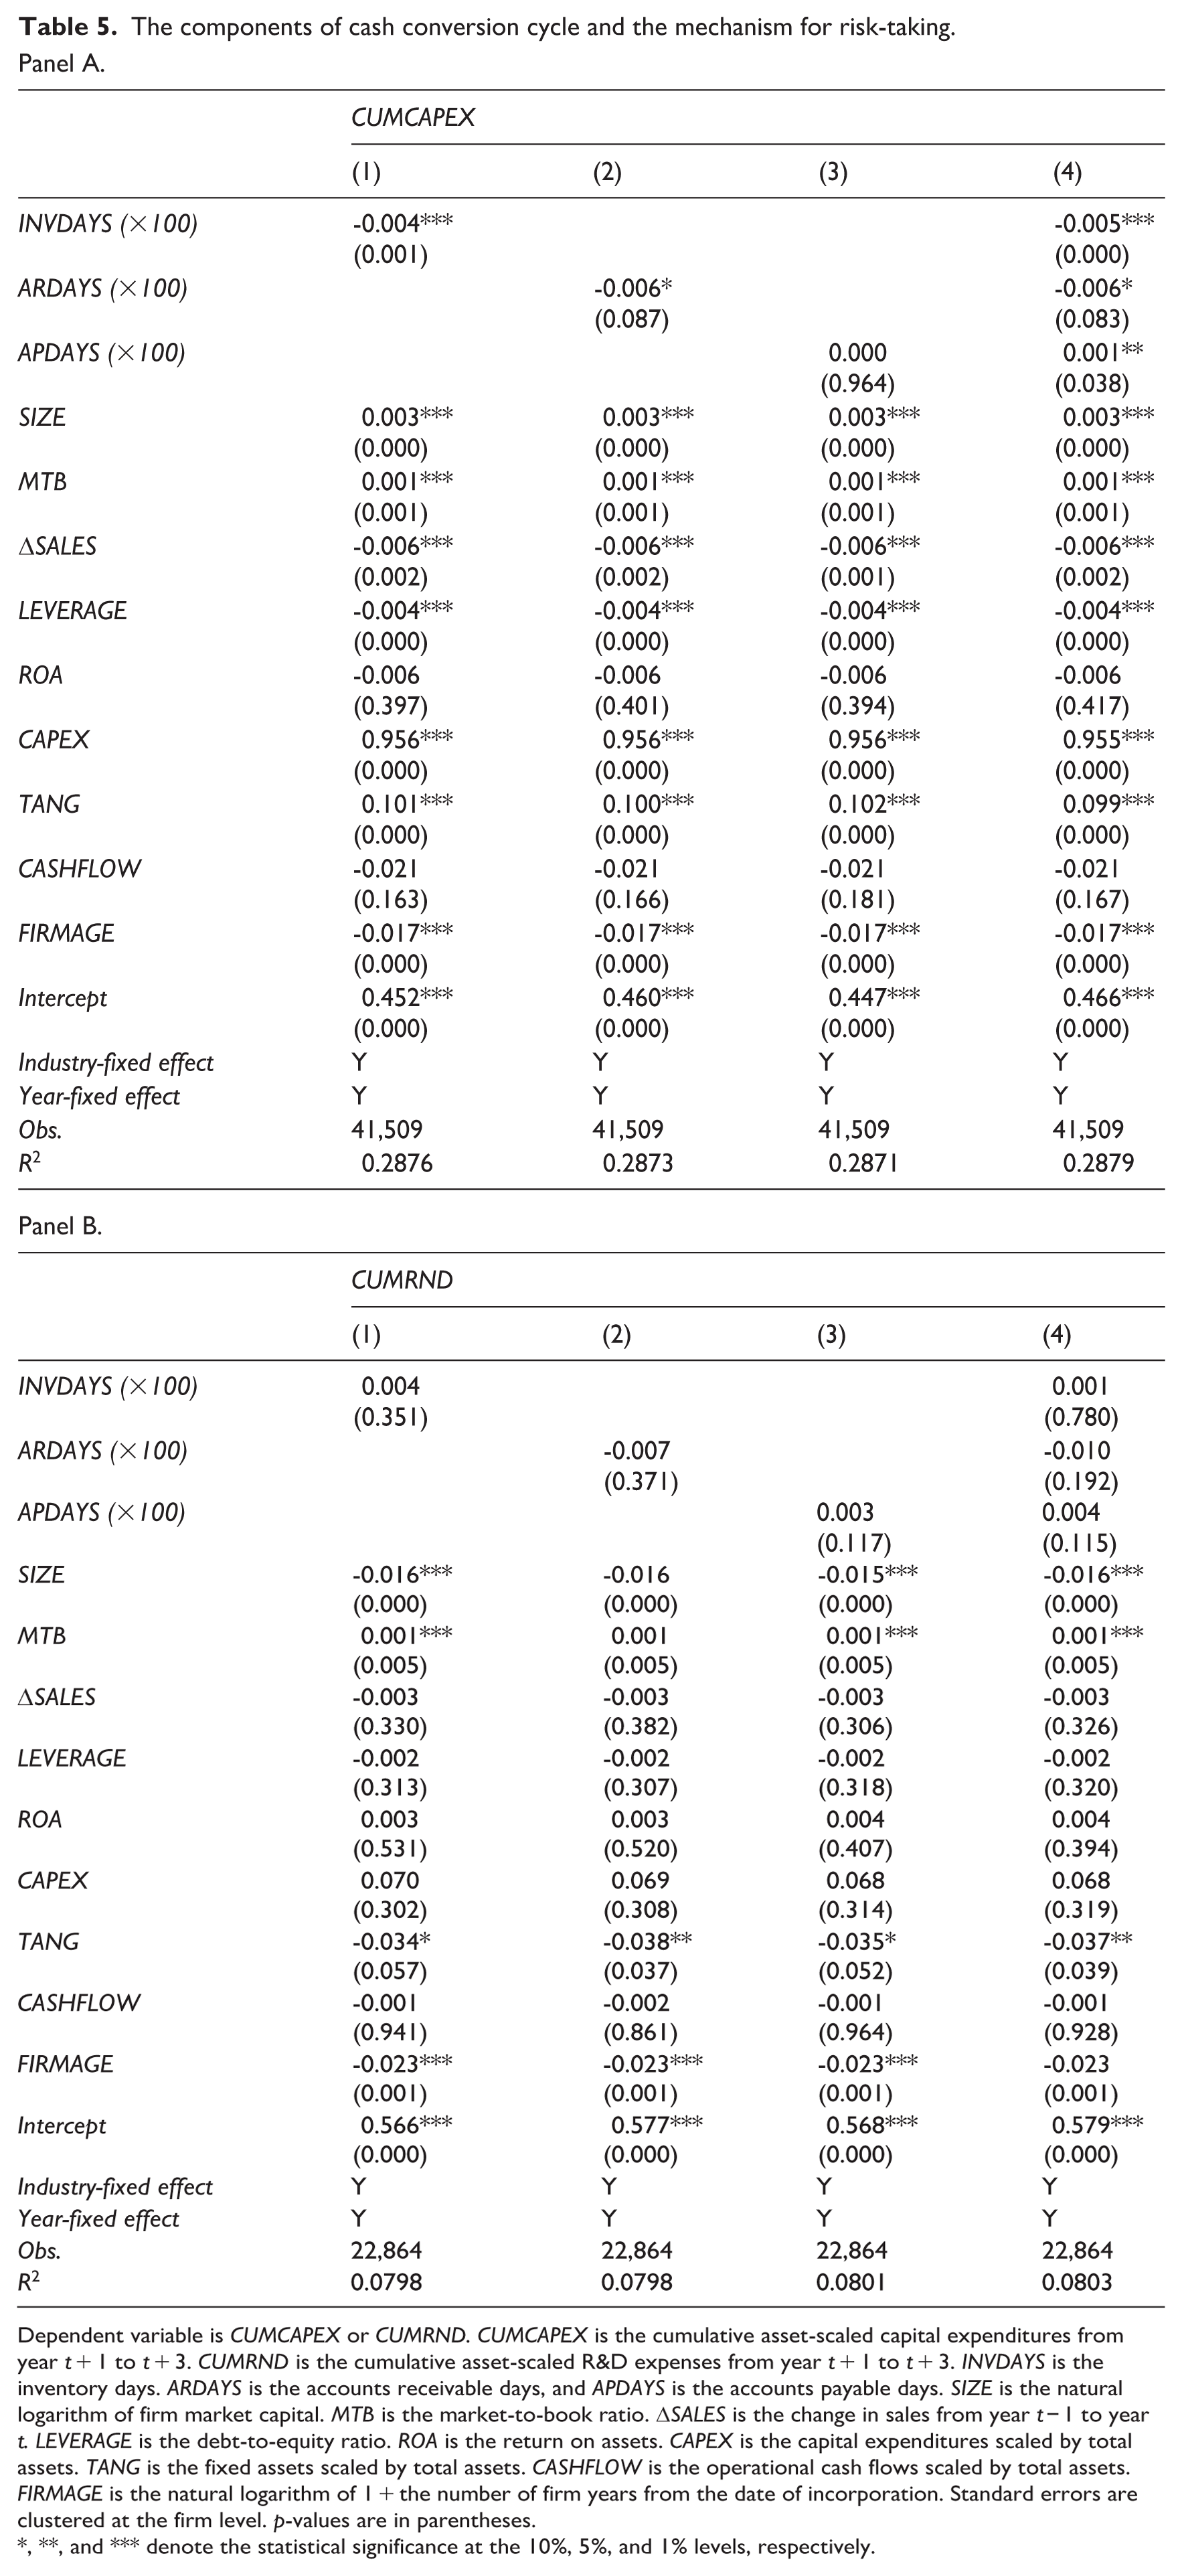
Dependent variable is CUMCAPEX or CUMRND. CUMCAPEX is the cumulative asset-scaled capital expenditures from year t + 1 to t + 3. CUMRND is the cumulative asset-scaled R&D expenses from year t + 1 to t + 3. INVDAYS is the inventory days. ARDAYS is the accounts receivable days, and APDAYS is the accounts payable days. SIZE is the natural logarithm of firm market capital. MTB is the market-to-book ratio. ΔSALES is the change in sales from year t − 1 to year t. LEVERAGE is the debt-to-equity ratio. ROA is the return on assets. CAPEX is the capital expenditures scaled by total assets. TANG is the fixed assets scaled by total assets. CASHFLOW is the operational cash flows scaled by total assets. FIRMAGE is the natural logarithm of 1 + the number of firm years from the date of incorporation. Standard errors are clustered at the firm level. p-values are in parentheses.
, **, and *** denote the statistical significance at the 10%, 5%, and 1% levels, respectively.
In Panel B, where cumulative R&D expenditure is used as the channel, the coefficients remain directionally consistent but are not statistically significant at conventional levels. This outcome reflects data limitations in R&D reporting, which is uneven across firms, includes many missing observations, and typically yields payoffs over longer horizons than the short-cycle window of our analysis. In addition, as documented in Bromiley et al. (2017), R&D is not always a reliable indicator of risk-taking. Overall, the results suggest that both capital expenditures and R&D may reflect mechanisms through which firms increase investment activities when CCC is shortened, but the evidence is stronger and more robust for capital expenditures, which appear to play a more immediate role in raising operational risk.
4.3. Robustness tests
To check the robustness of the results regarding the relationships between CCC and firm risk-taking, as well as the mechanisms for risk-taking, this study conducts several additional tests. The first test is to employ firm fixed-effects regressions, with the results reported in Tables 6 and 7. When firm fixed effects are included, the explanatory power of the model drops sharply (R2 within = 0.0231), indicating that little of the variation in CCC and operational risk is explained by within-firm changes over time. This reflects an econometric trade-off that, while fixed effects are useful for controlling for time-invariant heterogeneity, they also remove the between-firm variation that is central to our research question. Given that CCC does not fluctuate substantially within firms from year to year, most of the meaningful signal lies in cross-sectional differences across firms. Supporting this view, a between-effects specification yields statistically significant results with higher explanatory power (R2 = 0.3433), which is consistent with the baseline findings. Overall, the evidence suggests that differences in CCC across firms, rather than within-firm changes, are the main driver of the observed relationship between working capital management and operational risk-taking. 6
Fixed-effects regressions on cash conversion cycle and the risk-taking.
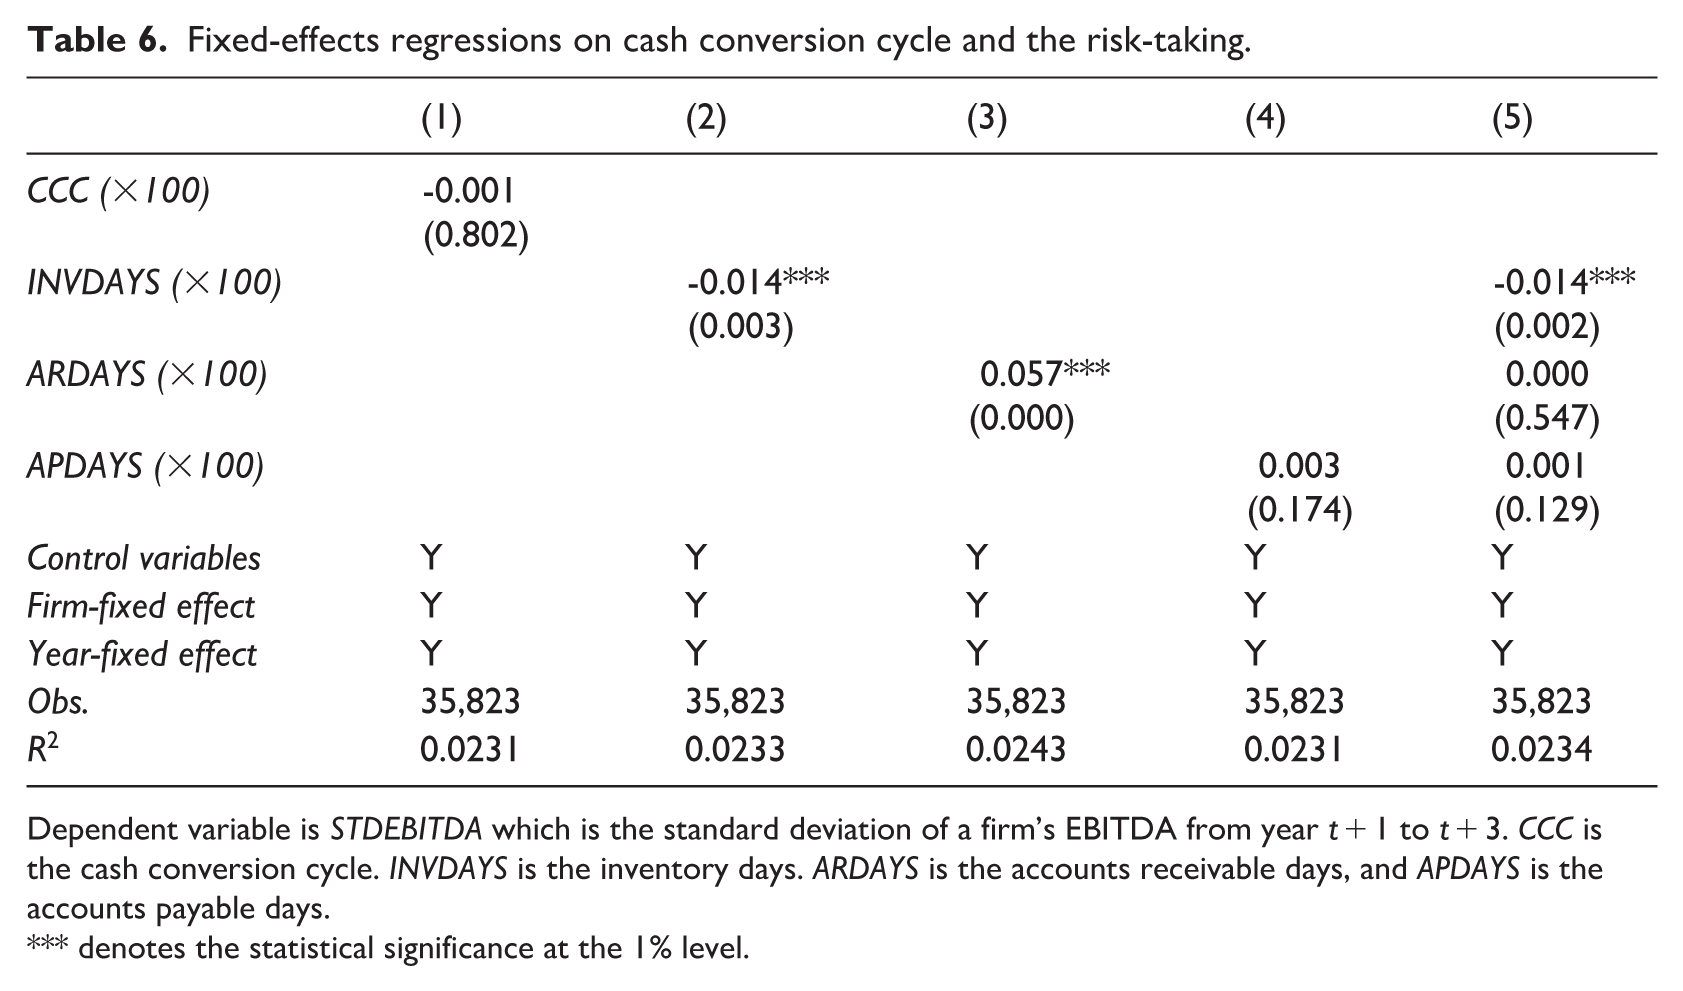
Dependent variable is STDEBITDA which is the standard deviation of a firm’s EBITDA from year t + 1 to t + 3. CCC is the cash conversion cycle. INVDAYS is the inventory days. ARDAYS is the accounts receivable days, and APDAYS is the accounts payable days.
denotes the statistical significance at the 1% level.
Fixed-effects regressions on cash conversion cycle and the mechanism for risk-taking.
Panel A.
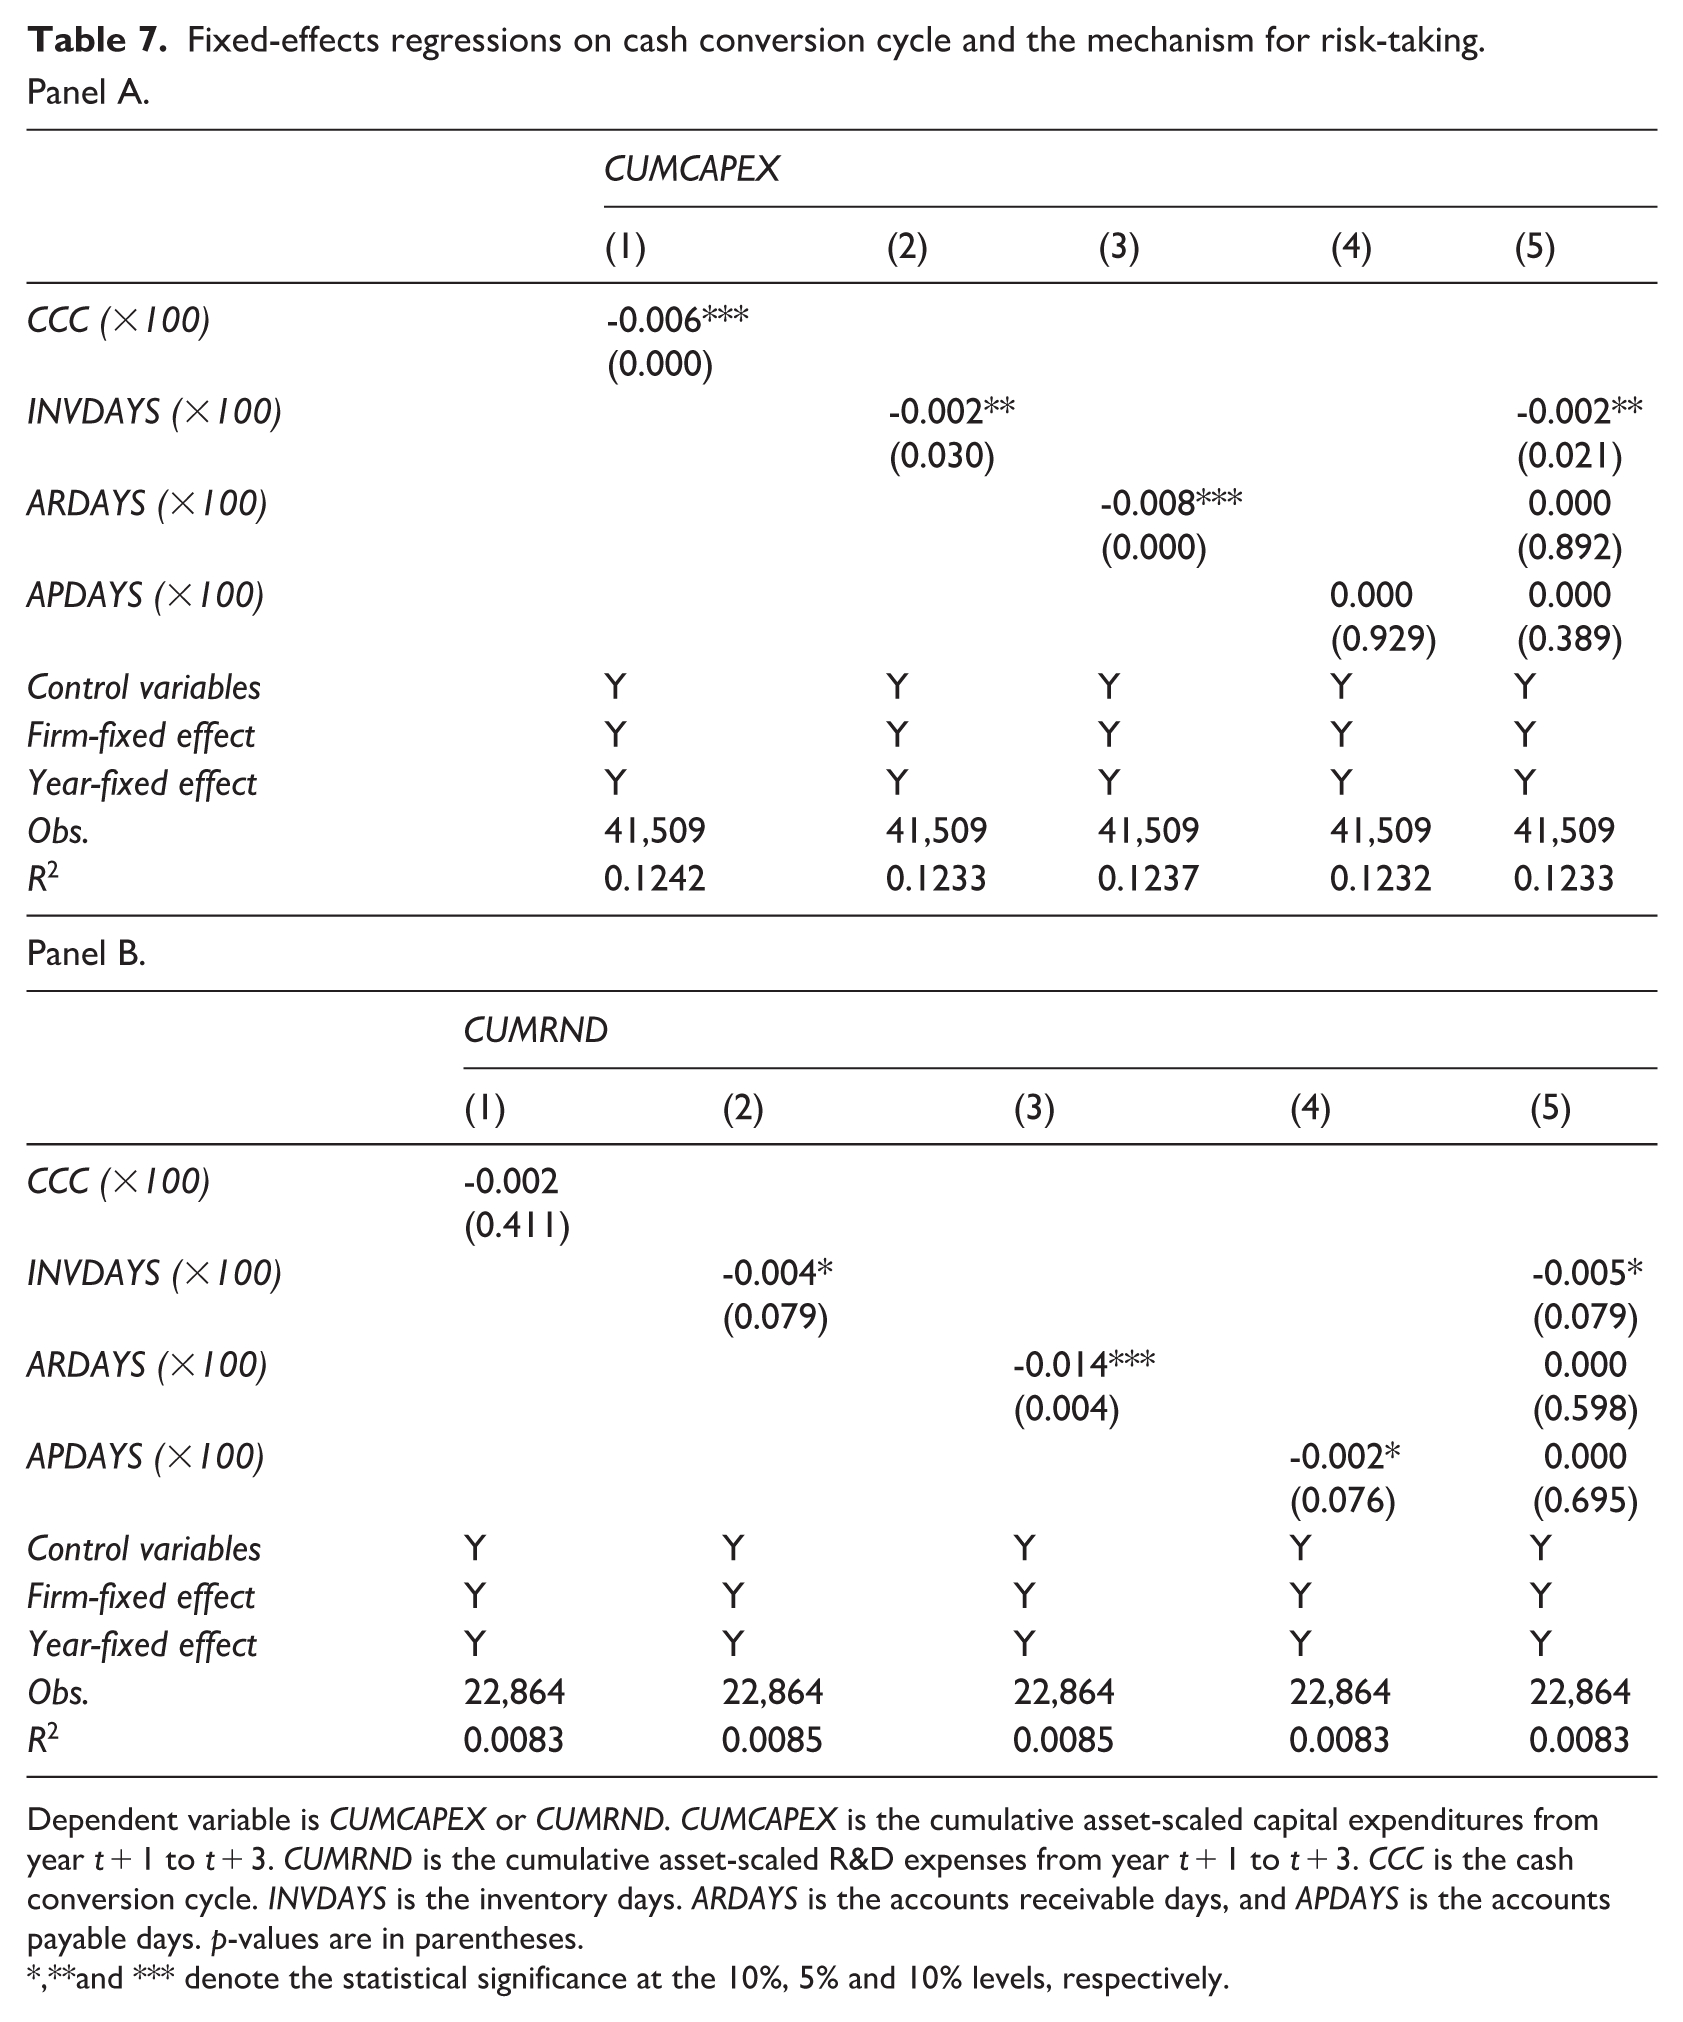
Dependent variable is CUMCAPEX or CUMRND. CUMCAPEX is the cumulative asset-scaled capital expenditures from year t + 1 to t + 3. CUMRND is the cumulative asset-scaled R&D expenses from year t + 1 to t + 3. CCC is the cash conversion cycle. INVDAYS is the inventory days. ARDAYS is the accounts receivable days, and APDAYS is the accounts payable days. p-values are in parentheses.
and *** denote the statistical significance at the 10%, 5% and 10% levels, respectively.
This study examines the effects of CCC on firm operational risk. There is, however, a possibility that CCC and operational risk are influenced by their past values. To examine this potential causality issue, this study employs a robust, two-step Generalised Method of Moments estimator with lagged CCC as the instrument variable and reports the robustness test results in Table 8. The inclusion of this instrument is intended to capture the persistence of working capital policies and to strengthen identification against potential endogeneity. The results are consistent with those reported in the previous table. 7 Moreover, the p-value of the Hansen test is 0.998, suggesting that the causality issue is not a concern in this study.
Generalised Method of Moments (GMM) estimation of the effects of CCC on firm operational risk.
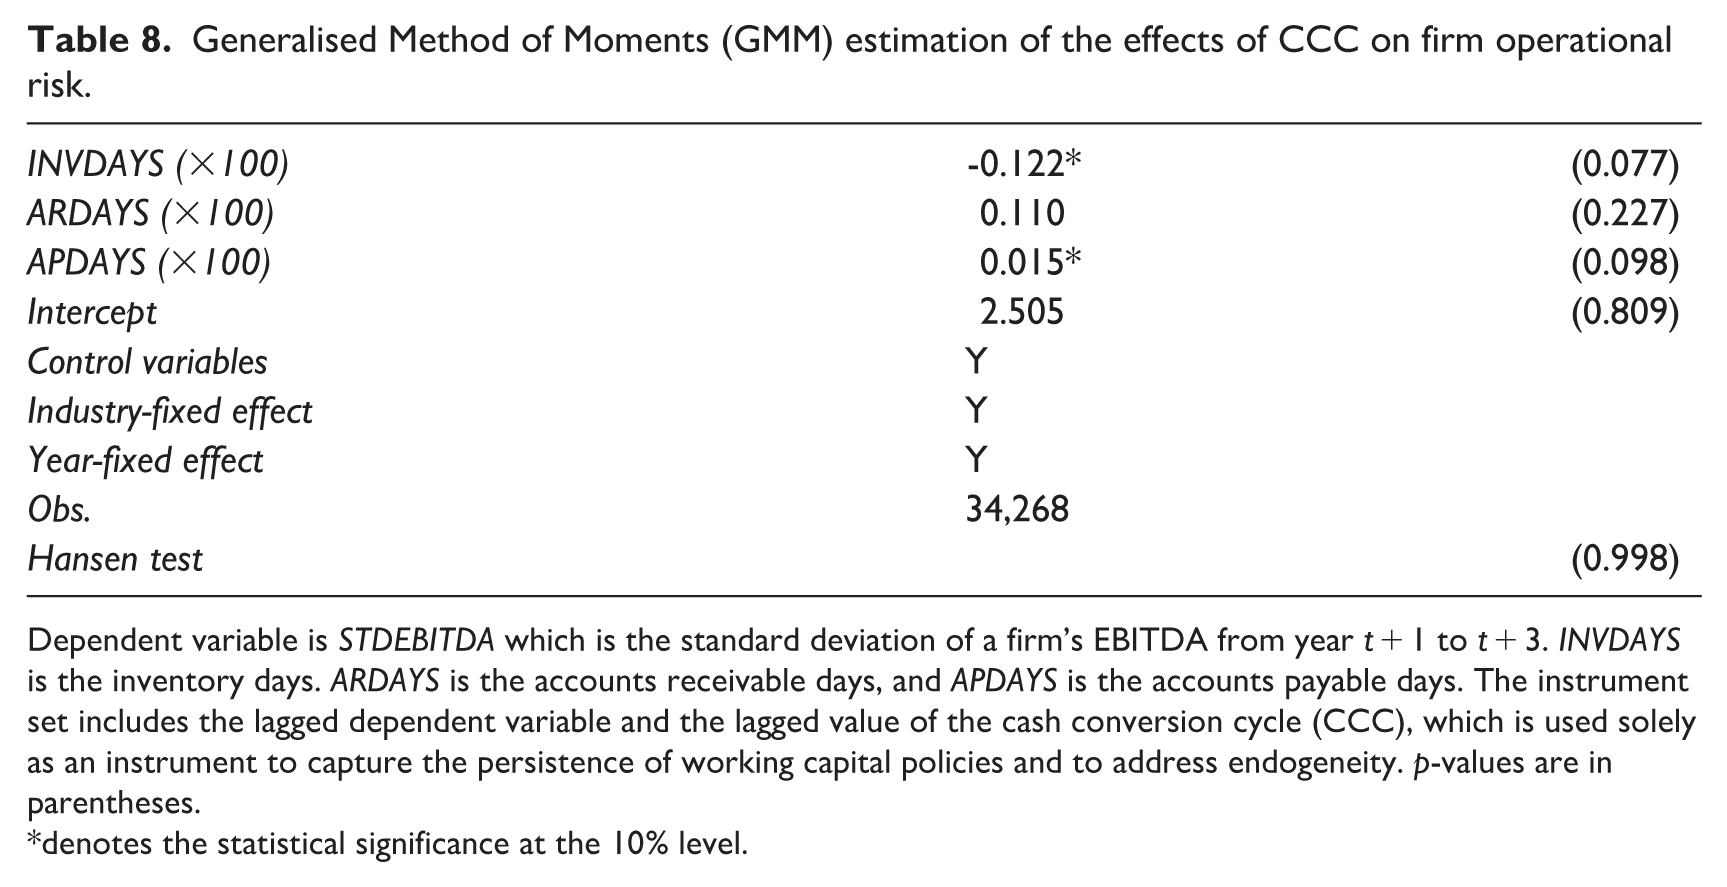
Dependent variable is STDEBITDA which is the standard deviation of a firm’s EBITDA from year t + 1 to t + 3. INVDAYS is the inventory days. ARDAYS is the accounts receivable days, and APDAYS is the accounts payable days. The instrument set includes the lagged dependent variable and the lagged value of the cash conversion cycle (CCC), which is used solely as an instrument to capture the persistence of working capital policies and to address endogeneity. p-values are in parentheses.
denotes the statistical significance at the 10% level.
Aktas et al. (2015) find that firms with a net working capital to sales ratio below that of their industry median behave differently towards corporate investments and firm profitability from those above that of the industry median, suggesting a non-linear relationship between working capital and investment. To check if the main results are robust to non-linearity issue, this study introduces squared terms of CCC and its components in the regression models. The results, as reported in Table 9, show that the coefficients on CCC and its components are consistent with the conclusion of this study. The coefficients on the squared terms are also statistically significant; however, their magnitudes are very close to zero, suggesting that the overall relationship between CCC and firm operational risk is almost linear.
Non-linearity relationship between CCC and risk-taking.
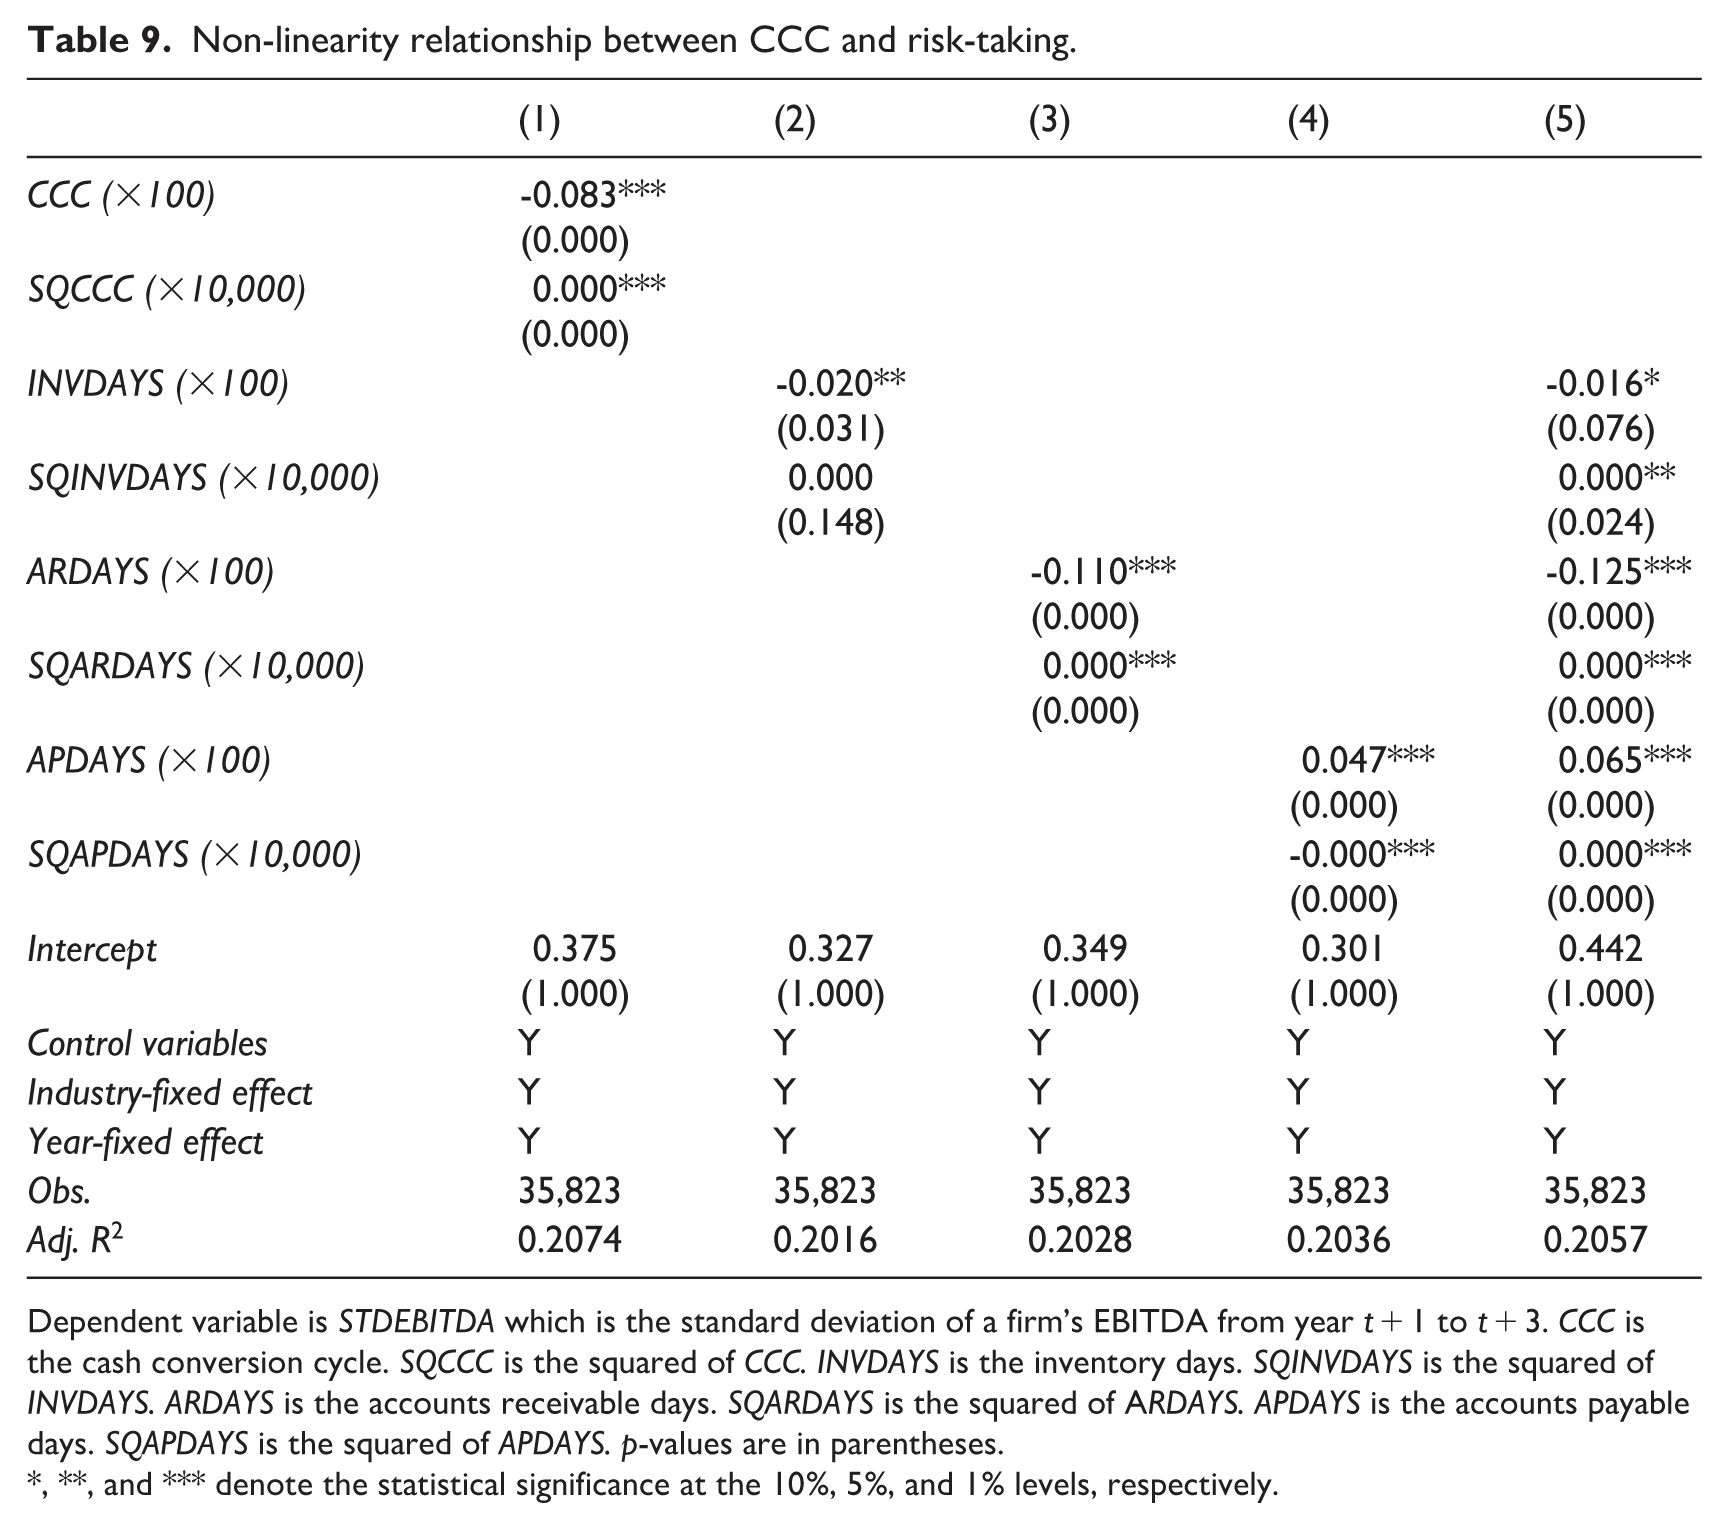
Dependent variable is STDEBITDA which is the standard deviation of a firm’s EBITDA from year t + 1 to t + 3. CCC is the cash conversion cycle. SQCCC is the squared of CCC. INVDAYS is the inventory days. SQINVDAYS is the squared of INVDAYS. ARDAYS is the accounts receivable days. SQARDAYS is the squared of ARDAYS. APDAYS is the accounts payable days. SQAPDAYS is the squared of APDAYS. p-values are in parentheses.
, **, and *** denote the statistical significance at the 10%, 5%, and 1% levels, respectively.
Finally, as an additional robustness check, this study employs the standard deviation of ROA and the standard deviation of stock returns as alternative proxies for operational risk. The results, presented in Table 10, remain consistent with the main finding: firms with shorter CCCs tend to exhibit higher levels of operational risk.
The relations between CCC and standard deviation of ROA and standard deviation of stock returns as alternative proxies for risk-taking.
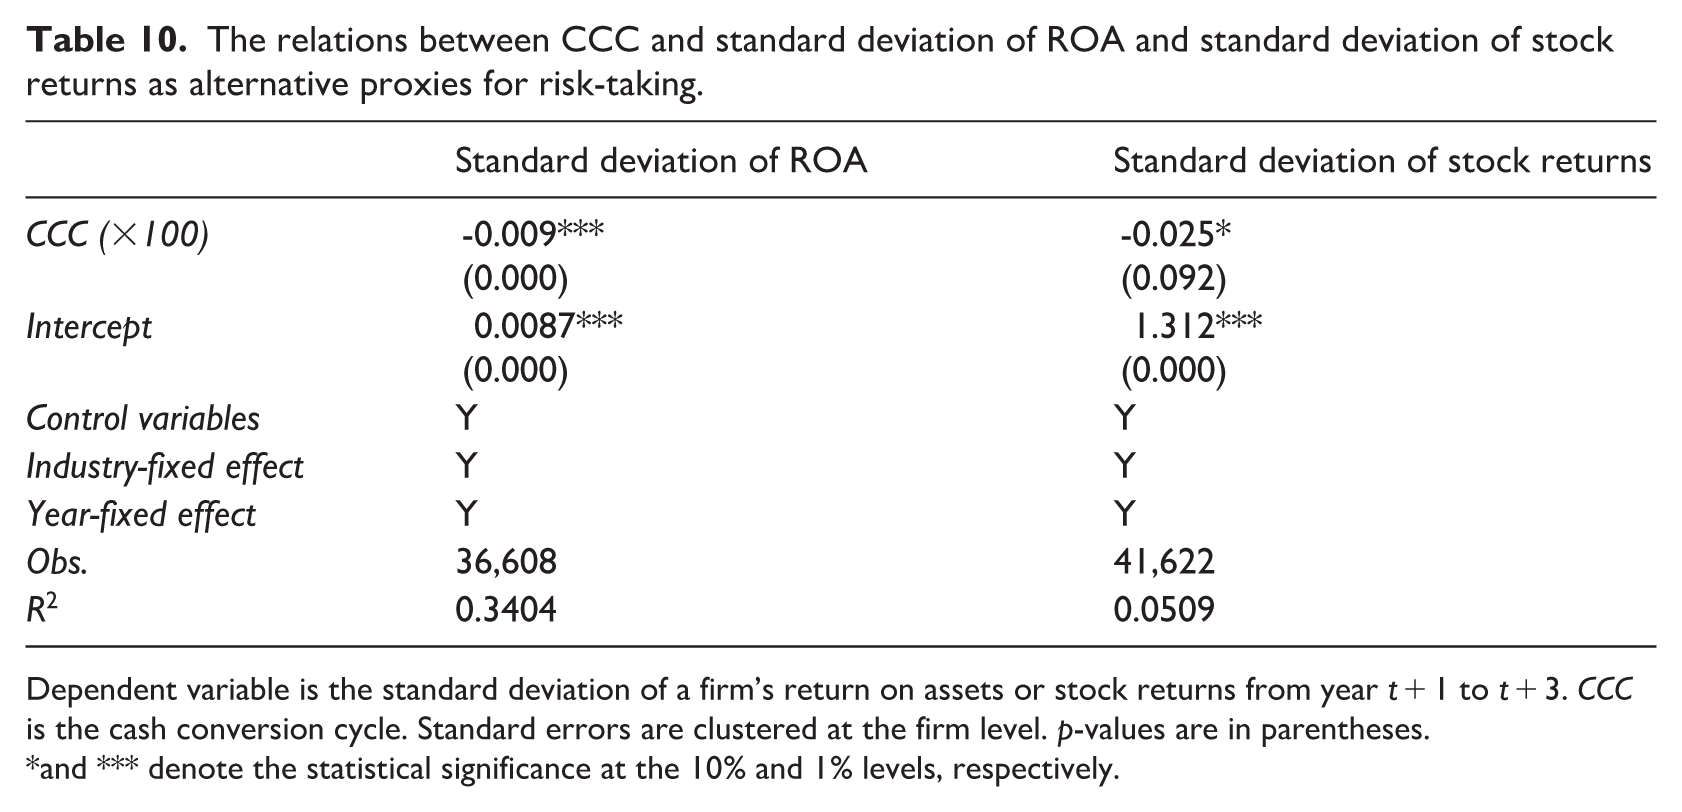
Dependent variable is the standard deviation of a firm’s return on assets or stock returns from year t + 1 to t + 3. CCC is the cash conversion cycle. Standard errors are clustered at the firm level. p-values are in parentheses.
and *** denote the statistical significance at the 10% and 1% levels, respectively.
5. Conclusion
This study finds that the risk-taking hypothesis aligns with the CCC anomaly. Firms with lower CCCs exhibit higher levels of operational risks and allocate a greater portion of their resources to capital expenditures and/or R&D expenses during the CCC anomaly period. These results are consistent with the notion that firms optimise their working capital management by reducing investments in it, freeing up cash that is redirected into more substantial and riskier long-term projects. These investments are anticipated to create value, eventually translating into higher stock returns, thereby giving rise to the CCC anomaly.
This finding implies that the CCC anomaly reflects higher risk-taking in working capital management, suggesting that the abnormally positive stock returns of low-CCC firms documented in the CCC anomaly may be considered as normal stock returns. This finding offers actionable insights for managers and investors, shedding light on the dynamics of risk and its impact on investment and returns.
Theoretical and/or practical contributions of the manuscript
This study shows that the well-known CCC anomaly reflects differences in firm risk-taking, rather than investor mispricing. Firms with shorter CCCs are found to take on higher operational risk, as they actively use working capital policies to reallocate liquidity towards long-term riskier investments.
By identifying capital expenditures as the primary mechanism linking CCC to operational risk, this article highlights that working capital management is not merely an efficient tool but a strategic choice with risk implications. These findings offer a new risk-based interpretation of the CCC anomaly.
For investors, the results clarify that higher returns associated with low-CCC firms represent compensation for greater risk. For managers, the study underscores the trade-off between liquidity management and operational risk when using working capital to fund investment. For policy-makers and analysts, the findings emphasise the importance of viewing working capital policies as part of firms’ broader risk and investment strategies.
Footnotes
Final transcript accepted 6 April 2026 by Tom Smith (AE Finance).

Funding
The author received no financial support for the research, authorship, and/or publication of this article.
Data availability statement
The data employed in this study are available from Refinitiv Workspace, but restrictions apply to the availability of these data, which were used under licence for the current study and therefore are not publicly available. Data are, however, available from the author upon reasonable request and with permission from Refinitiv Workspace.