
Abstract
Scholars have long debated whether there was enough food in Ireland to feed the population during the Great Irish Famine; there has been less detailed examination of high-frequency data to understand how markets distributed food after the harvests failed. This article explores a hitherto unused weekly price and quantity data set from the Cork city markets to analyse how markets may have hindered the distribution of available food from 1846 to 1849. Although, historically, economists have long suspected that raw data on the market for potatoes during the Irish Famine behaved like that for a classical ‘Giffen’ good, there is little evidence for this among foodstuffs available throughout the crisis in Cork. But bacon pigs – a food that never reached a stable equilibrium but completely disappeared from the market in 1847 – exhibited some characteristics which do not appear to accord with the classical law of demand. Further analysis of this data suggests that middle-class purchasing power outbid the poorest people in Ireland at a time when there was a surplus of superior foods and a deficiency of inferior foods. These circumstances indicate that unusual market behaviour may have made the crop failure’s redistributive consequences – as well as its mortality toll – much worse.
The Irish Famine is among the worst economic and demographic disasters in the history of the British Isles since the Black Death. The crisis began in 1845 with the arrival of two potato diseases, phytophora infestans and dry rot, from the Americas. 1 These blights reduced potato yields in Ireland by between a third and a quarter in 1845 and between 75 per cent and 97 per cent the following year. 2 Although fiscal transfers from the rest of the United Kingdom initially blunted the impact of the harvest failures on the Irish economy, a set of severe financial crises resulted in this support being withdrawn. 3 The combination of events soon turned what started out as a manageable harvest crisis into one characterized by mass mortality in what folk memory came to call ‘Black 47’. 4
Many scholars of the famine, including Austin Bourke, Peter Solar and Christine Kinealy, have debated whether there was enough food in Ireland to feed the population during the worst years, during and after 1847. 5 In contrast, there has been much less interest in using high-frequency data to investigate market patterns during the crisis and assess what effect they had on mortality. This article suggests that, during the worst years of the famine period, even those who had sufficient money to create a demand for food or were lucky enough to own food resources such as a pig could have been frustrated by unusual market behaviour in their attempts to access food. Using a newly compiled high-frequency data set from Cork showing weekly price and quantity information for five major food commodities, it analyses demand and supply patterns to investigate whether unusual market behaviour – such as that associated with Giffen goods – did occur during the famine and what this means for historians’ understanding of contemporary relief efforts.
To date, economists have tended to suggest that, in overall terms, markets ‘functioned normally’ during the famine period in Ireland. 6 Ó Gráda, in particular, has blamed ‘backwards agriculture, coupled with the lack of an adequate policy response from the authorities rather than the failure of the markets’, for general shortages of basic foodstuffs. 7 Although Ó Gráda’s overall conclusion that the British policy response on the ground was ineffective is generally accepted, his conclusion about markets tends to obscure important individual examples of market disturbances with which government policy could have engaged, had the economic forces involved been better understood.
Market failure, as traditionally defined in economics, occurs when food is not allocated through market mechanisms to the economic demand for it. What is more of a concern in a famine is the social need for sustenance. While food was needed by the hungry to survive, in effect, only those with access to cash or other entitlements could get food in the markets. As Sen has pointed out, famine is often best considered as a failure of entitlements, ‘economic disaster, not as just food crises’. 8 In the Irish Famine, it is commonly agreed that a failure of entitlements caused many to go without sufficient food and die from the consequences: starvation or, more frequently, disease. This article addresses the possibility that markets, not only fell down on fulfilling social need by servicing economic need instead, but, by the operation of unusual market behaviour, worsened, on the basis of need, even the normal economic allocation of food. This mechanism is still not normally taken into account in modern famines. Whether this was the case in the Irish Famine is therefore an important question.
An under-explored source of such market behaviour which could have inhibited access to food during the Irish famine is the Giffen effect, which in its theoretical form strikes at the heart of classical economic theory by appearing to contradict the law of demand. In classical economics, on a price (on the y-axis) against quantity (on the x-axis) graph, the supply line normally has a positive gradient and the demand line a negative gradient, and the market price is determined by where the lines cross, when the market reaches a state of equilibrium. When the market is disturbed and goes out of equilibrium, it will tend to return to an equilibrium position, giving stability to the market. The demand line slopes down, as originally outlined by Alfred Marshall, due to the law of diminishing marginal utility. This states that each additional unit of a good supplied has less usefulness to the purchaser than the previous one. However, in an event such as the Irish famine, of course, that might well have not been the case. In such a situation, the units of food consumed around starvation level – the marginal units that ensure survival – may have more utility than the first units of food consumed. For instance, if eating a loaf of bread is the bare minimum necessary to avoid death from starvation, only buying half a loaf of bread, in theory, would be useless.
Alfred Marshall thus outlined an exception to his law of demand to take into account subsistence situations: the Giffen effect. This describes cases where a demand line for a good has a positive gradient, that is, demand increases as the price increases. Recent mainstream scholarship has added a number of requirements for a good to be named Giffen. It must be an inferior good and when its price rises, the income effect must be greater than the substitution effect. 9 But few real-life examples of goods have earned the title Giffen, probably because such a situation is likely to be very short-lived.
Irrespective of any theoretical requirements about the naming of the effect, any equilibrium where the demand line has a positive gradient will be unstable, whatever the slope of the supply line, because an increase in demand causes an increase in price which calls forward even more demand. In such a case, markets will set themselves on a course for self-destruction. Foods will continue to sell, whatever the price, until they have run out: the exact opposite of Thomas Malthus’ view of markets as ensuring supplies of food would be eked out in a famine. Those in need cannot afford to buy the food they normally eat, but those who can afford to buy the food at an increased price, do so enthusiastically, when they are buying a good that is inferior to their normal fare (in other words cheaper), but is a good replacement, and where the prices of most foodstuffs are increasing. They do this to maintain their lifestyles when costs are increasing. The chaos caused is the popular view of ‘market failure’ to provide for social need, but it also fulfils the theoretical definition by causing misallocation of food resources to economic demand because after a short time there is no food to fulfil the demand.
In particular, such a misallocation could have occurred in the famine period, when supplies of meat were plentiful but supplies of staple foods such as potatoes and wheat were in short supply. Ireland was a dairy and beef farming country and had large numbers of cattle in the famine period. For the available food to be shared out across the existing demand, most people would have had to move up the food quality scale. However, as we shall see, market disturbances resembling a Giffen effect resulted in middle-income consumers moving down the food scale from beef to pork or bacon when the price of the superior good squeezed their incomes. The circumstances resulted in them depriving the poorer classes of their supplies. It could be argued that any disequilibrium would have been a short one. However, although the economist John Maynard Keynes may have said that ‘in the long-run we are all dead’, in a famine, where a temporary deficiency of calories easily weaken people with nutritional diseases and contagious infections, a short-run disequilibrium is sufficient for famine to kill.
I
Alfred Marshall first outlined Giffen goods as an exception to his law of demand in the 1895 edition of Principles of Economics and ascribed the original observation to Sir Robert Giffen, a Scottish statistician and economist, in connection with bread: As Mr. Giffen has pointed out, a rise in the price of bread makes so large a drain on the resources of the poorer labouring families and raises so much the marginal utility of money to them, that they are forced to curtail their consumption of meat and the more expensive farinaceous foods: and, bread being still the cheapest food which they can get and will take, they consume more, and not less of it.
10
The Giffen effect Marshall described has since been incorporated into classical economic theory, to an extent, by modelling it in the Slutsky’s equation as a situation where an income effect, due to a price rise, outweighs the impact of a substitution effect upon the quantity demanded of the good. Despite a lack of empirical evidence in support of Marshall’s conjecture, a discussion of Giffen goods as an accepted phenomenon has featured in almost every major economics textbook published in the last fifty years and still remains ‘a source of inspiration’ to theoretical researchers in the twenty-first century, according to Wim Heijman and Pierre von Mouche. 11
Some economists, including John Nachbar, have attempted to deny the existence of Giffen goods. 12 They have been supported by studies of Marshall’s original example by George Stigler in 1947, Roger Koenker in 1977 and Liam Brunt in 2013, which have argued that the demand curves for bread and flour in Britain were never upward sloping in the eighteenth and nineteenth centuries. 13 From the 1960s, the potato during the Irish famine of 1845–49 has been cited as the classic example of a Giffen good; first in Paul Samuelson’s Economics, which confused Sir Robert Giffen with Sir Francis Drake. 14 Mentions followed in works by Edgar Browning, Heinz Kohler, Richard Leftwich, Donald McCloskey, Walter Nicholson and Liam Kennedy. 15
By contrast, Gerald Dwyer and Cotton Lindsay have argued that the idea is flawed theoretically as ‘there were not more but fewer potatoes available; the Irish people could not have eaten more as a group’ and so put the price up as they transferred from other foods, even after a price rise. 16 They concluded that ‘the place to look for a Giffen good is not a peasant economy engaged in subsistence farming’. 17 This position has since been supported by Nachbar, Terrence McDonough and Joseph Eisenhauer. 18 But this conclusion has been criticized in that it ignores other types of commodities in famine Ireland. Ulrich Kohli has replied to Dwyer and Lindsay with the argument that meat in famine conditions is more likely than potatoes to display Giffen behaviour, on theoretical grounds. 19
Investigating the case that the Irish potato could have been a Giffen good, Otis Gilley and Gordon Karels have shown that theoretically a demand curve for this subsistence good could have a positive-gradient middle section if it is considered in tandem with meat and with two restraints, a budgetary one and a minimum nutritional standard one. 20 Robert Jensen and Nolan Miller, who claimed to have shown the first evidence of the Giffen effect on an individual basis in the real world, gathered their own data from an experiment in an artificial environment with vouchers for rice in China. 21 Their theoretical explanation for their results developed Gilley and Karels’s theories. They proposed a three-zone demand curve dependent on wealth. When a consumer with a choice of staple food or meat is relatively wealthy, they will respond to an increase in price of the staple by eating less of it and more meat. This gives a conventional negative gradient for the part of the demand curve in which the condition applies. As their wealth decreases, they enter what Jensen and Miller have called the ‘subsistence zone’ where they can only just afford enough to eat. 22 Now they will respond to price increases of the staple by eating more of it and less meat, leading to an unconventional positive demand curve, which produces the visible ‘Giffen effect’. When they cannot afford the nutritional minimum, only the staple is bought, and when the price increases, they are forced to buy less of it and the demand line is negative once again, as according to the normal law of demand. Expressed graphically, this produces a ‘Z-shaped’ demand curve with a negative-positive-negative gradient.
Liam Brunt and Drew Zhu are among those continuing to try to incorporate the Giffen effect into mainstream theory. 23 In particular, Zhu supplies the theory behind the findings in the working paper version of this research. However, the main thrust of the argument presented here is the consequence of the effect experienced by the ordinary person in the real world and the possible lessons for the management of future famines, rather than the exact classification of the underlying theory. That the effect existed in the real world is undeniable from the data given below.
II
The method used here is to identify initially which goods were exhibiting normal demand behaviour by inspecting the raw data, much as Robert Giffen would have done as Comptroller of the Corn Returns at the Board of Trade after 1876. The chosen example is then subjected to analysis on the basis of modern economic theory to roughly identify the gradient of the actual demand curve. It should be noted that the limitation of the historical data means that the effect can only be examined at the market level and not at the individual level and can only consider the middle part of a Z-shaped demand curve.
For the empirical data in the present study, price and quantity sold for potatoes, wheat, barley, oats and bacon pigs in the Cork markets were collected from the Constitution or Cork Advertiser on a weekly basis for the complete run from January 1845 to December 1849. 24 This newspaper provides the market reports most consistently and completely; although most Irish newspapers of this period provide market prices for food, no other Irish newspaper has a robust run of price and quantity data for the same period. The market reports cover all the marketplaces in 1840s Cork, providing an interesting case study of market behaviour in this city during the famine. In addition, the data is not subject to political bias for, although the paper’s stance was pro-Union, the same reports also appeared sporadically in the pro-Repeal Cork Southern Reporter.
Initially, the data is presented in the results section as scatter diagrams on price against quantity graphs. The points on these indicate the equilibrium (or crossing points) of demand and supply lines and not the actual lines. However, they provide a quick check on whether there is tendency for the quantity sold to increase with increasing price. An ordinary least squares estimation is shown on the graphs, but again this only shows the variation in equilibrium points.
To identify the separate demand and supply lines in the example chosen for analysis, a simultaneous equation model is partially estimated using the reduced form method. 25 Only the gradient for the demand line is required, the rest of the equations do not need to be identified. Supply and demand are assumed to be simultaneously determined by the interaction between them. An exogenous variable, F, which affects the quantity supplied but not directly the quantity demanded, is included.


where Qs is the quantity of pigs supplied, 26 Qd is the quantity of pigs demanded, P is pig price, α and β represent various coefficients and ∊ represents error terms that are uncorrelated with the variables (p = 0.348).
Q and P are endogenous variables, that is, determined within the model, while F is determined by factors outside the model.
At equilibrium,

Solving the resulting equation, the price and quantity at equilibrium can be represented by straight line equations (of the form y = mx + c) on graphs of price and quantity against F:


Extracting the coefficients of F, it can be seen that the ratio of the gradient on the quantity against F graph to gradient on price against F graph gives the gradient of the demand line, that is:
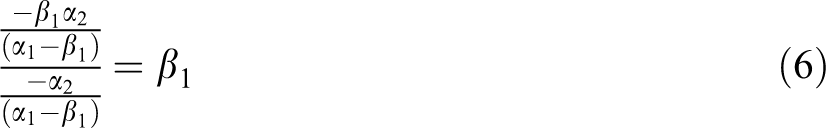
The slope of the demand line can therefore be calculated from these gradients which can be estimated using ordinary least squares. In order to identify whether there was behaviour with Giffen characteristics, we do not need to know about other parts of the demand line equation or the equation for the supply line.
III
The results of the initial scatter diagrams, particularly for potatoes, show a distribution compatible with normal market conditions with the exception of that for bacon pigs which shows a slight positive trend (Figure 1).
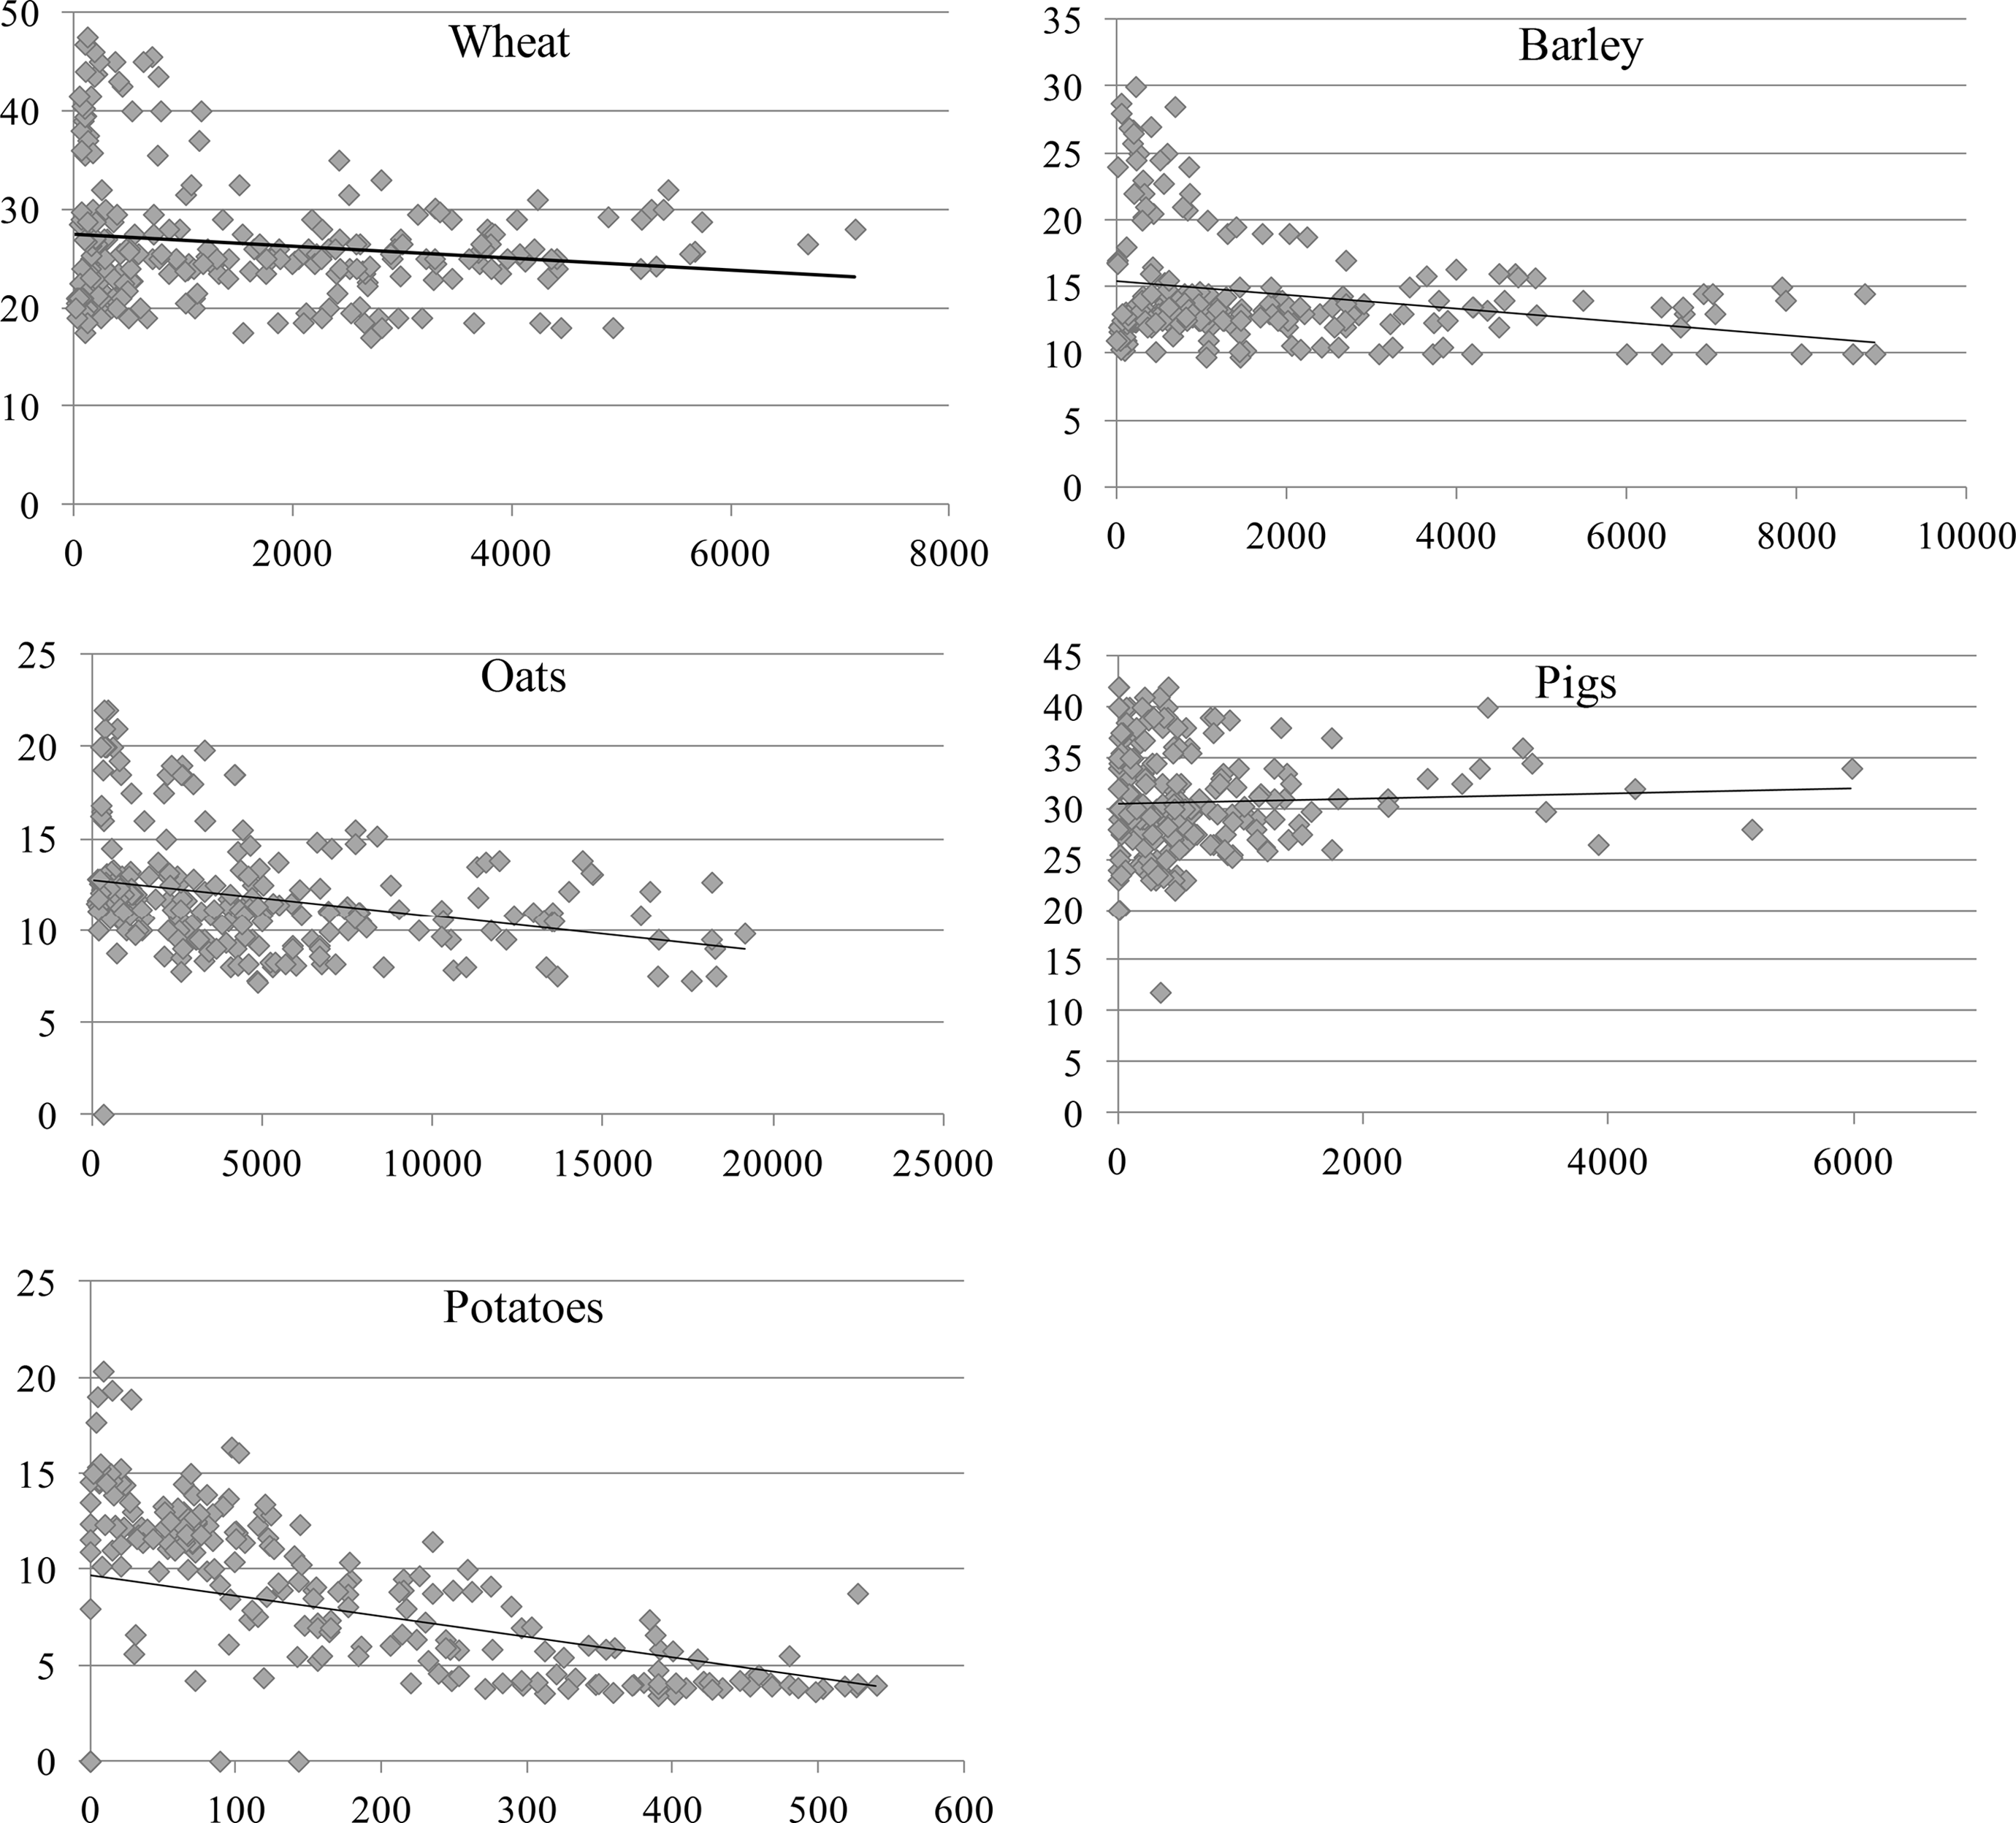
Comparative scatter chart for Cork wheat, barley, oats, pigs and potatoes for the period January 1845–December 1849. Price is shown on the y-axis and quantity on the x-axis. Wheat, barley and oats were priced in shillings per twenty stone barrels and quantity was in barrels. Pigs were priced in shillings per hundred weight and the quantity was in pigs sold. Potatoes were priced in pence per stone. Sources: Market Reports, The Constitution or Cork Advertiser, January 1845–December 1849.
Therefore, the bacon pig market, and not the potato market, is the best candidate for detailed analysis of the demand line, a conclusion that agrees with Kohli’s supposition that meat markets may be the best place to look for Giffen goods. The choice of an exogenous variable is limited by available data, and the price of potatoes is proposed here as an increase in the price of potatoes would have increased the supply of pigs in the market. Farmed pigs were fed on potatoes and domestic pigs on potato scraps (although some foraged for themselves), so as potatoes increased in price, more pigs would have been put on sale for farmers to buy food, but it is assumed that the price of potatoes did not affect the quantity of pigs demanded directly as contemporary sources indicate that they were not substitute goods at the time.
The analysis is therefore carried out and the results shown in Table 1. As anticipated the variable F, the price of potatoes (pot-p), has an effect on or correlates with the quantity of pigs and with the price of pigs. The R 2 values are low, but this is not surprising with historic data of this sort.
Results of ordinary least squares regressions using data points from 4 January 1845 to 22 December 1849.a
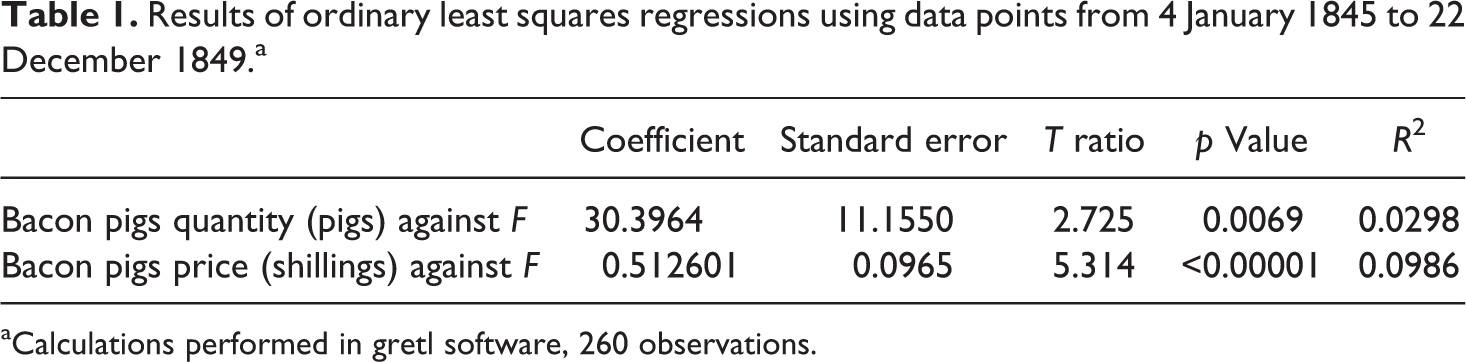
aCalculations performed in gretl software, 260 observations.
From the regression results, the gradient of the demand line is therefore:
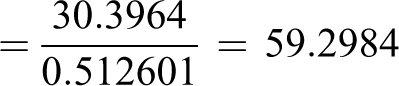
This ratio is for the price against quantity graph drawn with the axis reversed from convention which places the price on the y-axis, so for a conventional graph, the gradient is 1/59.2984 = 0.01686. For the purposes of visualization, a line of that gradient can be drawn on the scatter chart of price–quantity points (Figure 2). The displacement above the x-axis has not been calculated and is therefore not shown accurately. However, the gradient of the demand line can be shown and is firmly positive. This method is subject to some bias with small data sets, but with 260 observations, it is reasonable to assume this is too low to affect the gradient sign. 27 Bacon pigs therefore quite probably exhibited some sort of behaviour that does not conform to that exhibited by normally behaved goods at the level of the Cork markets in Ireland in the famine period and the associated market disruption took place.
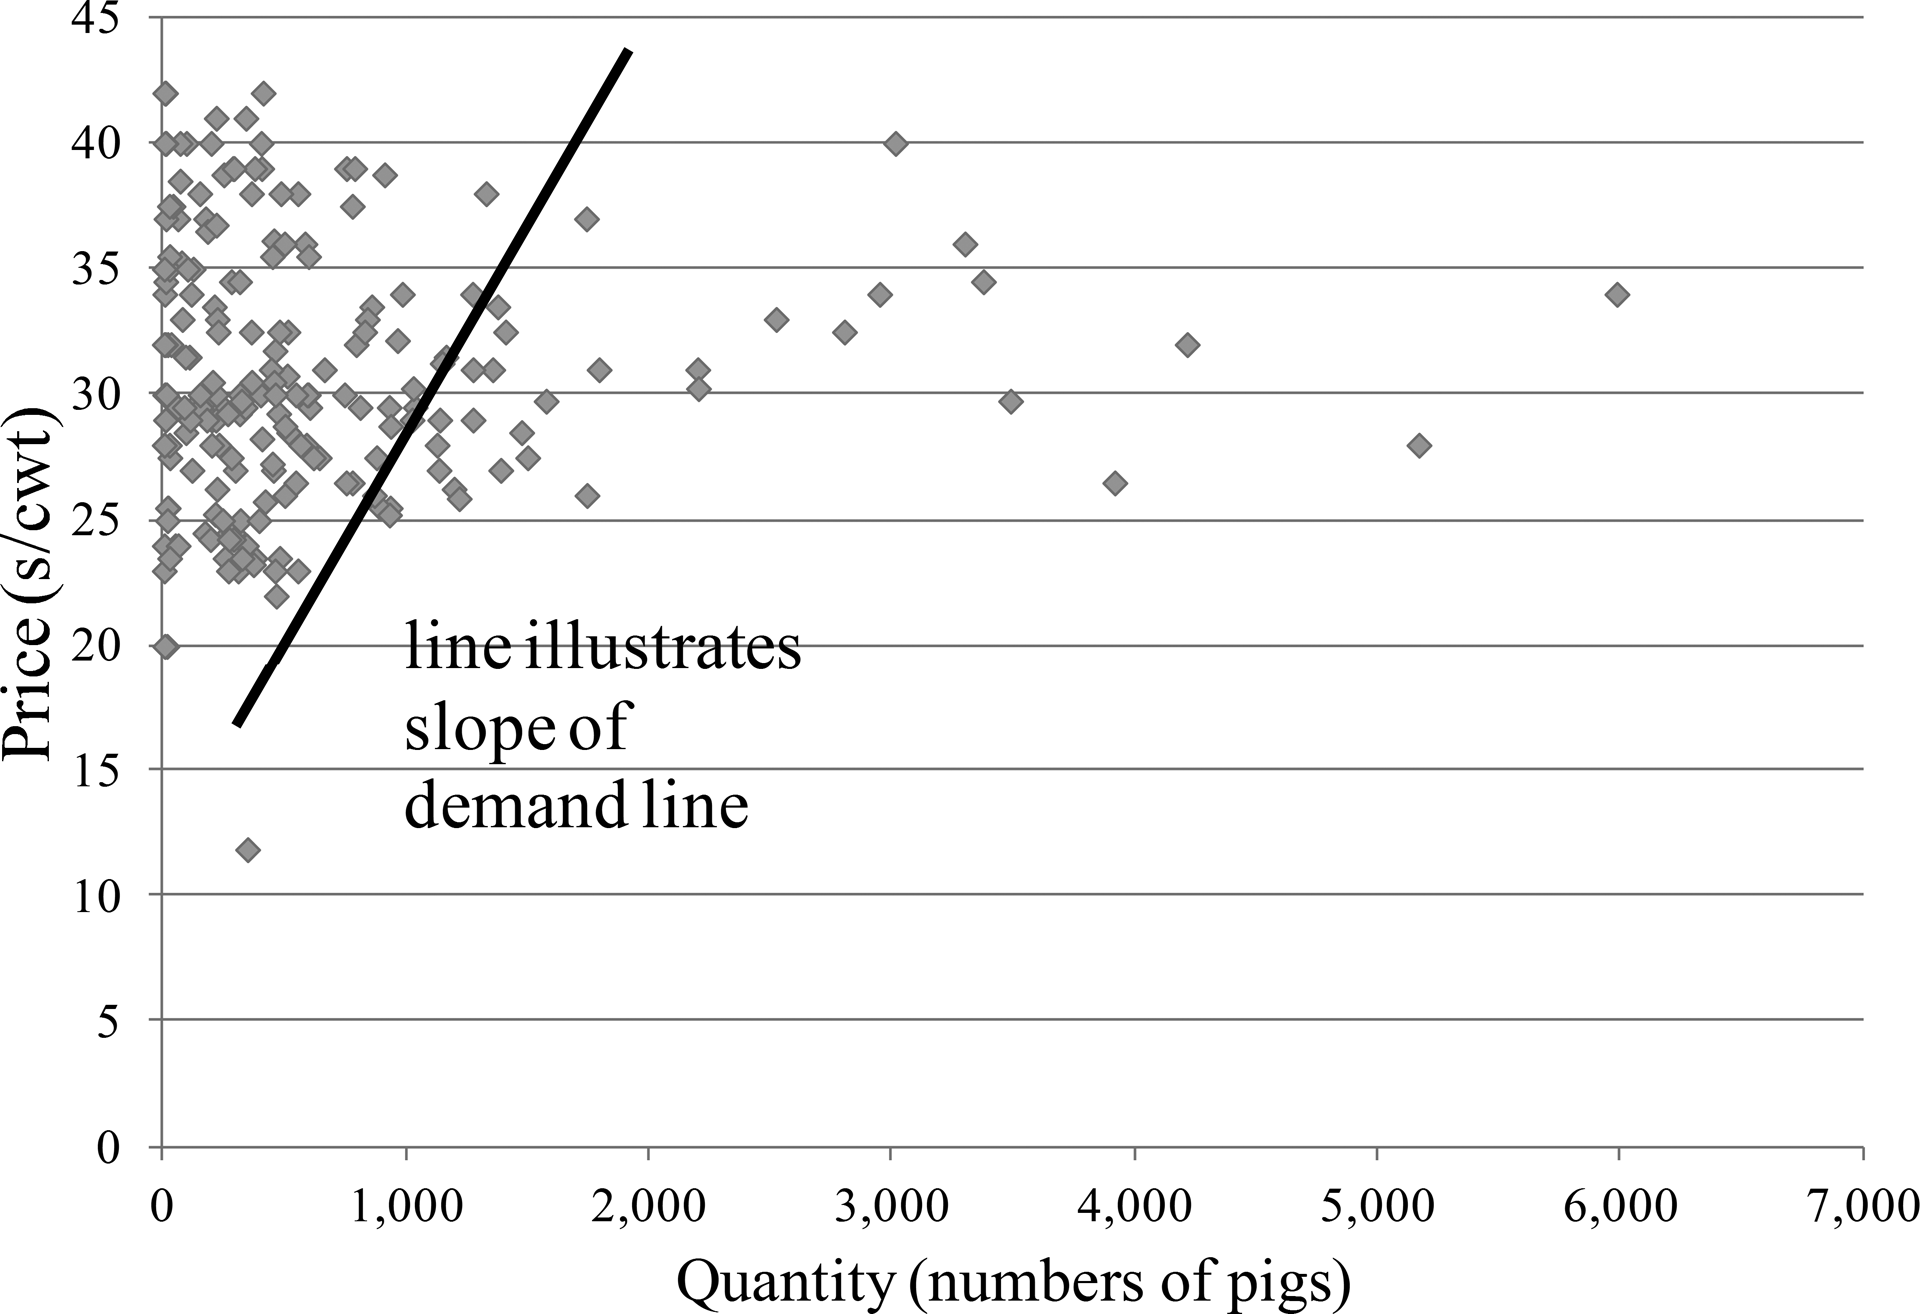
A line with the same gradient as the demand line shown on the scatter graph for bacon pigs, price against quantity. Source: As Figure 1.
IV
This agrees with contemporary descriptions and other economic data. The Constitution noted, with surprise, that from January 1847, all the pigs and other items of cheaper food had disappeared from impoverished areas around Cork. 28 It was noted that pigs for sale were plentiful and in a similar range of sizes to previously. 29 The cause of the effect can be identified as middle-income consumers trading down from beef to the cheaper bacon to maintain their lifestyles when the prices of cheaper staples such as pork were rising in price, combined with the peasants selling their capital assets to try and obtain money to buy food to replace the potatoes which they had grown and which had failed.
The trading down of the middle classes can be demonstrated by comparing beef and bacon prices in the Cork markets (Figure 3). In 1846, the year in which totalled per annum pig sales in Cork increased almost 100 per cent to 64,114 from just 33,063 in 1845, beef prices fell sharply to near those of bacon, which maintained previous levels. Such price movement is consistent with consumers changing from beef to bacon. Evidence for financial pressure causing peasants to sell pigs comes from qualitative and quantitative sources. The contemporary guide to Ireland by Hall describes how, when the potato crop was diminished in size, the peasants could have recourse to their pigs, ‘fed upon anything’ without ‘expense’, selling them to buy cheaper food, whereas in normal times it was ‘the pig that “pays the rent”’. 30 Real wage levels can be shown to be low in the years in which pig sales were high: 1842, 1844, 1845 and 1846 (Figure 4). Such sales were probably accompanied by panic, both panic selling and buying. As classical economic theory depends upon rational human behaviour, so some sort of Giffen effect in Ireland might have arisen from panic.
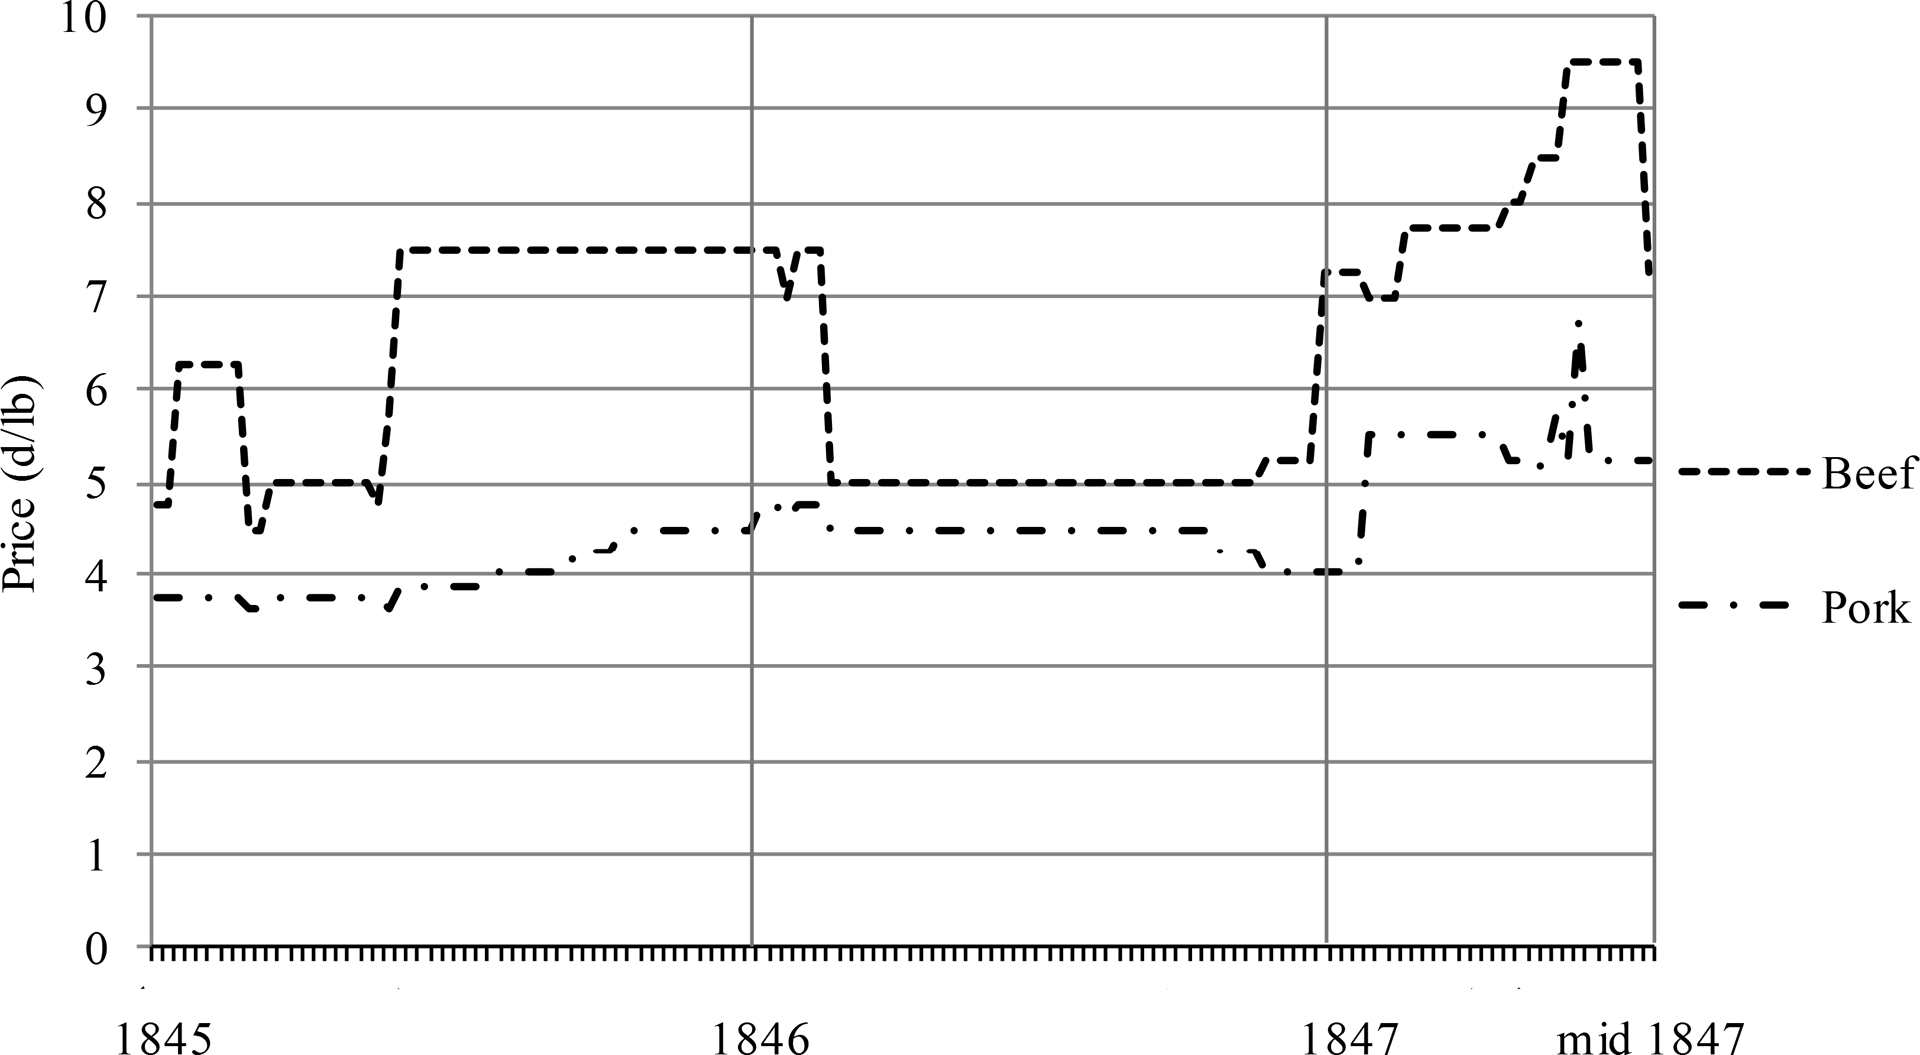
Retail price of beef (d/lb, top line) and bacon (d/lb, bottom line) in the Cork markets 1845–47. Source: Market Reports, The Constitution or Cork Advertiser.
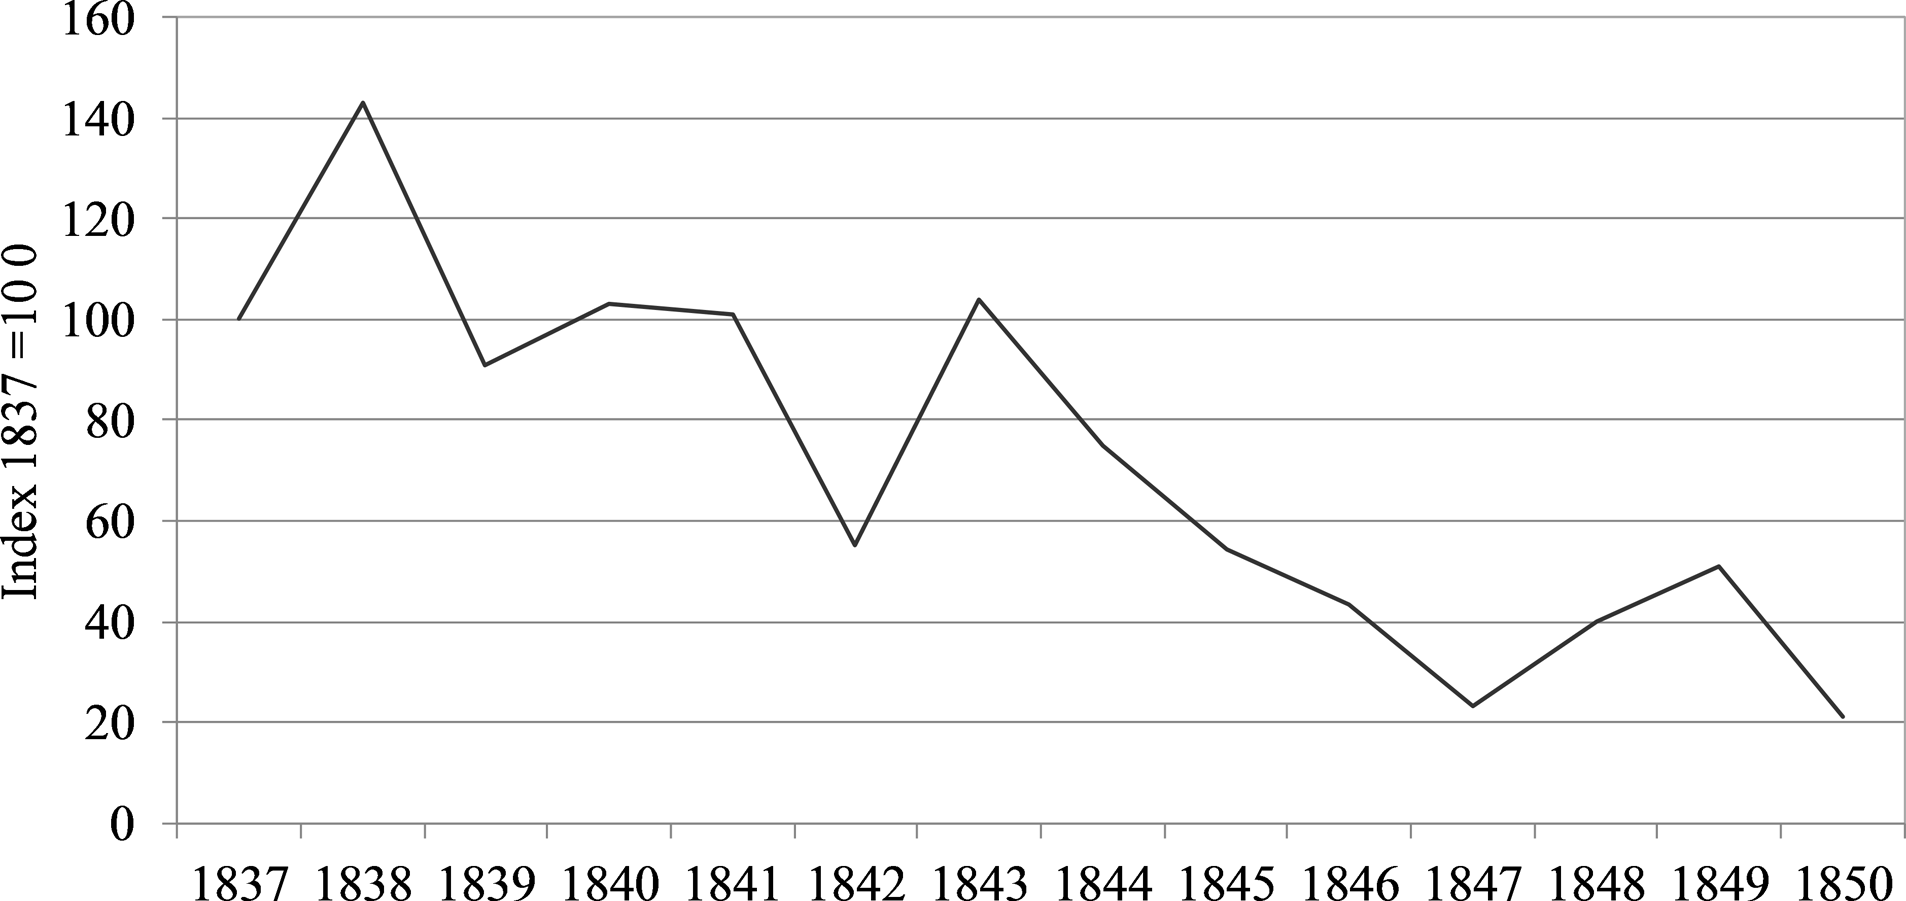
Purchasing power index of real wages, from the Freeman’s Journal agricultural wage statistics adjusted for living costs, both indexed to 1837 = 100. Large falls in Irish real wages are evident in 1842, 1844, 1845 and 1846, the same years that strong unusual market behaviour is reported in the Cork bacon pig market. Sources: F. Geary and T. Stark, ‘Trends in real wages during the industrial revolution: a view from across the Irish Sea’, Economic History Review, 57 (2004), 362–95; F. A. D’Arcy, ‘Wages of Labourers in the Dublin Building Industry, 1667–918’, Saothar, 14 (1989), 23–24; Freeman’s Journal, 24 January 1837, 18 September 1839, 7 February 1840, 18 July 1842, 8 January 1846, 7 February 1840, 20 May 1846, 26 June 1846, 6 May 1847, 16 June 1847, 5 January 1850 and 2 May 1850.
Despite the low quality of the historical data and theoretical difficulties in analysis because of the lack of income information, there are strong indications that some sort of unusual market behaviour resulted in greater middle-income demand for inferior meats encouraging the poorer classes to sell their emergency capital and food reserves in circumstances of rising prices in which the money exchanged rapidly lost its real value. Furthermore, the collapse of the pig population to very low levels in 1847 indirectly made the famine worse in 1848–49, as pigs were no longer available to convert food inedible by humans, such as potato peelings and foraged vegetation, into calories for human consumption.
Although sales of bacon pigs in the Cork markets increased sharply in 1846 (by over 100 per cent in November 1846 compared to the same month in the previous year, see Figure 5), these increased volumes were not exported. National exports of pigs for November 1846 were only 20 per cent above the monthly average of 1845. 31 It is reasonable therefore to assume that the majority were bought to consume in Ireland.
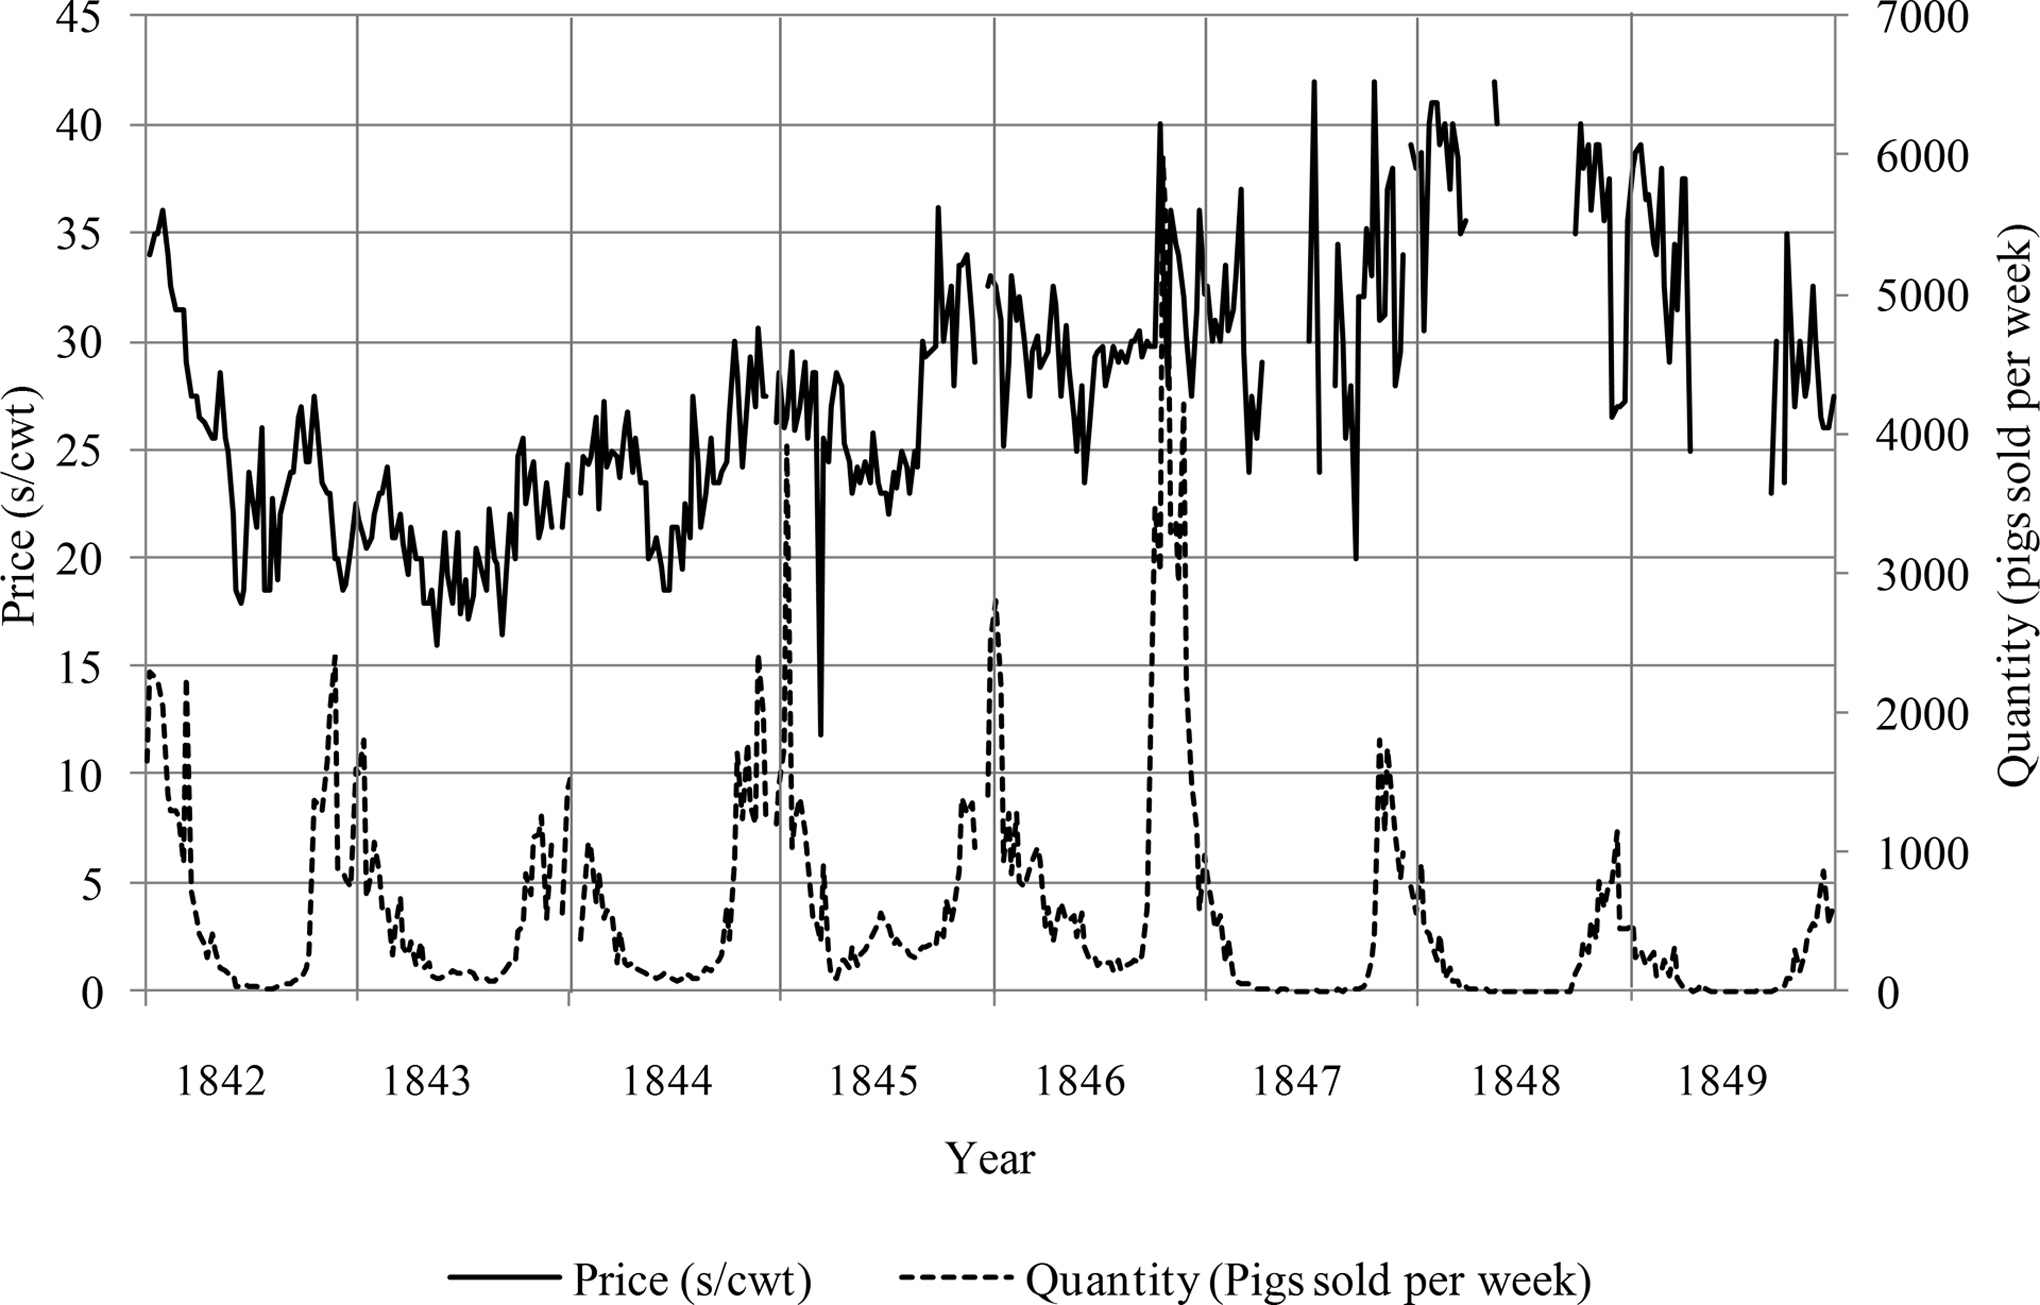
Bacon Pig price in shillings per imperial hundredweight (left-hand scale) and quantity of bacon pigs sold (right-hand scale) for Cork Markets 1842–49. An overall view of the data. Source: Market Reports, The Constitution or Cork Advertiser.
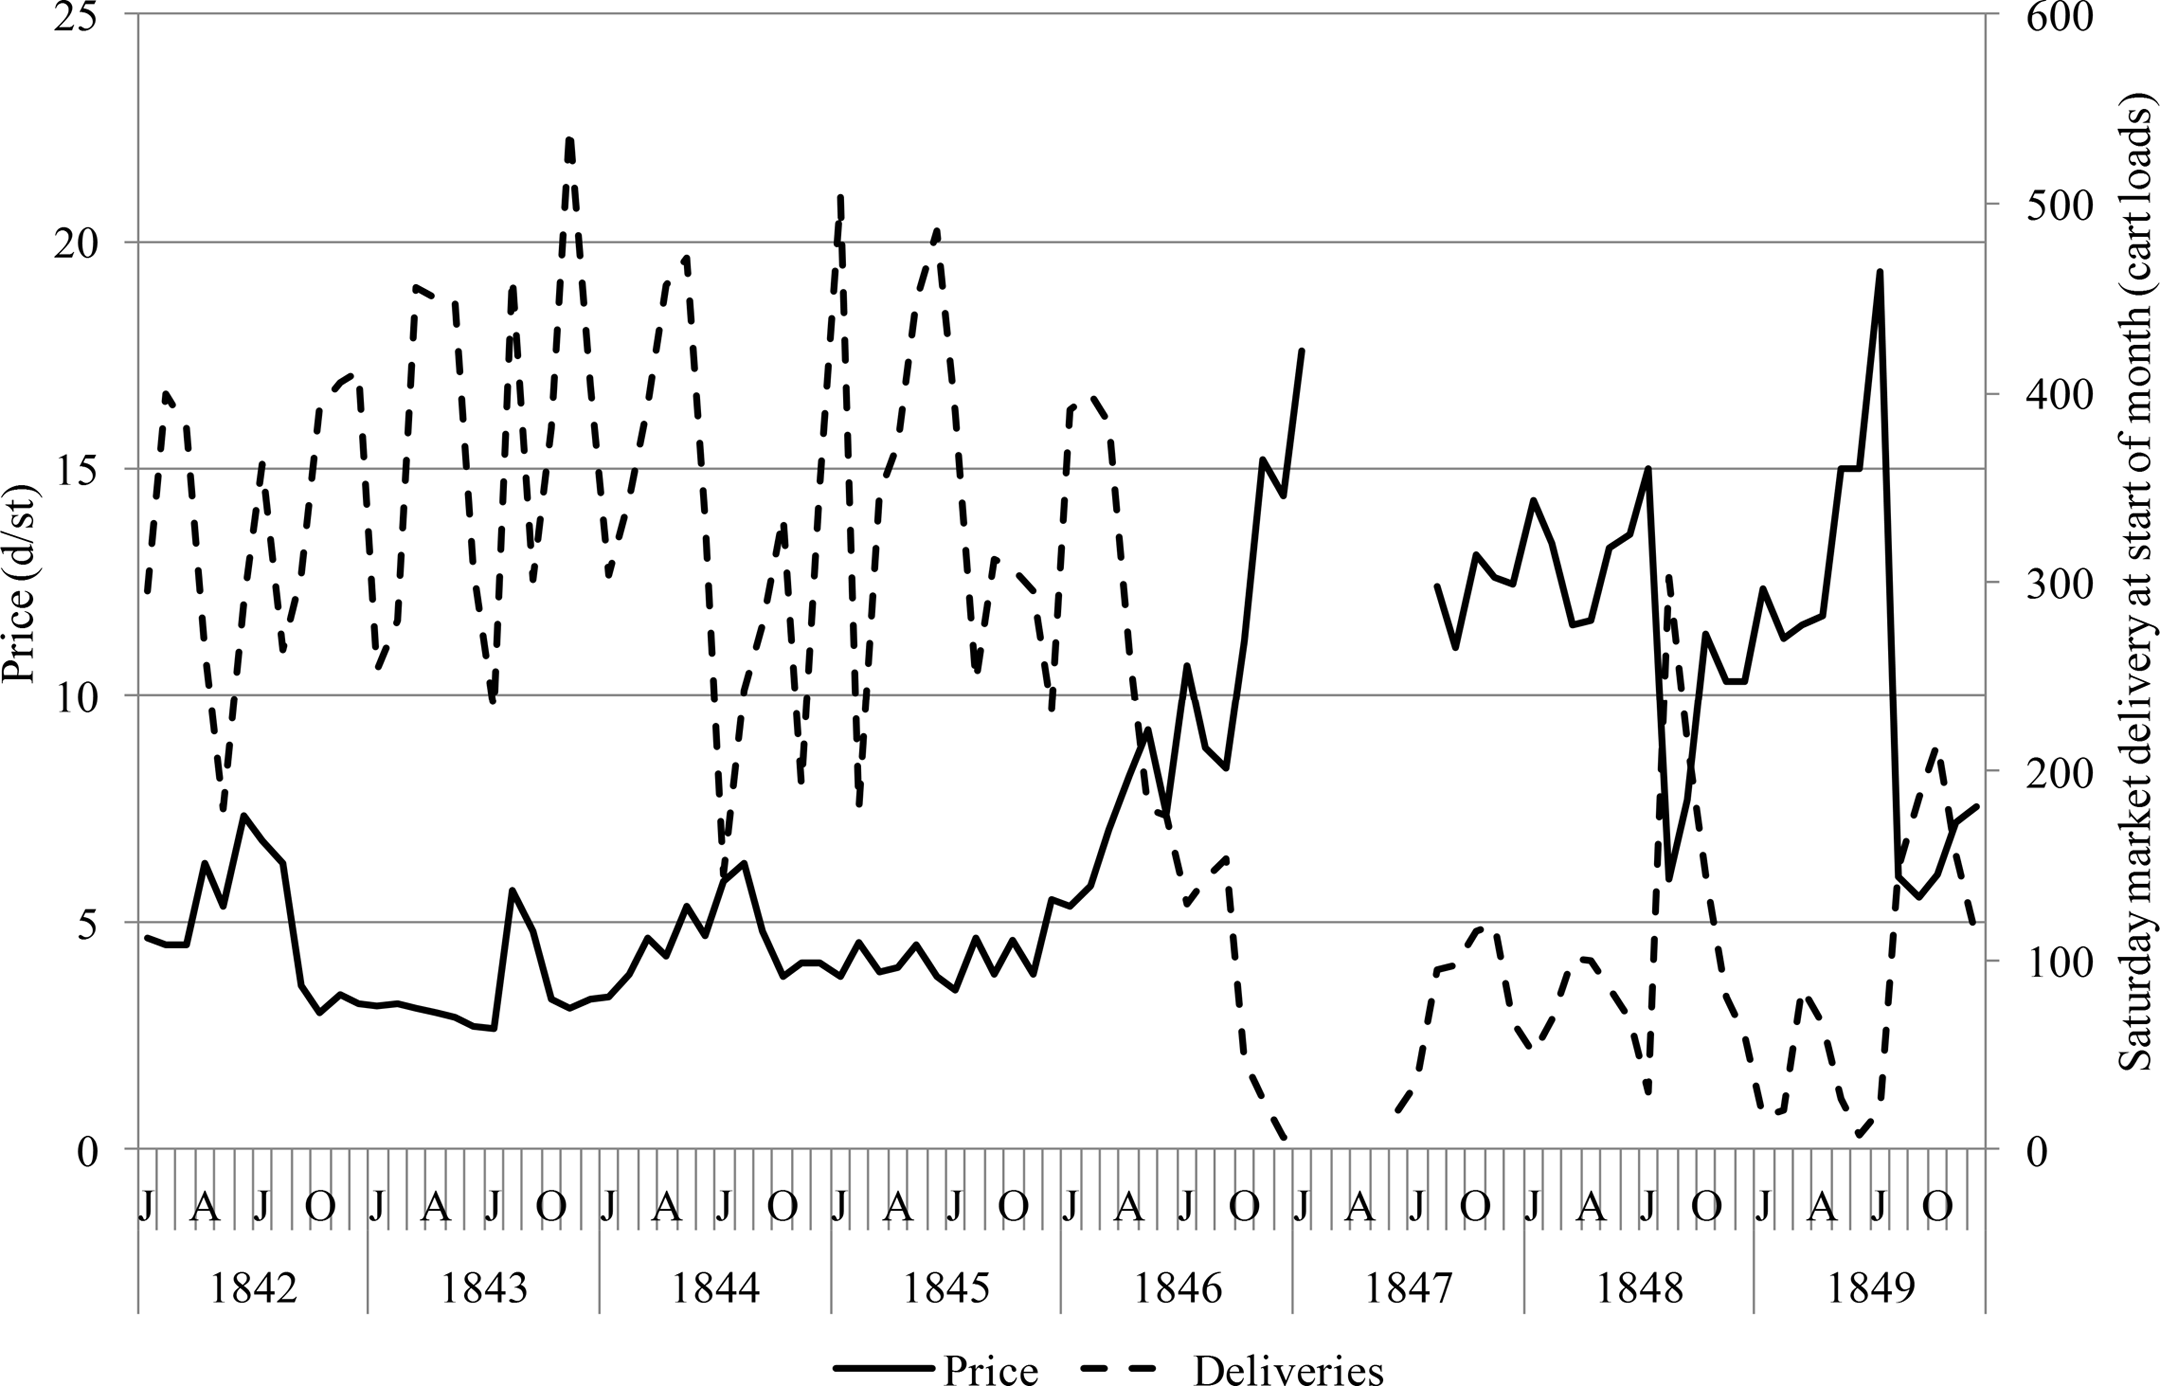
Potato price in pence per stone (left-hand scale) and quantity delivered cartloads (right-hand scale) for Cork Markets 1842–49. Source: Market Reports, The Constitution or Cork Advertiser.
Evidence for financial pressure causing peasants to sell pigs comes from qualitative and quantitative sources. The contemporary guide to Ireland by Hall describes how, when the potato crop was diminished in size, the peasants could have recourse to their pigs, ‘fed upon anything’ without ‘expense’, selling them to buy cheaper food whereas in normal times it was ‘the pig that “pays the rent”’. 32 Real wage levels can be shown to be low in the years in which pig sales were high: 1842, 1844, 1845 and 1846 (Figure 4). 33
The consequences of this unusual market behaviour during the famine period were probably significant and more widespread than around Cork. Panic selling, later regretted, was noted as a general symptom of the famine, at the time, in the Freeman’s Journal: Those farmers in Ireland who sold their food soon after the harvest at a low price have some of them since bought it back, re-imported to answer their demand, at double the price they sold it for, and others of them have died of starvation because they have not wherewithal to repurchase it.
34
When more than three-quarters of the potato crop failed in late 1846, peasants, with few scraps left to feed the pigs and facing financial ruin, with their landlords chasing rent arrears in the face of continuing mortgages payments, tithes and Poor Law rates during these same months, were forced to sell their pigs to pay the rent, creating a large quantity on the market in 1846.
They ran out of pigs by the start of 1847, with market volumes of bacon pigs and other foods falling to very low levels that year, as the Constitution noted in its market reports. 35 The large pigs were sold in similar sizes to previously, and the smaller pigs drowned if they competed for food with humans. 36 But one would expect such a high initial supply to reduce bacon pig prices and thus inhibit sales. Instead, it appears that that bacon pig prices rose in 1846 as for previous years since 1842. Thus, we see the stronger effect was an abnormal demand curve as the middle classes traded down to bacon, from other meats such as beef, which they were less able to afford because their incomes were reduced in real terms by rising food prices.
The unusual behaviour resulted in greater middle-class demand for inferior meats encouraging the poorer classes to sell their emergency capital and food reserves in circumstances of rising prices in which the money exchanged rapidly lost its real value. Furthermore, the collapse of the pig population to very low levels in 1847 may have indirectly made the famine worse in 1848–49, as pigs were no longer available to convert food inedible by humans, such as potato peelings and foraged vegetation, into calories for human consumption.
This downward tendency in the quality of food demanded by the middle class worked against the adjustment necessary if the food available in 1847 was to be distributed equitably among the population on the basis of need. A new calculation has been performed for 1847 which suggests that meat accounted for 16 per cent of available food energy towards the end of the year. This compares with a rough estimate of 8.6 per cent for 1845.
Figures for food production and trade (imports and exports) have been taken from the final figures published by the government in 1849 in a Parliamentary paper. 37 In effect, the calculation shows a snapshot of time for the calendar year 1847 and excluded any diseased crops which were inedible because the counts were made for goods in storage. Crops were said to be fairly reliably estimated by the government at that point in time. The energy value of commercial-farm animals have been included, and so their products such as milk, cheese, butter and meat products have been excluded, but neither has allowance been made for their food. This models the situation in which they are killed and eaten, which resembles the actual situation in places such as Cork where supplies of bacon pigs were exhausted. Nevertheless, it should be noted that the official government estimates only covered commercial farms and so the family bacon pigs owned by poor labourers are therefore missing from the analysis. For the 1845 figures, as government records were not kept of this year, an adjustment has been made to the potato quantity available as Bourke’s estimates, with other figures retained as 1847 to give a rough idea of the comparison (Table 2). 38
Total food energy available in 1847 in Ireland as a snapshot view in the autumn of that year.
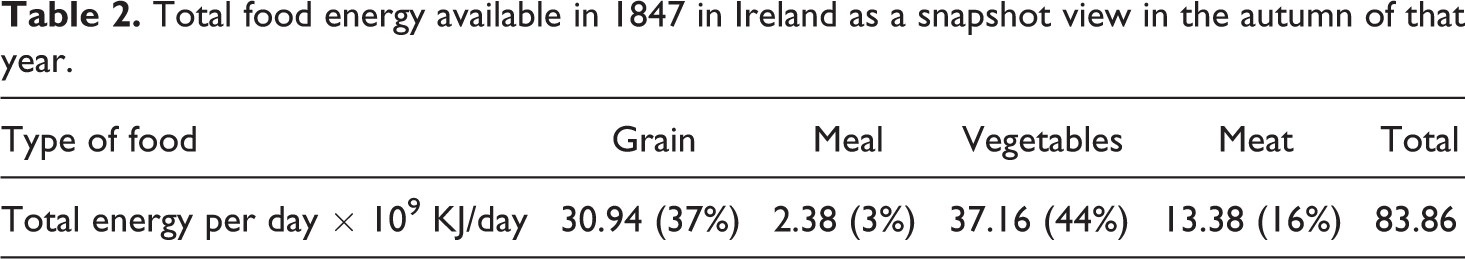
The results mean that on average everyone in Ireland would have had to eat about double the amount of meat in 1847, compared with their consumption in 1845, in order for the available food to be shared out equitably. This alternative strategy for sharing out the food when compared with the reality of the middle-class trading down and the poor losing their stock of pigs demonstrates how the Giffen effect caused considerable disruption to food supplies for the poor.
V
Famine continues to be ever present in the modern world. At the time of writing, famines exist in Syria, Iraq, Nigeria, sub-Saharan Africa, South Sudan and Yemen. Economic historians have developed the concept of measuring the integration of markets as an indication of whether the mechanisms of a price and quantity equilibrium and food allocation were operating as their theory predicted. 39 Based on this experience, the World Food Programme assesses the integration of markets in modern areas of famine and uses the result to decide whether to offer assistance in kind, cash or as food vouchers. 40
However, despite the apparent increasing political nature of famines, there seems to be no assessment by relief agencies of how the food stocks of the poor may be absorbed by the wealthier classes. The results from the Cork market data suggest that unusual market behaviour in the Irish famine took place, not in subsistence-level households consuming potatoes (Figure 6), but among the wealthier classes consuming meat (Figure 5). This conclusion concurs with Kohli’s suggestion that meat is more likely than potatoes or bread to display Giffen behaviour in famine Ireland and Doi, Iwasa and Shimomura’s conclusion that Giffen behaviour theoretically can be observed in classes of people with incomes well above subsistence levels. 41
In addition, the results can be interpreted as agreeing with Gilley and Karels as well as Jensen and Millers’s theories of a multi-slope demand line. This study could only look at the Giffen effect on the market scale, not at the individual scale. It is possible that as potatoes rose in price, only a few people were ever in the ‘subsistence zone’ with a positive demand line at one time, while many were in the below nutritional minimum group with a negative demand line. So the overall market position seems conventional. When pork and beef are looked at, however, pork takes the position of the staple good, but few of the middle classes fall below the nutritional minimum, so the population in the positive gradient demand line zone is much larger and the effect shows up overall. That is not to say that the high-income elasticity of meat, as in Kohli’s observations, did not have an effect as well.
However, the overall market effect is what matters in a famine as this is what starves a population and leaves them at the mercy of disease. The trading down of the middle classes and sudden disappearance of all edible goods among the subsistence classes from the area around Cork at the beginning of 1847 are frightening examples of unseen and misunderstood economic forces at work. The appearance of market behaviour with similarities to the Giffen effect among the wealthy would have caused substantial difficulties in the Cork area for those at the bottom of the food scale. There is considerable scope for the application of this idea in the study of more recent famines, where the middle and upper classes may absorb food stocks of cheaper food essential for the survival and health of the poor.
Footnotes
Declaration of conflicting interests
The author(s) declared no potential conflicts of interest with respect to the research, authorship, and/or publication of this article.
Funding
The author(s) disclosed receipt of the following financial support for the research, authorship, and/or publication of this article: Some of the research for this article was funded by the Arts and Humanities Research Council of the United Kingdom.