
Abstract
Background
Lidocaine applied intranasally has shown promise in treating post-dural puncture headache and has been explored as a potential treatment for cluster headache and migraine. However, the mechanisms underlying its analgesic effects remain unclear. This study aimed to determine the concentration of lidocaine that reaches target tissues after intranasal application and its impact on the excitability of trigeminal ganglion neurons.
Methods
A mouse model was used to examine lidocaine (10%) distribution after intranasal administration, employing liquid chromatography-mass spectrometry (LC-MS). Fluorescence calcium imaging with electrical field stimulation on acutely cultured murine trigeminal ganglion cells was applied to determine the effects of the pre-determined lidocaine concentrations on their excitability.
Results
After intranasal application, lidocaine concentrations ranged from approximately 2.5 μM in plasma to 7 μM in trigeminal ganglia. Calcium imaging revealed that 100 μM lidocaine was required to decrease electrical responses in capsaicin-unresponsive trigeminal ganglion neurons. In capsaicin-responsive nociceptive neurons such an inhibition was already observed at 10 μM lidocaine and these neurons also displayed a sustained increase in calcium that failed to return to baseline levels.
Conclusions
These findings suggest that intracranial lidocaine concentrations after intranasal administration are sufficiently high to selectively affect depolarized trigeminal nociceptors with ongoing activity, providing a potential mechanism for the analgesic effects of intranasally applied lidocaine. These results have implications for the use of intranasal lidocaine as a treatment for headache.
Keywords
Introduction
Approximately half of the global population experience a headache disorder within any given year. 1 This exerts not only a large physical cost 2 but headache disorders also rank among the diseases with the highest global disability burden. 3 Recent advances in treatment options include ditans, agonists at the 5-HT1F receptor that suppress CGRP release 4 and gepants, targeting the CGRP receptor, one of which is available as a nasal spray. 5 Intranasal application provides a novel, direct and expedient means for intracranial delivery that avoids both the blood brain barrier and first pass hepatic metabolization. 6 Intranasal lidocaine has emerged as a promising, fast and effective treatment for post-dural puncture headache (PDPH).7,8 In small cohorts, lidocaine has also shown some analgesic effect in various other headache conditions, for instance acute migraine,9,10 attacks of cluster headache,11–13 cluster attacks evoked by nitroglycerin, 14 and headache of varying etiology in an emergency room setting. 15
Mechanistically, lidocaine is a canonical sodium channel blocker in the mid micromolar range (IC50 = 450 µM for NaV1.7) 16 reducing the availability of voltage-gated sodium channels (NaVs) in an activity dependent manner. 17 Lidocaine is also an agonist of the nociceptive-specific TRPV1 capsaicin receptor, although this requires concentrations above 1 mM.18,19 The site of action for intranasally administered lidocaine is not yet clear. A block of the sphenopalatine ganglion (SPG) has been suggested, but not supported by modern MRI/CT 20 and cadaver studies.21,22
In the mid twentieth century, Faber 23 reported deposits of Prussian blue in the perineural spaces of the olfactory nerve after intranasal instillation in rabbits. Subsequently, it has been shown that intranasally administered peptides 24 and therapeutics 25 including lidocaine26,27 all reach the brain and CSF and typically peak in concentration within tens of minutes. More specifically, studies using radiolabelled28,29; and fluorescent (FITC: 30 ; Evans blue:28,29; IRdye800: 27 ) small molecules indicate that hydrophilic substances traverse along the olfactory and trigeminal nerves. Therefore, the principal nonvascular routes for nose-to-brain delivery are the olfactory and trigeminal nerve with transport via perineural spaces (for review see). 31
We therefore determined the tissue concentrations of lidocaine following intranasal administration in mice and checked the effect of these lidocaine concentrations on excitability of nociceptive trigeminal neurons. Tissue, serum and CSF concentrations were assessed by LC-MS after intranasal lidocaine. In-vitro fluorescent calcium imaging of acutely isolated trigeminal ganglion (TG) neurons was used to assess electrical excitability changes in response to lidocaine in capsaicin-responsive nociceptive and capsaicin-unresponsive neurons.
Material and methods
Animal ethics and housing
Experiments were performed in adult male and female C57BL/6 mice older than 9 weeks and in compliance with the guidelines for the welfare of experimental animals (animal ethic committee of the government of Baden-Württemberg, ethics approval number G-286/21 and I-24/14 (tissue collection only)) in accordance with European regulations (Council Directive 2010/63/EU September 2010) and with the 3R's guidelines. Wildtype C57BL/6N mice were purchased from Charles River Laboratories (Sulzfeld, Germany). All mice were housed with food and water ad libitum under a standard 12-h light/dark cycle (7:00 p.m.–7:00 a.m.) with a regulated ambient temperature of 22 °C and at a relative humidity of 40–50%.
Intranasal application of lidocaine
Safe, reproducible and precise delivery of lidocaine (10% w/v, 346 mM, Sigma-Aldrich, Darmstadt, Germany) to the olfactory region of the nasal cavity was achieved using a method established by Flamm et al. 32 Mice were anaesthetized transiently with 2% isoflurane (Baxter, Unterschleißheim, Germany) and placed into a supine position with their head fixed gently with one hand. The tip of a thin polyurethane catheter (Ø 0.6 mm, Nutriline, Vygon, Aachen, Germany) was dipped in ointment (Bepanthen, Bayer, Leverkusen, Germany) and then inserted to a depth of 1 cm unilaterally into the right nostril. 5 µl of 10% lidocaine in DPBS (Thermo Fisher, Karlsruhe, Germany) or vehicle was injected, over 10 s, into the upper meatus of the nasal cavity rostral to the ethmoid bone, using a 10 µl Hamilton syringe (Hamilton, Bonaduz, Switzerland). The catheter was then retracted carefully and the mouse placed in a fresh cage to recover from anesthesia.
Tissue extraction & CSF sampling
To establish the spatial distribution of lidocaine applied into the nasal cavity, mice were anesthetized with isoflurane (2%), to a depth at which nocifensive reflexes to foot pinch were abolished. The animals were then placed on a heating pad and secured in a stereotactic frame with their snout in a respiratory mask. Their eyes were closed with ointment and the head tilted downwards at an angle of 45°. The neck was shaved and a skin incision of 5 mm made from the external occipital protuberance rostro-caudally above the nuchal ligament and along the midline. The neck muscles were carefully dissected, cut and fixed to either side with custom-built hooks attached to elastomers (Fine Science Tools, Heidelberg, Germany), exposing the cisterna magna. The dura over the cisterna magna area was washed with sterile NaCl (0.9%, B. Braun, Melsungen, Germany) and dried with small cotton swabs.
CSF was collected as published before. 33 In brief, a thin borosilicate glass micropipette (Science Products, Hofheim am Taunus, Germany), attached to a syringe via a polyethylene tube, was fixed in a micromanipulator (Narashige, London, UK) and placed near the exposed cisterna magna, close to the dura. The pipette tip was advanced to indent the dura and punctured carefully, monitoring the inflow of CSF. After an average of 40 min the pipette was carefully removed. The CSF was expelled into a tube, centrifuged and flash frozen in liquid nitrogen.
After CSF collection, blood was collected from the heart, allowed to coagulate for 20 min and centrifuged at 6000 rpm for 10 min. 150–250 µl of serum was removed and flash frozen. Subsequently, the mouse was decapitated, the skull opened and the brainstem, cerebellum, trigeminal ganglia (TG) and olfactory bulbs (OB) removed, weighed and flash frozen in liquid nitrogen.
Determination of lidocaine via LC-MS
Deep frozen (−80°C) tissue samples of cerebellum, brainstem, trigeminal ganglion and olfactory bulb were disrupted in 2.0 ml Eppendorf tubes by adding 250 µl ice cold extraction solvent (acetonitrile : methanol : deionized water, 65:25:10) and placed in a ball mill (MM400, Retsch, Haan, Germany) with precooled beakers and stainless-steel balls (30 s at 25 Hz). Samples were centrifuged at 16,400 g for 15 min at 4°C and the resulting supernatant transferred to a chromatography vial.
Frozen (−80°C) liquid samples, i.e., serum and CSF, were added to 250 µl ice-cold extraction solvent (acetonitrile : methanol : deionized water, 65:25:10), sonicated in an ice bath for 5 min and vortexed vigorously. Finally, the samples were centrifuged at 26,400 g for 15 min at 4°C and the resulting supernatant was transferred to a high recovery chromatography vial.
From sample extracts, 1 µl was injected on an UPLC-MS/MS system together with an appropriate number of QC samples and a standard calibration series for absolute quantitative determination.
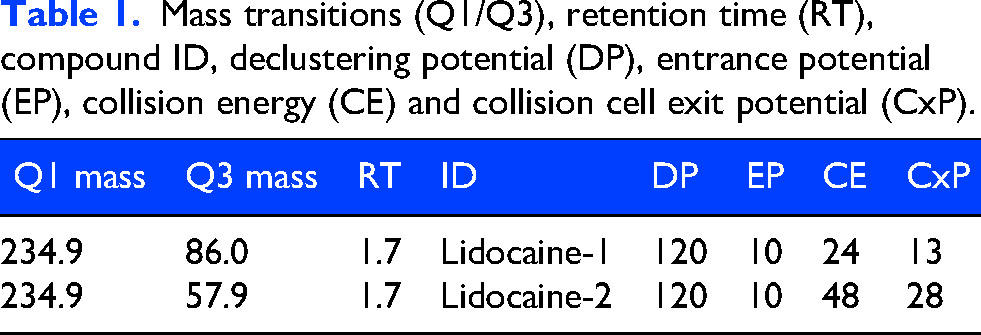
An Acquity I-class Plus UPLC system (Waters, Milford, MA, USA) coupled to a QTRAP 6500+ (Sciex, Marlborough, MA, USA) mass spectrometer with an electrospray ionization (ESI) source was used for metabolite separation and detection. In detail, metabolites were separated by reversed-phase chromatography on an Acquity BEH C18 column (50 mm×2.1 mm, 1.7 µm, Waters) kept at 35°C and at a flow rate of 0.4 ml/min. An overview of the multiple reaction monitoring (MRM) transitions that were used can be found in Table 1. Appropriate peak shape, retention and low carry-over of lidocaine was achieved by increasing the concentration of solvent B (Acetonitrile) in solvent A (5 mM ammonium acetate in deionized water, pH = 5) as follows: 0.5 min 55% B, 1.75 min 98% B, 3.78 min 98% B, 3.83 min 15% B, and keeping 15% B until 6 min. The Sciex OS software suite (Sciex) was used to perform data acquisition and processing.
Mass transitions (Q1/Q3), retention time (RT), compound ID, declustering potential (DP), entrance potential (EP), collision energy (CE) and collision cell exit potential (CxP).
Isolation of trigeminal ganglion neurons
Mice were anesthetized with isoflurane 2% and killed by cervical dislocation. Trigeminal ganglia were harvested, immediately sliced into small pieces and placed into cold sterile HBSS (Ca2+, Mg2+ added; Thermo Fisher). Tissue was transferred into 10% liberase DH (Roche, Basel, Switzerland) in HBSS and incubated for 40 min at 37°C. Cells were dissociated by trituration and transferred into 10 ml DMEM supplemented with 10% FBS and 1x penicillin-streptomycin (Thermo Fisher) and centrifuged for 2 min at 1200 rpm. The supernatant was removed, leaving only 500 µl of medium above the pellet. Trituration and addition of another 500 µl medium pre-warmed to 37°C followed. The cell solution was layered onto a 500 µl 15% BSA (Sigma-Aldrich) cushion and centrifuged for 10 min at 900 g. Next, the top 1 ml of liquid including the accumulated debris was carefully removed, resuspended and layered on top of a fresh BSA cushion and centrifuged again. The supernatant in both tubes was discarded and both cell pellets were resuspended in a total of 100 µl medium and combined. The resulting cell solution was added to 5 ml of fresh medium and centrifuged for 2 min at 1200 rpm to wash away any leftover BSA.
Glass coverslips (25 mm, Carl Roth, Karlsruhe, Germany) sitting in 35 mm petri dishes (Thermo Fisher) were pre-coated with a Laminin (5 µg/ml; Sigma Aldrich) and poly-L-lysine (0.1%, molecular weight 70.000–150.000 Da; Sigma Aldrich) mixture for 1 h at 37°C. After removing the mixture, they were coated with a droplet of diluted Laminin (1.5 µg/ml in sterile water) and air-dried. 40 µl of the cell solution was plated on the adhesive area and left for 90 min at 37°C/5% CO2. Then, 2 ml of pre-warmed medium were added per dish and the cells left at 37°C/5% CO2 overnight.
Fluorescence calcium imaging
Fluorescence calcium imaging was performed within 36 h of plating trigeminal ganglion cultures. Cells were loaded with Fluo8-AM (3 µM, AAT Bioquest, Pleasanton, CA, USA) for 20 min. The cells were subsequently rinsed with imaging solution (see Solutions) and the glass coverslip was mounted onto a stage-mounted slotted bath (RC-21 BRFS, Warner Instruments, Holliston, MA, USA bath volume 263 µl). The bath was continuously perfused with imaging solution using a custom-built gravity-driven flow system. Electrical field stimulation was delivered via 2 built-in platinum wire electrodes running along both sides of the imaging chamber. Chemical stimuli were applied by manually switching between reservoirs of the perfusion system.
The imaging system was the same as used in 34 comprising an inverted microscope (Axiovert 200, Zeiss, Oberkochen, Germany), equipped with a 10x objective (Neofluar, Zeiss), a back-illuminated EMCCD camera (Evolve 512, Photometrics, Tucson, AZ, USA), a 465 nm LED light source (Prior Scientific Instruments, Cambridge, UK) and a filter set with excitation BP 450–490 nm, dichroic 510 nm and emission LP 515 nm (Chroma Technologies, Bellows Falls, VT, USA). µManager35,36 software was used to acquire fluorescence images with coordination of the frame grabber, LED and stimulator controlled by a custom script implemented on an Arduino Duemilanove (Smart Projects, Ivrea, Italy). Fluorescence image sequences were acquired at 4 Hz. A baseline series of images was first recorded for at least 1 min prior to either electrical or chemical stimuli. Electrical stimuli were delivered using a bipolar constant current stimulator (DS7A Digitimer Ltd, Welwyn Garden City, UK) controlled via an AD board (NI USB-6221, National Instruments, Austin, TX, US) using custom software (Dapsys 8.0, Brian Turnquist, Minnesota, USA). The stimulation protocol consisted of bouts of 50 mA current delivered as 1 ms rectangular stimuli in 1, 2 and 4 consecutive pulses at a frequency of 4 Hz and 20 s interval in between stimuli. The time in between each sequence of 1, 2, and 4 pulses was 60 s and they were repeated for 6 or 7 times (see Figure 2A, 3A & 4A) before chemicals were perfused onto the cells. At the end of each protocol, a solution containing 45 mM potassium was used to identify functional neurons.
Image analysis
Image stacks were analyzed in ImageJ. 37 Initially, a brightfield image was used to identify individual cells and each of these was manually encircled with the elliptical selection tool to generate a circular region of interest (ROI). Ten additional ROIs not containing cells were averaged to determine the background fluorescence. For each cell-based ROI the average fluorescence intensity (F) was calculated for each image and corrected for background fluorescence by subtraction. Fluorescence signals were normalized by division to the average of the values of the first 30 s (F0) of the recording for each ROI/cell, to generate a normalized value (F/F0).
Owing to the different kinetics of electrically-induced and chemically-induced calcium signals, we used two different approaches to determine responsive neurons adapted to the different time course of each response. Responsiveness to chemical stimuli was determined using a threshold-based method. Responses were deemed positive if the mean fluorescence value during the 15 s immediately after stimulation onset was greater than the mean value during the 15 s immediately before stimulation plus 5-fold its standard deviation. For electrical stimulation, responses were considered positive if a one-sided t-test comparing 9 values during stimulation (2.25 s) with the 9 values immediately before stimulation was significantly different at p < 0.05.
Electrically-evoked calcium signals were further quantified by determining amplitude, change in amplitude, and time required to reduce the peak increase by 50%. The amplitude was calculated by averaging the 4 highest values during stimulation and normalized by subtracting the baseline level immediately before. Half duration was calculated by assessing the time for which the calcium transient was still above 50% of the maximum.
We retrospectively analyzed neurons that showed spontaneous activity. They were defined by a coefficient of variation in the initial baseline period before the first electrical stimulation (2 min) of > 0.03 and sudden increases of the calcium signal > 0.2 F/F0 lasting at least 5 s in the same baseline period.
Chemicals and solutions
The standard calcium imaging solution comprised 140 mM NaCl, 5 mM KCl, 10 mM HEPES, 10 mM D-Glucose, 2 mM CaCl2 and 1 mM MgCl2. pH was adjusted to 7.4 using NaOH. For the potassium-rich depolarizing solution 40 mM NaCl was replaced with an equimolar amount of KCl. Lidocaine hydrochloride monohydrate and capsaicin were both purchased from Sigma-Aldrich. Stock solutions were prepared in advance at 1 M in PBS and 50 mM in DMSO, respectively. The desired concentration of each substance was achieved by dilution from stock into the imaging solution perfusing the bath on the day of each experiment.
Statistical analysis
This study is reported in accordance with the ARRIVE guidelines for observational study reporting guidelines. 38 Data was analyzed using GraphPad Prism 10 (Dotmatics, Boston, MA, USA) and Statistica 7.0 (StatSoft, Tulsa, OK, USA). Data was tested for normality and group comparisons were made using indicated tests such as t-tests, ANOVA and associated post hoc tests as indicated. Group data are presented as mean ± s.d.. The level of significance to designate an effect was set at p < 0.05. The number of samples was considered n = one cell for calcium imaging experiments, and n = one tissue biopsy for mass spectrometric analysis.
Results
Distribution of lidocaine after intranasal application
Lidocaine concentrations 90 to 120 min after intranasal application of 5 µl lidocaine (10% w/v, ca. 346 mM) were assessed in tissue and liquid samples by LCMS. In all of our analyses, the limit of detection for lidocaine was 1 nM.
Lidocaine concentrations in neuronal tissues varied around 10 µM, from 12.1 µM (IQR 6.7–14.7) in the olfactory bulb (OB), 10.1 µM (IQR 7.3–15.3) in the brainstem (BS), 6.91 µM (IQR 5.0–11.6) in the trigeminal ganglion (TG) to 6.95 µM (IQR 5.5–8.5) in the caudal cerebellum (Cer) (Figure 1A&B). In contrast, the lidocaine concentration in serum of 2.67 µM (IQR 1.9–3.2) was significantly lower than that in any of the tissue samples (Figure 1B; Welch's ANOVA with Dunnett's T3 multiple comparisons test W(5, 13.01) = 14.79: OB vs. serum p = 0.003, BS vs. serum p = 0.001, TG vs. serum p = 0.03, Cer. vs. serum p = 0.03). Systemic levels did not differ from the lidocaine concentration of 3.14 µM (IQR 1.7–5.0) in CSF (p = 0.9, Figure 1C), which was also lower than most of the tissue samples (OB vs. CSF p = 0.005, BS vs. CSF p = 0.003, TG vs. CSF p = 0.07, Cer. vs. CSF p = 0.06). Of note, no lidocaine was detected in samples taken after intranasal administration of the vehicle (Figure 1C). Overall, we noted no variability in lidocaine concentrations in the various neural tissues assessed and we hypothesize that the feasibility constraints of our sampling strategy and the potential existence of intra-tissue lidocaine gradients have contributed to the observed variability.
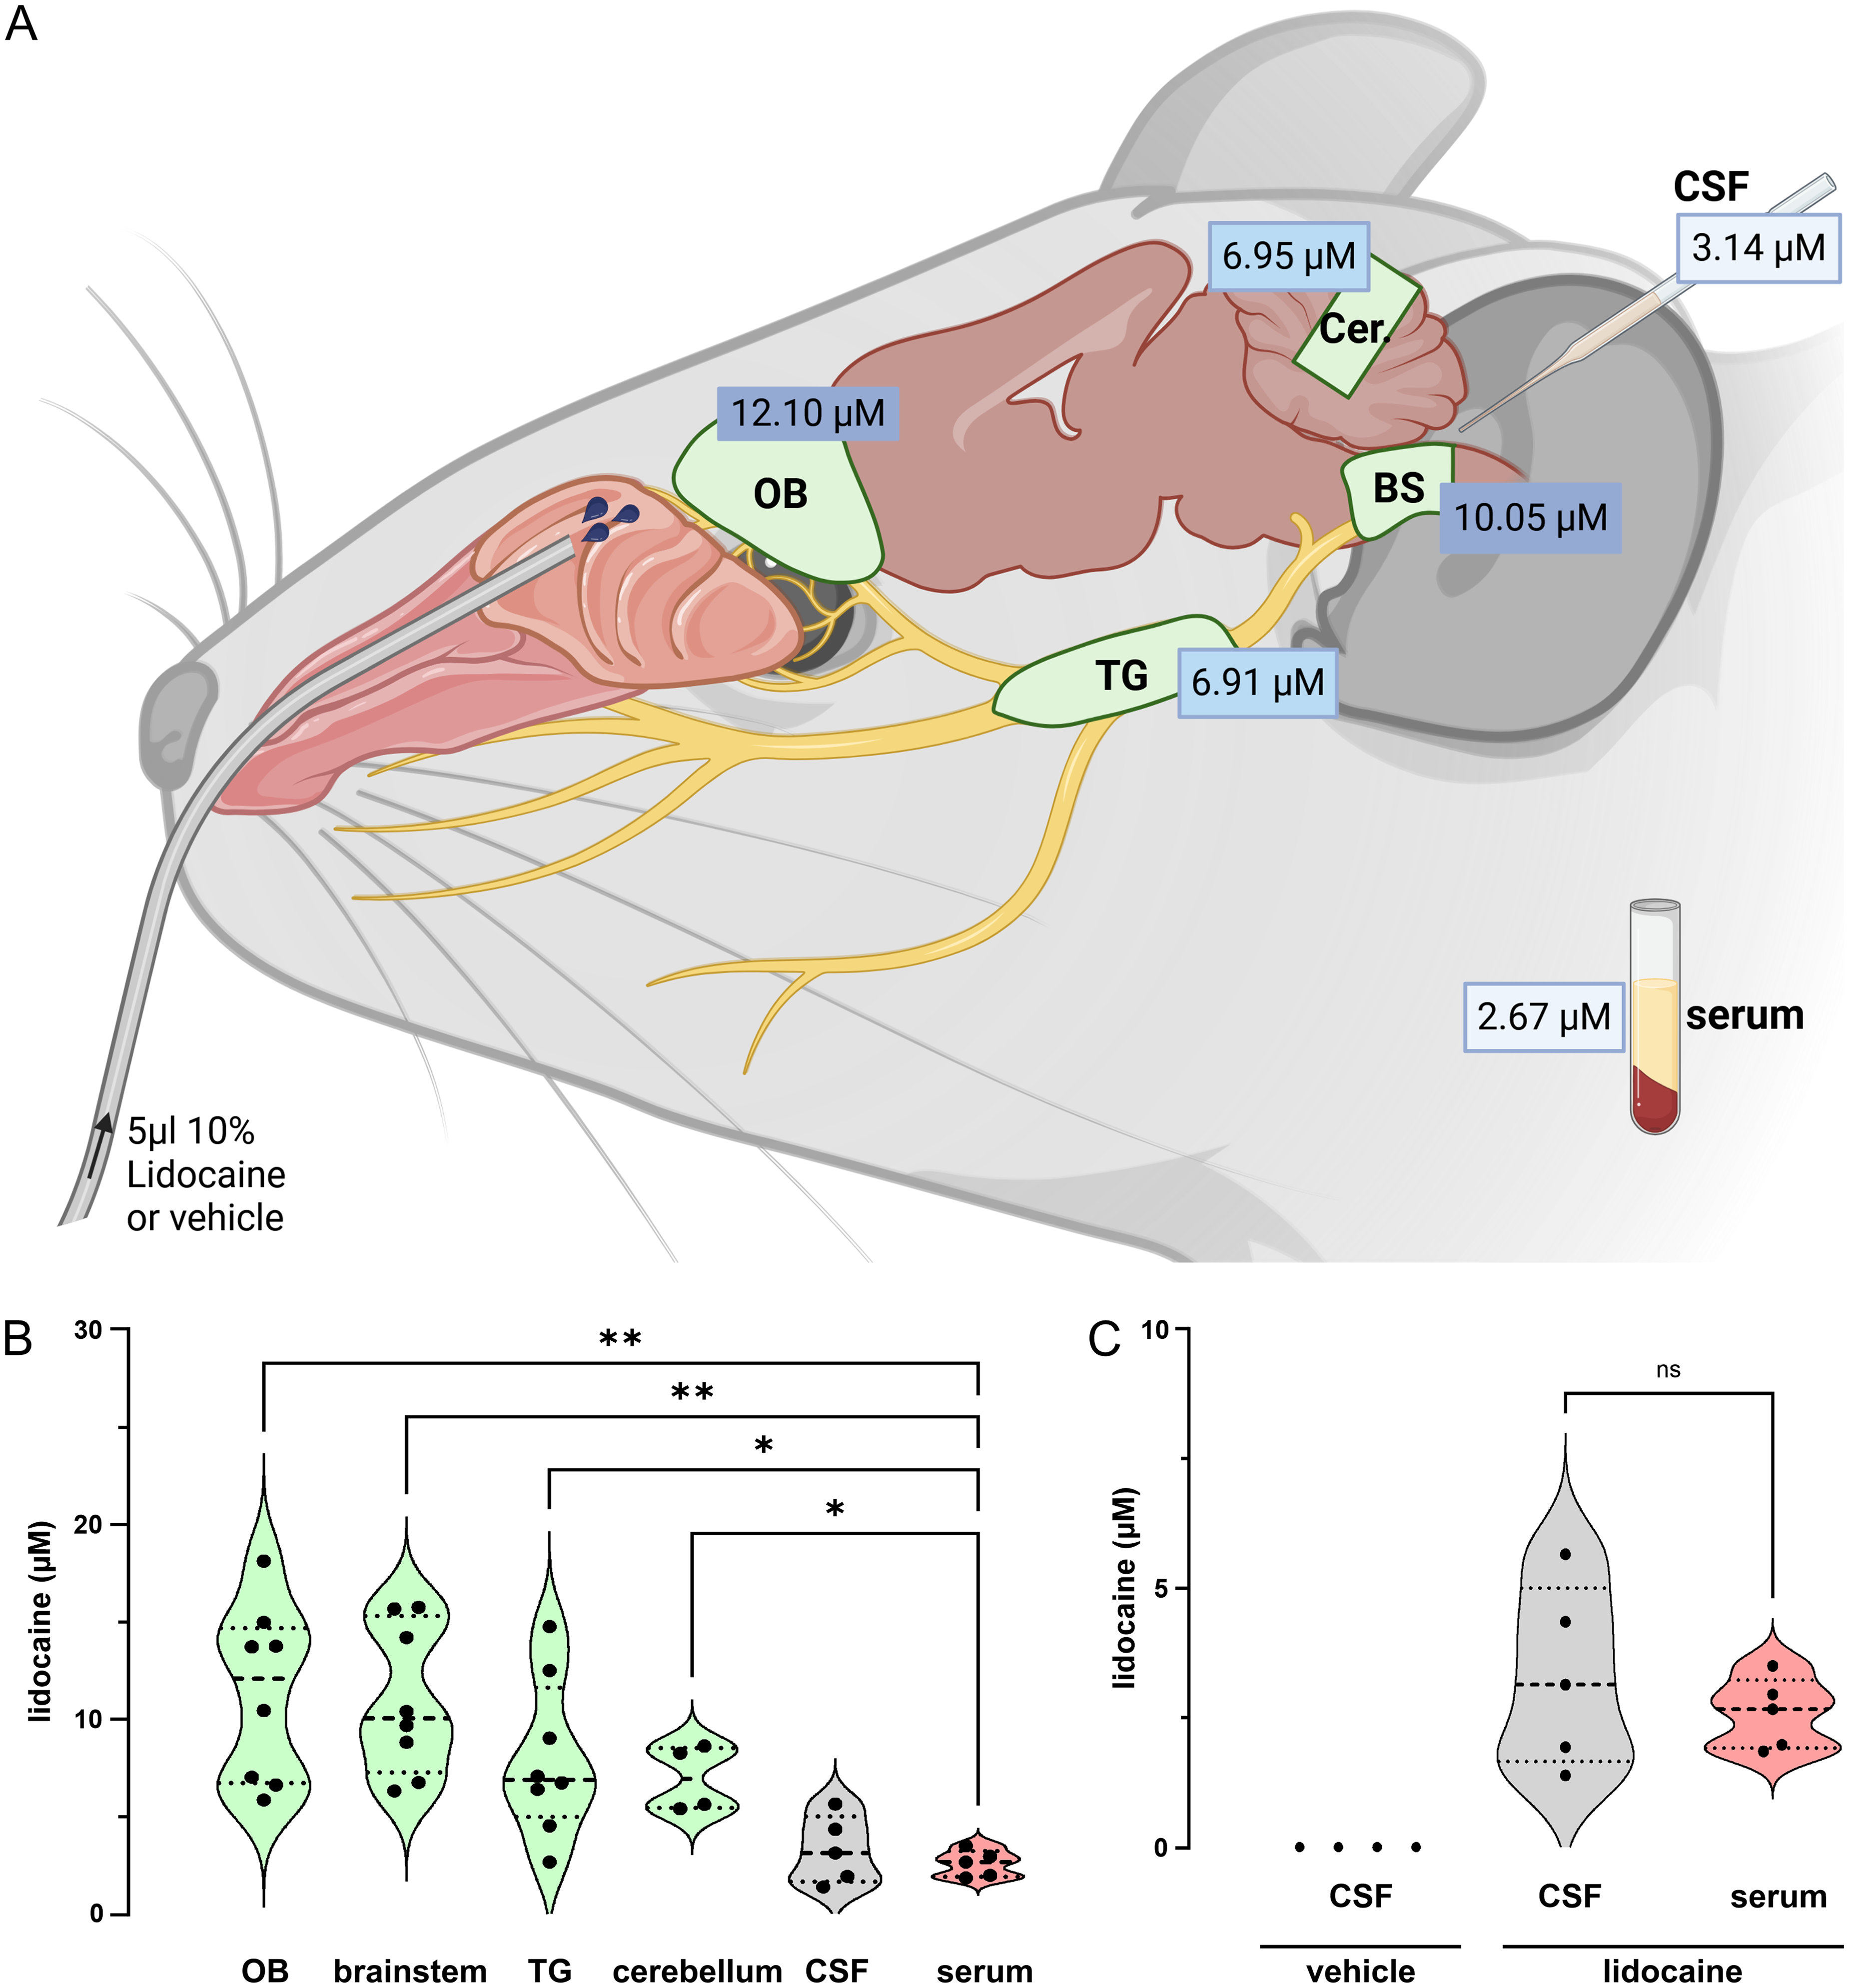
Distribution of intranasal lidocaine. Concentrations of lidocaine quoted as median values (A) and shown in violin plots (B&C) with median (thick dashed line) and quartile (dotted line) values determined by LC-MS in tissue from the olfactory bulb (OB, n=8), trigeminal ganglion (TG, n=8), cerebellum (Cer., n=4), pontomedullary brainstem (BS, n=8) together with liquid samples (C) from cerebrospinal fluid (CSF, n=5) and serum (n=5) following intranasal delivery of 10% lidocaine in 5 mice (saline control in 4 mice).
Electrically-evoked calcium signals in TG neurons
Neuronal excitability was assessed with an electrical stimulation protocol comprising individual bouts of 1, 2 and 4 rectangular pulses at 4 Hz each separated by a 20 s interval (insert, Figure 2A). As expected, calcium responses increased in amplitude with the number of pulses delivered for both, capsaicin-responsive (red traces, Figure 2A-D; 2-way ANOVA main effect pulse number F(2, 141) = 11.06, p < 0.01) and capsaicin-unresponsive neurons (blue traces, Figure 2A-D; 2-way ANOVA main effect pulse number F(2, 93) = 4.24, p < 0.05). We first tested the repetition effect of our electrical stimulation protocol by applying 7 consecutive bouts of electrical stimulation at intervals of 100 s under control conditions. Comparison of the calcium transients to 1, 2 and 4 pulses during the first and last of these stimulation bouts revealed marked differences (specimen from A in Figure 2B, group averages in Figure 2C) distinguishing neurons responding to capsaicin (red Cap+ in Figure 2B&C) from capsaicin-unresponsive neurons (blue Cap- in Figure 2B&C). The amplitude of calcium transients decreased over the seven stimulus bouts in response to 1 pulse (left Figure 2D; 2-way ANOVA main effect stim bout F(6, 468) = 9.97, p < 0.01), 2 pulses (centre Figure 2D; 2-way ANOVA main effect stim bout F(6, 468) = 15.42, p < 0.01) and 4 pulses (right Figure 2D; 2-way ANOVA main effect stim bout F(6, 468) = 26.05, p < 0.01) and this behavior was much more pronounced for capsaicin-responsive cells at 1 pulse (2-way ANOVA, interaction Cap± x stim bout F (6, 468) = 2.41, p < 0.05), 2 pulses (2-way ANOVA, interaction Cap± x stim bout F (6, 468) = 6.494, p < 0.01), and 4 pulses (2-way ANOVA, interaction Cap± x stim bout F (6, 468) = 10.54, p < 0.01).
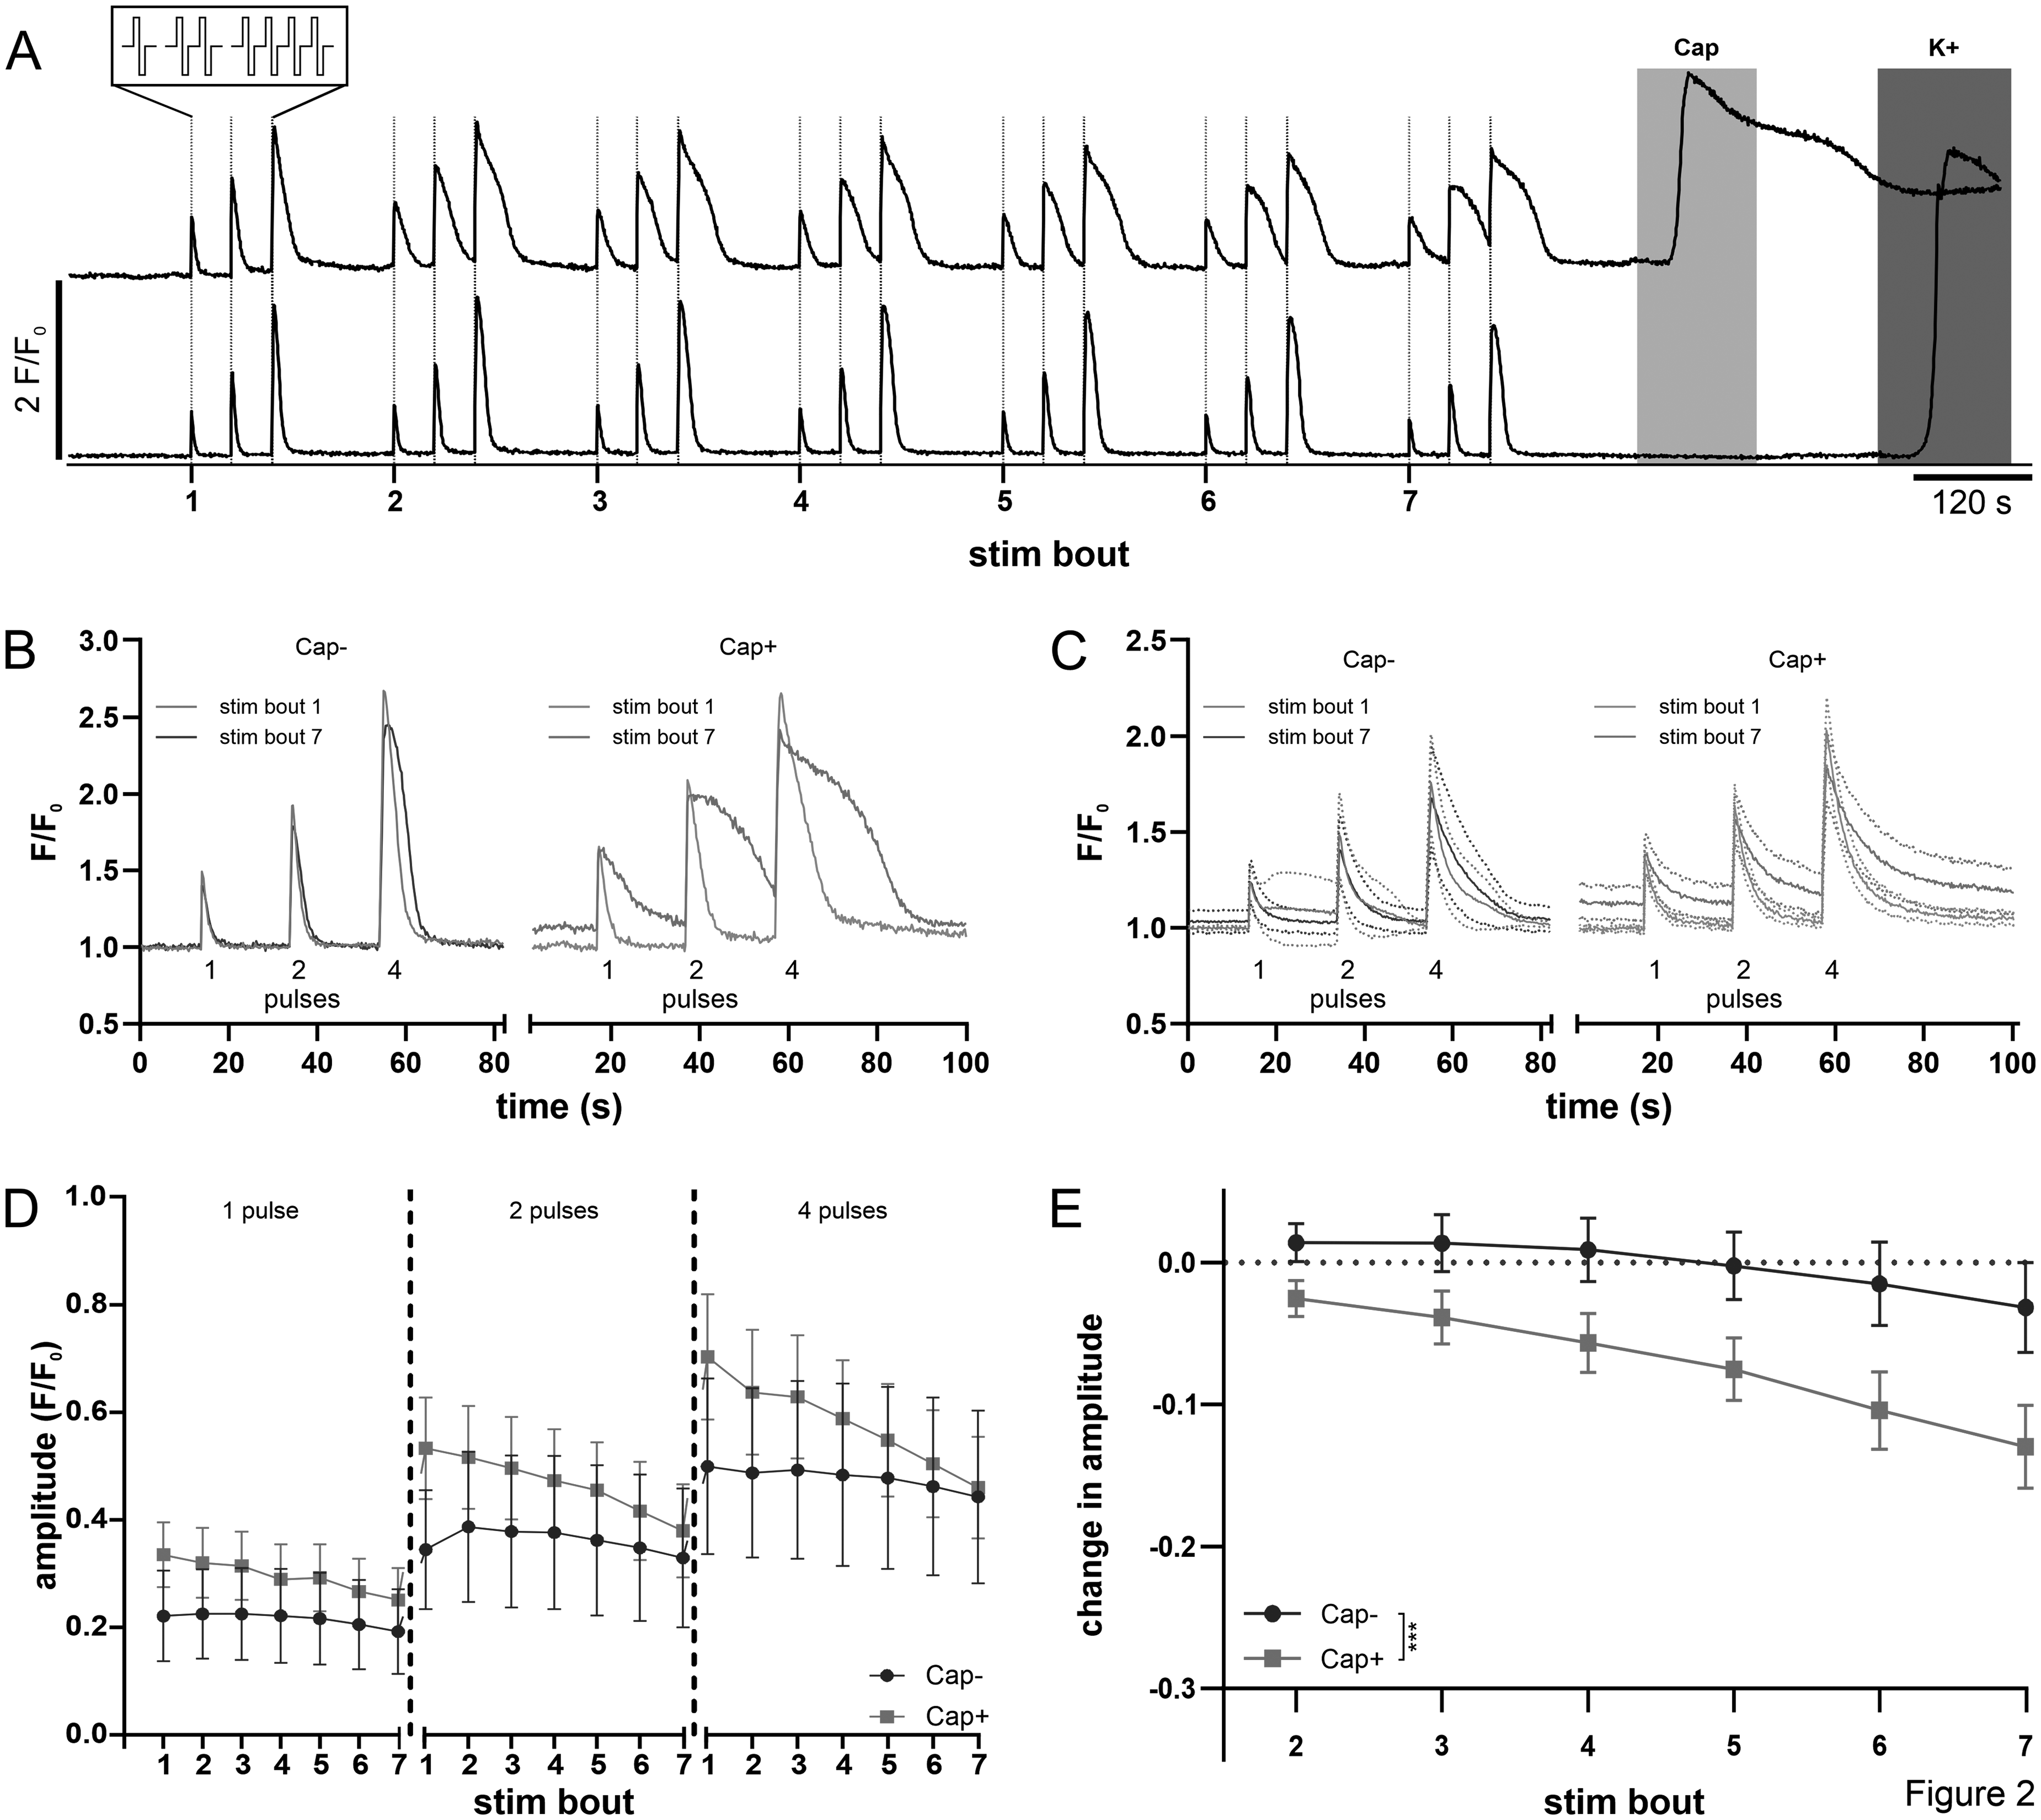
Effect of repeat bouts of electrical stimulation on calcium responses in TG neurons. A: Fluorescent calcium signals in TG neurons in response to repeat bouts of electrical stimulation as illustrated by representative traces in two individual TG neurons, one responsive to capsaicin (upper trace Cap+) and a second not responsive to capsaicin (lower trace, Cap-). TG neurons were stimulated with bouts of electrical stimulation comprising 1, 2 and 4 rectangular pulses (4 Hz @ 50 mA each, see expanded insert) indicated with vertical lines. Seven successive bouts of electrical stimulation were followed by chemical stimulation with capsaicin (0.5 µM, red shading) and potassium (45 mM, blue shading). B: Comparison of calcium responses to the first and last of seven bouts of electrical stimulation (B) for the individual capsaicin-unresponsive (B, left blue) and capsaicin-responsive (B, right red) TG neurons shown in panel A. C: Averaged calcium traces (solid lines) with 95% CI (dotted lines) for all cells responding to electrical stimulation (left, Cap- n=32; right, Cap+ n=48) in response to the first and last of seven bouts of electrical stimulation. Data were collected from 5 culture dishes harboring neurons isolated from 2 mice. D+E: Pooled data for mean amplitudes of calcium responses to 1 (left), 2 (centre) and 4 (right) electrical pulses amongst capsaicin-responsive (Cap+ n=48, red) and unresponsive neurons (Cap- n=32, blue) and the difference in response amplitude for each electrical stimulus bout compared to the initial bout (E).
In order to clearly illustrate the repetition effect, we condensed responses to 1, 2 and 4 pulses: for each repetition, the amplitude of the first response was subtracted (separately for each pulse number) and these normalized responses were averaged (Figure 2E). Neurons responsive to capsaicin showed a more prominent reduction upon repeated electrical stimulation compared to those unresponsive to capsaicin (Figure 2E; 2-way ANOVA, interaction stim bout x Cap±, F(5545) = 6.31 p < 0.01). Moreover, with repetition of electrical stimulation there was a slowing in the recovery time course of the calcium transient (see Figure 2B&C). This is reflected in the broadening of the transient response in capsaicin-responsive neurons with the half-width of the transient response to 4 pulses of electrical stimulation increasing from an average of 4.7 ± 2.5 s to 7.5 ± 5.4 s (two-tailed paired t-test, p < 0.01). In contrast, we did not observe this broadening to a similar extent in capsaicin-unresponsive neurons showing only a slight increase from 3.6 ± 3.4 s to 4.5 ± 3.5 s between the first and last stimulation bout (two-tailed paired t-test, p = 0.035).
Effect of intermittent lidocaine on calcium responses to electrical stimulation in TG neurons
The effect of lidocaine (0.1, 1 and 100 µM) on electrically induced calcium transients was tested by intermittent application (selected but nonetheless typical traces for Cap + and Cap- cells in Figure 3A). Averaged calcium transients before and during lidocaine remained fairly stable for capsaicin-unresponsive neurons (Figure 3B). In contrast, capsaicin-responsive neurons showed some increase in baseline and broader calcium responses at 1 and 100 µM (Figure 3C).
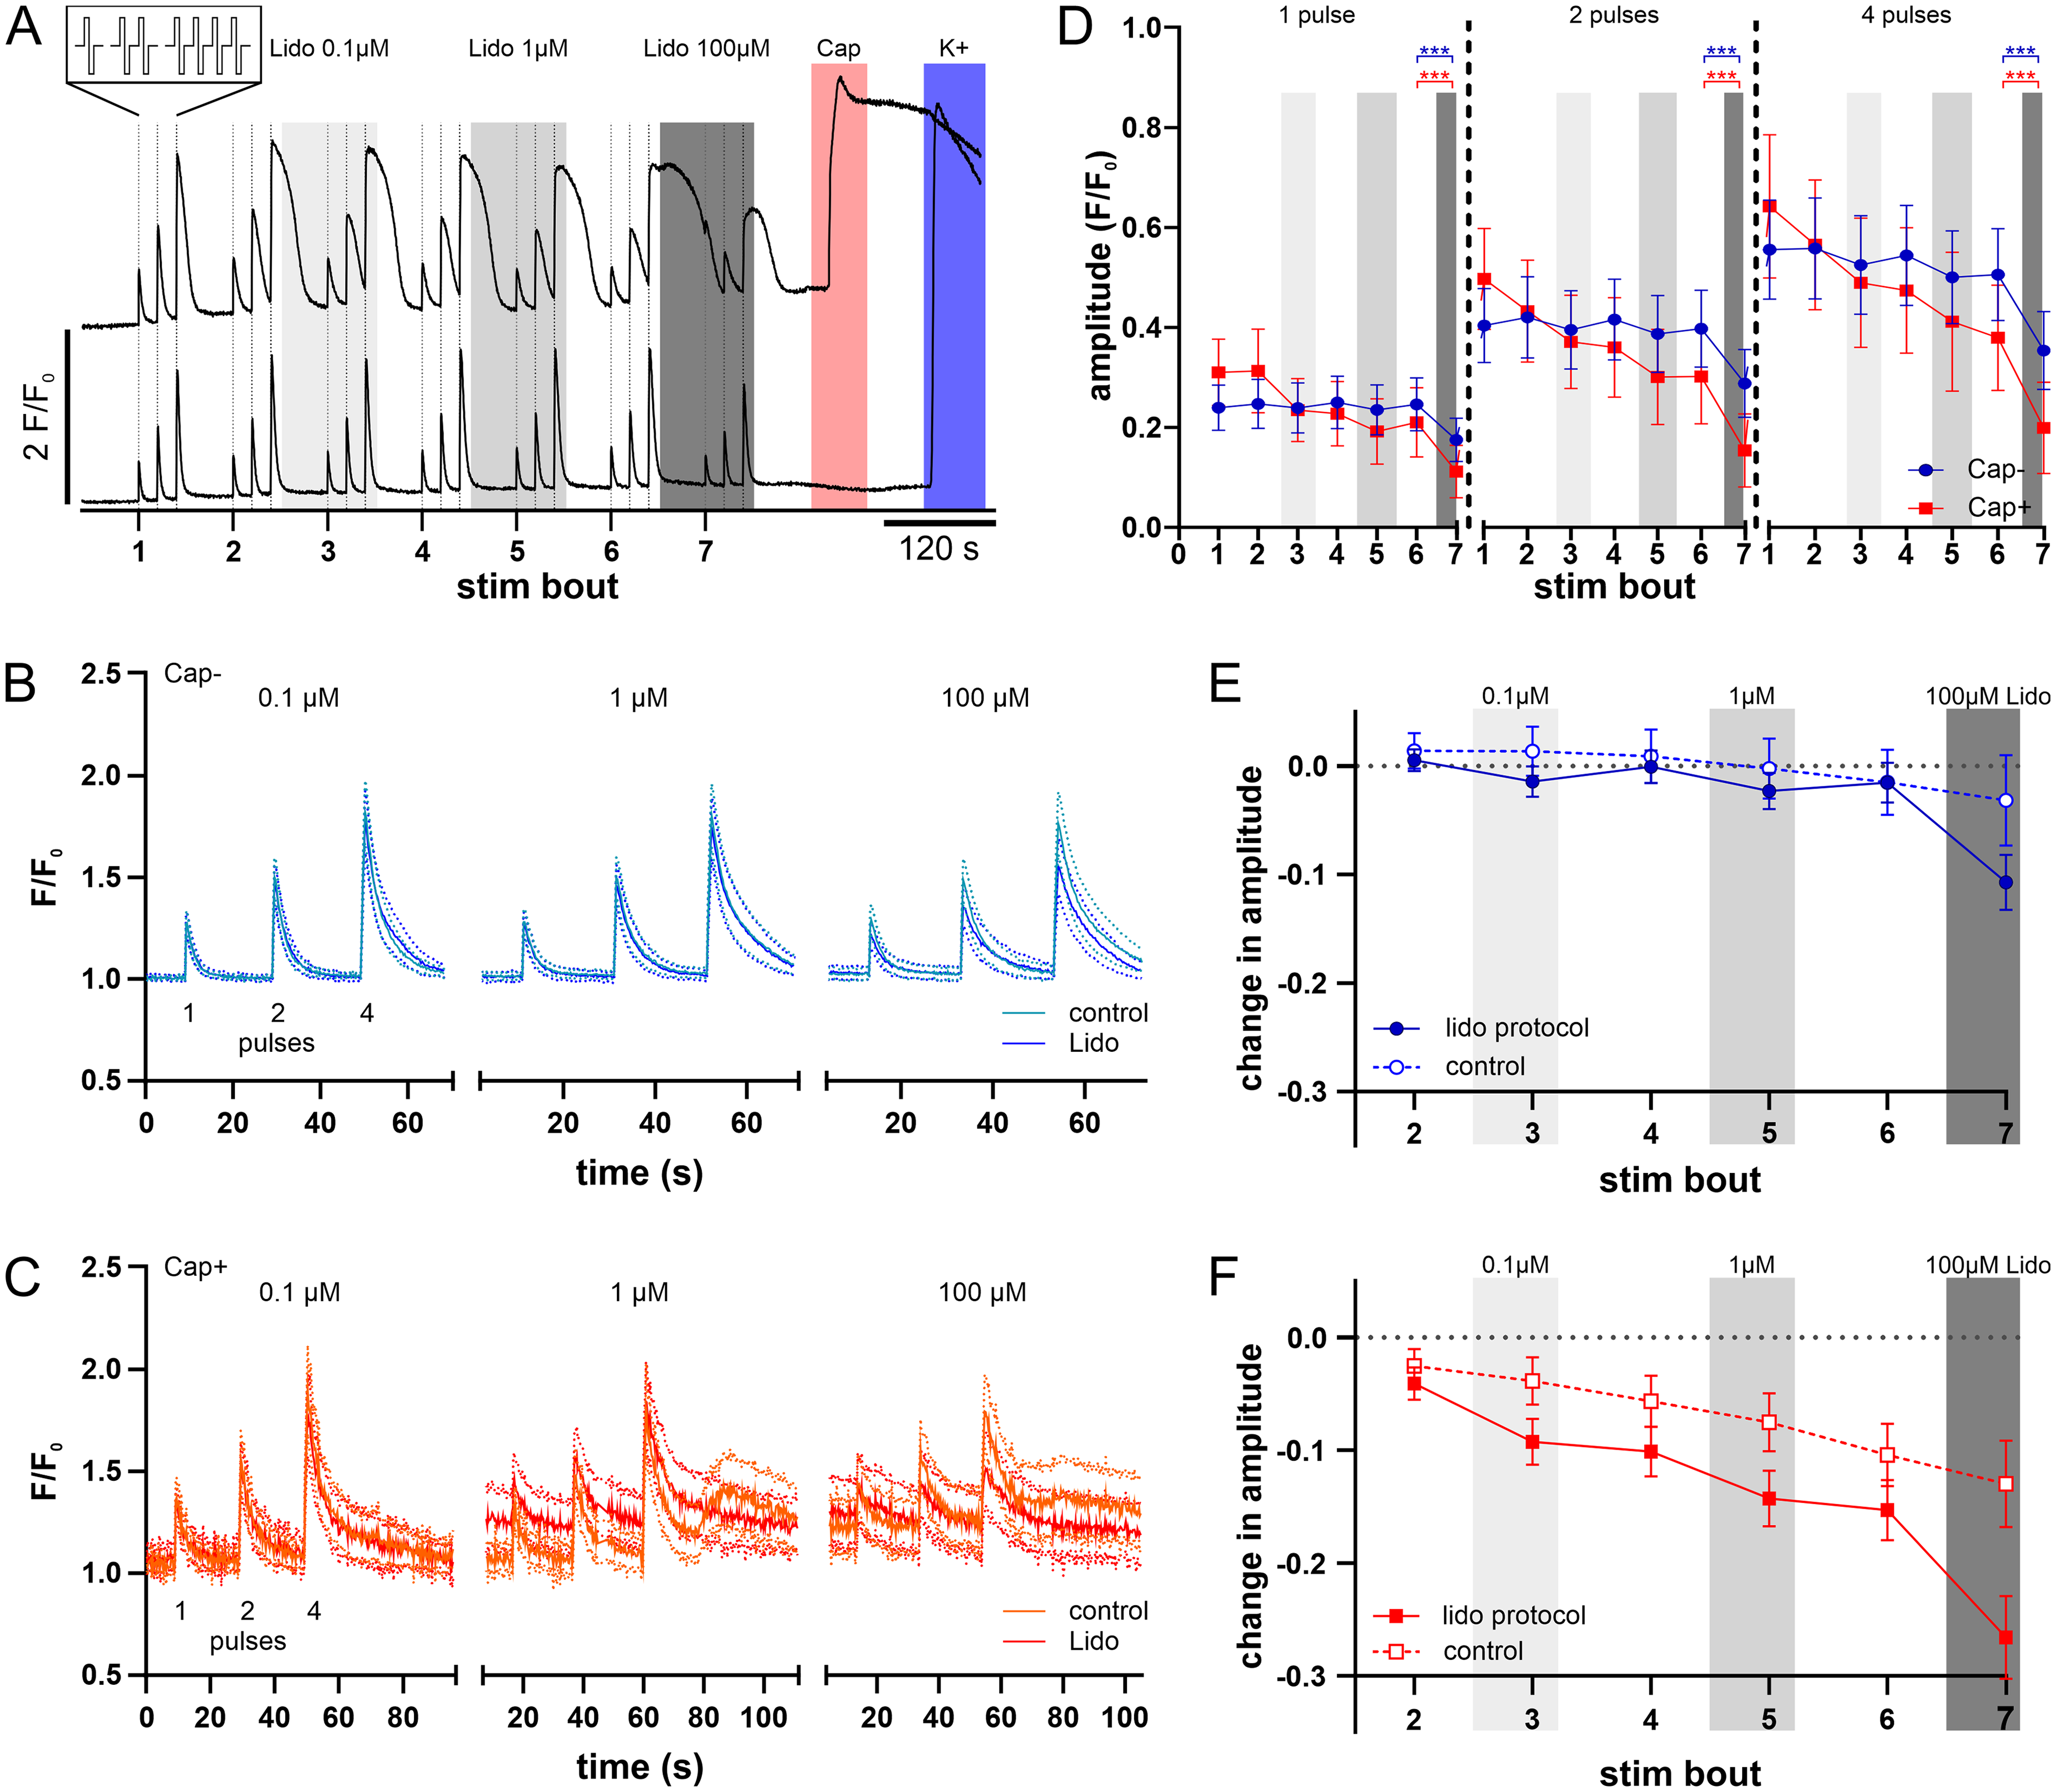
Effect of intermittent lidocaine on calcium responses to repeat bouts of electrical stimulation in TG neurons. A: Fluorescent calcium signals illustrated by representative traces in two individual TG neurons, one responsive to capsaicin (upper trace Cap+) and a second not responsive to capsaicin (lower trace, Cap-). TG neurons were stimulated with repeat bouts of electrical stimulation comprising 1, 2 and 4 rectangular pulses (4 Hz @ 50 mA, see expanded insert) indicated with vertical lines. Seven successive bouts of electrical stimulation were interleaved with lidocaine (0.1–100 µM, grey shading) exposure and this was followed by chemical stimulation with capsaicin (0.5 µM, red shading) and potassium (45 mM, blue shading). B&C: Averaged calcium traces (solid lines) with 95% CI (dotted lines) for all electrically responsive cells in capsaicin-unresponsive (B, Cap-, n=107) and capsaicin-responsive (C, Cap+, n=35) TG neurons in response to stimulation bouts directly before and during lidocaine at 0.1 µM (left, stim bout 2 light blue or orange, stim bout 3 dark blue or red), 1 µM (centre, stim bout 4 light blue or orange, stim bout 5 dark blue or red) and 100 µM (right, stim bout 6 light blue or orange, stim bout 7 dark blue or red). Data were collected from 6 culture dishes harboring neurons isolated from 2 mice. D: Pooled data for mean amplitudes of calcium responses to 1 (left), 2 (centre) and 4 (right) electrical pulses amongst capsaicin-responsive (Cap+, red, n=35) and unresponsive TG neurons (Cap-, blue, n=107). Calcium responses to 1 electrical pulse (left panel; 2-way ANOVA, main effect CAP± F (1, 149) = 0.012, p=0.91), 2 electrical pulses (center panel; 2-way ANOVA, main effect CAP± F (1, 149) = 0.4022, p=0.53) or 4 electrical pulses (right panel; 2-way ANOVA, main effect CAP± F (1, 149) = 0.4447, p=0.51) did not differ significantly between capsaicin-responsive and -unresponsive (Cap±) neurons. E-F: Pooled data for the difference in response amplitude for each electrical stimulus bout compared to the initial bout for capsaicin-unresponsive (E) and capsaicin-responsive neurons (F), each compared to the corresponding control protocol from figure 2 (dashed lines).
Lidocaine application up to 1 µM did not change the response amplitude to 1, 2 or 4 pulses in capsaicin-unresponsive neurons (Figure 3D, blue lines). However, at 100 µM the amplitude was reduced compared to the preceding stimulation (2-way ANOVA main effect stim bout F(6, 1908) = 103.6, p < 0.01; p < 0.01, Tukey's multiple comparisons test stim 6 vs. stim 7) at 1, 2, and 4 pulses. Similarly, calcium amplitudes in capsaicin-responsive neurons were reduced by 100 µM lidocaine for 1, 2 and 4 pulses (Figure 3D red lines, 2-way ANOVA main effect stim bout F(6, 774) = 74.30, p < 0.01; p < 0.01, Tukey's multiple comparisons test, stim 6 vs. stim 7). Overall, responses of capsaicin-unresponsive and capsaicin-responsive neurons to 1, 2 or 4 pulses did not differ significantly (Figure 3D). However, capsaicin-responsive neurons showed a more pronounced decline upon repetition resulting in significantly different response patterns for 1 pulse (2-way ANOVA, interaction stim bout x Cap±, F (6, 894) = 13.15, p < 0. 01), 2 pulses (2-way ANOVA, interaction stim bout x Cap±, F(6, 894) = 17.69, p < 0.01), and 4 pulses (2-way ANOVA, interaction stim bout x Cap±, F(6, 894) = 13.93, p < 0.01) (Figure 3D).
To differentiate the previously observed run down effect of repeated stimulation as shown in Figure 2 from the lidocaine-induced changes, we normalized the mean amplitude changes in stimulation bouts 2–7 by subtracting the initial calcium response (Figure 3E&F). Intermittent lidocaine application reduced the normalized amplitude compared to control (3-way ANOVA protocol x stim bout F(5, 1555) = 14.6, p < 0.01). However, no significant difference was found between capsaicin-responsive and capsaicin-unresponsive neurons (3-way ANOVA, interaction stim bout x protocol x Cap±, F(5,1555) = 1.19, p = 0.31) (Figure 3E, F).
Progressively increasing lidocaine inhibits electrically induced calcium responses in TG neurons
The progressive increase of lidocaine concentrations upon intranasal application in situ was emulated in our in vitro system by stepwise increasing lidocaine concentration (1, 10, and 100 µM) after two control stimulation bouts (Figure 4A). As observed previously, capsaicin-unresponsive neurons responded faithfully throughout repetitions (Figure 4B), whereas capsaicin-responsive neurons exhibited a broadening of electrically evoked calcium transients, as well as an increase in baseline calcium levels, especially under 10 and 100 µM lidocaine treatment (Figure 4C).
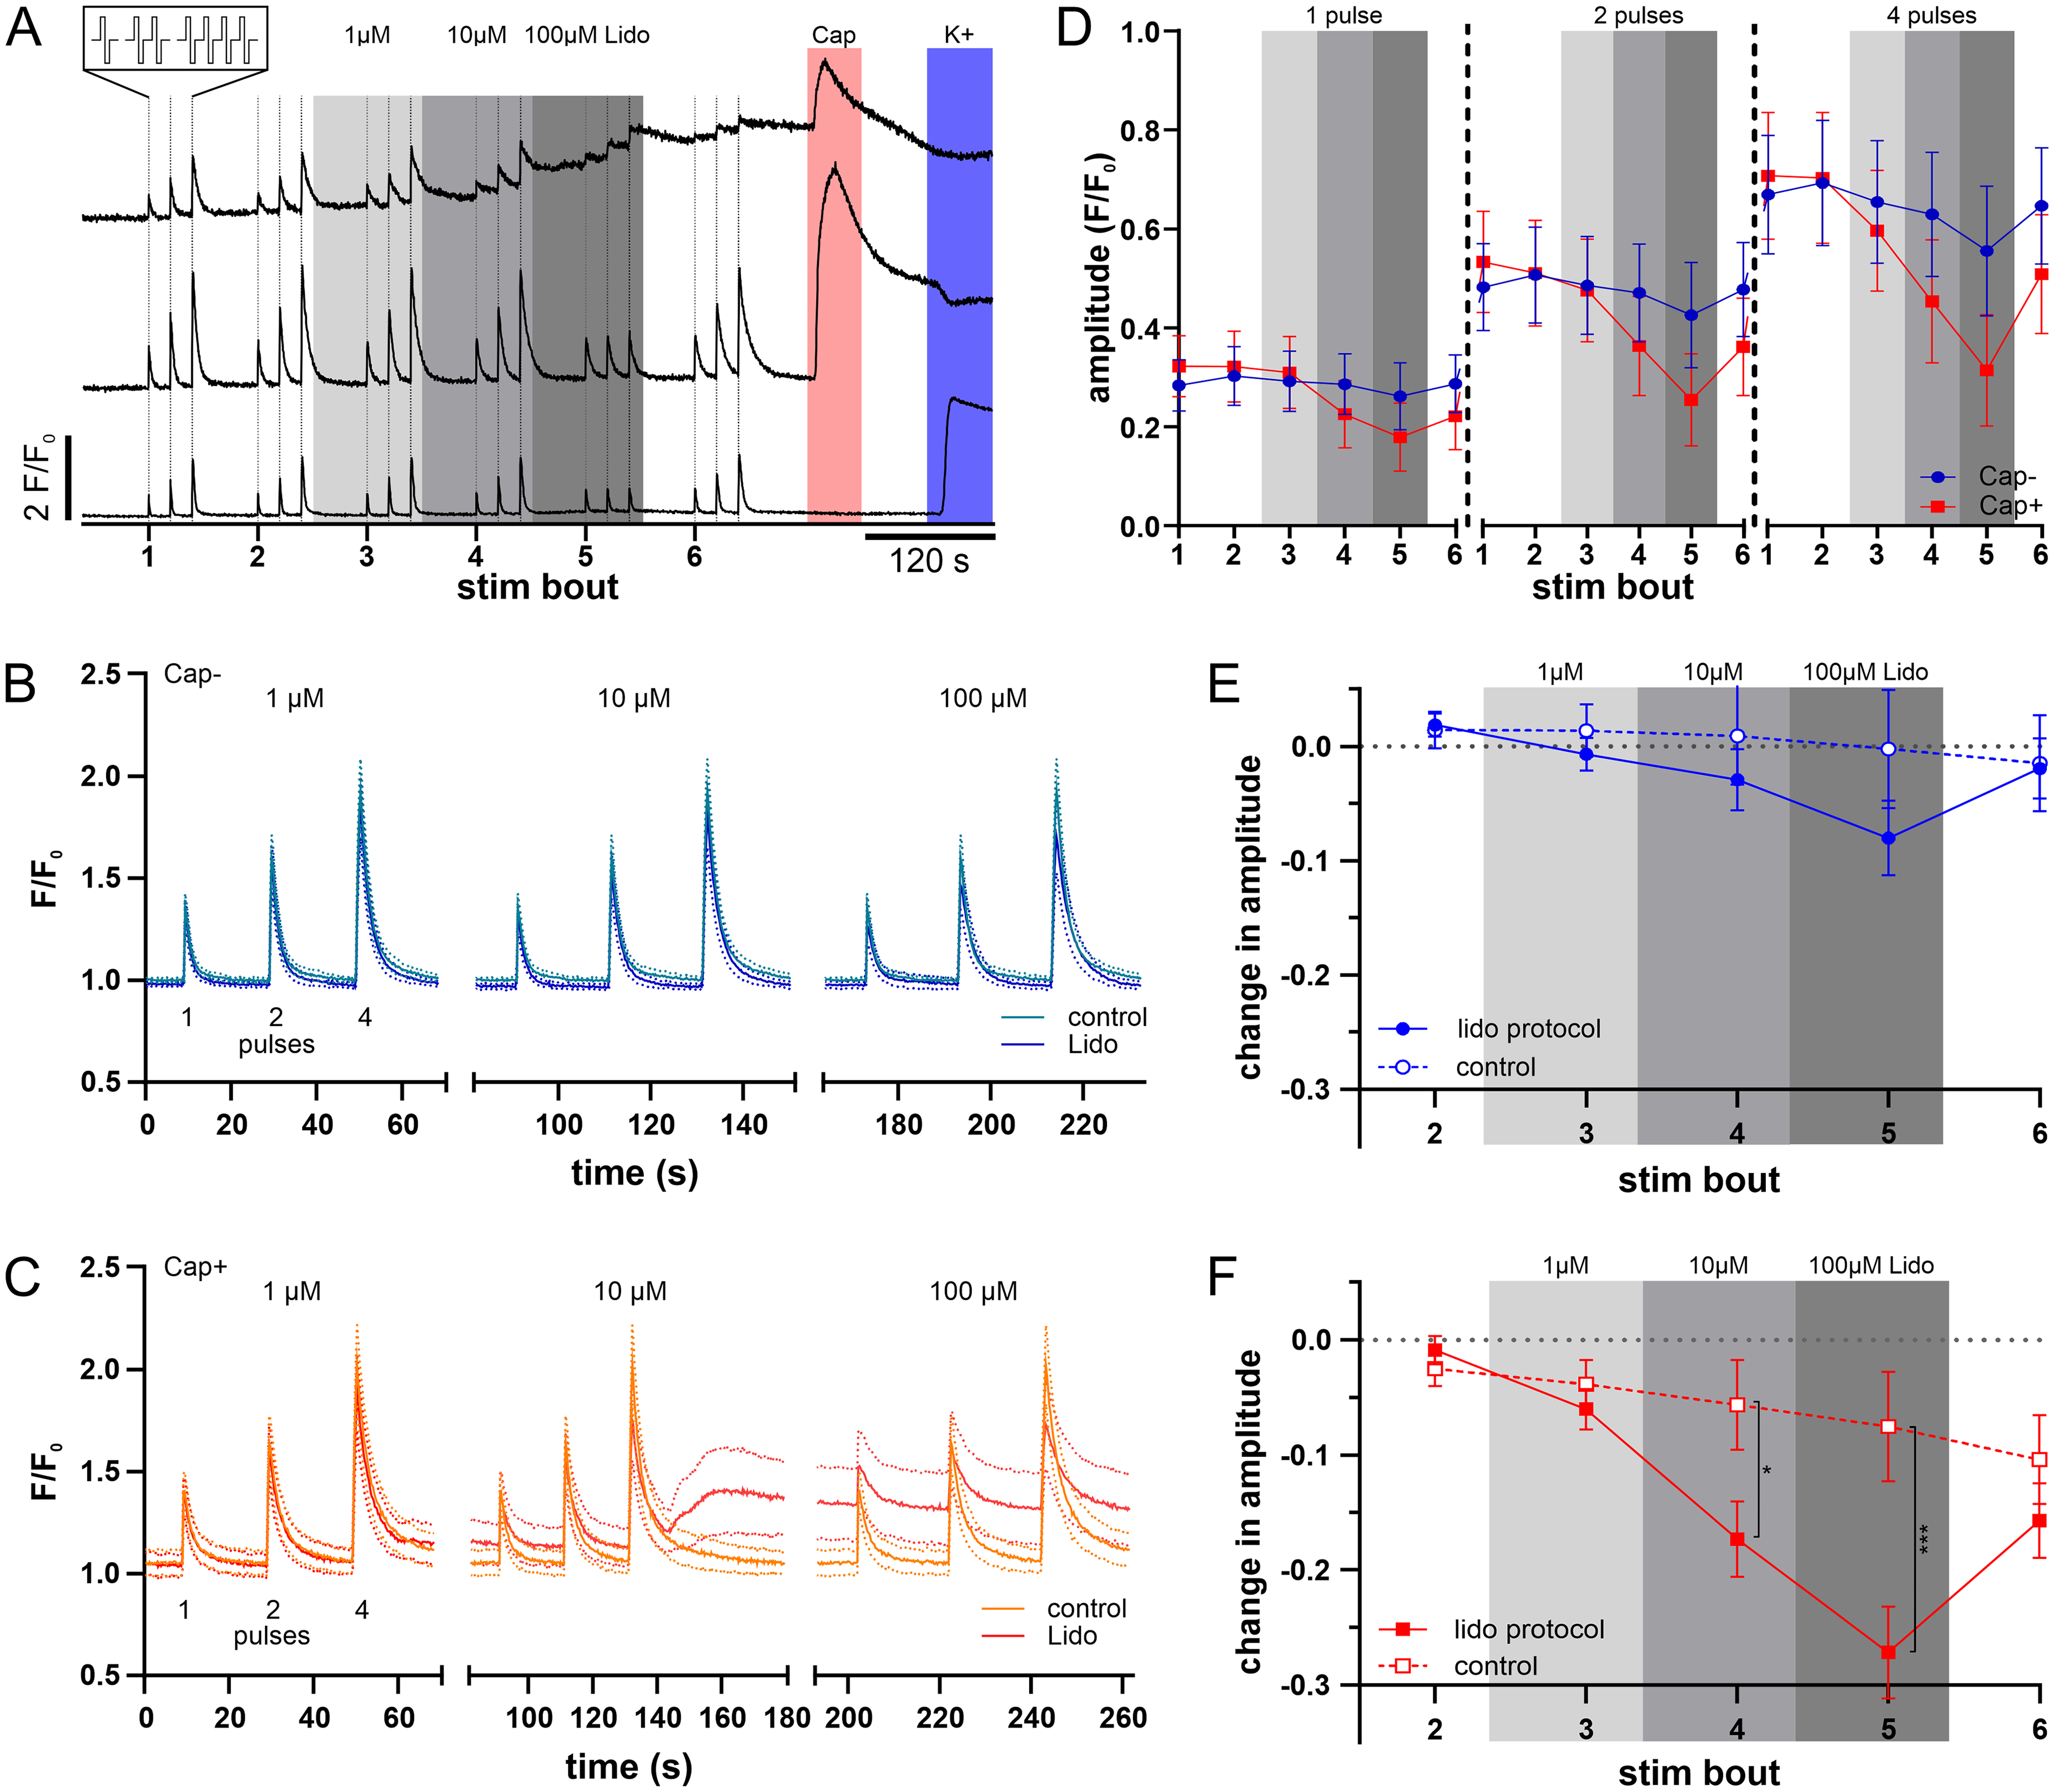
Effect of cumulative lidocaine concentration on calcium responses to repeat bouts of electrical stimulation in TG neurons. A: Fluorescent calcium signals illustrated by representative traces in three individual TG neurons, two responsive to capsaicin (upper traces Cap+) and a third not responsive to capsaicin (lower trace, Cap-). TG neurons were stimulated with repeat bouts of electrical stimulation comprising 1, 2 and 4 rectangular pulses (4 Hz @ 50 mA, see expanded insert) indicated with vertical lines. Six successive bouts of electrical stimulation were combined with increasing concentrations of lidocaine (1–100 µM, grey shading) exposure and this was followed by chemical stimulation with capsaicin (0.5 µM, red shading) and potassium (45 mM, blue shading). B&C: Averaged calcium traces (solid lines) with 95% CI (dotted lines) for all electrically responsive cells in capsaicin-unresponsive (B, Cap-, n=123) and capsaicin-responsive (C, Cap+, n=86) TG neurons in response to stimulation bouts of 1, 2 and 4 pulses before and during lidocaine at 1 µM (left), 10 µM (centre) and 100 µM (right, control in lighter color in all 3 = stim bout 2). Data were collected from 14 culture dishes harboring neurons isolated from 5 mice. D-F: Pooled data for mean amplitudes of calcium responses to 1 (left), 2 (centre) and 4 (right) electrical pulses amongst capsaicin-unresponsive (Cap-, blue, n=123) and responsive TG neurons (Cap+, red, n=86) and the difference in response amplitude for each electrical stimulus bout compared to the initial bout for capsaicin-unresponsive (E) and capsaicin-responsive neurons (F), each compared to the corresponding control protocol from figure 2 (dashed lines).
Both, capsaicin-responsive (red lines, Figure 4D) and capsaicin-unresponsive (blue lines, Figure 4D) neurons showed decreased response amplitudes upon repetitive electrical stimulation during increasing lidocaine concentration (Cap-: 2-way ANOVA main effect stim bout F (5, 1830) = 36.58, p < 0. 01; Cap+: 2-way ANOVA, main effect stim bout F (5, 1275) = 103.4, p < 0. 01). However, this decrease was more pronounced and also already visible at lower lidocaine concentrations in capsaicin-responsive neurons compared to the non-responders at 1 pulse (2-way ANOVA, interaction stim bout x Cap±, F (5, 1035) = 17.02, p < 0.01), 2 pulses (2-way ANOVA, interaction stim bout x Cap±, F (5, 1035) = 20.97, p < 0.01), and 4 pulses (2-way ANOVA, interaction stim bout x Cap±, F (5, 1035) = 25.15, p < 0.01).
In order to distinguish between effects caused by lidocaine and effects caused by repetitive electrical stimulation we compared the results with those from repetitions under control conditions. As described above, we determined the amplitude difference to the first stimulation bout separately for each pulse number and averaged these normalized calcium amplitudes (Figure 4E&F). Compared with the repetition under control conditions, increasing lidocaine concentrations significantly reduced normalized amplitudes, in both capsaicin-responsive and -unresponsive neurons (Figure 4E&F, 3-way ANOVA main effect protocol F(1, 321)= 15.89, p < 0.001). However, this effect was dependent on the lidocaine concentration and the neuron type, as evidenced by a significant effect of capsaicin responsiveness on the lidocaine/repetition interaction (3-way ANOVA interaction protocol x stim bout x Cap± F(3, 963)= 6.46, p < 0.01).
Amongst capsaicin-unresponsive neurons, lidocaine was without significant effect at any concentration (post-hoc with Bonferroni correction, at 1 and 10 µM p = 1, at 100 µM p = 0.3) (Figure 4E). In contrast, a significant reduction in normalized amplitude was observed at a lidocaine concentration of 100 µM in capsaicin-responsive neurons (Figure 4F, post-hoc with Bonferroni correction, p < 0.01; Cohen's d = 0.55). This was not the case at 1 µM (p = 1), but already evident at 10 µM lidocaine treatment (p = 0.024; Cohen's d = 0.42), which also led to a significant decline in normalized amplitude.
The amplitude reduction in electrically evoked calcium responses at 10 µM lidocaine in capsaicin-responsive neurons reflects both, a decrease in the size of the evoked transients as well as an increase in baseline calcium levels. Interestingly, during the transition from 10 to 100 µM lidocaine perfusion (Figure 5A, same cells as in Figure 4) an increase in baseline calcium occurred only in capsaicin-responsive neurons (red traces), but not in capsaicin-unresponsive neurons (blue traces), and was also not observed for the transition from control solution to 100 µM in capsaicin-responsive neurons (Figure 5B), indicating a specific, but context-dependent effect on neurons expressing the TRPV1 channel. The calcium increase upon increasing the lidocaine concentration from 10 to 100 µM in capsaicin-responsive neurons was even more pronounced when we included all viable neurons that did not faithfully respond to each stimulation of the first bout (Figure 5C). Again, this increase strictly depended on a preceding electrical stimulation in the presence of 10 µM lidocaine (Figure 5D). Low-dose lidocaine directly activating TRPV1 might possibly explain this finding. However, lidocaine only activates TRPV1 at a concentration of 1 mM and higher in DRG neurons 19 and we confirmed an increase in calcium levels in trigeminal ganglion neurons at lidocaine concentrations above 1 mM (Figure S1).
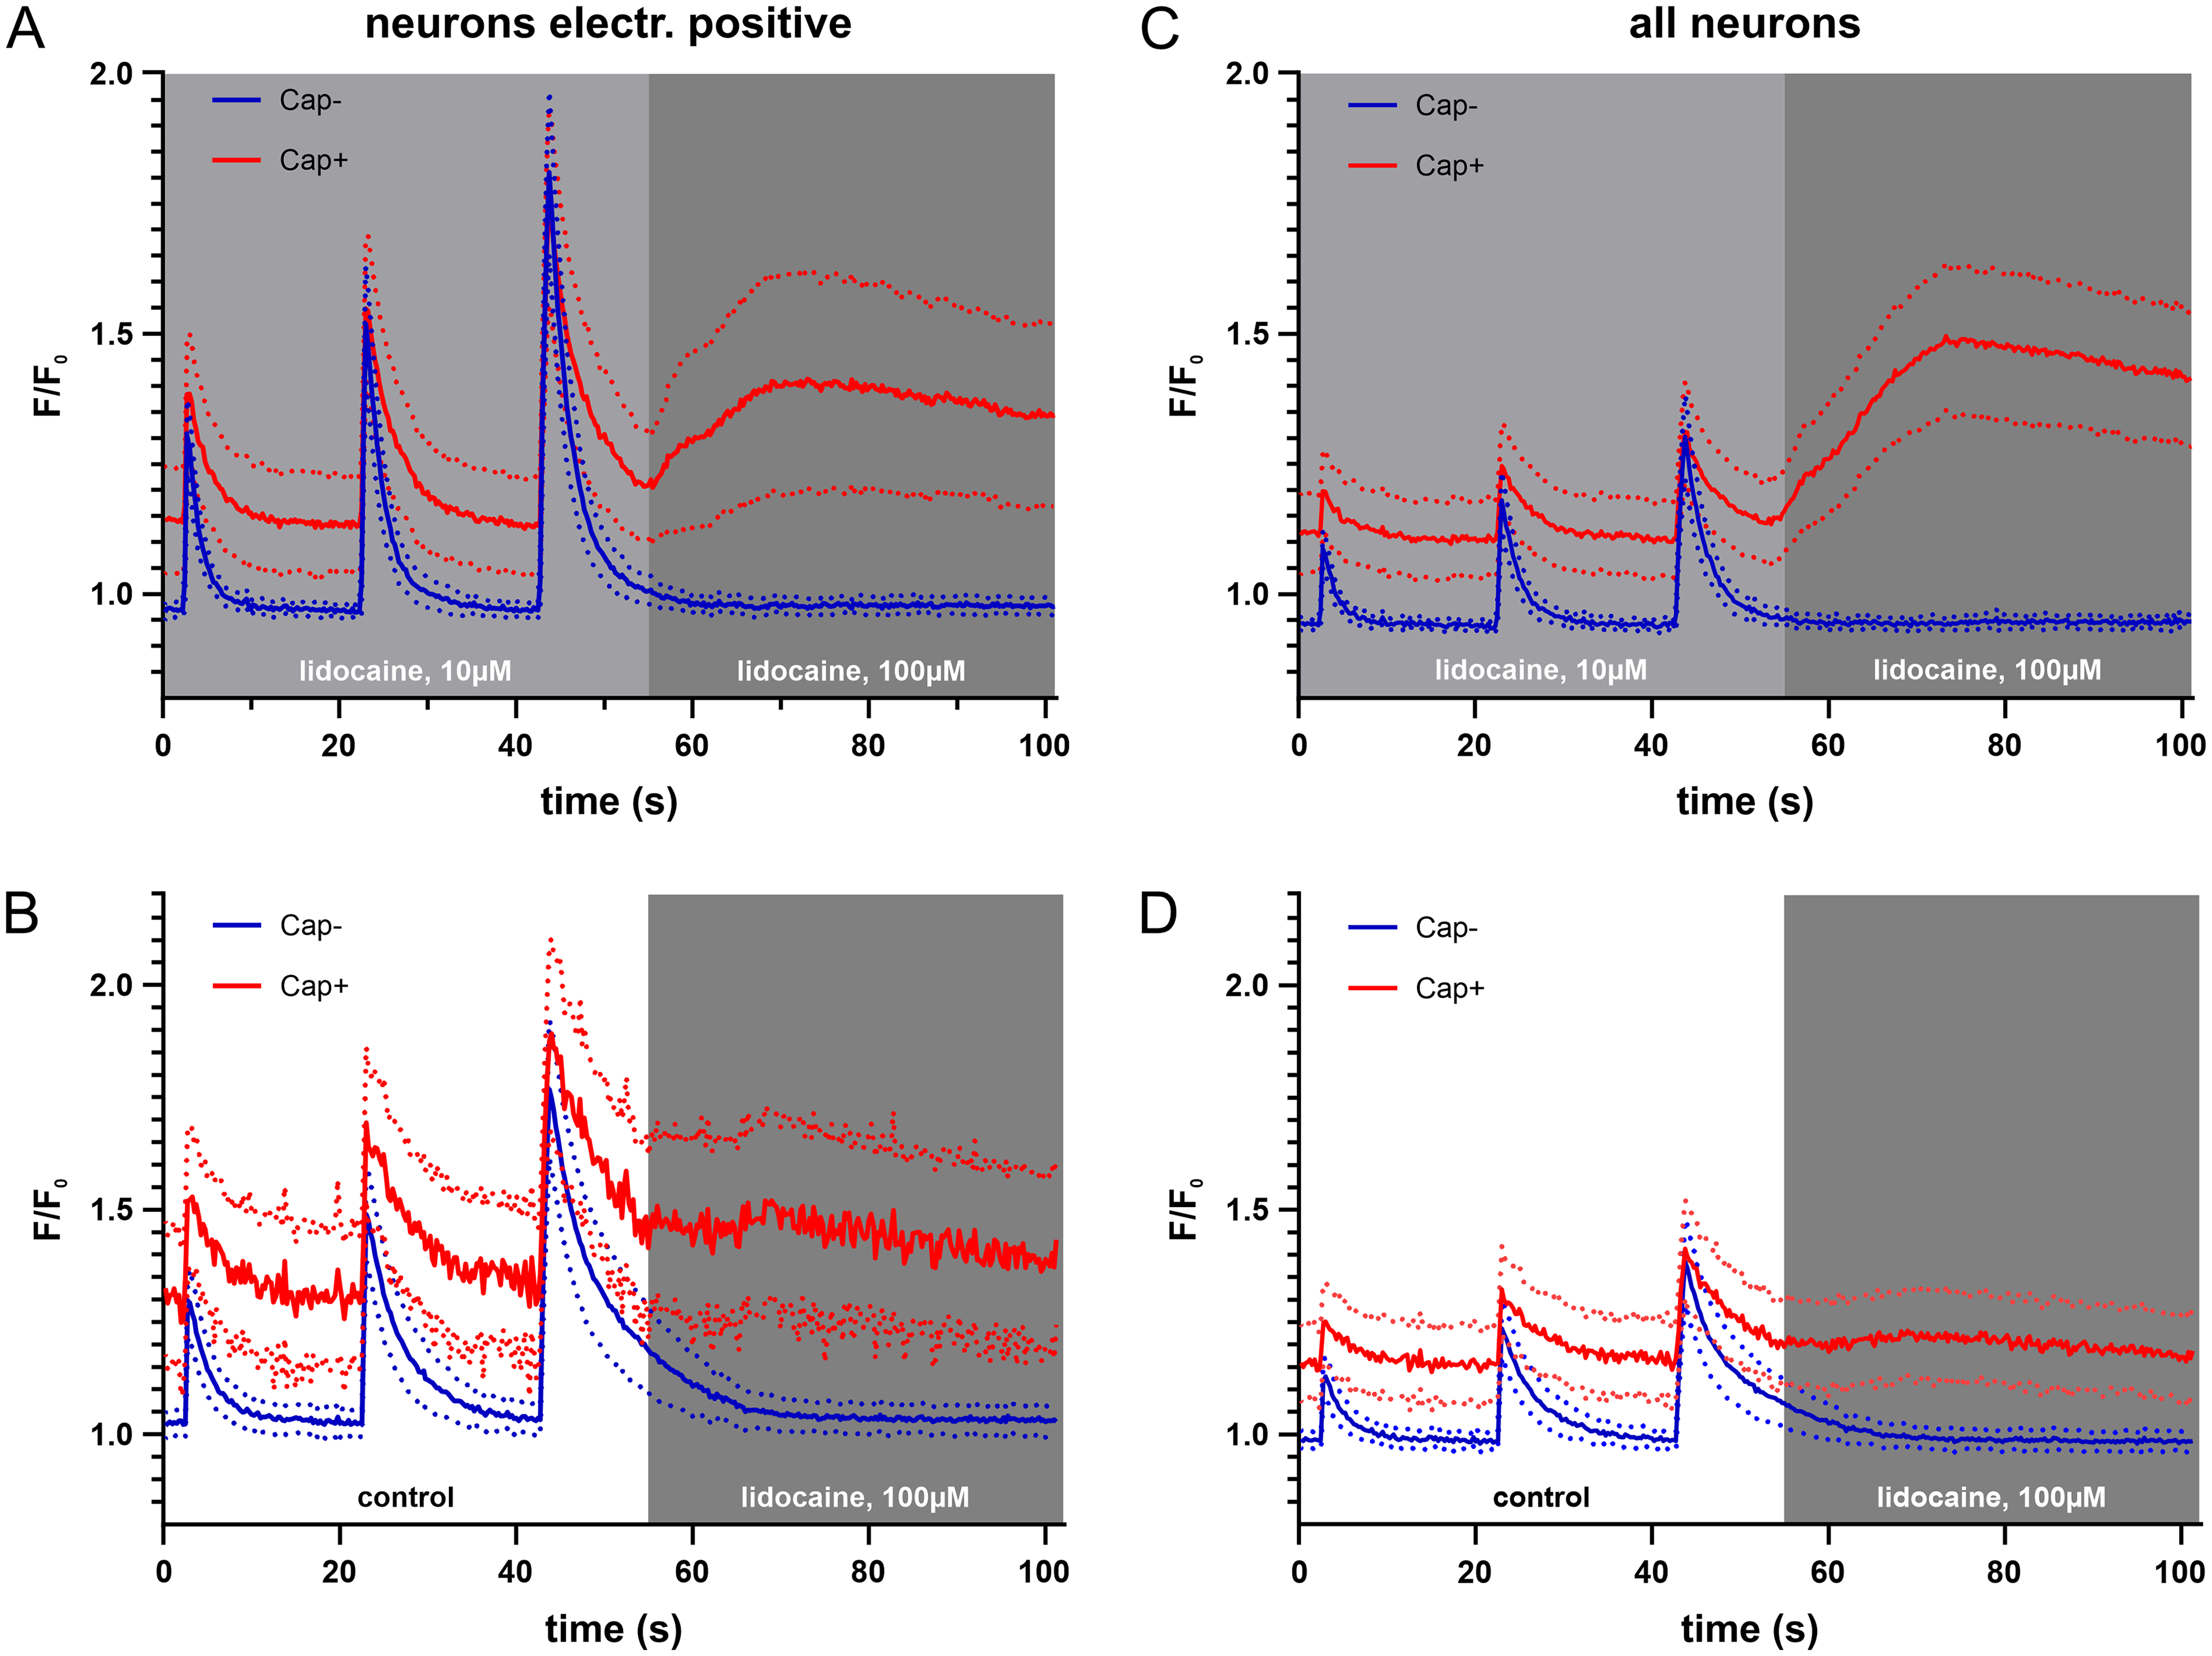
Effect of cumulative lidocaine on calcium responses during and after a bout of electrical stimulation in TG neurons. Averaged calcium traces (solid lines) with 95% CI (dotted lines) for TG neurons responding 3 times to the first electrical stimulation bout (A&B), and for all viable TG neurons (C&D), showing expanded segments of the protocol in Figure 4 (A&C) and Figure 3 (B&D) and including responses to 1, 2 and 4 electrical pulses in capsaicin-unresponsive (Cap-, blue) and capsaicin-responsive (Cap+, red) neurons in either imaging buffer (B&D, left) or in lidocaine at 10 µM (A&C, left) and transitioning into lidocaine at 100 µM (A-D, right). A, Cap+ n=86, Cap- n=123; B, Cap+ n=35, Cap- n=107; C, Cap+ n=271, Cap- n=300; D, Cap+ n=125, Cap- n=209.
Our retrospective analysis of spontaneously active neurons identified 48 out of 1024 cells with spontaneous activity, 38 of them were capsaicin positive. When separating the neurons based on capsaicin sensitivity, it is obvious that increases in calcium levels upon lidocaine treatment were observed only in capsaicin-positive neurons (raw data in Figure S2). Lidocaine application increased the unstimulated calcium signals significantly when comparing capsaicin-responsive, capsaicin-unresponsive and control neurons for the concentrations 1 and 100 µM used in both lidocaine protocols (Kruskal-Wallis ANOVA; increase by 1 µM, H (2, n = 48)= 6.6, p = 0.037; increase by 100 µM, H (2, n = 48)= 6.5, p = 0.039) (Figure 6). Post-hoc tests revealed significant differences between capsaicin-responsive (n = 32) and capsaicin-unresponsive (n = 10) neurons for the increase induced by 1 µM and 100 µM lidocaine (Mann-Whitney U tests, Z = 2.36 and 2.18, p = 0.018 and 0.029), but the difference to the non-treated controls (n = 6) was not significant (Figure 6).
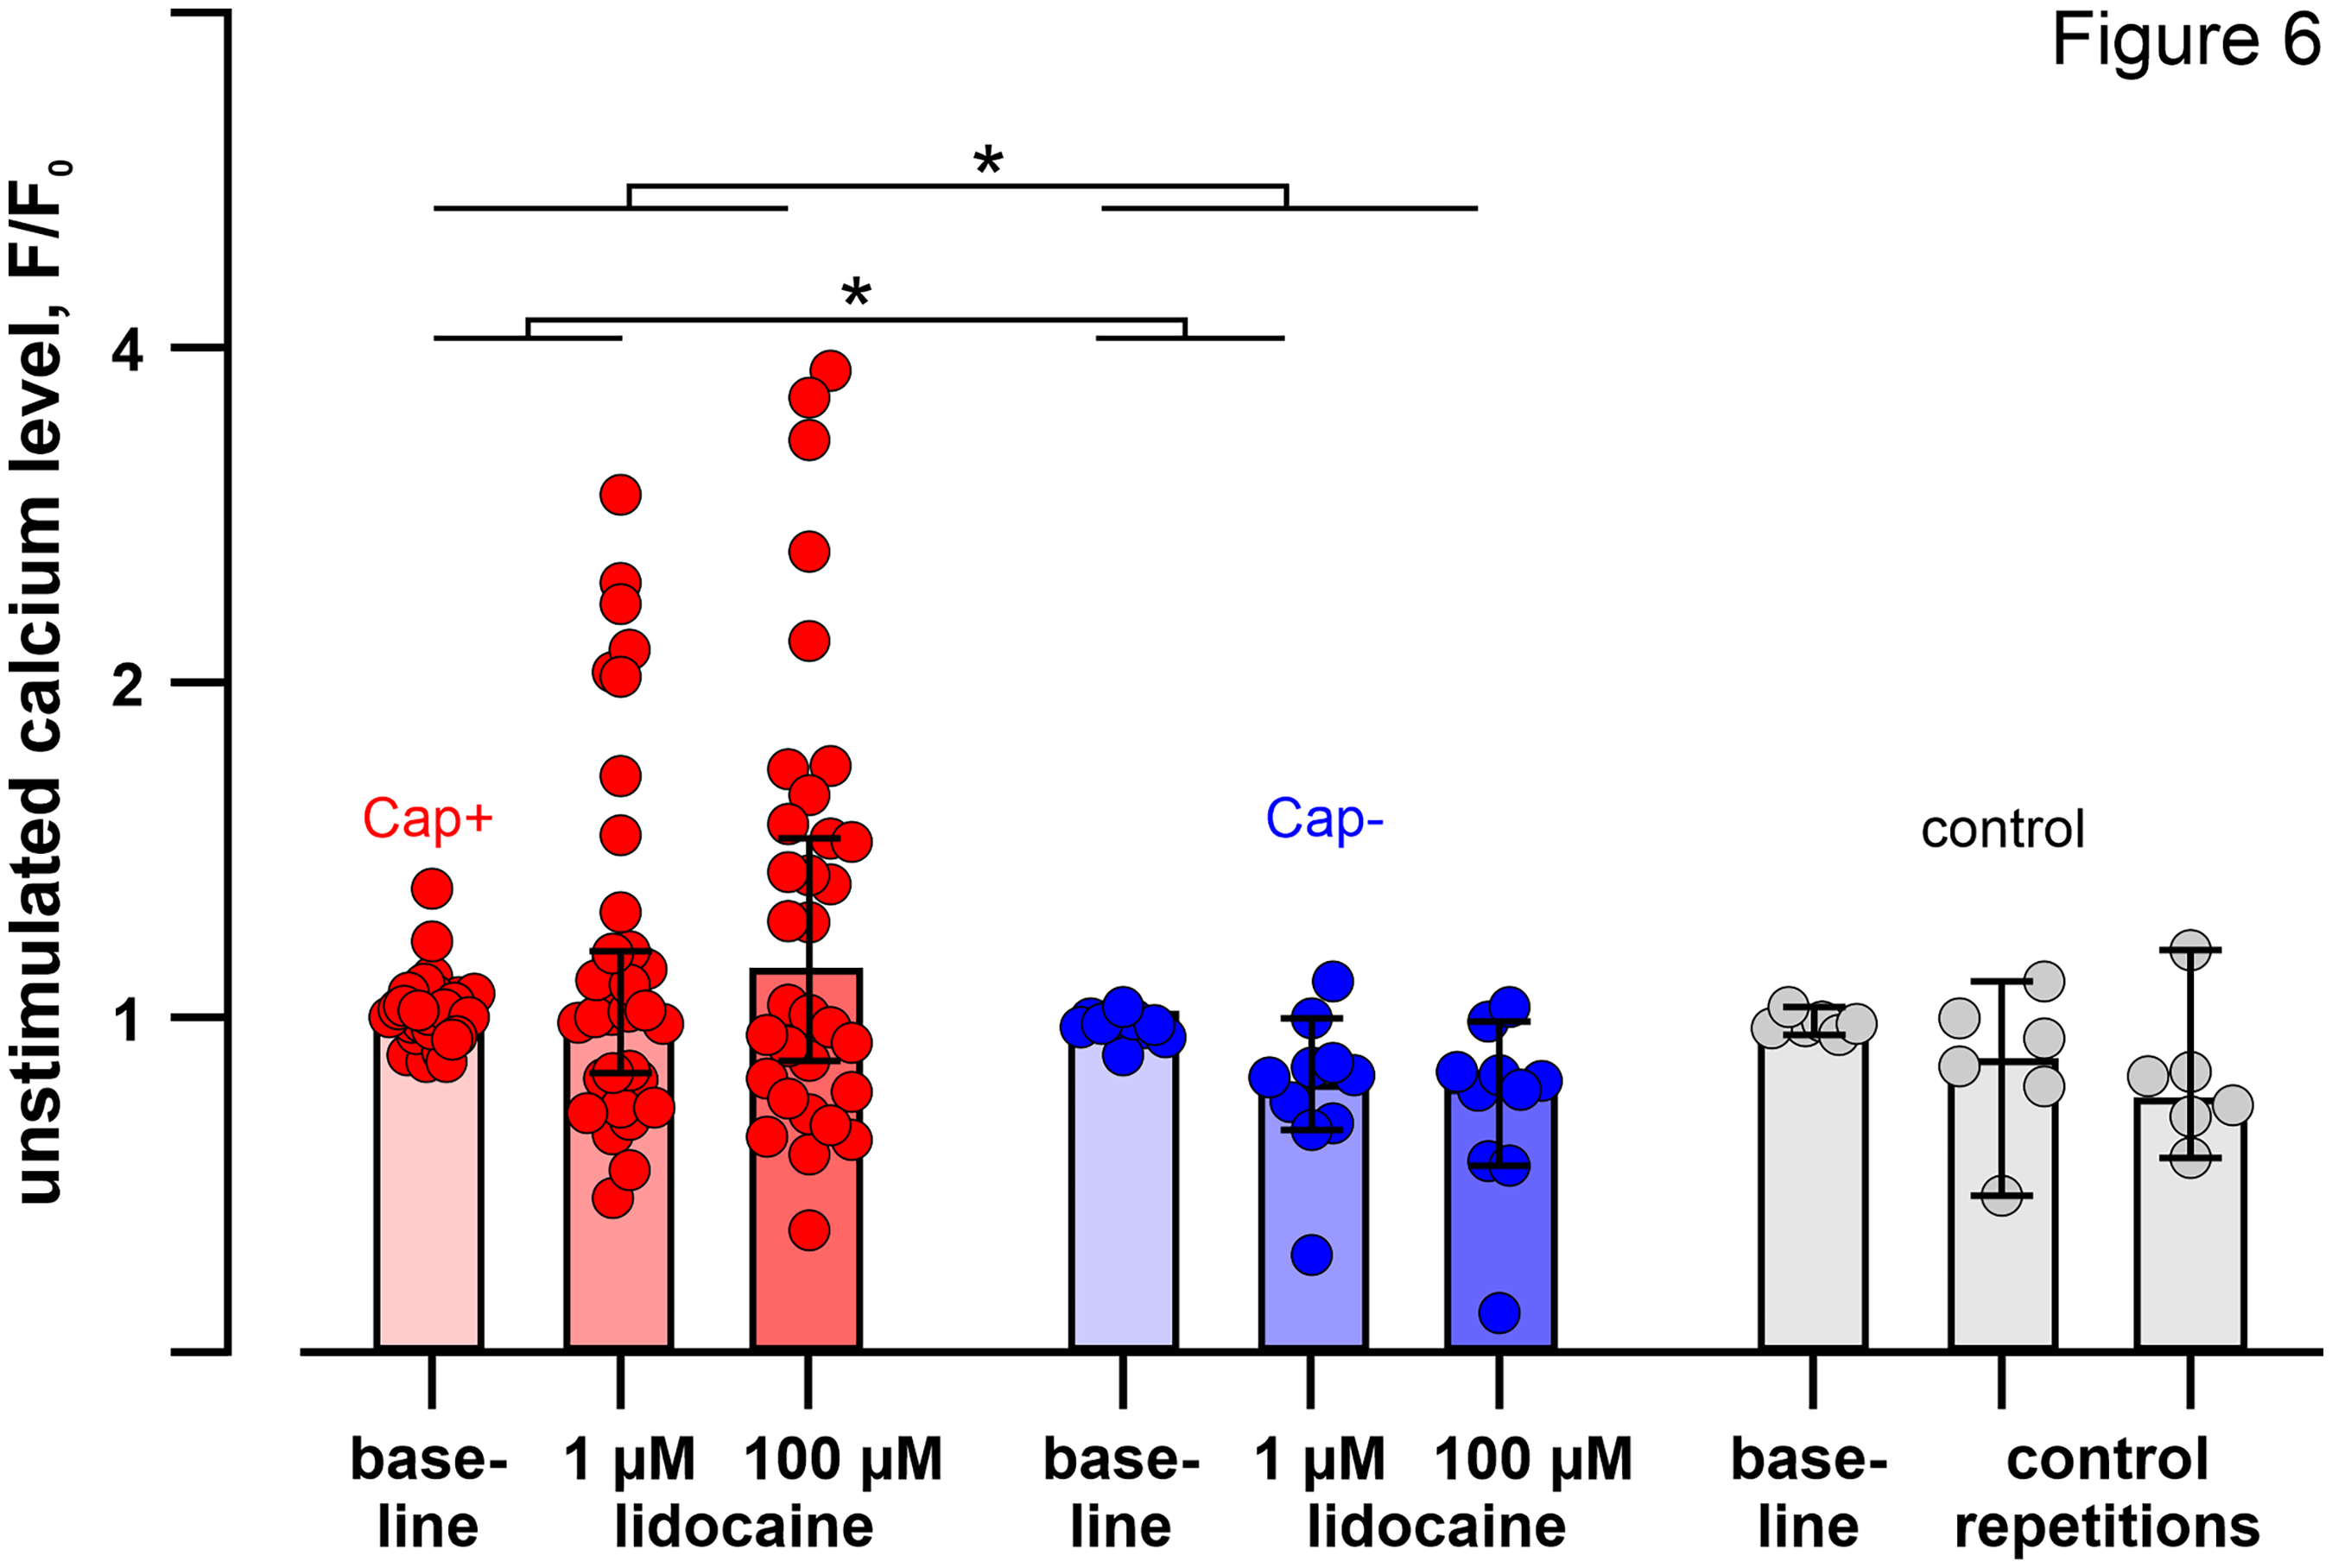
Capsaicin-positive spontaneously active neurons increase unstimulated calcium levels upon lidocaine application at 1 and 100 µm. Median and quartiles of unstimulated calcium level over an interval of 20 s before electrical stimulation at baseline and during application of 1 µM and 100 µM lidocaine is shown for spontaneously active capsaicin-responsive and capsaicin-unresponsive neurons. Control neurons were spontaneously active, but did not receive lidocaine (n=6, all capsaicin positive). Individual neurons are displayed on top of the summary bar graph as dots. The increase in calcium signal from baseline to 1 µM and from baseline to 100 µM differed significantly between the three groups (Kruskal-Wallis ANOVA; increase by 1 µM, H (2, n= 48) =6.6 p =0.037; increase by 100 µM, H (2, n= 48) =6.5 p =0.039). Post-hoc tests revealed significant differences between capsaicin-responsive (n=32) and capsaicin-unresponsive (n=10) neurons for the increase induced by 1 µM and 100 µM lidocaine (Mann-Whitney U tests, Z =2.36 and 2.18, p=0.018 and 0.029), indicated by the asterisks.
Discussion
We measured lidocaine concentrations around 10 µM in olfactory bulb and trigeminal ganglia after intranasal application in anaesthetized mice. Only capsaicin-responsive nociceptive neurons were inhibited by this lidocaine concentration and showed a sustained increase in their calcium levels, most prominently in spontaneously active nociceptors.
Local concentrations of lidocaine after intranasal application
Intranasal application of lidocaine resulted in systemic lidocaine concentrations in serum and in cerebrospinal fluid of around 3 µM, while levels in neuronal tissues including olfactory bulb and trigeminal ganglion were 2- to 4-fold higher at 7–12 µM. Lidocaine accumulation in olfactory bulb and trigeminal ganglia highlights the two main transport routes from the nose to intracranial sites, namely along the olfactory and trigeminal nerves.39,40 Using intranasal fluorogold administration in mice, the importance of the paraneural space for the fast extracellular transport has been stressed, 41 but the exact driving force for the suggested convective bulk transport remains unclear. Noteworthy, intranasal lidocaine appears to be particularly efficacious in post dural puncture headache 8 for which we expect an increased pressure gradient for convective flow from the nose into the CSF. With nose to intracranial delivery, neural tissue concentrations lie within the upper range of 4–10 µM reported for systemic lidocaine levels in analgesic treatment of neuropathic pain patients. 17
However, tissue concentrations determined here cannot be compared directly to effective concentrations owing to major anatomical species differences such as larger relative area of olfactory epithelium. In mice, the olfactory epithelium constitutes about 50% of the total nasal epithelium, with the remainder being largely respiratory epithelium. 42 In contrast, the human olfactory epithelium makes up only about 3% of the nasal cavity. 43
Electrically-induced calcium transients differ between capsaicin-responsive and -unresponsive neurons
Electrically induced calcium transients had higher peak values and were longer lasting in capsaicin-responsive neurons. This observation is confirmatory of depolarization-induced calcium transients that were found to be longer lasting in capsaicin-responsive rat DRG neurons and in tetrodotoxin-resistant axons of pig DRG neurons. 44 Longer duration action potentials that could underlie this difference have also been found in nociceptors of guinea pig 44 and rat. 45 Moreover, surface expression of voltage-sensitive N-type calcium channels was increased in TRPV1 positive DRG neurons in mice, 46 but not in rat. 47
Repetition of electrical stimulation only marginally changed calcium transients in capsaicin-unresponsive neurons. In contrast, we observed a considerable broadening of the calcium transient in capsaicin-responsive neurons upon repetition of electrical stimulation. A broadening of action potentials upon repetitive stimulation has been reported in capsaicin-responsive DRG neurons and linked to frequency-dependent reduction of Kv3 currents. 48 While this effect may be relevant for broadening within stimulation trains at 4 Hz, our stimulation bouts were repeated at intervals of 100 s. Potential mechanisms for such time courses would be calcium-activated calcium release and activation of store-operated calcium channels found in capsaicin-responsive DRG neurons in mice. 49 Larger store-operated calcium entry was also found in capsaicin-responsive DRG neurons in the rat. 47
Lidocaine-induced changes in neuronal excitability
For capsaicin-unresponsive neurons lidocaine concentrations of 100 µM were required to reduce electrically induced calcium transients. This decrease is not accompanied by an increased baseline calcium signal and can be explained by lidocaine block of sodium channels with IC50s of 450 µM for NaV1.7 and 104 µM for NaV1.8. 50
In contrast, capsaicin-responsive neurons were much more sensitive to lidocaine which reduced electrically induced calcium transients at 10 µM. Moreover, at this concentration, baseline calcium signals before stimulation were increased as compared to control neurons. In a retrospective analysis we found initially excluded spontaneously active nociceptors particularly sensitive to lidocaine concentrations as low as 1 µM. The simplest explanation would be TRPV1 activation by lidocaine, however activation of TRPV1 and TRPA1 by lidocaine requires concentrations of 1 mM,17–19 which we confirmed with our own data. A potential explanation would be that elevated intracellular Ca2+ levels, induced by repetitive electrical stimulation or by lidocaine, inactivate voltage-gated calcium channels (Peterson, et al., 1999; for review see) 51 thereby reducing evoked calcium transients and overall excitability. Thus, an interesting translational implication would be that for the study of ongoing activity of nociceptors it might not be adequate to focus only on those neurons that can easily follow the experimental protocol and exclude neurons that are struggling as these might have a particular translational value.
Irrespective of the potential mechanism of action of lidocaine, on a descriptive level lidocaine appears to enhance the negative feedback that nociceptor activity has on excitability and thus, follows a similar line of arguments as discussed for the analgesic effect of capsaicin. 52 Our data suggest that intranasal lidocaine leads to pharmacologically active concentrations in the central nervous system that are below the threshold to block voltage-gated sodium channels. The key clinical implication would be that the higher susceptibility to lidocaine in nociceptors with ongoing activity that are presumably depolarized 53 might be crucial for generating a therapeutical window for its analgesic effects.
Article highlights
Intranasally applied lidocaine reaches the central nervous system in pharmacologically active concentrations (10 µM)
At such low concentrations, lidocaine selectively inhibits capsaicin-responsive nociceptive neurons and provokes calcium increases particularly in capsaicin-responsive nociceptors with ongoing activity
These nociceptor-specific lidocaine effects might provide a therapeutical window for analgesic effects in headache
Supplemental Material
sj-docx-1-cep-10.1177_03331024261453548 - Supplemental material for Distribution of intranasal lidocaine and its effect on electrically-evoked calcium signals in mouse trigeminal ganglion neurons
Supplemental material, sj-docx-1-cep-10.1177_03331024261453548 for Distribution of intranasal lidocaine and its effect on electrically-evoked calcium signals in mouse trigeminal ganglion neurons by Lisa Tiebl, Hans Jürgen Solinski, Sara Belejova, Sabrina Soares, Claudia Pitzer, Roland Palkovacs, Gernot Poschet, Martin Schmelz, Beatrice Oehler and Richard Carr in Cephalalgia
Footnotes
Abbreviations
Acknowledgements
Figure 1A was created using Biorender.com.
Ethical considerations
The study was conducted in compliance with the guidelines for the welfare of experimental animals (animal ethic committee of the government of Baden-Württemberg, ethics approval number G-286/21 and I-24/14 (tissue collection only)) in accordance with European regulations (Council Directive 2010/63/EU September 2010) and with the 3R's guidelines.
Consent to participate
Not applicable for animal study
Consent for publication
The authors agree to publish with Cephalalgia, if the manuscript is accepted.
Author contributions
Experiment concept and design: RC, MS
Acquisition of data: LT, SB, RP, GP
Method development: RP, GP, CP
Analysis and interpretation of data: LT, HJS, RC, MS
original draft: LT, HJS, RC, MS
Manuscript revision & editing: LT, HJS, MS, SB, SS, CP, GP, BO
Funding Acquisition: RC, BO
Funding
The authors disclosed receipt of the following financial support for the research, authorship, and/or publication of this article: This research was supported by the grant SFB1158 from the German Research Foundation (Deutsche Forschungsgemeinschaft).
Declaration of conflicting interests
The authors declared no potential conflicts of interest with respect to the research, authorship, and/or publication of this article.
Data availability statement
The data will be made available upon reasonable request.
Open practices
Not applicable.
Supplemental material
Supplemental material for this article is available online.
References
Supplementary Material
Please find the following supplemental material available below.
For Open Access articles published under a Creative Commons License, all supplemental material carries the same license as the article it is associated with.
For non-Open Access articles published, all supplemental material carries a non-exclusive license, and permission requests for re-use of supplemental material or any part of supplemental material shall be sent directly to the copyright owner as specified in the copyright notice associated with the article.