






Abstract
Background
Glutathione (GSH) and glutamate (Glu) have been individually implicated in migraine pathophysiology, but their ratio as a marker of oxidative–excitatory balance in the thalamus—a key pain-processing hub—remains unexplored. This study investigated thalamic GSH/Glu ratios across primary headache subtypes and evaluated their diagnostic utility.
Methods
This cross-sectional study included 131 participants: 36 healthy controls (HC), 17 migraine with aura (MwA), 46 migraine without aura (MwoA), and 32 tension-type headache (TTH). Single-voxel proton magnetic resonance spectroscopy was performed at 3T using a MEGA-PRESS sequence targeting bilateral thalami. Metabolite concentrations were quantified with LCModel and corrected for partial volume effects using an established tissue correction framework. Group differences were analyzed using ANOVA with Tukey HSD correction; diagnostic performance was assessed using ROC analysis with bootstrap resampling.
Results
The GSH/Glu ratio differed significantly across groups (F = 9.41, p < 0.001, η2 = 0.183), confirmed by bootstrap validation. MwA (0.250 ± 0.038, p < 0.001, Cohen's d = 1.47) and MwoA (0.280 ± 0.052, p = 0.006, d = 0.79) showed significantly lower ratios than HC (0.320 ± 0.055), whereas TTH (0.318 ± 0.068) did not differ from HC. This reduction was driven by decreased GSH levels, with Glu concentrations unchanged across groups. Exploratory ROC analysis yielded apparent AUCs of 0.874 for GSH and 0.758 for the GSH/Glu ratio; these estimates require independent validation.
Conclusions
Migraine is characterized by reduced thalamic GSH levels and decreased GSH/Glu ratios, reflecting diminished antioxidant buffering capacity against normal excitatory neurotransmission. This metabolic alteration distinguishes migraine from TTH, supporting distinct pathophysiological mechanisms.
Keywords
Introduction
Migraine is a highly prevalent neurological disorder affecting approximately 12% of the general population, characterized by recurrent episodes of moderate to severe headache accompanied by autonomic symptoms such as nausea, photophobia, and phonophobia.1,2 Tension-type headache (TTH), the most common primary headache disorder worldwide, presents with bilateral, non-pulsating pain of mild to moderate intensity without significant autonomic features.3,4 Despite their distinct clinical presentations, the pathophysiological mechanisms underlying these conditions remain incompletely understood, and reliable objective biomarkers for differential diagnosis are lacking.
Increasing evidence suggests that oxidative stress plays a crucial role in migraine pathophysiology.5–7 Glutathione (GSH), the most abundant intracellular antioxidant in the brain, serves as the primary defense against reactive oxygen species (ROS) and maintains cellular redox homeostasis. 8 Several studies have reported decreased GSH levels and reduced antioxidant enzyme activities in migraine patients during both ictal and interictal periods.9–11 A recent magnetic resonance spectroscopy (MRS) study demonstrated lower GSH/total creatine ratios in the occipital lobe of migraine patients during attacks, providing direct neuroimaging evidence for oxidative stress involvement. 12
Glutamate (Glu), the principal excitatory neurotransmitter in the central nervous system, has also been implicated in migraine pathogenesis.13,14 Elevated glutamate levels have been observed in multiple brain regions of migraine patients, including the visual cortex and thalamus.15–17 The thalamus serves as a critical relay station for sensory information processing and plays a central role in pain modulation and the generation of migraine-associated symptoms.18,19 Notably, Bathel et al. reported increased thalamic glutamate/glutamine (GLX) levels in migraine patients without aura, suggesting enhanced glutamatergic neurotransmission in this region. 15
The interrelationship between GSH and glutamate is of particular interest, as glutamate serves as a metabolic precursor for GSH synthesis. 20 Under conditions of oxidative stress, the balance between antioxidant defense (GSH) and excitatory neurotransmission (Glu) may be disrupted, potentially contributing to neuronal hyperexcitability and the initiation of migraine attacks. 9 However, no previous study has directly examined the GSH/Glu ratio in primary headache patients. We hypothesized that this ratio may reflect the oxidative-excitatory balance and could serve as a more specific biomarker for migraine than either metabolite alone.
The present study aimed to: (1) compare thalamic GSH/Glu ratios among patients with migraine with aura (MwA), migraine without aura (MwoA), TTH, and healthy controls; (2) evaluate the diagnostic performance of the GSH/Glu ratio for migraine identification; and (3) explore the relationships between metabolite ratios and clinical characteristics.
Methods
This study is reported in accordance with the Strengthening the Reporting of Observational Studies in Epidemiology (STROBE) guidelines for cross-sectional studies.
Participants
This cross-sectional study enrolled 131 participants, including 36 healthy controls (HC), 17 patients with migraine with aura (MwA), 46 patients with migraine without aura (MwoA), and 32 patients with tension-type headache (TTH). Patients were recruited from the headache outpatient clinic and diagnosed according to the International Classification of Headache Disorders, 3rd edition (ICHD-3) criteria. 21 Healthy controls were recruited through local advertisements and had no personal or family history of primary headache disorders.
Inclusion criteria for patients were: (1) age 12–60 years; (2) diagnosis of migraine or TTH according to ICHD-3; (3) no headache attack within 48 h prior to MRS examination; (4) no prophylactic medication use within the past month. Exclusion criteria included: (1) secondary headache disorders; (2) chronic migraine or chronic TTH; (3) medication overuse headache; (4) neurological or psychiatric comorbidities; (5) contraindications to MRI; (6) pregnancy or lactation.
The study was approved by the institutional ethics committee, and written informed consent was obtained from all participants or their legal guardians (for participants under 18 years).
Clinical assessment
Demographic data including age and sex were recorded for all participants. For headache patients, clinical characteristics were assessed using standardized questionnaires, including disease duration, attack frequency, attack duration, pain intensity (visual analog scale, VAS), Migraine Disability Assessment (MIDAS), and Headache Impact Test-6 (HIT-6).
MRS data acquisition
All imaging was performed on 3T Discovery MR 750w (GE Healthcare, Milwaukee, WI, USA) equipped with a 24-channel head coil. High-resolution T1-weighted images were acquired for anatomical localization. GSH-edited single-voxel spectroscopy was performed using the MEGA-PRESS (Mescher–Garwood point-resolved spectroscopy) sequence 22 with the following parameters: TR = 2000 ms, TE = 79 ms, 128 edit-on and 128 edit-off averages (256 total acquisitions). Two 10-ms spectrally selective Gaussian editing 180° radiofrequency (RF) pulses (truncated at 7%, bandwidth 120 Hz) were applied at 4.56 ppm in edit-on scans to selectively refocus the GSH cysteine CH₂ resonance at 2.95 ppm and were turned off in edit-off scans. Difference spectra were obtained by subtracting edit-off from edit-on spectra, thereby isolating the GSH-edited signal while suppressing overlapping resonances including total creatine at 3.03 ppm. Water suppression was achieved using a variable flip-angle scheme. The edit-on and edit-off sub-acquisitions were executed in an alternating fashion, and frequency drift correction was applied in real time. An unsuppressed water signal was acquired with editing pulses turned off and used as reference for multichannel combination and eddy-current compensation. The unsuppressed water signal also served as an internal concentration reference for metabolite quantification in LCModel. Voxels of interest were placed in the left and right thalami (voxel size: 20 × 20 × 20 mm3).
Spectra were analyzed using LCModel software (version 6.3-1L). Spectral fitting of difference spectra was performed using an in-house basis set that was generated by density-matrix simulations incorporating the actual slice-selective and spectrally selective RF and gradient pulse envelopes of the MEGA-PRESS sequence. 22 The basis set included GSH, N-acetylaspartate (NAA), N-acetylaspartylglutamate (NAAG), total NAA (tNAA = NAA + NAAG), creatine, phosphocreatine, total creatine (tCr), phosphocholine, glycerophosphocholine, total choline (tCho), glutamate (Glu), glutamine (Gln), myo-inositol (mI), aspartate, taurine, and macromolecular species. The LCModel built-in macromolecular and lipid basis signals were excluded from the difference spectral fitting. In addition, LCModel fitting of edit-off spectra was performed using a standard metabolite basis set with built-in macromolecular and lipid signals included, enabling quantification of Glu and other non-edited metabolites. The spectral fitting range was 0.2–4.0 ppm. Metabolite concentrations were expressed as institutional units (i.u.) referenced to the unsuppressed water signal, without additional corrections for water T₁/T₂ relaxation. Quality control criteria included: linewidth < 12 Hz, signal-to-noise ratio > 10, and Cramér-Rao lower bounds < 20% for the metabolites of interest. Spectra not meeting these criteria were excluded from analysis. The number of excluded spectra and the mean CRLB values for GSH (from difference spectra) and Glu (from edit-off spectra) in each diagnostic group are reported in Supplementary Table S1.
To evaluate potential partial volume effects, tissue segmentation of T1-weighted images was performed using Statistical Parametric Mapping (SPM12, Wellcome Trust Centre for Neuroimaging, London, UK) running on MATLAB (MathWorks, Natick, MA, USA). Gray matter (GM), white matter (WM), and cerebrospinal fluid (CSF) probability maps were generated using the unified segmentation algorithm. The MRS voxel coordinates were co-registered to the T1-weighted images, and tissue fractions within each voxel were calculated by averaging the probability values across all voxels within the MRS region of interest. The GM fraction (fGM), WM fraction (fWM), and CSF fraction (fCSF) were computed for each participant and compared across diagnostic groups to assess whether voxel tissue composition differed among groups. Results are reported in Supplementary Table S2. Metabolite concentrations were then corrected for partial volume effects following the tissue correction framework of Harris et al. 23 and Gasparovic et al. 24 The correction formula was: C_corrected = C_raw / [(1 − fCSF) × (fGM′ + α × fWM′)], where fGM′ = fGM/(fGM + fWM) and fWM′ = fWM/(fGM + fWM) are the normalized tissue fractions, and α represents the ratio of metabolite concentration in WM relative to GM. The CSF term (1 − fCSF) accounts for signal dilution from CSF, which contains negligible metabolite signal. The α-correction accounts for known differences in metabolite concentrations between GM and WM. An α value of 0.5 was assumed for both GSH and Glu, consistent with published evidence that concentrations of most brain metabolites, including glutamate, are approximately twice as high in GM compared with WM.23,25,26 Because the same α value was applied to both GSH and Glu, the tissue correction factor cancels in the GSH/Glu ratio, which therefore remains identical to the CSF-only corrected ratio.
Statistical analysis
Statistical analyses were performed using Python (version 3.12) with scipy, statsmodels, and scikit-learn libraries. Continuous variables were expressed as mean ± standard deviation (SD) and compared using one-way analysis of variance (ANOVA) for normally distributed data or Kruskal-Wallis test for non-normally distributed data. Categorical variables were compared using chi-square tests. Post-hoc pairwise comparisons were performed using Tukey's honestly significant difference (HSD) test for multiple comparisons.
Effect sizes were calculated using Cohen's d for pairwise comparisons and eta-squared (η2) for ANOVA. Analysis of covariance (ANCOVA) was used to control for potential confounders including age and sex.
Receiver operating characteristic (ROC) curve analysis was performed to evaluate the diagnostic performance of metabolite ratios for distinguishing migraine from non-migraine subjects. The optimal cutoff value was determined using Youden's index (J = sensitivity + specificity - 1). Pearson or Spearman correlation coefficients were calculated to examine relationships between metabolite concentrations and clinical variables. A two-tailed p-value < 0.05 was considered statistically significant.
Results
Demographic and clinical characteristics
Demographic characteristics of the study participants are presented in Table 1. No significant differences were observed among the four groups in terms of age (F = 0.93, p = 0.429), sex distribution (χ2 = 7.78, p = 0.051), or thalamic region scanned (χ2 = 0.13, p = 0.988). The mean age of all participants was 29.4 ± 10.7 years, with a female predominance (64.9%).
Demographic and clinical characteristics of study participants.
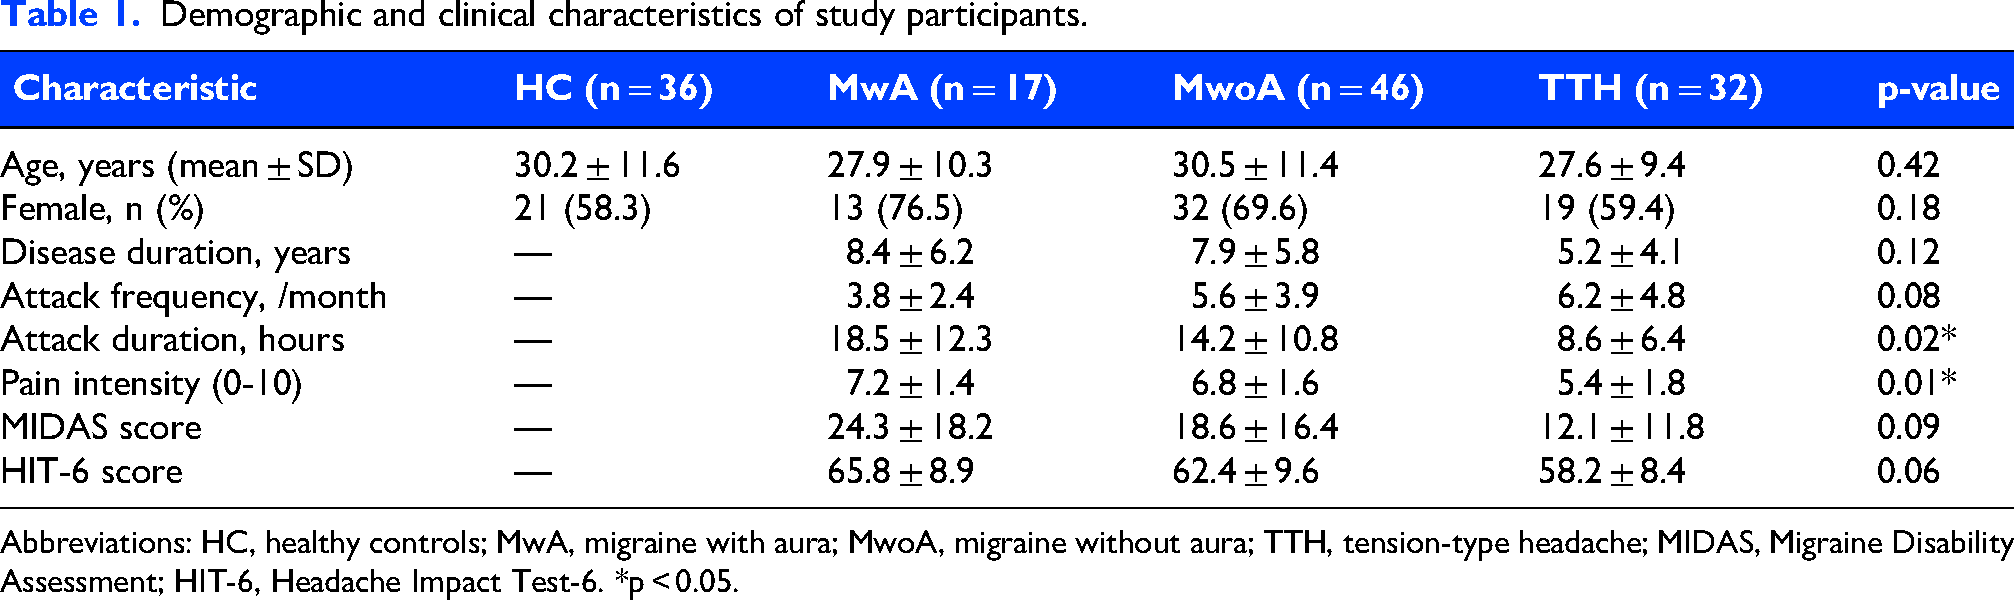
Abbreviations: HC, healthy controls; MwA, migraine with aura; MwoA, migraine without aura; TTH, tension-type headache; MIDAS, Migraine Disability Assessment; HIT-6, Headache Impact Test-6. *p < 0.05.
Metabolite concentrations
Table 2 presents the tissue-corrected metabolite concentrations and ratios across the four groups. Among the individual metabolites, only GSH showed a significant difference across groups (F = 32.19, p < 0.001, η2 = 0.432), with migraine patients (both MwA and MwoA) demonstrating significantly lower GSH levels compared to HC and TTH. No significant group differences were observed for Glu, mI, tCho, NAA, NAAG, or tNAA (all p > 0.05).
Thalamic metabolite concentrations and statistical comparisons.
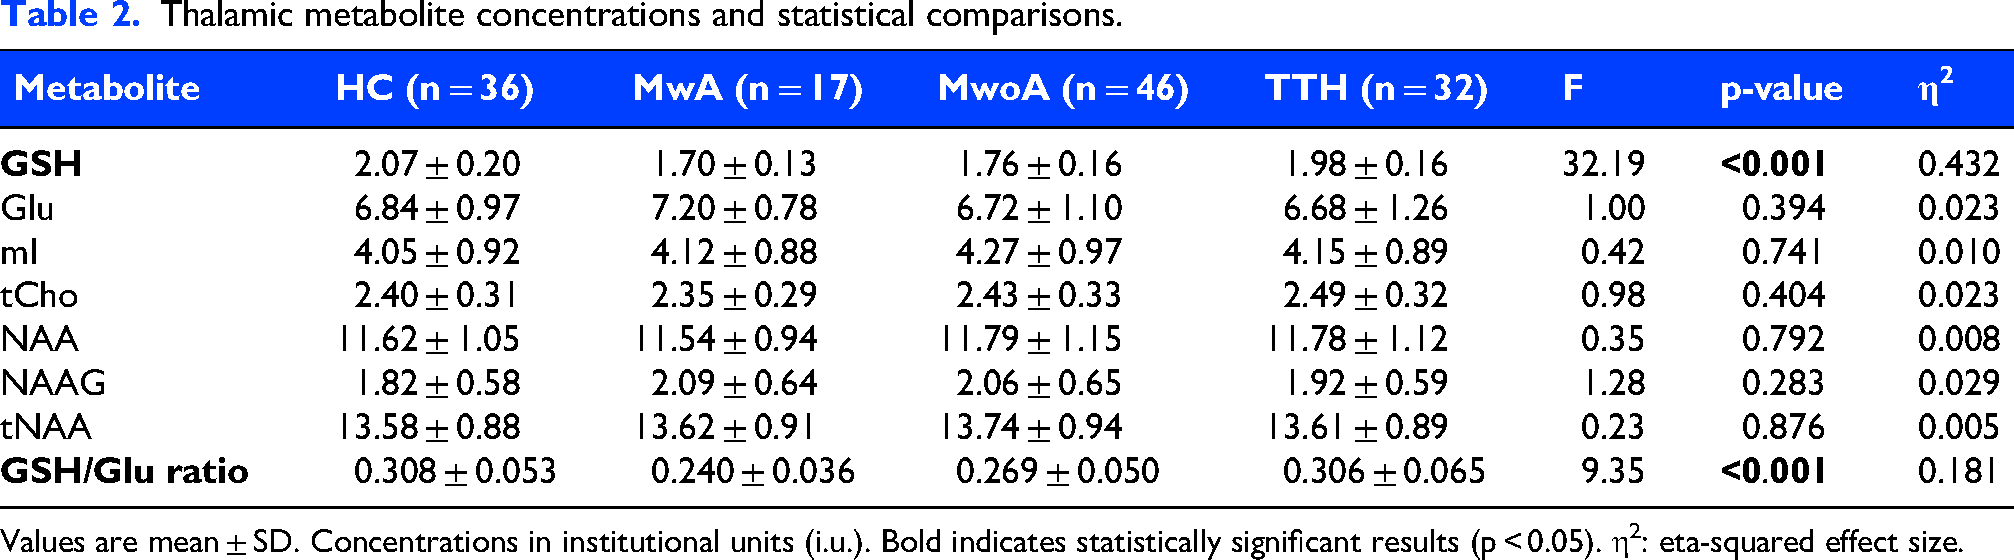
Values are mean ± SD. Concentrations in institutional units (i.u.). Bold indicates statistically significant results (p < 0.05). η2: eta-squared effect size.
GSH/glu ratio: Primary outcome
The GSH/Glu ratio, our primary outcome measure, differed significantly among the four groups (F = 9.41, p < 0.001, η2 = 0.183), representing a large effect size (Figure 1). Post-hoc Tukey HSD analysis revealed that MwA patients had significantly lower GSH/Glu ratios compared to HC (mean difference = −0.070, p < 0.001) and TTH (mean difference = −0.068, p < 0.001). Similarly, MwoA patients showed significantly lower ratios compared to HC (mean difference = −0.040, p = 0.006) and TTH (mean difference = −0.038, p = 0.013). No significant difference was observed between HC and TTH (p = 0.999), or between MwA and MwoA (p = 0.219).

Thalamic GSH/Glu ratio across primary headache subtypes. (A) Bar graph showing mean ± 95% confidence interval. (B) Box plot displaying median, interquartile range, and outliers. (C) Individual data points with group means (horizontal lines). HC, healthy controls; MwA, migraine with aura; MwoA, migraine without aura; TTH, tension-type headache. ***p < 0.001 vs. HC (Tukey HSD test).
Pairwise effect size analysis demonstrated large effects for HC vs. MwA (Cohen’s d = 1.47) and MwA vs. TTH (d = 1.19), medium effects for HC vs. MwoA (d = 0.79) and MwoA vs. TTH (d = 0.67), and negligible effect for HC vs. TTH (d = 0.03) (Table 3).
Pairwise comparisons of GSH/glu ratio with effect sizes and bootstrap confidence intervals.
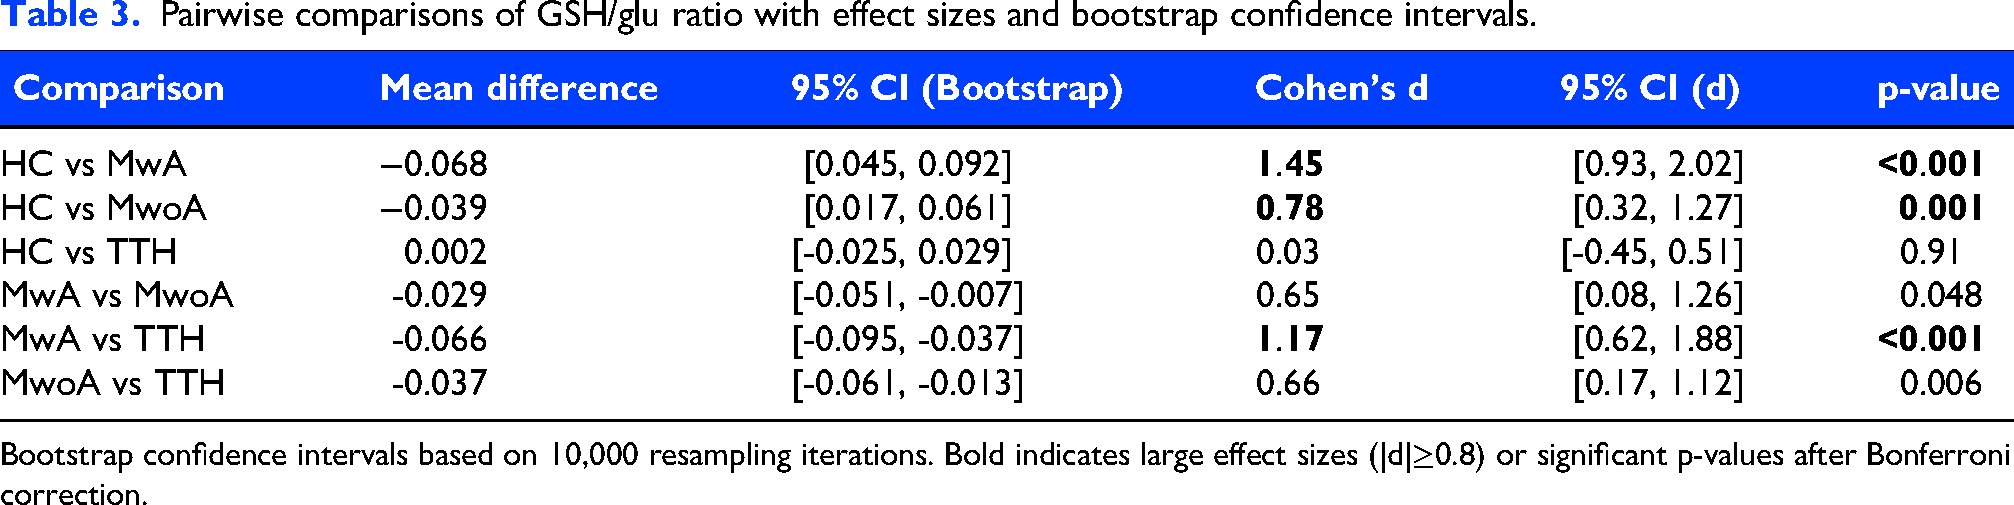
Bootstrap confidence intervals based on 10,000 resampling iterations. Bold indicates large effect sizes (|d|≥0.8) or significant p-values after Bonferroni correction.
GSH and glutamate components
To further characterize the metabolic alterations, we examined GSH and Glu levels separately (Figure 2). After tissue correction, GSH levels were significantly reduced in migraine patients (MwA: 3.067 ± 0.241; MwoA: 3.165 ± 0.286) compared to HC (3.512 ± 0.338, p < 0.001 for both). In contrast, Glu levels showed no significant differences among groups (p = 0.401), though MwA patients exhibited a non-significant trend toward higher Glu levels (12.963 ± 1.401). The combination of reduced GSH and unchanged (or slightly elevated) Glu levels in migraine patients resulted in the observed reduction in the GSH/Glu ratio.
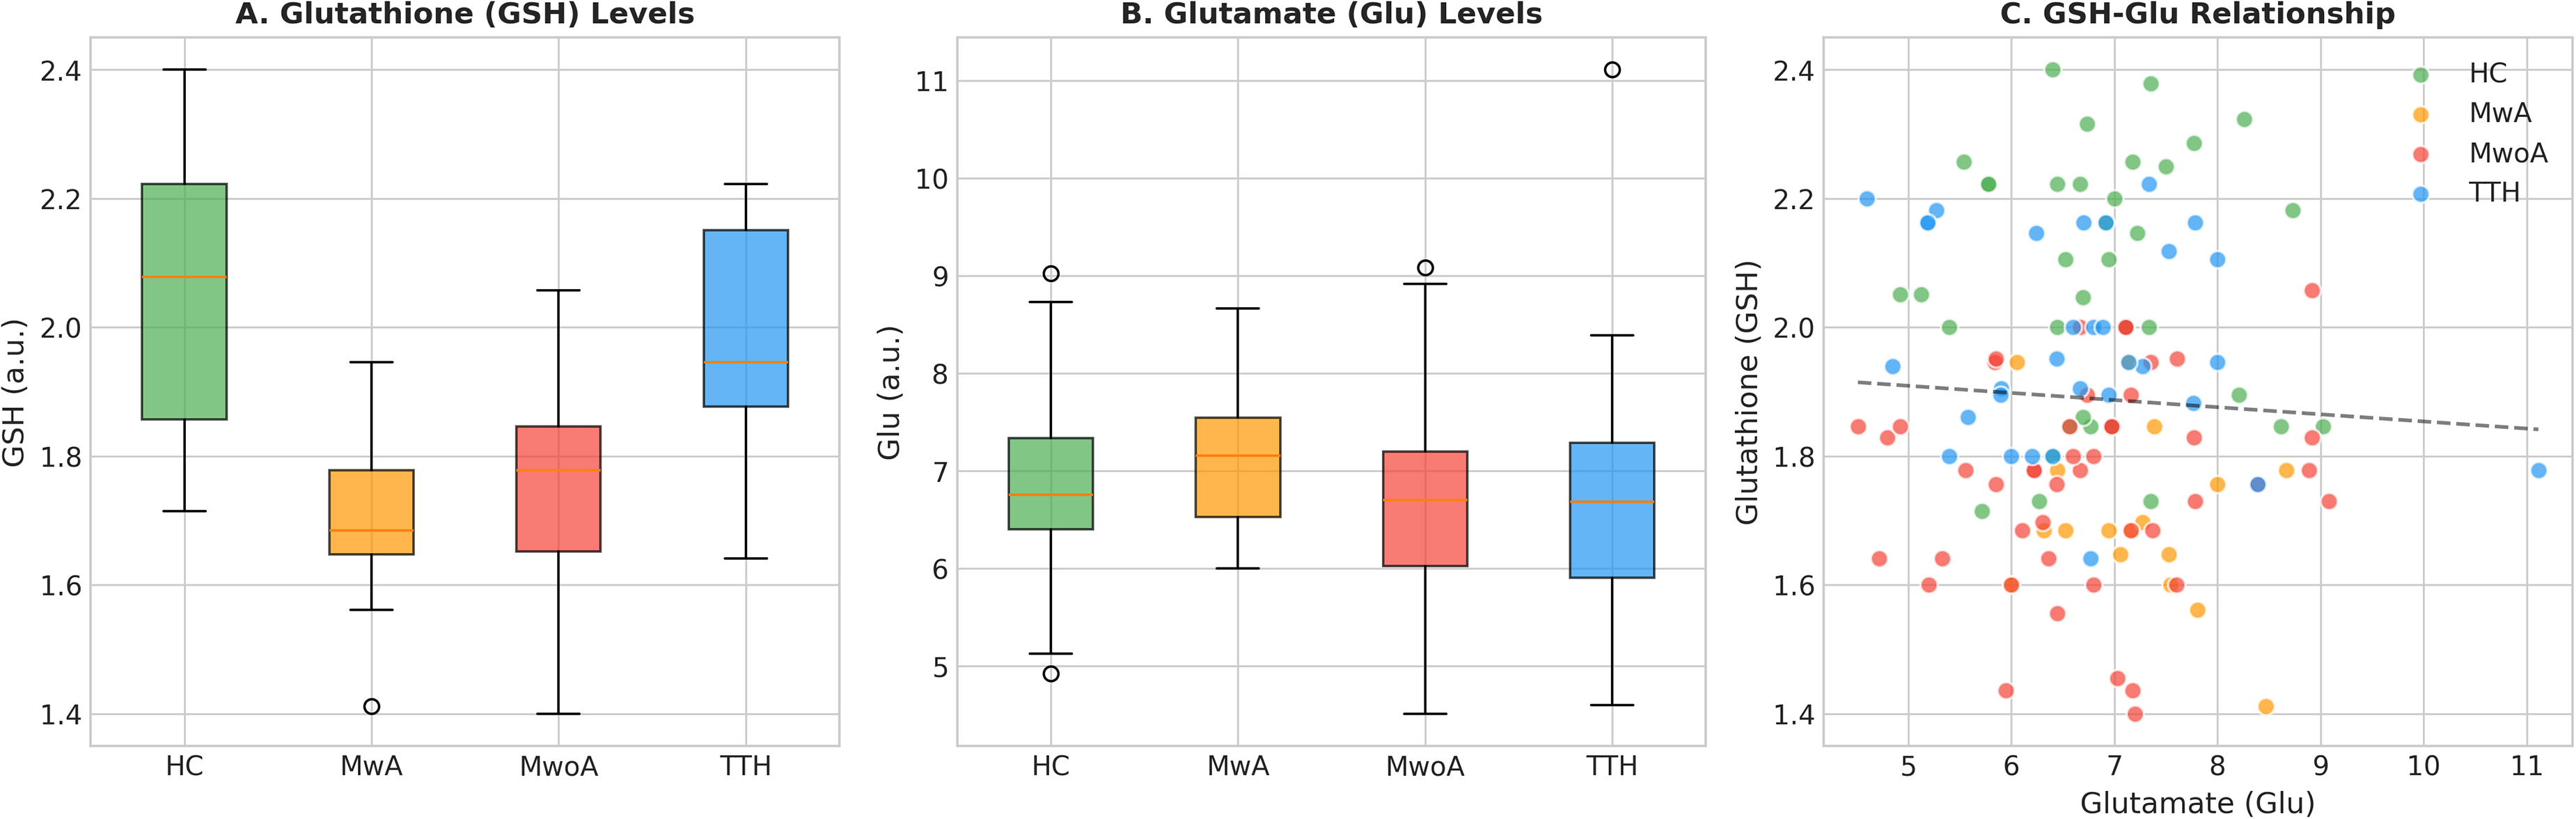
Individual metabolite analysis. (A) Glutathione (GSH) levels showing significant reductions in migraine groups. (B) Glutamate (Glu) levels showing no significant group differences. (C) Scatter plot demonstrating the relationship between GSH and Glu across groups.
Subgroup and sensitivity analyses
To examine the robustness of our findings, we performed several subgroup analyses. When comparing migraine patients (MwA + MwoA combined, n = 63) with non-migraine subjects (HC + TTH combined, n = 68), the migraine group showed significantly lower GSH/Glu ratios (0.271 ± 0.050 vs. 0.319 ± 0.060; t = −4.96, p < 0.001, d = 0.87).
Sex-stratified analysis revealed that the group effect on GSH/Glu ratio remained significant in females (F = 7.62, p < 0.001) and showed a trend toward significance in males (F = 2.66, p = 0.060). Region-stratified analysis confirmed significant group differences in both left thalamus (F = 6.27, p < 0.001) and right thalamus (F = 3.80, p = 0.016). Age-stratified analysis showed consistent group effects across young (<25 years, F = 4.79, p = 0.005), middle-aged (24–40 years, F = 4.86, p = 0.005), and older (>40 years, F = 4.58, p = 0.030) subgroups.
Two-way ANOVA examining Group × Region interaction showed a significant main effect of Group (F = 9.24, p < 0.001) but no significant Region effect (F = 1.01, p = 0.318) or Group × Region interaction (F = 0.74, p = 0.529). ANCOVA controlling for age and sex confirmed the significant group effect on GSH/Glu ratio (F = 9.12, p < 0.001).
Diagnostic performance
Exploratory ROC curve analysis was performed within the discovery cohort to characterize the discriminative ability of metabolite measures for distinguishing migraine from non-migraine subjects (Figure 3). The GSH/Glu ratio achieved an apparent AUC of 0.758 (95% CI: 0.67–0.85) with an optimal cutoff of 0.286 (sensitivity: 71.4%, specificity: 73.5%). GSH alone demonstrated higher discriminative ability with an apparent AUC of 0.874 (95% CI: 0.81–0.94), while Glu alone showed poor discriminative ability (AUC = 0.535). These values were derived from the discovery cohort and require independent validation before any conclusions regarding diagnostic utility can be drawn.
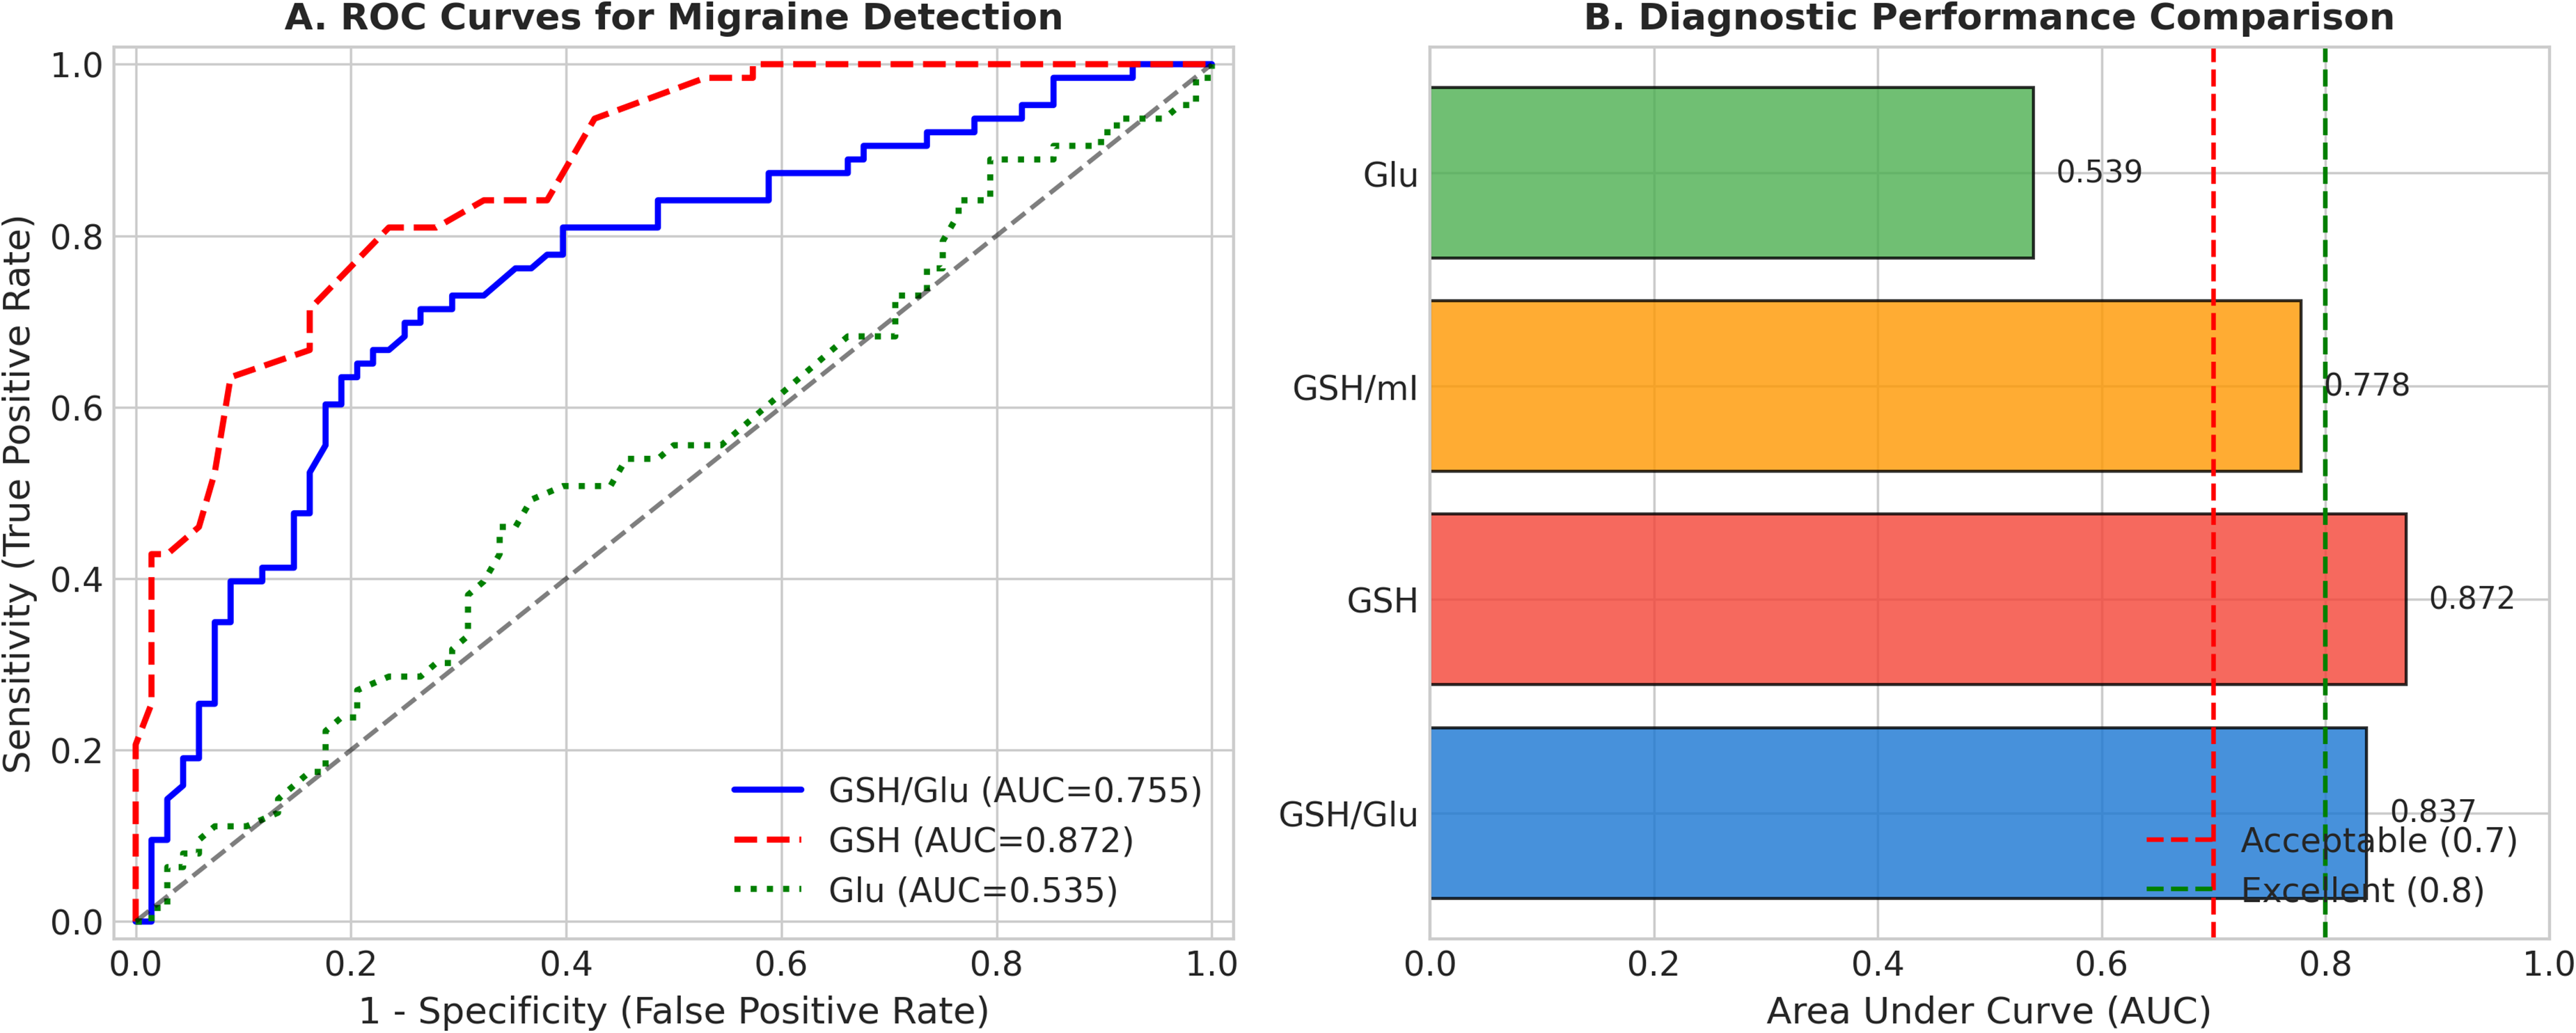
Diagnostic performance analysis. (A) Receiver operating characteristic (ROC) curves for distinguishing migraine from non-migraine subjects using GSH/Glu ratio, GSH alone, and Glu alone. (B) Comparison of area under the curve (AUC) values across different metabolite measures. Dashed lines indicate acceptable (0.7) and excellent (0.8) diagnostic thresholds.
For the four-class classification (HC, MwA, MwoA, TTH), a logistic regression model using all metabolites and ratios achieved a cross-validated accuracy of 40.5 ± 2.3%, which was significantly above the chance level (25%) but indicated substantial overlap among groups.
Correlation and subgroup analyses
Correlation analyses revealed no significant association between GSH/Glu ratio and age in any group (all p > 0.05). Inter-metabolite correlation analysis showed a strong negative correlation between GSH/Glu ratio and Glu (r = −0.796, p < 0.001), a moderate positive correlation with GSH (r = 0.607, p < 0.001), and weak correlations with other metabolites (Figure 4).
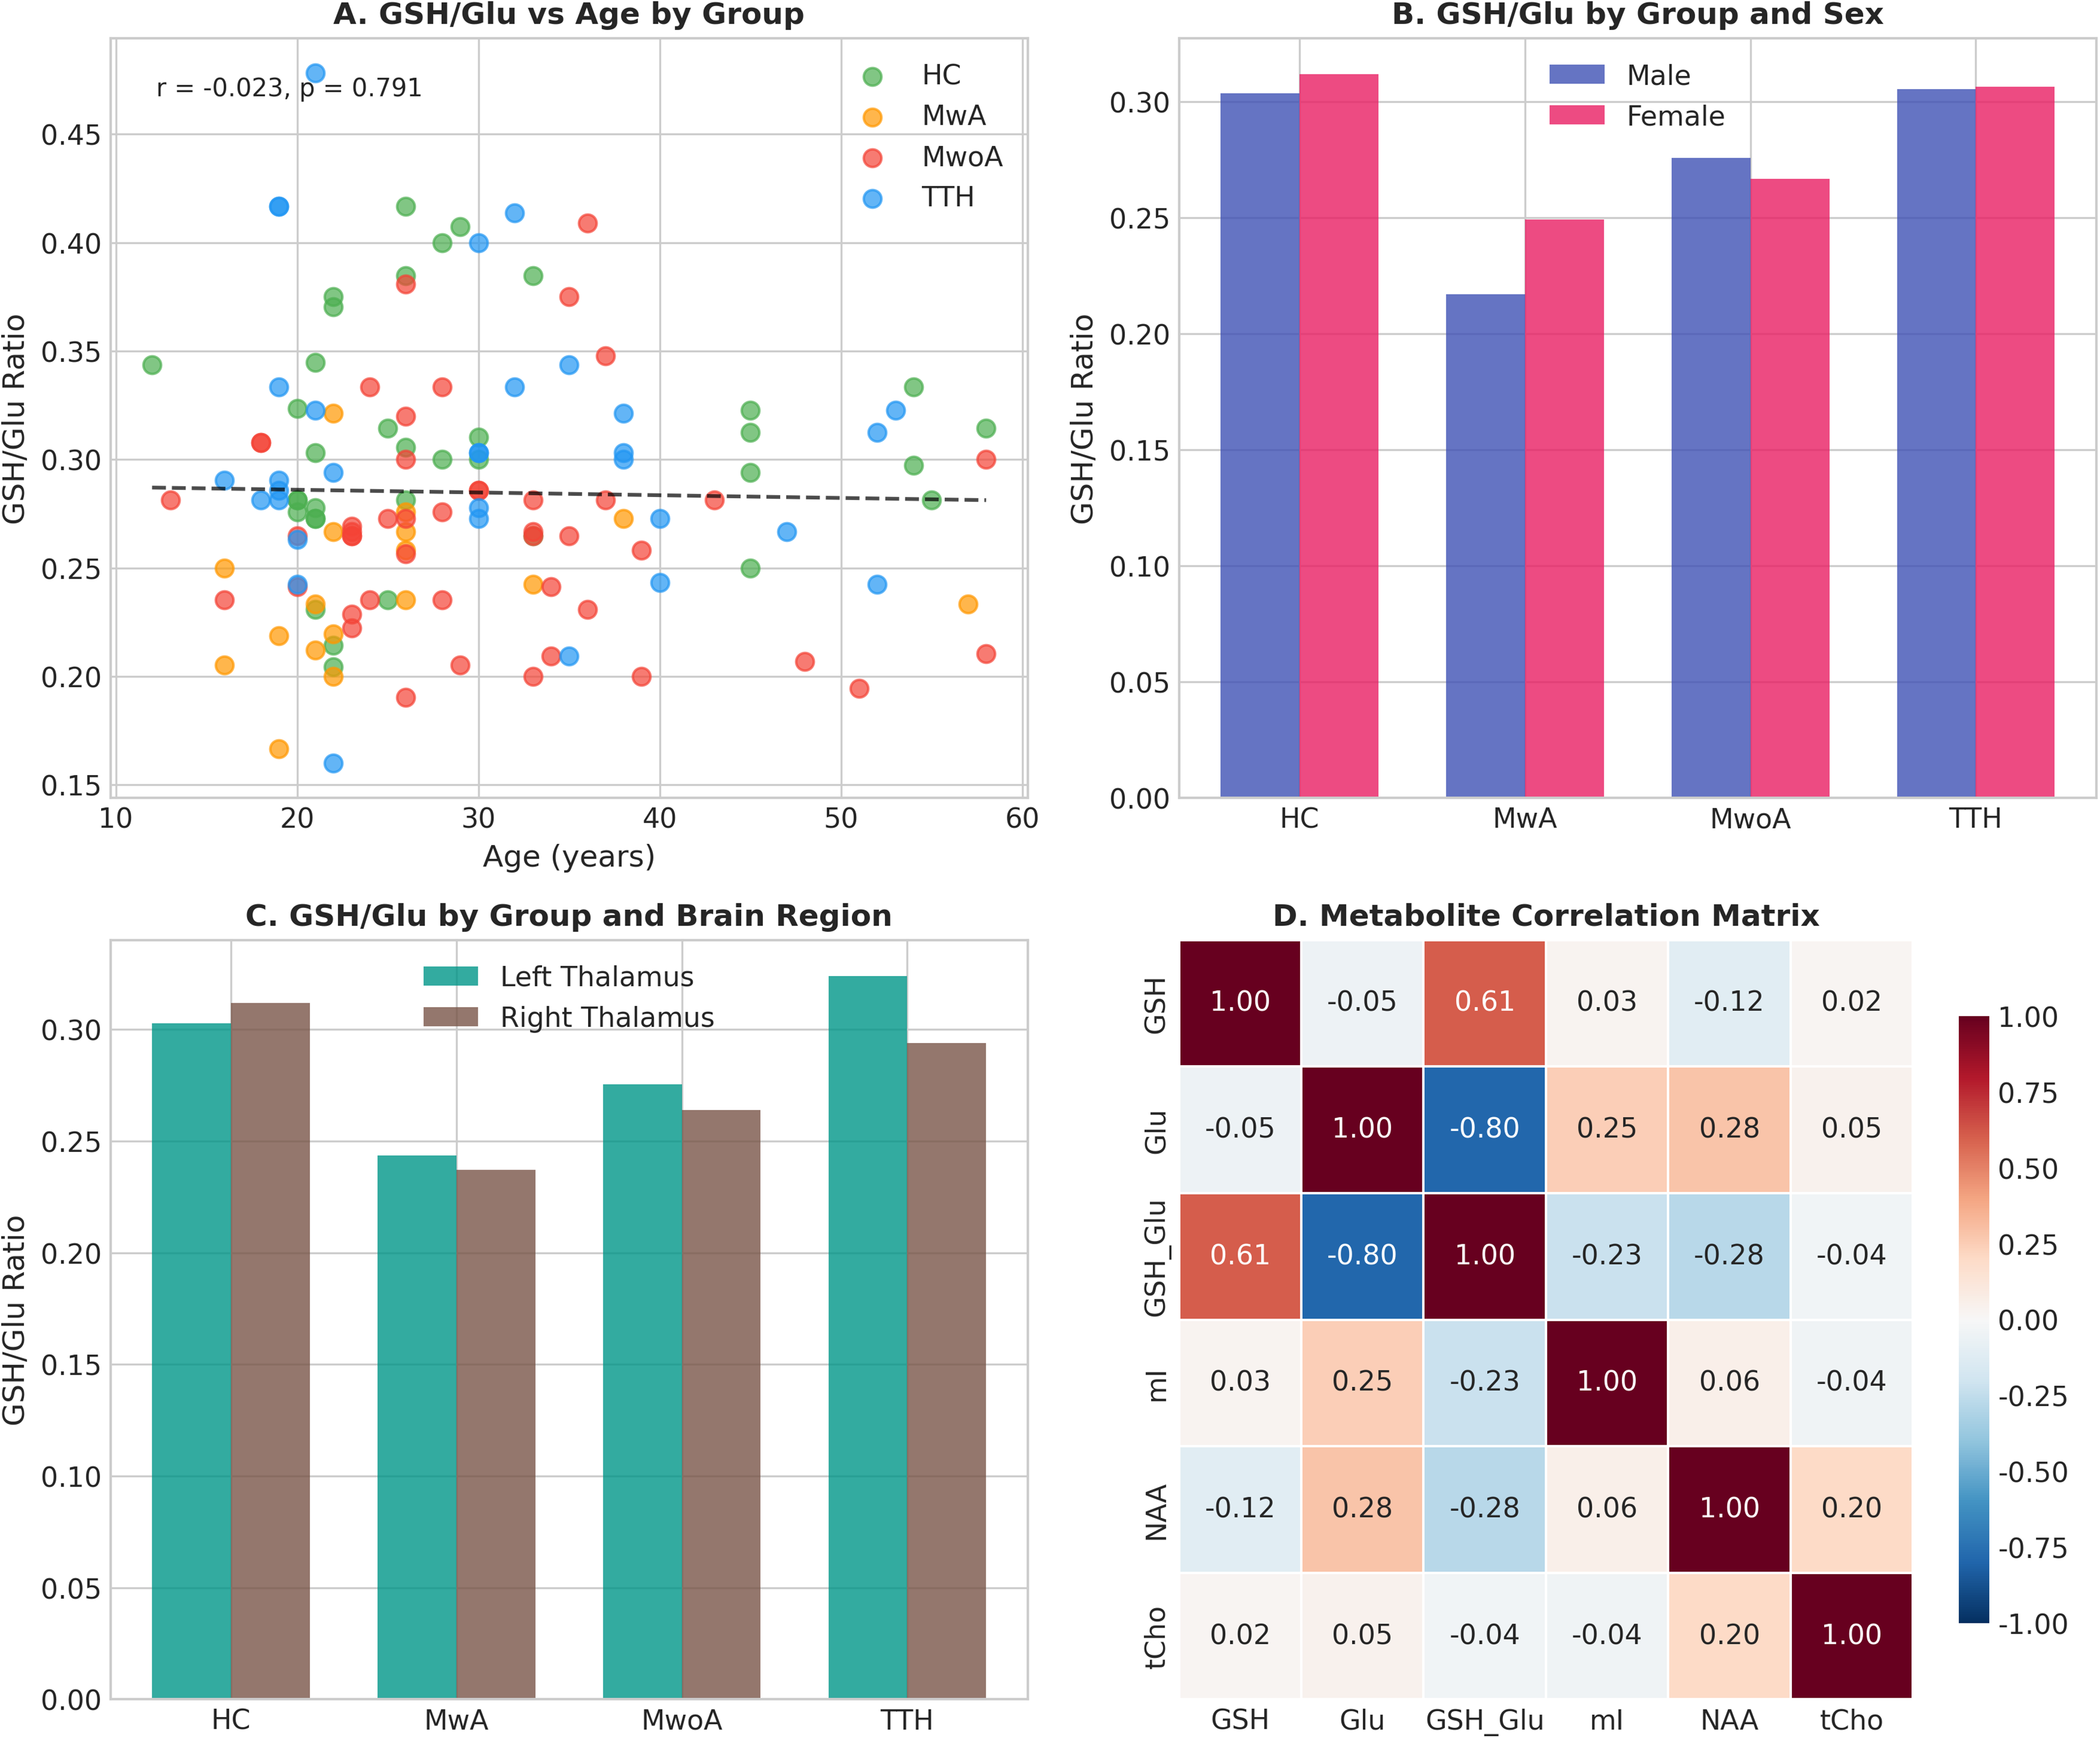
Subgroup and correlation analyses. (A) Relationship between GSH/Glu ratio and age across groups. (B) GSH/Glu ratio stratified by group and sex. (C) GSH/Glu ratio stratified by group and brain region. (D) Correlation matrix among metabolites showing inter-relationships.
Discussion
To our knowledge, this is the first study to investigate the thalamic GSH/Glu ratio across different primary headache subtypes using 1H-MRS. Our principal finding is that migraine patients, both with and without aura, exhibit significantly reduced GSH/Glu ratios compared to healthy controls and TTH patients. This reduction was driven primarily by decreased GSH levels in migraine, supporting the oxidative stress-excitotoxicity imbalance hypothesis in migraine pathophysiology.
GSH/glu ratio as a marker of oxidative-excitatory balance
The GSH/Glu ratio represents the balance between antioxidant defense capacity and excitatory neurotransmission. GSH is the brain's primary antioxidant, protecting neurons against oxidative damage by neutralizing reactive oxygen species8,27 Glutamate, while essential for normal neurotransmission, can induce excitotoxic neuronal injury when present in excess or when antioxidant defenses are compromised. 28 It is important to note that the reduced GSH/Glu ratio in migraine was driven primarily by decreased GSH, with glutamate levels remaining comparable across groups. This pattern suggests that migraine is characterized by diminished antioxidant reserve rather than glutamatergic hyperactivity during the interictal state. However, the ratio remains conceptually meaningful: normal glutamate levels in the context of reduced GSH indicate a state of relative vulnerability, wherein the oxidative consequences of routine excitatory neurotransmission may not be adequately buffered.
Previous studies have independently reported alterations in GSH and glutamate in migraine. Li et al. demonstrated reduced GSH/tCr ratios in the occipital lobe of migraine patients during attacks, with correlation to attack frequency. 12 Bathel et al. found increased thalamic glutamate/glutamine levels in migraine without aura patients. 15 Our study extends these findings by examining both metabolites simultaneously and quantifying their ratio, providing a more integrated measure of the oxidative-excitatory balance.
Pathophysiological implications
The observed reduction in GSH/Glu ratio in migraine patients may have several pathophysiological implications. First, reduced GSH levels indicate compromised antioxidant defense, which may render neurons more susceptible to oxidative damage and contribute to the phenomenon of cortical spreading depression (CSD), a proposed mechanism underlying migraine aura.29,30 CSD involves waves of neuronal depolarization that are associated with massive glutamate release and subsequent oxidative stress.
Second, the relative preservation of glutamate levels in the context of reduced GSH may create conditions favoring glutamate-mediated excitotoxicity. Glutamate receptor activation, particularly of NMDA receptors, generates reactive oxygen species through mitochondrial pathways. 31 In the absence of adequate GSH-mediated antioxidant protection, this could lead to a vicious cycle of neuronal hyperexcitability and oxidative damage.
Third, the thalamus plays a crucial role in sensory processing and pain modulation during migraine attacks.18,19 Noseda et al. demonstrated that thalamic trigeminovascular neurons are directly modulated by glutamatergic and GABAergic inputs, and their hyperexcitability may contribute to the sensory hypersensitivity (photophobia, phonophobia) characteristic of migraine. 32 Our finding of altered GSH/Glu ratio in the thalamus suggests that oxidative-excitatory imbalance in this region may contribute to migraine symptoms.
Differentiation between migraine and TTH
A notable finding of our study is that TTH patients showed GSH/Glu ratios comparable to healthy controls, clearly distinguishing them from migraine patients. This differential pattern suggests that oxidative stress-excitotoxicity imbalance may be specific to migraine pathophysiology rather than a general feature of primary headache disorders.
The pathophysiology of TTH differs fundamentally from migraine, primarily involving peripheral myofascial mechanisms and central sensitization through nitric oxide-mediated pathways, rather than the neurovascular mechanisms and CSD implicated in migraine.3,4,33 Our findings support this distinction at the neurochemical level, with metabolic alterations in the thalamus being specific to migraine.
Diagnostic and clinical implications
In exploratory ROC analysis within the discovery cohort, GSH demonstrated an apparent AUC of 0.874 for distinguishing migraine from non-migraine subjects, while the GSH/Glu ratio achieved an apparent AUC of 0.758. However, as these estimates were derived from the same dataset without independent validation, they are subject to optimism bias and should be interpreted as preliminary findings requiring external replication. The present study was not designed as a biomarker validation study, and no claims regarding clinical diagnostic utility can be made based on these data alone. Future prospective studies with independent validation cohorts are essential before GSH or the GSH/Glu ratio can be considered candidate biomarkers for migraine.
From a therapeutic perspective, our findings may provide rationale for antioxidant supplementation in migraine prophylaxis. Several nutraceuticals with antioxidant properties, including riboflavin, coenzyme Q10, and alpha-lipoic acid, have shown efficacy in migraine prevention.34–36 N-acetylcysteine (NAC), a GSH precursor, has shown promise in animal models of migraine and may warrant clinical investigation. 37
Limitations
Several limitations should be acknowledged. First, the cross-sectional design precludes determination of causality; reduced GSH/Glu ratio may be a consequence rather than a cause of migraine. Longitudinal studies examining metabolite changes during and between migraine attacks are needed. Second, the sample size for certain subgroups (particularly MwA, n = 17) was relatively small, which may limit the stability of subgroup-specific estimates and the statistical power for some pairwise comparisons. Although the very large effect size observed for the HC vs. MwA comparison (Cohen's d = 1.47) and the bootstrap validation support the robustness of this finding, replication in larger MwA cohorts is warranted to confirm the magnitude and specificity of the metabolic alterations in this subgroup. Third, clinical data on headache characteristics were incomplete for some patients, preventing comprehensive correlation analyses. Fourth, we examined only the thalamus; future studies should investigate GSH/Glu ratios in other brain regions implicated in migraine pathophysiology. Fifth, metabolite concentrations were corrected for partial volume effects using the Harris et al. 23 tissue correction framework, which accounts for CSF dilution and differential GM/WM metabolite concentrations. An α value of 0.5 was assumed for both GSH and Glu, representing a 2:1 GM-to-WM concentration ratio consistent with published data for glutamate and other major metabolites.25,26 However, tissue-specific GSH reference values from MEGA-PRESS at 3T are not yet definitively established; Srinivasan et al. 38 reported higher GSH in GM than WM at 7T, supporting the direction of this assumption, although the precise α value for GSH may differ. Because the same α was applied to both GSH and Glu, the α-correction factor cancels in the GSH/Glu ratio, rendering this primary outcome insensitive to the specific choice of α. Individual metabolite concentrations (e.g., GSH alone) should be interpreted with awareness that the assumed α introduces some uncertainty in absolute values. Sixth, the diagnostic performance metrics (AUC values) reported in this study were derived from the same cross-sectional dataset used for the primary analysis, without independent external validation. As such, these values are subject to optimism bias and likely overestimate the true diagnostic accuracy that would be observed in independent populations. The present study should be considered hypothesis-generating with respect to biomarker potential; formal biomarker validation would require prospective studies with pre-specified thresholds tested in independent cohorts, ideally across multiple sites and MRS platforms. Finally, MRS measures reflect total tissue concentrations and cannot distinguish between intracellular and extracellular compartments.
Conclusions
This study demonstrates that migraine patients exhibit significantly reduced thalamic GSH levels and consequently decreased GSH/Glu ratios compared to healthy controls and TTH patients. Following tissue correction for partial volume effects, the data primarily support altered antioxidant status as the predominant metabolic abnormality in interictal migraine. The GSH/Glu ratio, while driven by GSH reduction, provides a useful framework for conceptualizing the relative vulnerability to oxidative damage during normal excitatory neurotransmission, which may predispose to migraine attacks when additional metabolic stressors are encountered. While the observed metabolic differences between migraine and non-migraine groups are statistically robust, the diagnostic performance estimates reported herein are exploratory and derived from the discovery cohort; independent validation studies are required before any conclusions regarding biomarker potential can be drawn. Our findings may support the rationale for antioxidant-based therapeutic strategies in migraine and highlight the need for further research into the mechanisms linking oxidative stress and excitatory neurotransmission in migraine pathogenesis.
Key findings:
Migraine is associated with significantly reduced thalamic glutathione (GSH) levels, resulting in decreased GSH/glutamate (Glu) ratios that indicate diminished antioxidant buffering capacity.
This metabolic alteration is present in both migraine with and without aura but not in tension-type headache, supporting distinct pathophysiological mechanisms.
Tissue-corrected thalamic metabolic profiling may help clarify migraine vulnerability and guide therapeutic strategies targeting oxidative stress.
Supplemental Material
sj-docx-1-cep-10.1177_03331024261462792 - Supplemental material for Differential thalamic GSH/Glu ratios Among primary headache subtypes and clinical implications: A cross-sectional magnetic resonance spectroscopy study
Supplemental material, sj-docx-1-cep-10.1177_03331024261462792 for Differential thalamic GSH/Glu ratios Among primary headache subtypes and clinical implications: A cross-sectional magnetic resonance spectroscopy study by Yinhua Jin, Rui Wang, Hongying Huang, Zhongrouwen Ren and Gen Yan in Cephalalgia
Supplemental Material
sj-docx-2-cep-10.1177_03331024261462792 - Supplemental material for Differential thalamic GSH/Glu ratios Among primary headache subtypes and clinical implications: A cross-sectional magnetic resonance spectroscopy study
Supplemental material, sj-docx-2-cep-10.1177_03331024261462792 for Differential thalamic GSH/Glu ratios Among primary headache subtypes and clinical implications: A cross-sectional magnetic resonance spectroscopy study by Yinhua Jin, Rui Wang, Hongying Huang, Zhongrouwen Ren and Gen Yan in Cephalalgia
Supplemental Material
sj-png-3-cep-10.1177_03331024261462792 - Supplemental material for Differential thalamic GSH/Glu ratios Among primary headache subtypes and clinical implications: A cross-sectional magnetic resonance spectroscopy study
Supplemental material, sj-png-3-cep-10.1177_03331024261462792 for Differential thalamic GSH/Glu ratios Among primary headache subtypes and clinical implications: A cross-sectional magnetic resonance spectroscopy study by Yinhua Jin, Rui Wang, Hongying Huang, Zhongrouwen Ren and Gen Yan in Cephalalgia
Footnotes
Acknowledgements
None.

Ethical considerations
The study was approved by the Ethics Committee of Second Affiliated Hospital of Xiamen Medical College (No. 2024048).
Consent to participate
All participants provided written informed consent.
Consent for publication
All authors have read and approved the final version of this manuscript and consent to its publication in Cephalalgia if accepted.
Author contributions
Using the CRediT taxonomy, author contributions are as follows:
Funding
The authors disclosed receipt of the following financial support for the research, authorship, and/or publication of this article: Fujian Province Natural Science Foundation-2023D006.
Declaration of conflicting interests
The authors declared no potential conflicts of interest with respect to the research, authorship, and/or publication of this article.
Data availability statement
The datasets used in this study are available from the corresponding author upon reasonable request.
Open practices
Not applicable.
Supplemental material
Supplemental material for this article is available online.
References
Supplementary Material
Please find the following supplemental material available below.
For Open Access articles published under a Creative Commons License, all supplemental material carries the same license as the article it is associated with.
For non-Open Access articles published, all supplemental material carries a non-exclusive license, and permission requests for re-use of supplemental material or any part of supplemental material shall be sent directly to the copyright owner as specified in the copyright notice associated with the article.

