






Abstract
Background
Insulin resistance (IR) may influence the treatment responses of medication-overuse headache (MOH), but evidence is limited. This study explored the relationship of four surrogate IR indices—triglyceride-glucose (TyG) index, triglyceride to HDL-C (TG/HDL-C) ratio, TyG-body mass index (TyG-BMI), and metabolic score for IR (METS-IR)—with six-month treatment responses in MOH patients after withdrawal and preventive therapy.
Methods
MOH patients from June 2020 to July 2024 were consecutively enrolled in this retrospective cohort study. Patients were categorized into four groups according to quartiles of each baseline IR index. Six months post-treatment, patients reducing monthly headache days by at least 50% from baseline and stopping acute medication overuse were deemed to achieve a ‘50% response status’; others were classified as a ‘non-50% response status’. Logistic regression analyses were utilized to assess the relationship of the IR indices with 50% response status.
Results
In the final analysis of 201 enrolled MOH patients (71.6% female) out of an initial 264, 109 (54.2%) achieved a 50% response status at the six-month follow-up. In unadjusted analysis, the TyG index (continuous: OR 1.72, 95% CI 0.97–3.06, P = 0.064; highest vs. lowest quartile: OR 2.16, 95% CI 0.97–4.81, P = 0.058) showed no significant association with 50% response status. After adjustment, both the continuous TyG index (OR 2.25, 95% CI 1.07–4.70, P = 0.032) and the highest quartile (OR 2.95, 95% CI 1.09–8.00, P = 0.033) became significantly associated with the outcome. In contrast, the TG/HDL-C ratio, METS-IR, and TyG-BMI index did not reach significance in the final adjusted model.
Conclusions
The TyG index was associated with 50% response status in MOH patients, warranting further validation.
Introduction
Medication-overuse headache (MOH) is a chronic secondary headache caused primarily by the overuse of acute medications in individuals with migraine or tension-type headache (TTH), affecting approximately 59 million people worldwide. 1 It greatly impacts quality of life and is one of the top 20 leading causes of disability globally, significantly increasing healthcare costs. 2 The annual cost per MOH patient is €3561, nearly three times that for migraine and ten times that for TTH. 3 The complex pathogenesis of MOH is mainly treated through withdrawal and preventive therapy, yet about 34% of patients continue overusing acute medications six months post-treatment.1,4 Early and optimized risk stratification is crucial for improving MOH prognosis.
Insulin resistance (IR) is the reduced sensitivity of organs or tissues to insulin, affecting glucose absorption and oxidation. 5 It may increase migraine susceptibility and worsen MOH pathology through mechanisms like neural sensitization, impaired energy metabolism, and inflammation.6–9 Recently, combined values from fasting triglyceride (TG), high-density lipoprotein cholesterol (HDL-C), plasma glucose levels, and body mass index (BMI), such as the TG-glucose (TyG) index, TG to HDL-C (TG/HDL-C) ratio, TyG-BMI index, and metabolic score for IR (METS-IR), have emerged as reliable and cost-effective IR biomarkers. 10 While evidence links the TyG and TyG-BMI indices to migraine risk, results are inconsistent.11–14 Our recent research, based on partially overlapping data from the same cohort, showed a negative correlation between the TyG index and monthly headache days in MOH patients, suggesting a potential link to MOH prognosis. 15 However, no studies have explored the relationship between these IR indices and MOH prognosis.
This study aimed to examine the relationship between four IR indices and six-month MOH prognoses after withdrawal and preventive therapy.
Methods
Standard protocol approvals and patient consents
The protocol of this retrospective cohort study was approved by the Ethics Committee on Biomedical Research, West China Hospital of Sichuan University (No. 2025-1889). Informed consent was waived due to the retrospective collection of deidentified data. The preparation of the manuscript adhered to STROBE guidelines.
Study population
Conducted from June 2020 to July 2024, the retrospective cohort study used a prospectively managed database of MOH patients at the tertiary headache clinic of West China Hospital. Diagnoses were independently confirmed by at least two experienced headache specialists using the International Classification of Headache Disorders, 3rd edition (ICHD-3) criteria. 16 Inclusion criteria were: (1) MOH from preexisting migraine/TTH (episodic/chronic) per ICHD-3; (2) age of 18 years or more; (3) no use of migraine preventive medication in the past three months (including beta-blockers, antidepressants, antiepileptics, etc.); and (4) completion of baseline lab tests before withdrawal and preventive therapy. MOH patients were excluded if they had recent infections, hematologic diseases, significant liver or kidney issues, ongoing malignancies, thyroid dysfunction, incomplete records, or lacked data for IR index calculation. Additional exclusions included participation in an interventional study on migraine treatment, suspected familial hypertriglyceridemia (TG ≥ 5.65 mmol/L), or missing follow-up data.
Baseline data collection
During the first visit, demographic and clinical data were collected, such as age, sex, educational level, height, weight, blood pressure, smoking, and drinking status. BMI was calculated as weight divided by height squared (kg/m2). Two headache specialists interviewed each patient to assess baseline headache characteristics, including pre-existing headache types, medication use, duration of headache and overuse, monthly headache days, headache intensity (scored on a Visual Analogue Scale with a range of 0 to 10), 17 monthly days with acute medication, and additional medical history. The 6-item Headache Impact Test (HIT-6), 18 the 14-item Hamilton Anxiety Scale (HAMA-14), 19 and the 24-item Hamilton Depression Scale (HAMD-24) 20 were used to assess quality of life, anxiety, and depression in MOH patients, with higher scores indicating greater impact or severity.
Comorbidities were identified from electronic medical records using international guidelines and consensus statements, without mandatory tests for asymptomatic conditions. The study focused on psychiatric disorders (sleep disturbances, anxiety, depression, and other psychiatric disorders), cardiovascular and cerebrovascular diseases (hypertension, cardiac diseases, and cerebrovascular diseases), obesity, allergic and respiratory conditions (urticaria, rhinitis, and asthma), neck or back pain, gastrointestinal and celiac disorders, rheumatological and other autoimmune disorders, all linked to migraine progression and MOH prognosis.1,21 Diabetes mellitus, hyperlipidemia, antihypertensives (calcium channel blockers or angiotensin receptor blockers), antihyperglycemic agents (metformin, sulfonylureas, insulin, etc.), and antihyperlipidemic agents (statins, fibrates, or cholesterol absorption inhibitors) were also documented.
Before withdrawal and preventive treatment, fasting blood samples were collected and analyzed for platelet and white blood cell counts, fasting plasma glucose (FPG), TG, cholesterol levels, and uric acid. IR indices were computed using the formula: TyG index = Ln [TG (mg/dL) × FPG (mg/dL)/2]; TG/HDL-C = TG (mg/dL)/HDL-C (mg/dL); TyG-BMI index = TyG × BMI (kg/m2); and METS-IR = Ln [(2 × FPG (mg/dL)) + TG (mg/dL)] × BMI (kg/m2)/Ln [HDL-C (mg/dL)]. 10 Patients were categorized into four groups based on quartiles of each baseline IR index: TyG index (T1: ≤ 8.310, T2: 8.310 < TyG index ≤ 8.570, T3: 8.570 < TyG index ≤ 8.905, T4: > 8.905), TG/HDL-C ratio (G1: ≤ 1.570, G2: 1.570 < TG/HDL-C ratio ≤ 2.270, G3: 2.270 < TG/HDL-C ratio ≤ 3.160, G4: > 3.160), TyG-BMI index (B1: ≤ 176.485, B2: 176.485 < TyG-BMI index ≤ 196.630, B3: 196.630 < TyG-BMI index ≤ 216.440, B4: > 216.440 ), and METS-IR (M1: ≤ 29.520, M2: 29.520 < METS-IR ≤ 33.190, M3: 33.190 < METS-IR ≤ 36.305, M4: > 36.305).
Withdrawal and preventive therapy
After blood tests, the enrolled MOH patients were treated based on headache specialists’ decisions, adhering to current guidelines and good clinical practice at the tertiary headache clinic.1,2 They were provided with individualized guidance regarding MOH and withdrawal, involving the cessation of overused analgesics for two months. The withdrawal strategy (abrupt vs. gradual) was tailored based on the clinical judgment of headache specialists, taking into account factors such as the type of analgesic overused, the duration of overuse, and patient preferences. At the time of withdrawal, these patients received guideline-based preventive treatments. The choice of treatment—including topiramate, flunarizine, amitriptyline, selective serotonin-reuptake inhibitors, and serotonin-noradrenaline reuptake inhibitors—was individualized based on comorbidities, potential adverse effects, and prior preventive history. Adjustments were made if preventive treatments were ineffective or had unacceptable adverse effects. After withdrawal, patients were permitted the restricted use of other acute medications.
Follow-up and treatment response assessment
The follow-up procedure was conducted as previously described. 22 Briefly, patients used a paper-based headache calendar to record the characteristics of their headaches. MOH patients were routinely monitored at 2, 4, and 6 months post-treatment via follow-up visits or telephone/WeChat by two headache specialists.
A ‘50% response status’ was defined as the successful discontinuation of overused acute medications along with at least a 50% reduction in monthly headache days compared to baseline, assessed after six months of therapy. Cases not meeting these criteria were classified as a ‘non-50% response status’.22,23
Statistical analysis
Continuous variables, presented as mean ± standard deviation, were assessed for normality using the Shapiro-Wilk test. They were compared as follows: normally distributed data with the analysis of variance (ANOVA) test or independent samples t-test, and non-normally distributed data with the Kruskal–Wallis or Mann-Whitney U test. Post hoc analysis was performed using the Bonferroni multiple comparisons test after the Kruskal–Wallis test and ANOVA. Categorical variables, expressed as numbers and percentages, were compared using the Chi-squared or Fisher's Exact test.
The relationships between IR indices and six-month treatment responses were assessed using both continuous and categorical variables through univariate and multiple logistic regression. To account for potential confounding variables, three logistic regression models were employed: Model 1 was unadjusted; Model 2 was adjusted for age and sex; and Model 3 was adjusted for age, sex, and the following covariates of interest: current smoking/drinking, duration of medication overuse, monthly headache days, HAMA-14 scores, HAMD-24 scores, abrupt withdrawal, and antihyperglycemic/antihyperlipidemic agents. It was important to note that the IR indices were not simultaneously included in the multiple logistic regression model. Exploratory restricted cubic spline (RCS) analysis was applied in a multiple logistic regression model to explore linear or nonlinear links between IR indices and six-month treatment responses. The Akaike information criterion (AIC) helped choose the optimal number of nodes, with a lower AIC indicating a better fit. 24 Three nodes were chosen at the 10th, 50th, and 90th percentiles of the IR indices distribution.
Exploratory subgroup analyses were performed to assess the association between IR indices and treatment responses across strata defined by age, sex, abrupt withdrawal, and flunarizine. Covariates for adjustment were selected based on univariate logistic regression analysis (P < 0.10), including cardiac diseases, abrupt withdrawal, flunarizine, and antihypertensives, as well as age and sex. In each subgroup analysis, all covariates except the stratification variable itself were included. We also conducted further exploratory analyses to investigate the relationship between the METS-IR or TyG-BMI index and 50% response status in female patients and those with abrupt withdrawal.
We performed a quantitative sensitivity analysis using the E-value and its lower control limit (LCL) to gauge unmeasured confounding.25,26 The E-value represents the minimum strength of association an unmeasured confounder would need to have with both IR indices and six-month treatment responses, given the measured covariates, to account for the observed association. E-values for significant multiple logistic regression results were computed online (https://www.evalue-calculator.com/), with larger values indicating greater robustness to potential confounding.
All statistical analyses were conducted using IBM SPSS Statistics version 22.0 and R version 4.5.1. A two-sided P < 0.05 was considered statistically significant for both primary and exploratory analyses.
Results
A total of 264 MOH patients were screened, with 201 included in the final analysis (Figure 1). Their mean age was 53.00 ± 10.11 years, and 144 (71.6%) were female. Of these, 109 (54.2%) achieved a 50% response status, while 92 (45.8%) did not reach this status at the six-month follow-up.
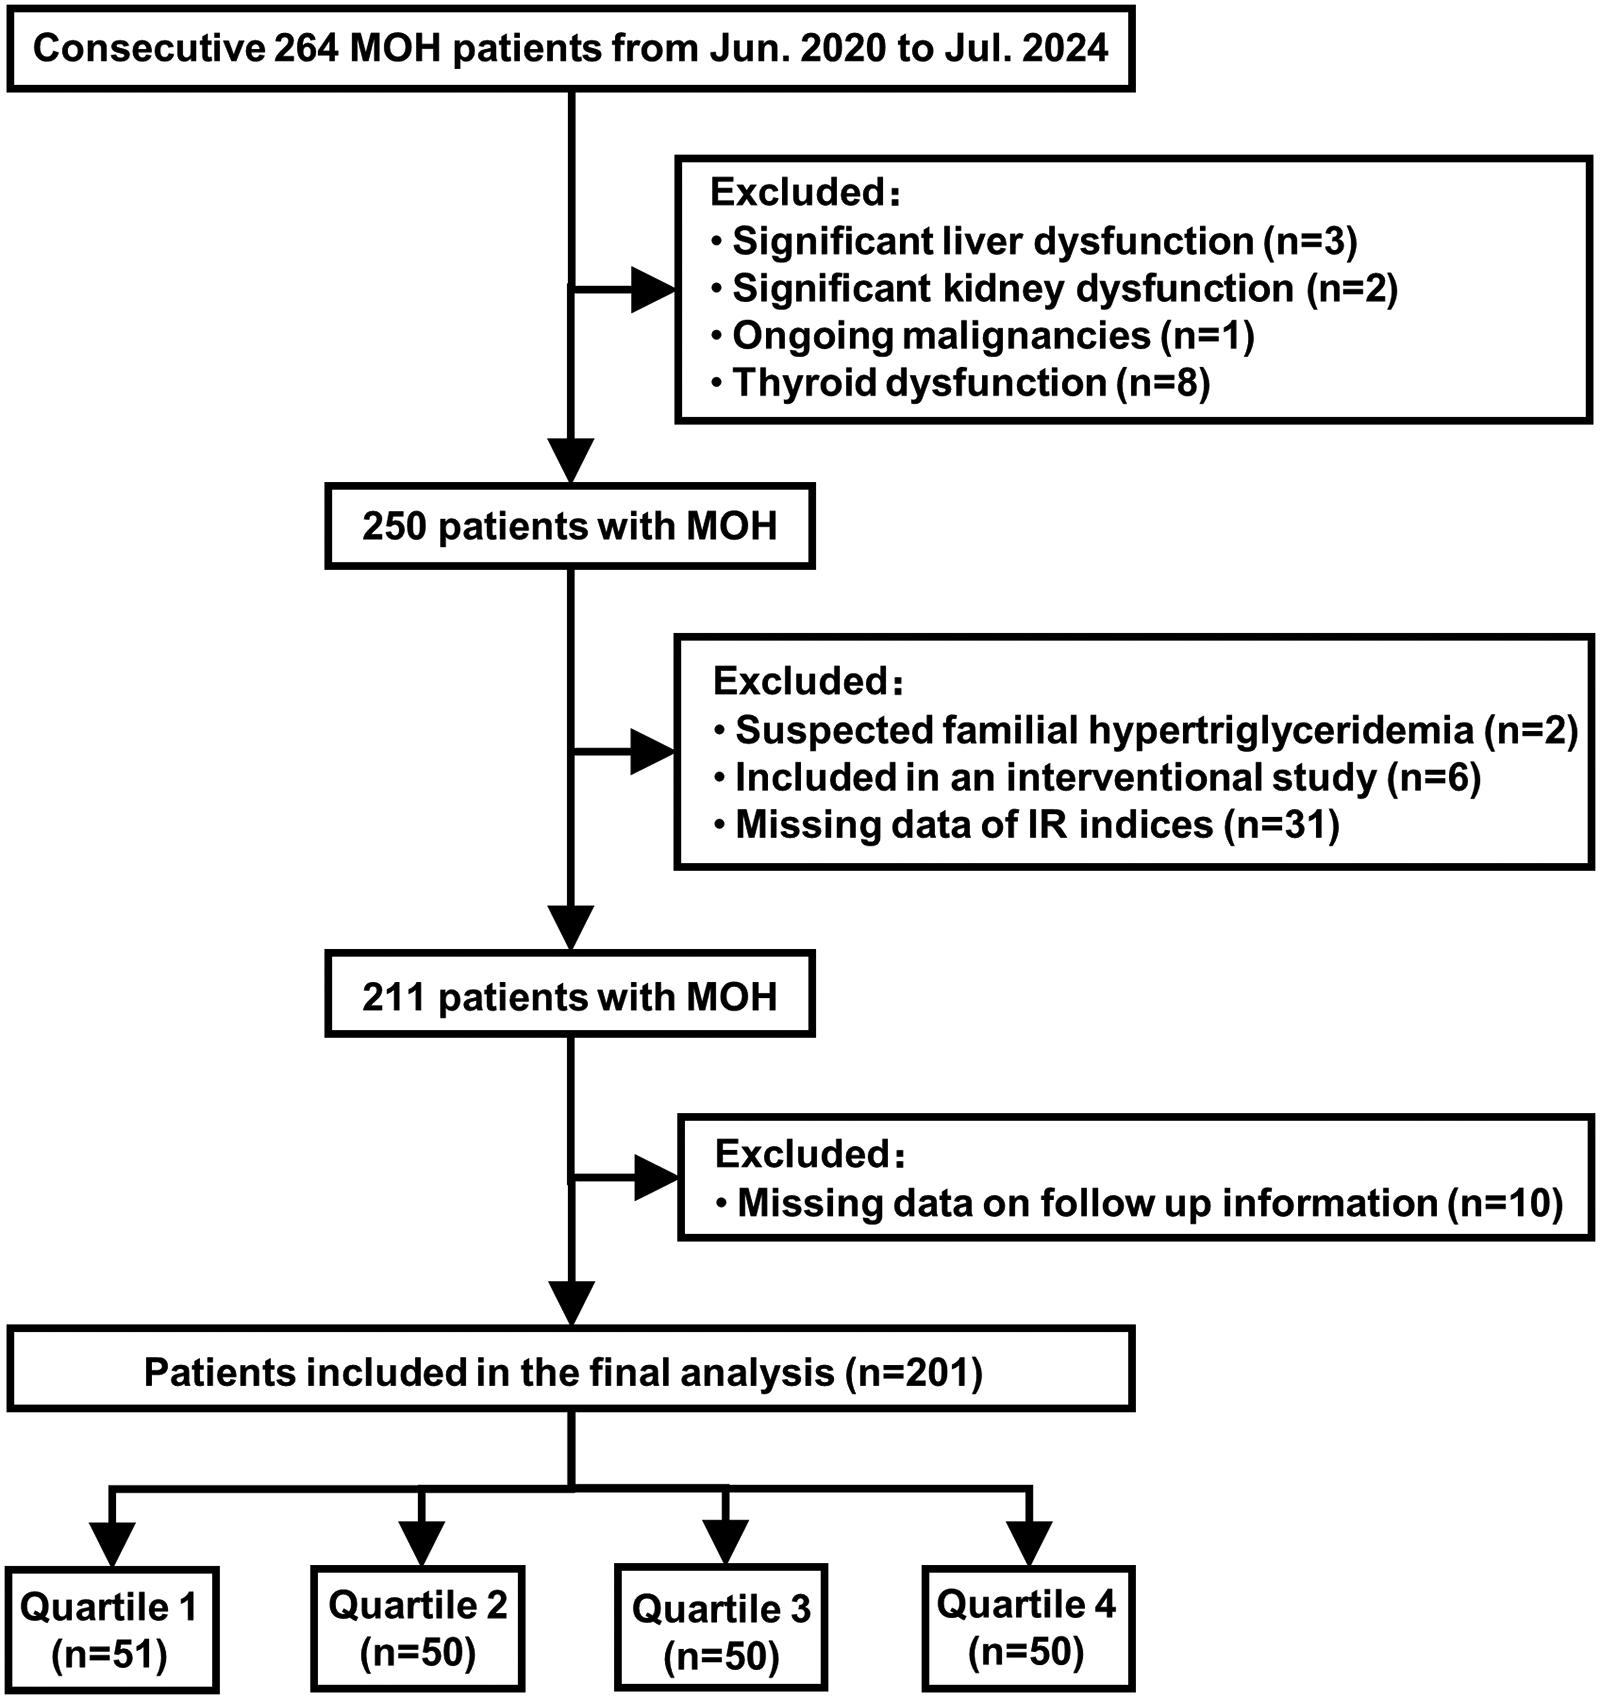
Flow diagram of study population selection. IR = insulin resistance; MOH = medication-overuse headache.
Baseline characteristics and treatment responses
Table 1 illustrates the baseline characteristics of MOH patients, grouped into quartiles using the TyG index. Compared with the T1 group, the T4 group had older age, higher BMI, and higher proportions of hypertension, diabetes mellitus, hyperlipidemia, and cerebrovascular diseases (all P < 0.05). The use of antihypertensives, antihyperglycemic agents, and antihyperlipidemic agents was also more frequent in the T4 group. Additionally, the T4 group showed higher levels of FPG and TG, but lower HDL-C (all P < 0.05). In post hoc pairwise comparisons, total cholesterol levels showed no statistically significant differences among the T1 to T4 groups (all adjusted P > 0.05).
Baseline characteristics of MOH patients between the four groups according to TyG index quartiles.
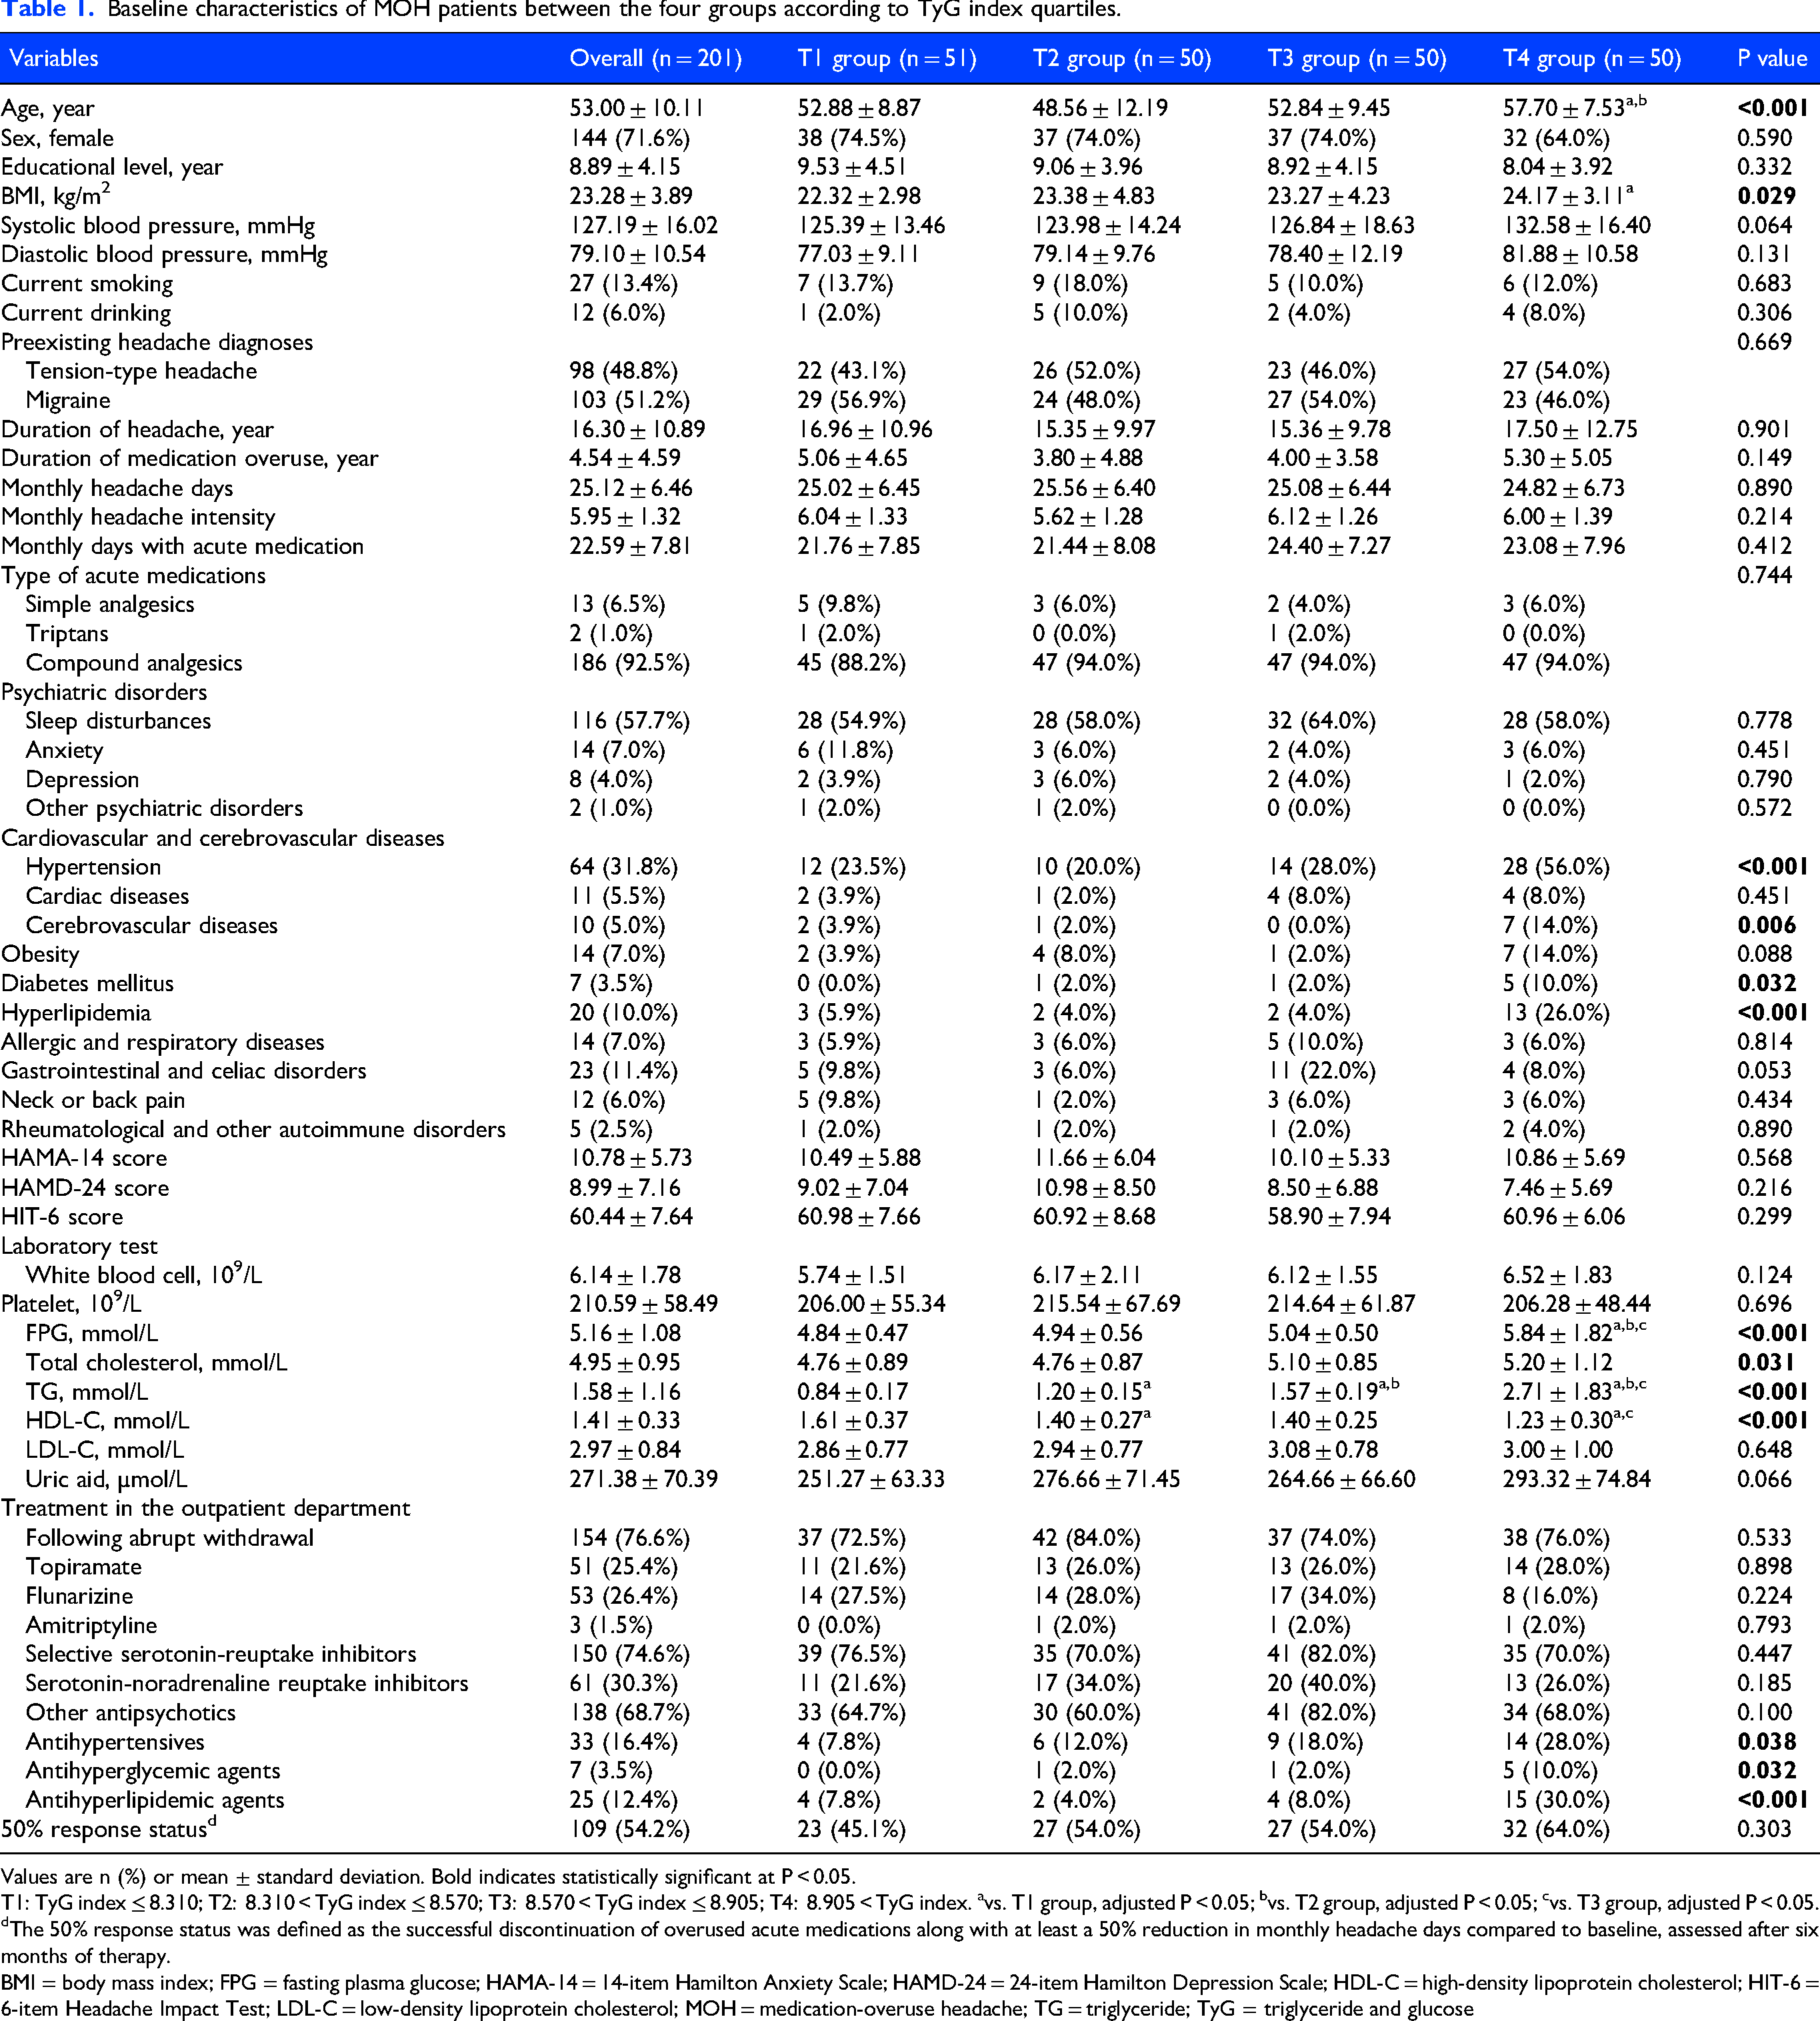
Values are n (%) or mean ± standard deviation. Bold indicates statistically significant at P < 0.05.
T1: TyG index ≤ 8.310; T2: 8.310 < TyG index ≤ 8.570; T3: 8.570 < TyG index ≤ 8.905; T4: 8.905 < TyG index. avs. T1 group, adjusted P < 0.05; bvs. T2 group, adjusted P < 0.05; cvs. T3 group, adjusted P < 0.05.
The 50% response status was defined as the successful discontinuation of overused acute medications along with at least a 50% reduction in monthly headache days compared to baseline, assessed after six months of therapy.
BMI = body mass index; FPG = fasting plasma glucose; HAMA-14 = 14-item Hamilton Anxiety Scale; HAMD-24 = 24-item Hamilton Depression Scale; HDL-C = high-density lipoprotein cholesterol; HIT-6 = 6-item Headache Impact Test; LDL-C = low-density lipoprotein cholesterol; MOH = medication-overuse headache; TG = triglyceride; TyG = triglyceride and glucose
Baseline monthly headache days were 25.02 ± 6.45, 25.56 ± 6.40, 25.08 ± 6.44, and 24.82 ± 6.73 in the T1 to T4 groups, respectively (P = 0.890, Table 1). Baseline monthly days with acute medication were 21.76 ± 7.85, 21.44 ± 8.08, 24.40 ± 7.27, and 23.08 ± 7.96, respectively (P = 0.412). At the six-month follow-up, the proportion of patients achieving 50% response status was 45.1%, 54.0%, 54.0%, and 64.0% across increasing TyG index quartiles, respectively, with no statistically significant difference (P = 0.303, Table 1). Similarly, for TyG-BMI index, the proportions were 54.0%, 45.1%, 54.0%, and 64.0% (P = 0.303); for TG/HDL-C ratio, they were 49.0%, 58.5%, 45.8%, and 64.6% (P = 0.223); and for METS-IR, they were 50.0%, 52.9%, 48.0%, and 66.0% (P = 0.265).
Compared to non-50% responders, 50% responders were younger (51.84 ± 9.80 years vs. 54.36 ± 10.36 years, P = 0.047, Table S1), showed no sex difference, and had a higher proportion of abrupt withdrawal (94.5% vs. 55.4%, P < 0.001) and flunarizine use (32.1% vs. 19.6%, P = 0.044). Other characteristics, such as TyG index, TyG-BMI index, TG/HDL-C ratio, and METS-IR, showed no significant differences between groups (Table S1).
Association between TyG index and 50% response status
In the unadjusted model, the TyG index wasn’t linked to 50% response status, but it became significant when treated as a continuous variable or in the highest quartile (T4 vs. T1) after adjusting for age and sex (P < 0.05, Table 2). In the Model 3, after adjusting for 9 covariates, the TyG index was significantly associated with 50% response status as a continuous variable (OR 2.25, 95% CI 1.07–4.70, P = 0.032; E-value = 2.36, LCL: 1.22; Table 2 and Table S2). The T4 group had a significant association with 50% response status compared to T1 (OR 2.95, 95% CI 1.09–8.00, P = 0.033; E-value = 2.83, LCL: 1.26; Table 2 and Table S3). There was no strong evidence for non-linearity in the relationship between the TyG index and 50% response status (Figure S1).
Association between insulin resistance indices and 50% response status in MOH patients.
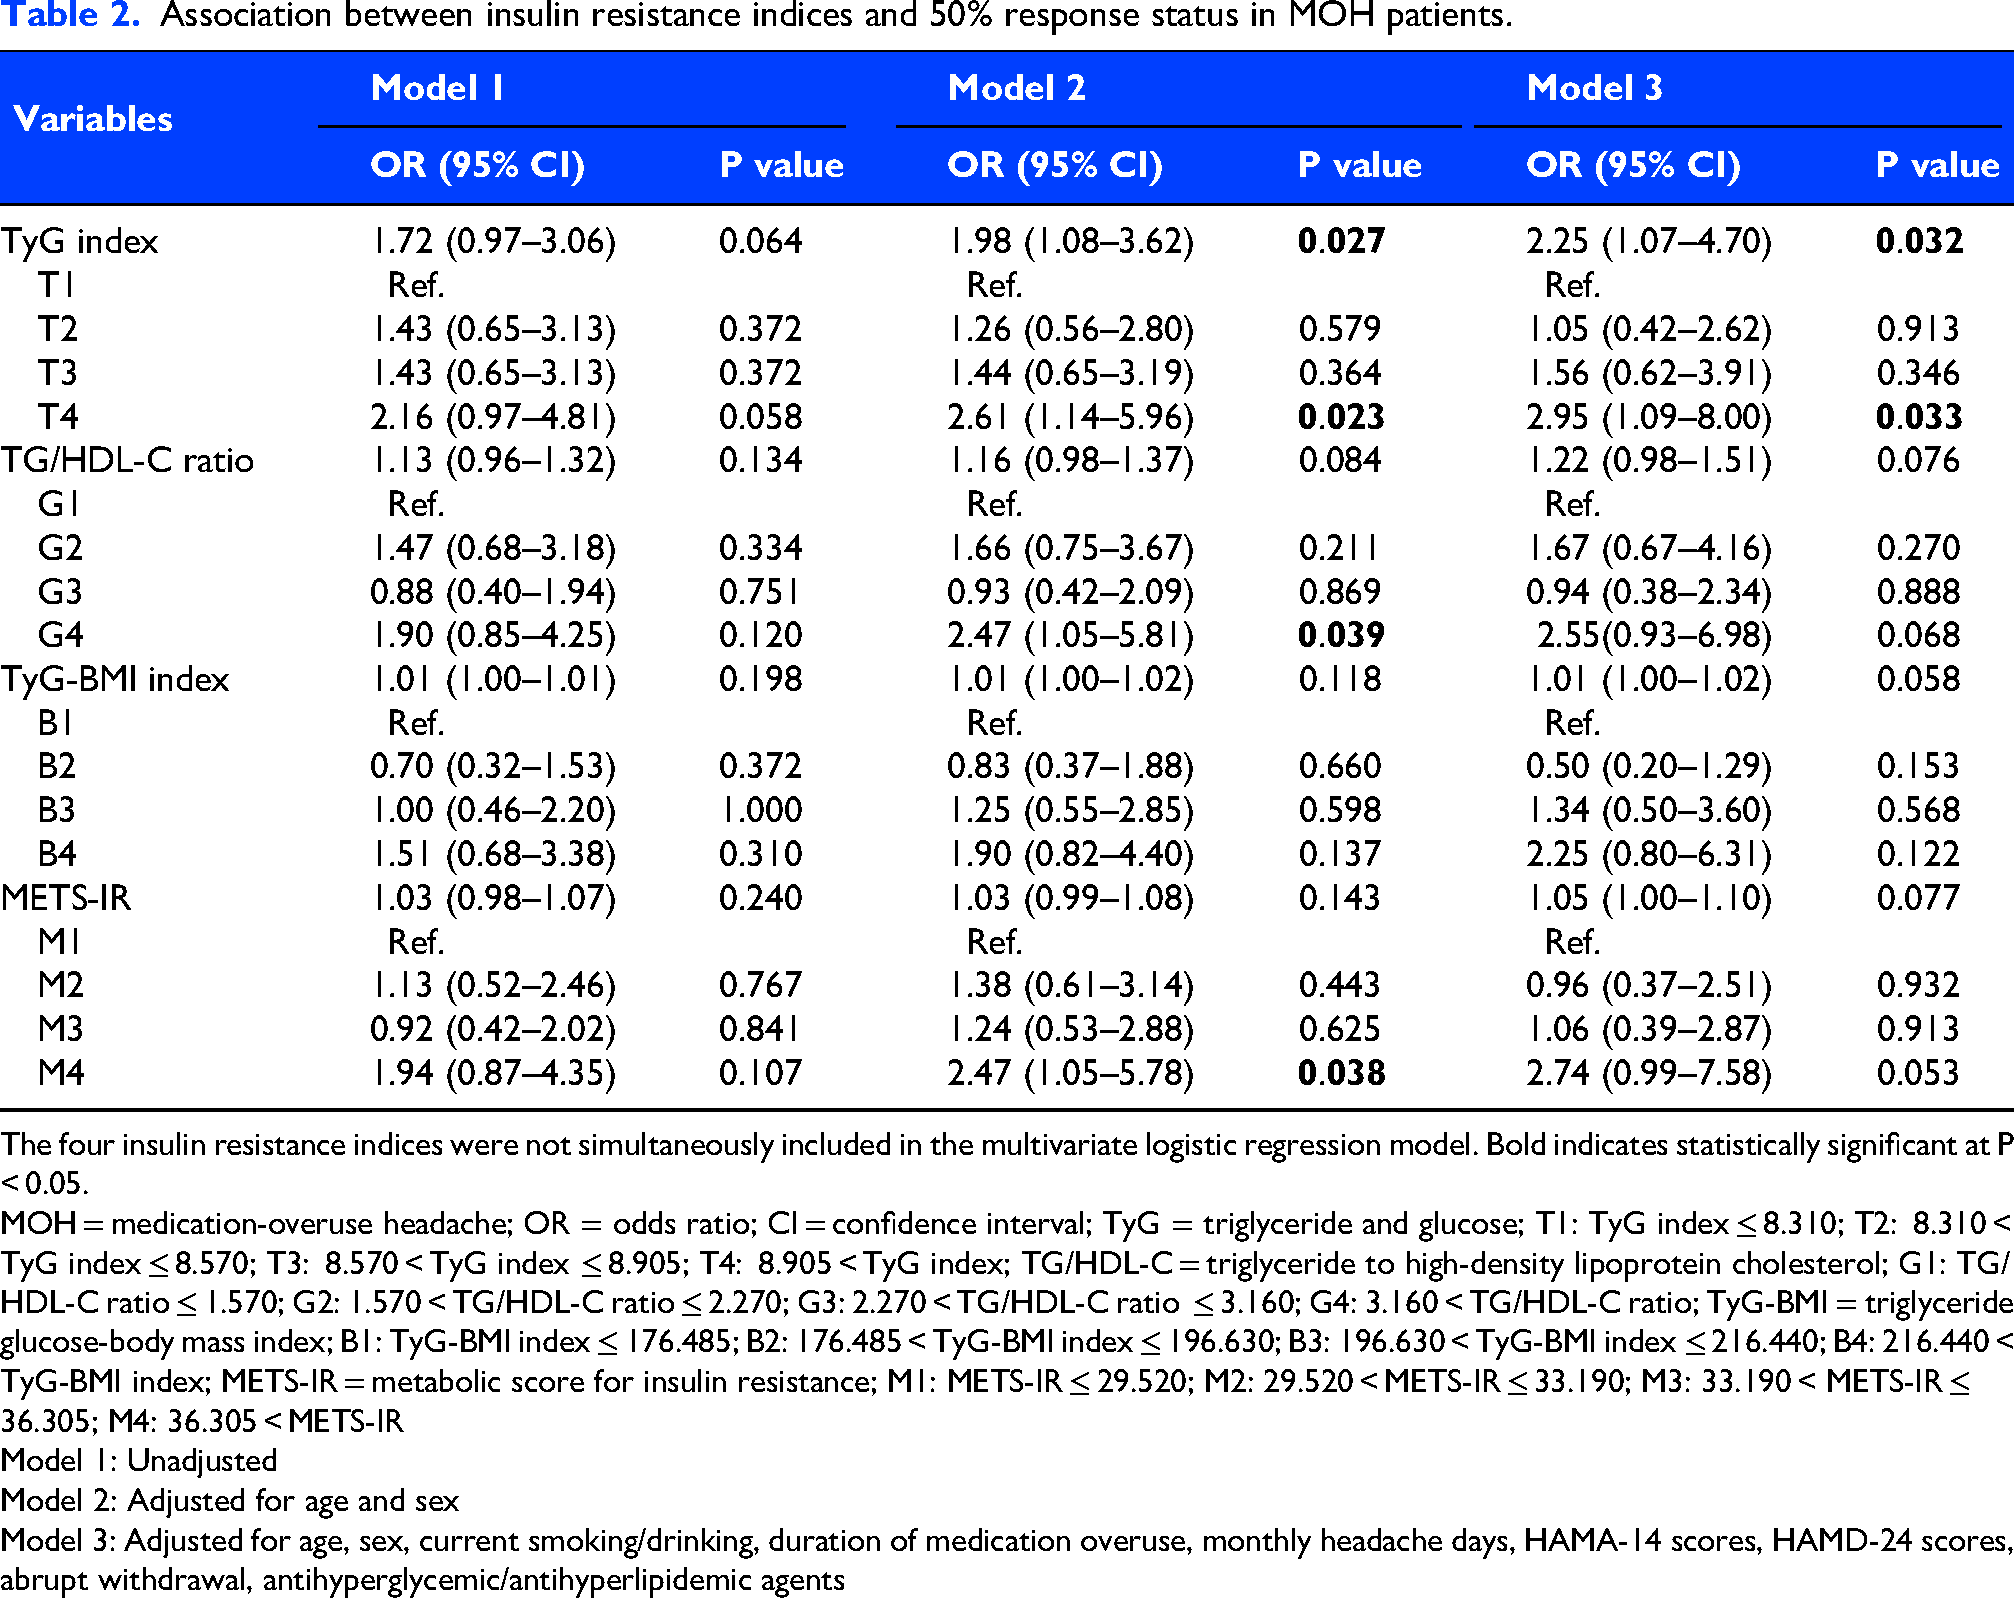
The four insulin resistance indices were not simultaneously included in the multivariate logistic regression model. Bold indicates statistically significant at P < 0.05.
MOH = medication-overuse headache; OR = odds ratio; CI = confidence interval; TyG = triglyceride and glucose; T1: TyG index ≤ 8.310; T2: 8.310 < TyG index ≤ 8.570; T3: 8.570 < TyG index ≤ 8.905; T4: 8.905 < TyG index; TG/HDL-C = triglyceride to high-density lipoprotein cholesterol; G1: TG/HDL-C ratio ≤ 1.570; G2: 1.570 < TG/HDL-C ratio ≤ 2.270; G3: 2.270 < TG/HDL-C ratio ≤ 3.160; G4: 3.160 < TG/HDL-C ratio; TyG-BMI = triglyceride glucose-body mass index; B1: TyG-BMI index ≤ 176.485; B2: 176.485 < TyG-BMI index ≤ 196.630; B3: 196.630 < TyG-BMI index ≤ 216.440; B4: 216.440 < TyG-BMI index; METS-IR = metabolic score for insulin resistance; M1: METS-IR ≤ 29.520; M2: 29.520 < METS-IR ≤ 33.190; M3: 33.190 < METS-IR ≤ 36.305; M4: 36.305 < METS-IR
Model 1: Unadjusted
Model 2: Adjusted for age and sex
Model 3: Adjusted for age, sex, current smoking/drinking, duration of medication overuse, monthly headache days, HAMA-14 scores, HAMD-24 scores, abrupt withdrawal, antihyperglycemic/antihyperlipidemic agents
Associations of TG/HDL-C ratio, METS-IR, and TyG-BMI index with 50% response status
Although the highest quartiles of TG/HDL-C ratio (G4 vs. G1, P = 0.039) and METS-IR (M4 vs. M1, P = 0.038) were associated with 50% response status after age-sex adjustment, none of the three indices remained significant in the fully adjusted model (all P > 0.05; Table 2, Table S2, and Table S3). The three indices showed no strong evidence of non-linear associations with 50% response status (Figure S1).
Subgroup analysis
Figure 2 presents exploratory subgroup analyses of IR indices and 50% response status by age, sex, abrupt withdrawal status, and flunarizine treatment status after covariate adjustment. The TyG index was linked to 50% response status in female (OR 2.64, 95% CI 1.14–6.07, P = 0.023; E-value = 2.63, LCL: 1.33) and abrupt withdrawal (OR 2.28, 95% CI 1.05–4.93, P = 0.037; E-value = 2.39, LCL: 1.18) subgroups, while the TG/HDL-C ratio was associated with 50% response status in older (OR 1.47, 95% CI 1.03–2.09, P = 0.033; E-value = 1.72, LCL: 1.14) and non-flunarizine (OR 1.33, 95% CI 1.04–1.69, P = 0.022; E-value = 1.57, LCL: 1.16) subgroups. No significant interactions were found between subgroups and the TyG index or TG/HDL-C ratio.
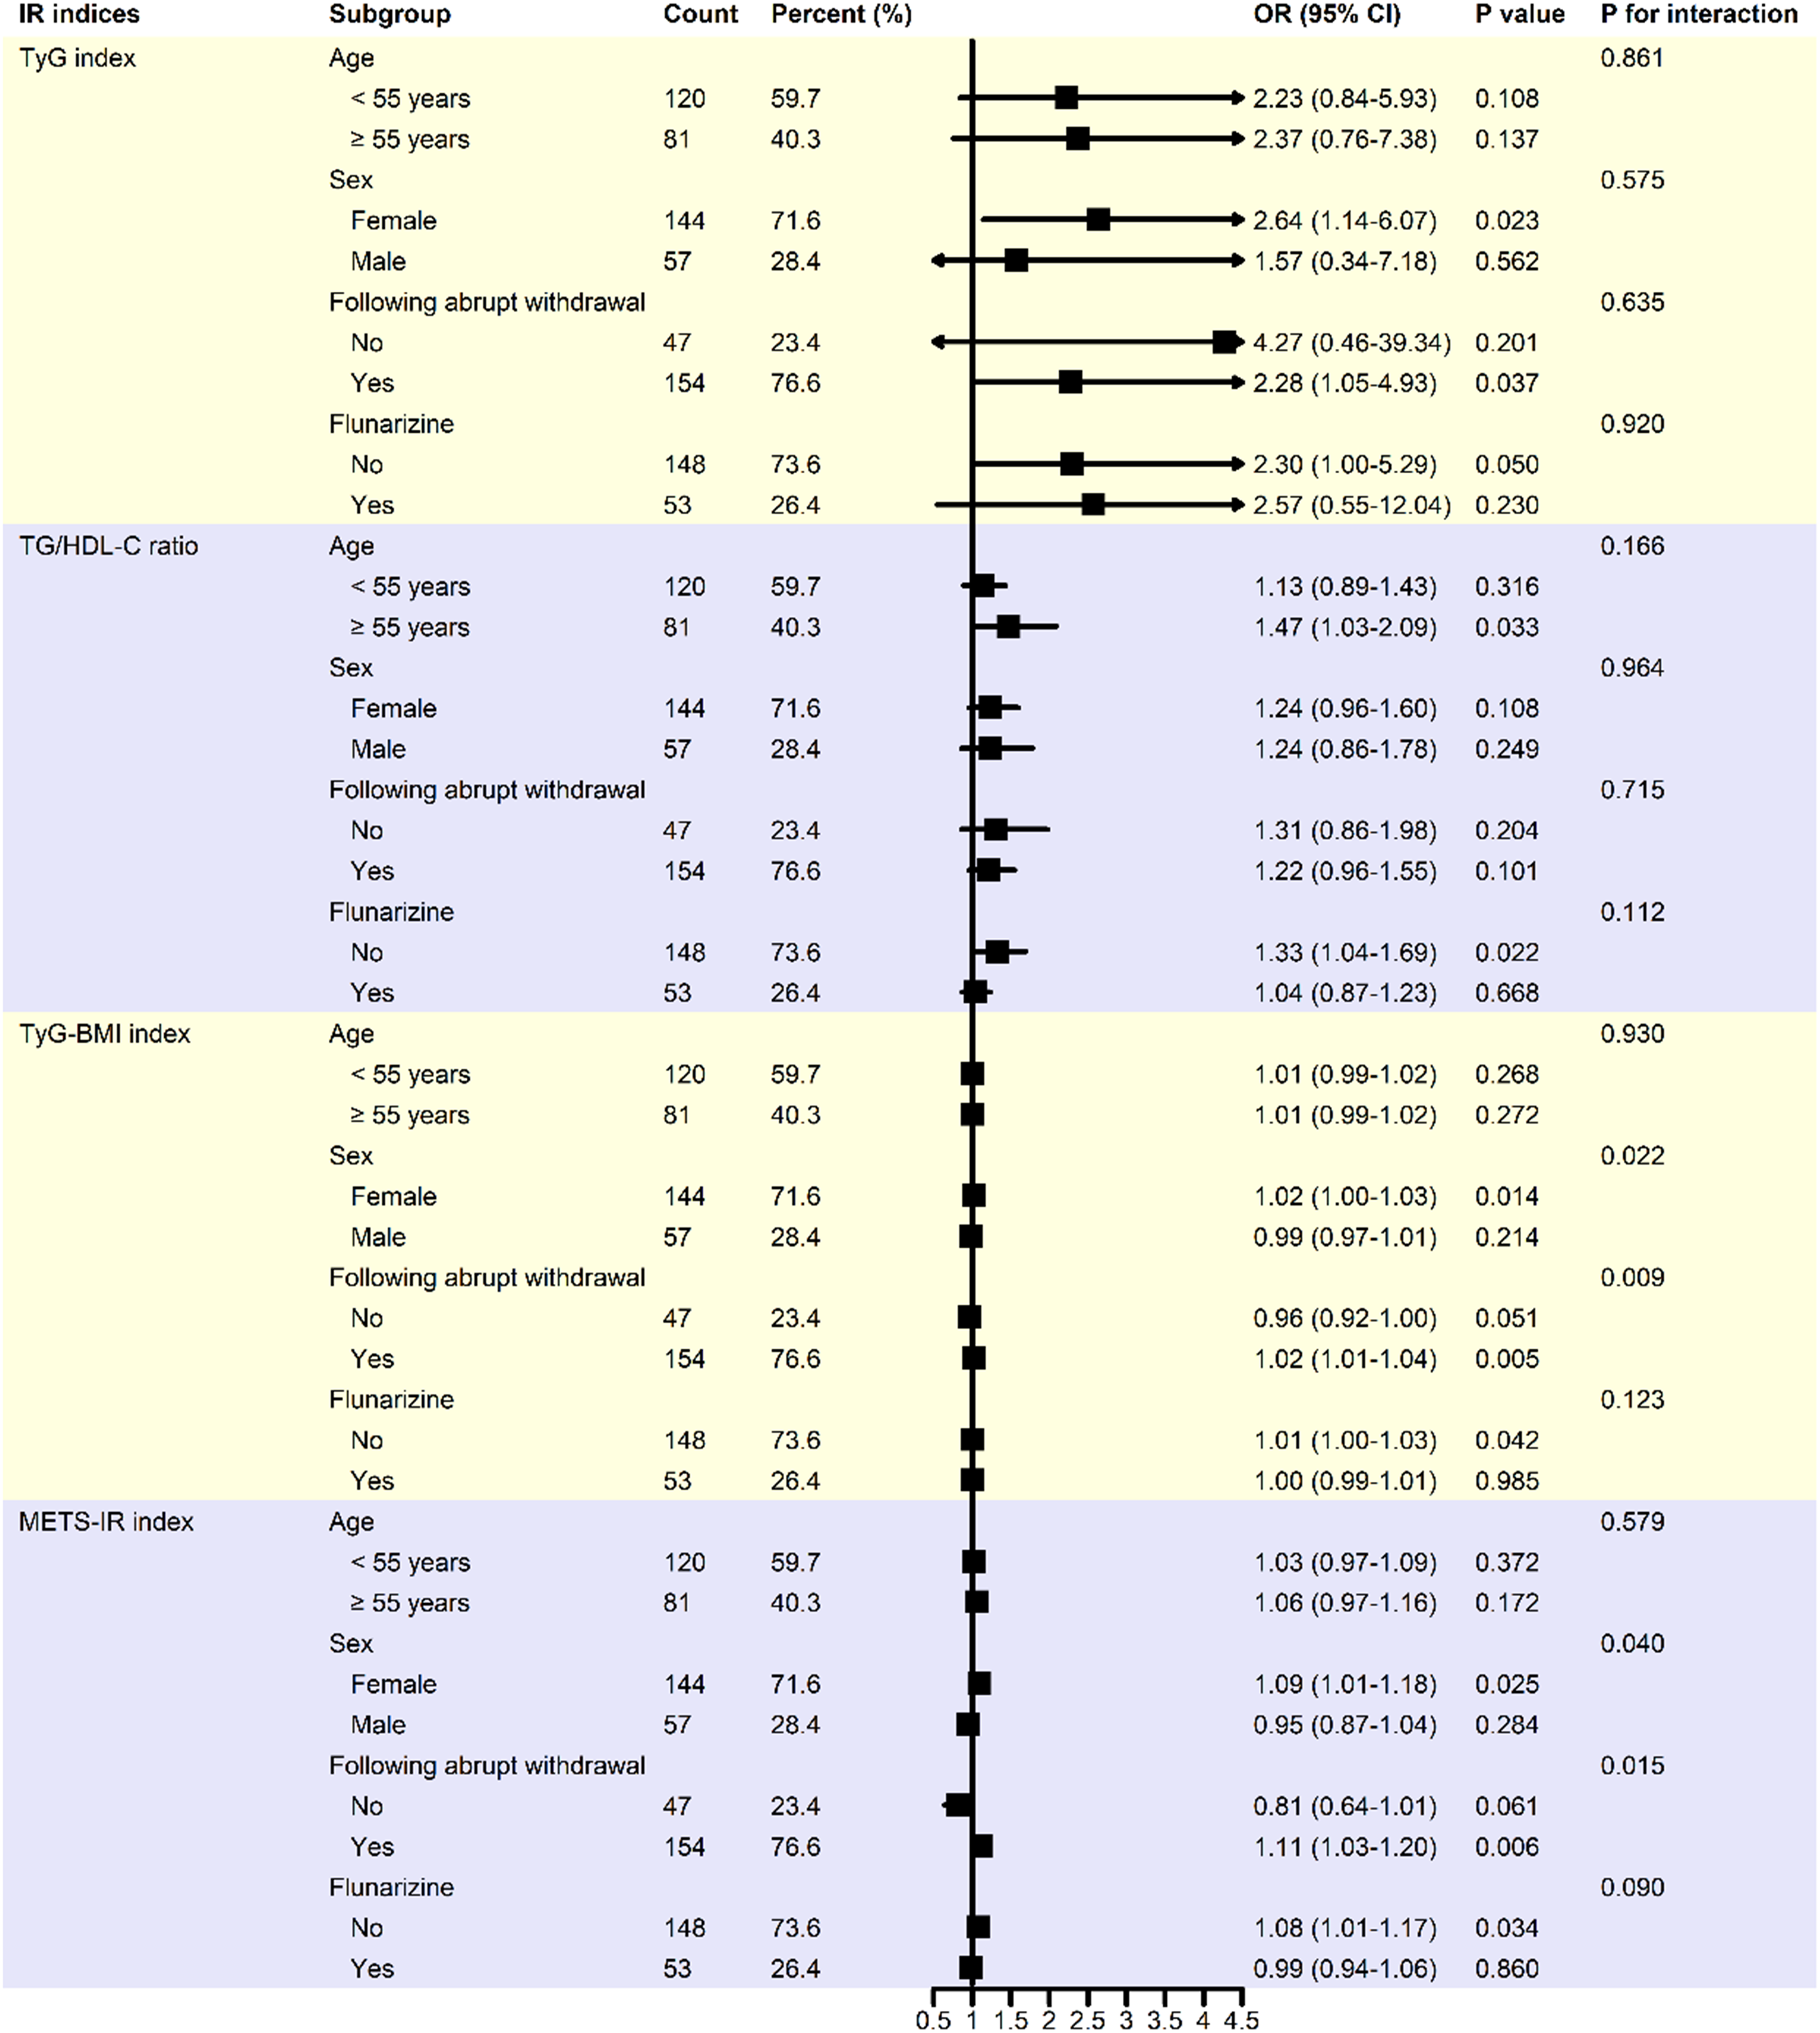
Subgroup analysis of the association between four insulin resistance indices and 50% response status. Adjusted for age, sex, and variables with P < 0.10 in the univariate logistic analysis, including cardiac diseases, abrupt withdrawal, flunarizine, and antihypertensives. In each subgroup analysis, all covariates except the stratification variable itself were included. CI = confidence interval; IR = insulin resistance; METS-IR = metabolic score for insulin resistance; OR = odds ratio; TG/HDL-C = triglyceride to high-density lipoprotein cholesterol; TyG = triglyceride and glucose; TyG-BMI = triglyceride glucose-body mass index.
The TyG-BMI index and METS-IR were associated with 50% response status in female (OR 1.02, 95% CI 1.00–1.03, P = 0.014, E-value = 1.11, LCL: 1.00; OR 1.09, 95% CI 1.01–1.18, P = 0.025, E-value = 1.26, LCL: 1.08; respectively), abrupt withdrawal (OR 1.02, 95% CI 1.01–1.04, P = 0.005, E-value = 1.11, LCL: 1.08; OR 1.11, 95% CI 1.03–1.20, P = 0.006, E-value = 1.29, LCL: 1.14; respectively), and non-flunarizine (OR 1.01, 95% CI 1.00–1.03, P = 0.042, E-value = 1.08, LCL: 1.00; OR 1.08, 95% CI 1.01–1.17, P = 0.034, E-value = 1.24, LCL: 1.08; respectively) subgroups. A significant interaction was found between sex subgroups and these indices (P = 0.022, P = 0.004, respectively) regarding 50% response status, similar to abrupt withdrawal subgroups (P = 0.009, P = 0.015, respectively).
Association of TyG-BMI index or METS-IR with 50% response status in female patients
Exploratory analyses were conducted to investigate the association between TyG-BMI index and METS-IR with 50% response status in female patients. After adjusting for age and the variables with P < 0.10 in univariate logistic analysis (abrupt withdrawal, flunarizine, and selective serotonin-reuptake inhibitors), both TyG-BMI index (OR 1.02, 95% CI 1.00–1.03, P = 0.014, E-value = 1.11, LCL: 1.00) and METS-IR (OR 1.09, 95% CI 1.01–1.18, P = 0.028, E-value = 1.26, LCL: 1.08) showed a potential association with 50% response status (Table S4).
Association between TyG-BMI index or METS-IR and 50% response status in patients with abrupt withdrawal
In exploratory analyses limited to patients following abrupt withdrawal, both TyG-BMI (OR 1.03, 95% CI 1.01–1.04, P = 0.001, E-value = 1.14, LCL: 1.08) and METS-IR (OR 1.13, 95% CI 1.05–1.23, P = 0.001, E-value = 1.32, LCL: 1.18) were associated with 50% response statuses after adjusting for age, sex, and variables with P < 0.10 in the univariate logistic analysis (serotonin-noradrenaline reuptake inhibitors) (Table S5).
Discussion
This study examined the link between four IR indices and six-month treatment responses in MOH patients after withdrawal and preventive therapy. A higher TyG index was significantly associated with a 50% response status in all patients, with the highest quartile showing over twice the odds compared to the lowest. However, the TG/HDL-C ratio, METS-IR, and TyG-BMI index did not maintain significant associations after full adjustment. The TyG-BMI index and METS-IR were linked to 50% response status in females and those with abrupt withdrawal.
The TyG index and TG/HDL-C ratio, as simple IR surrogate indicators, can predict cardiovascular disease (CVD) risks. 24 Research has linked the TyG index to migraines, but results are inconsistent.11–14 One study found a negative association between the TyG index and migraines after adjusting for migraine medications, suggesting that treatment may influence this relationship. 14 A meta-analysis showed migraineurs had higher TG levels than healthy individuals, though HDL-C levels were similar. 27 Elevated TyG index and TG/HDL-C ratio indicated IR, potentially worsening migraines through oxidative stress, endothelial dysfunction, and inflammation.28,29 Previous findings showed that, without adjusting for confounders, MOH patients had lower HDL-C levels compared to healthy controls, but no significant differences in TG and TyG index. The TyG index was negatively correlated with monthly headache days in MOH patients. 15 This suggested that the pathophysiology of MOH might involve unique metabolic regulatory pathways, contrasting with the conventional pattern in CVD where IR typically correlated positively with severity.30,31
No prior studies have investigated the link between the TyG index and responses in MOH patients after withdrawal and preventive treatment. This study found that higher TyG index was associated with 50% response status after adjusting for confounders. Our findings suggested that IR status correlated with better treatment response, highlighting its potential relevance as a prognostic factor for MOH treatment. These results may help inform patient stratification in future studies. This contrasts with the traditional view that higher IR is associated with adverse CVD outcomes.10,24,32 Several hypothetical explanations may account for this discrepancy: (1) Disease-specific mechanisms – IR may promote atherosclerosis in CVD but could reflect stress adaptation in MOH; (2) A possible “double-edged sword” effect – IR indices may be linked to vascular damage in CVD but might indicate beneficial metabolic adaptation in MOH; (3)Treatment influence – therapies might repurpose IR markers from risk indicators to markers of treatment response; (4) Differences in confounders – CVD-related factors (e.g., diabetes, obesity) may not fully apply to MOH, while protective factors (e.g., treatment adherence, neuroplasticity) may help offset IR's negative implications. These findings highlight the context-dependent nature of IR indices and suggest that disease-specific studies are warranted to further explore these relationships.
The TyG-BMI index and METS-IR are recognized as reliable IR measures. 10 Our study found that high levels of these indices correlated with 50% response status in female patients and those with abrupt withdrawal, but not in the overall patients. The findings could be attributed to several factors. Firstly, recent studies link the TyG-BMI index and METS-IR primarily to cardiovascular events,10,32 while MOH is more related to inflammation, drug dependence, and central sensitization, not direct IR drivers.1,33 This makes TyG-BMI index and METS-IR less significant in the diverse MOH cohort due to confounders like medication types and patient variability. Secondly, MOH is more common in females, especially those aged 50–60, 2 where hormonal changes during menopause affect metabolic and inflammatory pathways, making them more sensitive to IR.5,34 This suggested that higher TyG-BMI index and METS-IR in females might reflect inflammatory-metabolic dysregulation potentially relevant to headache response. Previous studies also showed an association of IR with cardiovascular events and migraines in females,5,14,35 supporting our findings. Finally, studies indicated that MOH patients might experience increased inflammation and gut-brain axis issues.36,37 Abrupt withdrawal could also cause various withdrawal symptoms. However, patients with pre-existing IR may be more likely to respond favorably to abrupt withdrawal, possibly reflecting compensatory mechanisms such as improved insulin signaling.38,39
The observed association between high baseline IR indices and 50% response status in MOH patients after withdrawal and preventive treatment is counterintuitive, as IR is conventionally linked to worse outcomes. The underlying mechanisms remain speculative and might involve several pathways. First, IR may affect pain modulation: insulin could activate pain receptors (e.g., TRPV1), potentially increasing headache risk 6 ; reduced insulin sensitivity in high-IR states might paradoxically attenuate this activation, lowering headache frequency, especially during abrupt withdrawal. 40 Second, IR is linked to systemic inflammation, which plays a role in MOH 33 ; it is possible that heightened inflammatory responses, while initially exacerbating symptoms, could facilitate recovery if resolution occurs rapidly. Third, alterations in drug metabolism or neuroplasticity related to IR might influence treatment response.41,42 However, these proposed mechanisms are hypothetical, and alternative explanations—including residual confounding by unmeasured factors—cannot be excluded. Future mechanistic studies are needed to validate these findings.
This study has several limitations. Its retrospective design may leave residual confounding, affecting causal interpretation. The observational nature limited dynamic assessment of the four IR indices, impacting MOH prognosis risk stratification. The study focused on MOH patients overusing compound analgesics, with a relatively small sample size affecting statistical power and generalizability. Variability in withdrawal and preventive treatment strategies introduced potential confounding, complicating the isolation of metabolic effects from treatment effects. Additionally, the composite outcome's occurrence in about 54.2% of patients means the OR from logistic regression should not be directly interpreted as a risk ratio, as OR and relative risk measure different relative effects. Finally, our study conducted over 100 statistical tests across four exposure variables, various models, quartile analyses, and subgroup explorations without adjusting for multiple testing. Thus, the findings should be seen as hypothesis-generating, not confirmatory, due to a significant risk of type I error. Replication in independent cohorts is crucial before making firm conclusions, and future larger, prospective studies with more comprehensive data are necessary to validate these results.
In conclusion, the TyG index was significantly associated with 50% response status in MOH patients after treatment, while the TG/HDL-C ratio, METS-IR, and TyG-BMI index were not. Further prospective research is needed to validate these findings and to explore if managing these indices affects outcomes.
Article highlights
The TyG index was associated with 50% response status after adjustment.
The TG/HDL-C ratio, TyG-BMI, and METS-IR were not significant in the final adjusted model.
Further validation is needed to assess the prognostic relevance of these indices in MOH.
Supplemental Material
sj-docx-1-cep-10.1177_03331024261464213 - Supplemental material for Association between insulin resistance surrogate indicators and six-month prognosis in patients with medication-overuse headache: A retrospective cohort study
Supplemental material, sj-docx-1-cep-10.1177_03331024261464213 for Association between insulin resistance surrogate indicators and six-month prognosis in patients with medication-overuse headache: A retrospective cohort study by Changling Li, Peiqi He, Hui Lang, Shiqin Li, Qian Liu, Yanbo Li, Yang Zhang, Mengmeng Ma, Jinghuan Fang, Ning Chen and Li He in Cephalalgia
Supplemental Material
sj-docx-2-cep-10.1177_03331024261464213 - Supplemental material for Association between insulin resistance surrogate indicators and six-month prognosis in patients with medication-overuse headache: A retrospective cohort study
Supplemental material, sj-docx-2-cep-10.1177_03331024261464213 for Association between insulin resistance surrogate indicators and six-month prognosis in patients with medication-overuse headache: A retrospective cohort study by Changling Li, Peiqi He, Hui Lang, Shiqin Li, Qian Liu, Yanbo Li, Yang Zhang, Mengmeng Ma, Jinghuan Fang, Ning Chen and Li He in Cephalalgia
Footnotes
Acknowledgments
We express our gratitude to all participants for their involvement in this study.

Ethical considerations
The study was approved by the Ethics Committee of West China Hospital, Sichuan University (No. 2025-1889).
Consent to participate
Informed consent was waived due to the retrospective collection of deidentified data.
Consent to publishing
The authors wish to be considered for publication in Cephalalgia.
Author contributions
CLL and PQH were responsible for data analysis, manuscript drafting, and revision, contributing equally to this work. HL, SQL, QL, YBL, YZ, MMM, and JHF were tasked with data collection and manuscript drafting. NC and LH designed the study and revised the manuscript. All authors have read and approved the final version of the manuscript.
Funding
This project was supported by the National Key Research and Development Program of China (grant number: 2023YFC2508702), the Natural Science Foundation of China (grant number: 82301404), the Natural Science Foundation of Sichuan Province (grant number: 2023NSFSC1562), and the Postdoctor Research Fund of West China Hospital, Sichuan University (grant number: 2024HXBH069).
Declaration of conflicting interests
The authors declared no potential conflicts of interest with respect to the research, authorship, and/or publication of this article.
Data availability statement
The datasets used and analyzed during the current study are available from the corresponding author on reasonable request.
Open practices
Not applicable
Supplemental material
Supplemental material for this article is available online.
References
Supplementary Material
Please find the following supplemental material available below.
For Open Access articles published under a Creative Commons License, all supplemental material carries the same license as the article it is associated with.
For non-Open Access articles published, all supplemental material carries a non-exclusive license, and permission requests for re-use of supplemental material or any part of supplemental material shall be sent directly to the copyright owner as specified in the copyright notice associated with the article.
