






Abstract
Aim:
Migraine is highly heritable, yet no machine learning models for predicting treatment responses have incorporated genetic data. We aimed to develop machine learning models including both genetic and clinical information to predict treatment responses of migraine preventives and treatment retention of triptans.
Methods:
This was a cross-sectional population-based machine learning analysis of the Trøndelag Health Studies and the national prescription registry. Clinical predictors included demographics, serum metabolic measures, comorbidities, mental health and lifestyle factors. Genetic predictors included 108 migraine risk loci. Preventive response was defined as ≥50% reduction in triptan dispensations after first preventive dispensation, and triptan retention as ≥3 dispensations. The dataset was split into training (70%), validation (10%) and test set (20%). A series of standard and causal machine learning architectures were trained and optimized on the training and validation set, and the best model was evaluated on the held-out test data. Shapley Additive exPlanation values identified key predictors.
Results:
In total, 475 participants tried a preventive (amitriptyline, beta-blocker, candesartan or topiramate) and 565 a triptan (371 sumatriptan) during the project period. Using only clinical features, the best models achieved area under curve of 0.56–0.69 for the preventives, and 0.56 for triptans. When combining clinical and genetic data, the area under curve was unchanged or reduced in all cases except for amitriptyline (0.80) and sumatriptan (0.55). The most important predictors were hormone-related features, lipid levels and hemodynamic parameters.
Conclusion:
We developed models that predicted treatment responses to amitriptyline, beta-blockers, candesartan and topiramate with modest accuracy. Incorporating genetic data did not enhance performance, although the limited sample size and the uncertain accuracy of cohort definition and treatment response assessment prevent firm conclusions.
This is a visual representation of the abstract.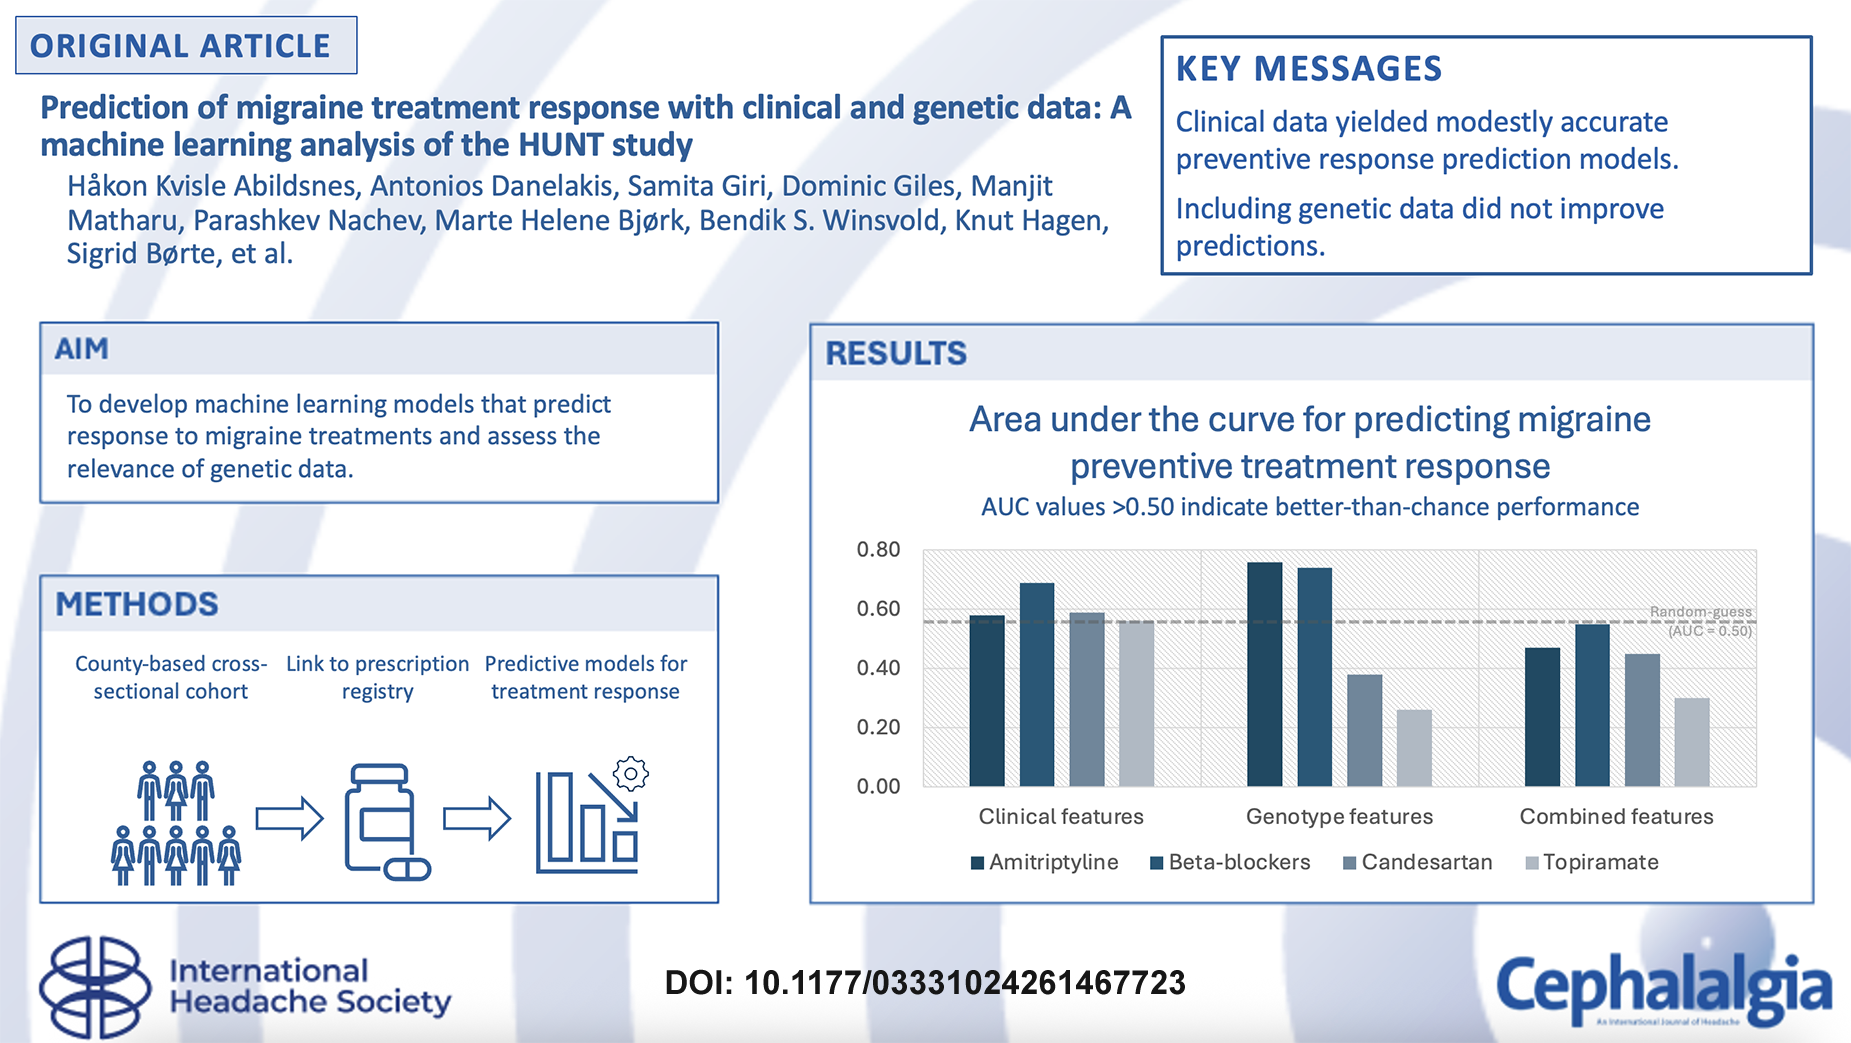
Keywords
Introduction
To treat migraine, physicians may prescribe one of several preventive medications from a wide variety of pharmaceutical classes, including beta-blockers, antidepressants, calcium channel blockers, angiotensin receptor blockers, anticonvulsants, onabotulinumtoxinA, calcitonin gene-related peptide (CGRP) monoclonal antibodies and gepants. 1 In the clinical setting, preventive treatment is typically administered for 3 months before its effect is assessed. 1 If the treatment is ineffective, new 3-month prophylactic trials with other treatments are initiated, until adequate effect is reached. This heuristic approach means that finding an effective treatment may be a lengthy process, potentially worsening the adverse effects on employment and daily life of the person with unsuccessfully treated migraine. However, if we can predict which treatment each individual most likely will respond to, the duration of this process can be shortened, and consequently the migraine burden associated with inadequate treatment effect mitigated. 2
The etiology and pathophysiology of migraine are complex, 3 which may explain both why mechanistically different medications can be effective, 4 and why only 40–60% of patients respond to each preventive treatment. 5 It is also possible that the underlying biology varies between individuals, and that this contributes to the highly heterogeneous treatment response of migraine preventives. We propose that a network of interplaying factors may be used to predict response of preventive treatments on an individual level. Machine learning (ML) provides a suitable framework for this task, as it can accommodate high-dimensional data and uncover non-linear relationships between clinical and biological features.
We have recently demonstrated that complex ML modelling of chronic migraine phenotypes can be used to estimate individualized treatment effects, 6 i.e., the difference in response between different treatment options in the same individual. 7 Furthermore, ML models have demonstrated promising performance in predicting response to anti-CGRP monoclonal antibodies specifically,8–10 as well as across multiple preventive treatments. 11 However, to our knowledge, no ML models have yet utilized genetic data for predicting migraine treatment responses.12,13 There is evidence that migraine has a strong genetic basis with multiple variants showing small associations to the disease and that treatment responsiveness to migraine-specific drugs is associated with polygenic risk load.14,15 Our previous work has demonstrated the utility of combining clinical and genotypic data in predictive ML modelling. 16 It is therefore plausible that a combination of genotypic and clinical data may improve prediction of migraine treatment responses. Our aim was to model the treatment responses of triptans and commonly used migraine preventives based on clinical and genetic data.
Materials and methods
Overall study design
We performed a cross-sectional population-based machine learning analysis of clinical and genotypic data from the second and third surveys of the Trøndelag Health Studies (HUNT2 and HUNT3). An extensive ML analysis was carried out to predict the treatment effects of commonly used migraine medications. We developed separate predictive models for each medication for clinical data, genotypic data and a combination of clinical and genotypic data (hereafter referred to as combined data). Figure 1 illustrates the overall study design.
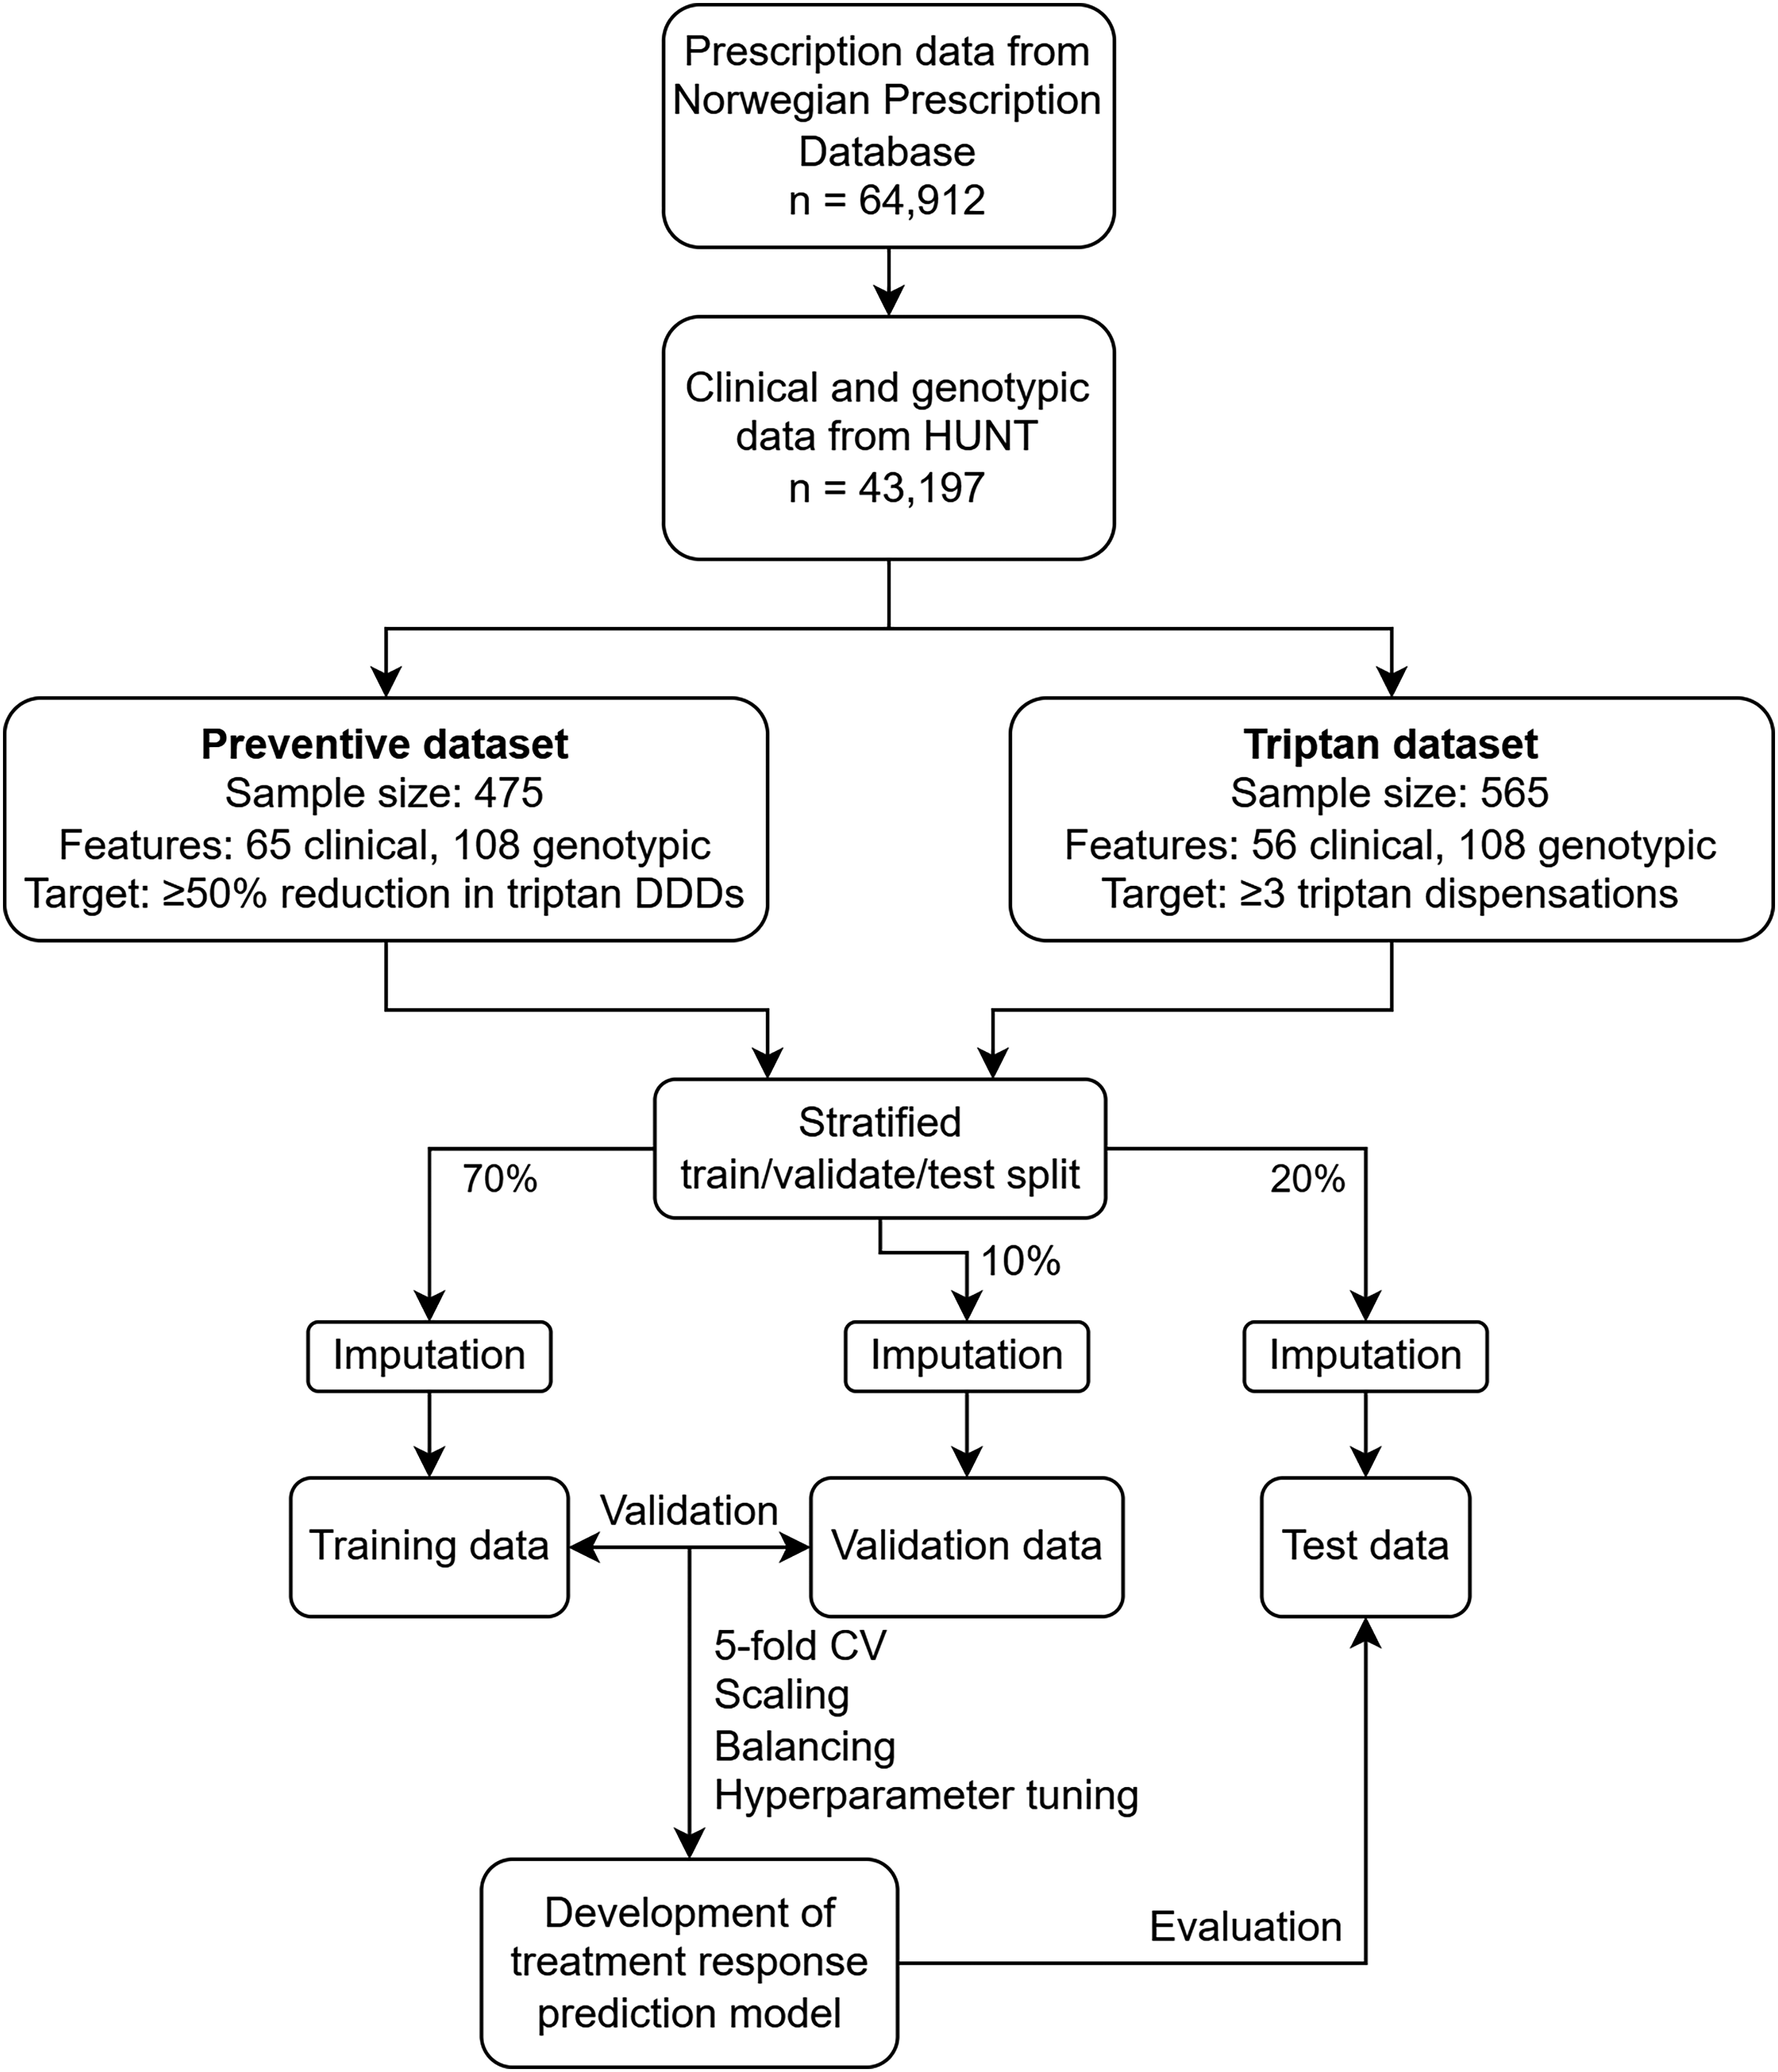
Overview of study design. Abbreviations: HUNT, The Trøndelag Health Study; DDD, defined daily dose; CV, cross validation.
Data sources and data management
Helseundersøkelsen i Trøndelag (HUNT)
HUNT is a recurrent ongoing regional health study in the county Trøndelag in Norway. Four HUNT surveys have been carried out since 1984 with partly overlapping participants from survey to survey. Data was collected using questionnaires, interviews, clinical examinations, laboratory measurements and storage of biological samples.17,18 In this study we used data from the second (HUNT2, 1995–1997) and third (HUNT3, 2006-2008) HUNT surveys, where all adult inhabitants of Nord-Trøndelag aged 20 years or older were invited. 19 Participation in HUNT is based on informed, written consent, and this study has been approved by the Regional Committee for Medical and Health Research (#2015/576/REK Midt and #2014/144/REK Midt).
Clinical features
HUNT features with a known, hypothesized or plausible relationship to migraine or migraine medications were selected, such as demographics, serum metabolic measures, diseases of the participants and their families, mental health and lifestyle factors. Headache-related features were not included. All included clinical features were assessed during their respective HUNT survey periods.
Genotypic features
Blood samples were taken from participants at enrollment in the HUNT2 and HUNT3 surveys. Samples from both surveys were genotyped jointly in the same genotyping procedure in 2012–2015 at the Genomics-Core Facility at the Norwegian University of Science and Technology. As described in depth in a previous publication on HUNT genotyping, 20 genotyping was performed using Illumina HumanCoreExome microarrays. Afterwards, missing genetic variants were estimated using a reference dataset from the Haplotype Reference Consortium. Only variants with acceptable imputation quality (r2 ≥ 0.3) were kept.
A 2022 genome-wide association study (GWAS) identified 123 independent genetic loci associated with migraine. 15 The analysis combined genetic and migraine diagnosis data from five study cohorts, including the HUNT study. To avoid bias from including the same individuals in both the 2022 GWAS and our ML study using HUNT genotypic data, a reverse meta-analysis was carried out, removing the contribution of the HUNT participants from the 2022 analysis. 21 Based on the recalculated results, 108 of the original 123 loci met the strictest criteria for statistical significance and independence (linkage disequilibrium r2 < 0.1; p < 5*10−8). 21 For each participant, the estimated number of migraine risk alleles carried at each of the 108 loci (genetic dosage) was used as an input feature in the ML models.
Study cohorts
Two study cohorts were defined: one for the analysis of response to migraine preventive medications, and one for retention of triptans. In the preventive cohort, participants from both HUNT2 and HUNT3 were included to ensure sufficient sample size. Because HUNT2 had a higher participation rate and lower item-specific missingness than HUNT3, we used HUNT2 data where available and HUNT3 data only when HUNT2 data was missing or unavailable (e.g., for HUNT3 only participants, or for item-specific missing values in HUNT2). In the triptan cohort, only participants in HUNT3 were included as sample size was expected to be less of an issue and this data was temporally closer to the prescription data. No features were adjusted for potentially long time gaps between feature and outcome assessment.
Participants eligible for analysis needed available genotype and demographic/clinical data from the relevant HUNT surveys, as well as available data from the national prescription registry. Only participants with available outcome assessment were included to prevent data leakage from imputation. All participants with at least one triptan dispensation during the study period were regarded as migraine sufferers. Dispensing of triptans strongly suggests that the participants have a migraine diagnosis, since triptans are almost exclusively used for migraine in Norway aside from cluster headache, which is a rare disorder.22–24
Outcome assessment and labelling
To assess preventive treatment response, data on dispensations of triptans and migraine preventives was collected from the Norwegian Prescription Database in the period from 1st of April 2008 until 2019 and linked to the HUNT feature data. All migraine preventives with an established treatment effectiveness were evaluated. 25 To estimate the response of preventives we calculated the change in triptan defined daily dose (DDD) 90 days after starting a preventive, as previously reported in a registry-based cohort study of migraine preventives. 23 The baseline was the number of triptan DDDs the last 90 days before starting a preventive, while the comparing treatment period was defined as the number of triptan DDDs the first 90 days after starting a preventive. 26 In cases where there was a 50% or greater reduction in triptan DDDs, the treatment was considered effective.
To qualify as a preventive trial, a patient had to have at least one triptan dispensation during the baseline period. Only preventives with 50 or more individual trials were included for analysis. OnabotulinumtoxinA, anti-CGRP monoclonal antibodies and gepants were excluded because there was sparse prescription data during the study period. All participants meeting these criteria were included to preserve statistical power and internal validity. Since established migraine preventives may be effective irrespective of their primary indication and recognizing that these medications are prescribed for other conditions (e.g., hypertension), we counted anyone dispensing a migraine preventive drug as a trial participant regardless of the recorded reimbursement indication.
To estimate the retention of triptans, we looked at the number of filled triptan prescriptions per individual, using a cut-off of three or more dispensations as a sign of retention, and thus a surrogate of effect. The rationale for this threshold was severalfold: 1) prior research indicates that many migraine patients in Norway only try one type of triptan, 24 2) it is reasonable to believe that the number of dispensations of a triptan is low if it is ineffective, 3) at least three triptan dispensations was considered an appropriate threshold through expert consensus among the authors, and 4) it has been shown in a Danish study that among those with at least three triptan dispensations over a 23-year period, >75% report having effect. 27
For the analysis of triptan retention, we used a wash-out period from 2004 to 2008 to exclude individuals dispensing any triptans. This new-user design was applied to ensure a homogeneous baseline of treatment-naïve patients starting from the same condition of no prior exposure, thereby reducing the risk of prevalent user bias. The study period was 2009–2019, and the total number of triptan dispensations accumulated at the end of 2019 was used to assess retention. Switching between triptans during the study period was permitted and the dispensations were aggregated across all triptans. Owing to the known inter-individual effects of different triptans we also conducted a sensitivity analysis only considering dispensations of sumatriptan, where individuals were excluded from analysis if they dispensed sumatriptan specifically in the wash-out period. Sumatriptan was chosen as this was the most prescribed triptan. Newer acute treatments like lasmiditan and gepants were not analyzed due to sparse prescription data in the study period.
Splitting
The datasets were randomly split into a train, validation and test set with a 0.7:0.1:0.2 ratio, stratified on the medication classes. The splits were done prior to any data management, imputation or modelling to mitigate data leakage.
Missingness, imputation and balancing
Missing values were assessed to find underlying explanations, and missingness for each feature was classified as either missing completely at random (MCAR), missing at random (MAR) or missing not at random (MNAR). Features with >50% missingness were omitted from analysis. For features with MNAR, fitting strategies were chosen for each feature individually. Multiple imputation was the general strategy for handling MCAR and MAR. The imputation strategies for all features are described in Supplementary File 1.
To identify the optimal model for multiple imputation, we extracted a subset of the prevention data with only complete cases. From this subset, 10% of the clinical data were removed at random, and models with widely different approaches were used to impute the data: multivariate imputation with chained-equations (MICE), k-Nearest Neighbor imputer and DataWig imputer. Different strategies of imputing the continuous and categorical features separately and together were also tried. The multiple imputation strategies were evaluated by comparing the imputed subsets to the complete case subset, estimating mean squared error (MSE), root mean squared error (RMSE) and R2, and the best scoring strategy was chosen (results can be found in Supplementary File 1). The imputation strategies were finally applied to the train, validation and test sets separately.
After imputation, additional versions of each training set with balanced outcome were created. Traditionally, oversampling techniques such as random replication of minority class samples and synthetic minority oversampling have been used for this purpose, but these methods have considerable limitations. 28 A recently published paper showed that Forest Diffusion, a flow and diffusion model utilizing XGBoost for function estimation, is promising at generating tabular data. 29 To explore this new method, we used it as an oversampling technique by generating new minority class samples, thereby balancing the training sets. The impact of different resampling strategies was assessed through cross validation on the training set and performance in the validation set.
Scaling
Scaling is a preprocessing technique that transforms feature values to a comparable numerical range. A series of scaling strategies including no scaling and scikit-learn python's library min-max scaler and standard scaler, were evaluated. 30 For the preventive analyses, logistic regression classifier was trained on the combined train data for each preventive. Five-fold cross validation was used to estimate the mean area under the receiver operating characteristic curve (AUC), and the mean AUC for each scaling method was compared for the final scaler selection. For the triptan analyses, all model types were trained on the triptan combined data with the three different scaling methods. The best scaling method per model type was chosen based on AUC from 5-fold cross validation and from validation data. For further information and scaler evaluation results, see Supplementary File 2.
Modelling, optimization and evaluation
A series of standard ML architectures were trained and evaluated to predict the treatment response of migraine preventives and triptans, as well as a triptan sensitivity analysis using sumatriptan specifically. The architectures included Logistic Regression, Support Vector Machines, Stochastic Gradient Descent, Gaussian Naïve Bayes, Gaussian Process, k-Nearest Neighbor, Decision Trees, Extra Trees, Random Forest, Gradient Boosting, Ada Boost, XG Boost and Multilayer Perceptron. Different models were created for each medication using only genotype data, only clinical data and the combined data. Models were trained on the train dataset and evaluated throughout the model development process by 5-fold cross validation on the training set and performance on the validation dataset. Predictions were made using predict_proba and predict methods.
The primary scoring metric for the classification models was AUC, with accuracy, precision, recall, F1 score, and balanced accuracy used as additional metrics. AUC quantifies the model's ability to distinguish between positive and negative samples. 31 An AUC of 0.50 indicates chance-level performance, values <0.50 indicate worse-than-chance performance, and values >0.50 indicate better-than-chance performance, with 1.0 representing perfect discrimination. The top performing models according to AUC were refined using Bayesian optimization. Manual hyperparameter tuning was further applied to mitigate over- and underfitting, which occur when a model either captures noise in the training data and generalizes poorly, or fails to capture underlying data patterns. The model types that performed best on imbalanced training data were subsequently retrained and re-optimized on balanced datasets to enable comparison of performance across training conditions. Finally, the best performing model for each combination of features and outcomes was evaluated once on the held-out test data.
Causal ML architectures were also trained and evaluated to predict the treatment response of migraine preventives. SLearner, TLearner, DragonNET, Snet, Flextenet and Causal Forest from CausalML, 32 and Generative Adversarial Nets for inference of Individualized Treatment Effects (GANITE) and Causal Multi-task Gaussian Process (CMGP) from the van der Schaar Lab were trained to predict treatment effects.33,34 These models are designed to estimate the causal relationships between features, in contrast to standard ML models that focus on detecting data patterns and correlations. 32 When applied to treatment effect estimation, they typically compare one treatment to another. In our case there are more than two treatments, so one model was developed for each possible combination of two treatments (treatment A + treatment B, treatment A + treatment C, treatment B + treatment C, and so on). In other words, for every causal ML architecture we trained one model for each treatment combination. The models’ performances were evaluated on validation data by comparing predicted outcomes for each treatment to the available observed outcomes (factuals), available in the models’ source codes. The best performing model based on AUC was further evaluated on the held-out test data. The same scoring metrics as for the standard architectures were reported.
Model explainability
We estimated SHapley Additive exPlanations (SHAP) values as a measure of feature importance. In the SHAP framework, the contribution of each input feature to a model's output is calculated based on a cooperative game theory method for fair allocation of results between participants in a game. 35 SHAP values were represented using SHAP summary plots. One plot was made for the best model of each medication to show the possible similarities and differences in feature importance between them. Additionally, mean absolute SHAP values were calculated across the medications to assess which features were generally important in predicting treatment effects. Which features (i.e., clinical, genotype or combined) and treatments (i.e., preventives and/or triptans) to be included in the SHAP analysis were determined after the prediction models had been developed and tested.
Results
Study cohorts
In total 43,197 participants had available genotype and clinical data. For the preventive analyses, in total 475 participants were included. Of these, 166 had tried amitriptyline, 190 a beta-blocker (metoprolol and/or propranolol), 251 candesartan and 52 topiramate, with positive responder rates of 30.7%, 41.6%, 39.8% and 32.7% respectively. For the analyses of triptans, 565 (responder rate 49.2%) were included, whereof 371 (responder rate 42.9%) had dispensed sumatriptan specifically. The genotype data consisted of 108 migraine risk loci, while the clinical data included 65 features in the preventive cohort and 56 in the triptan cohort (all clinical features are described in Supplementary File 1). See Table 1 for an overview of the study cohort characteristics and Supplementary File 3 for STROBE flow charts of the cohorts.
Summary of cohort characteristics before imputation.
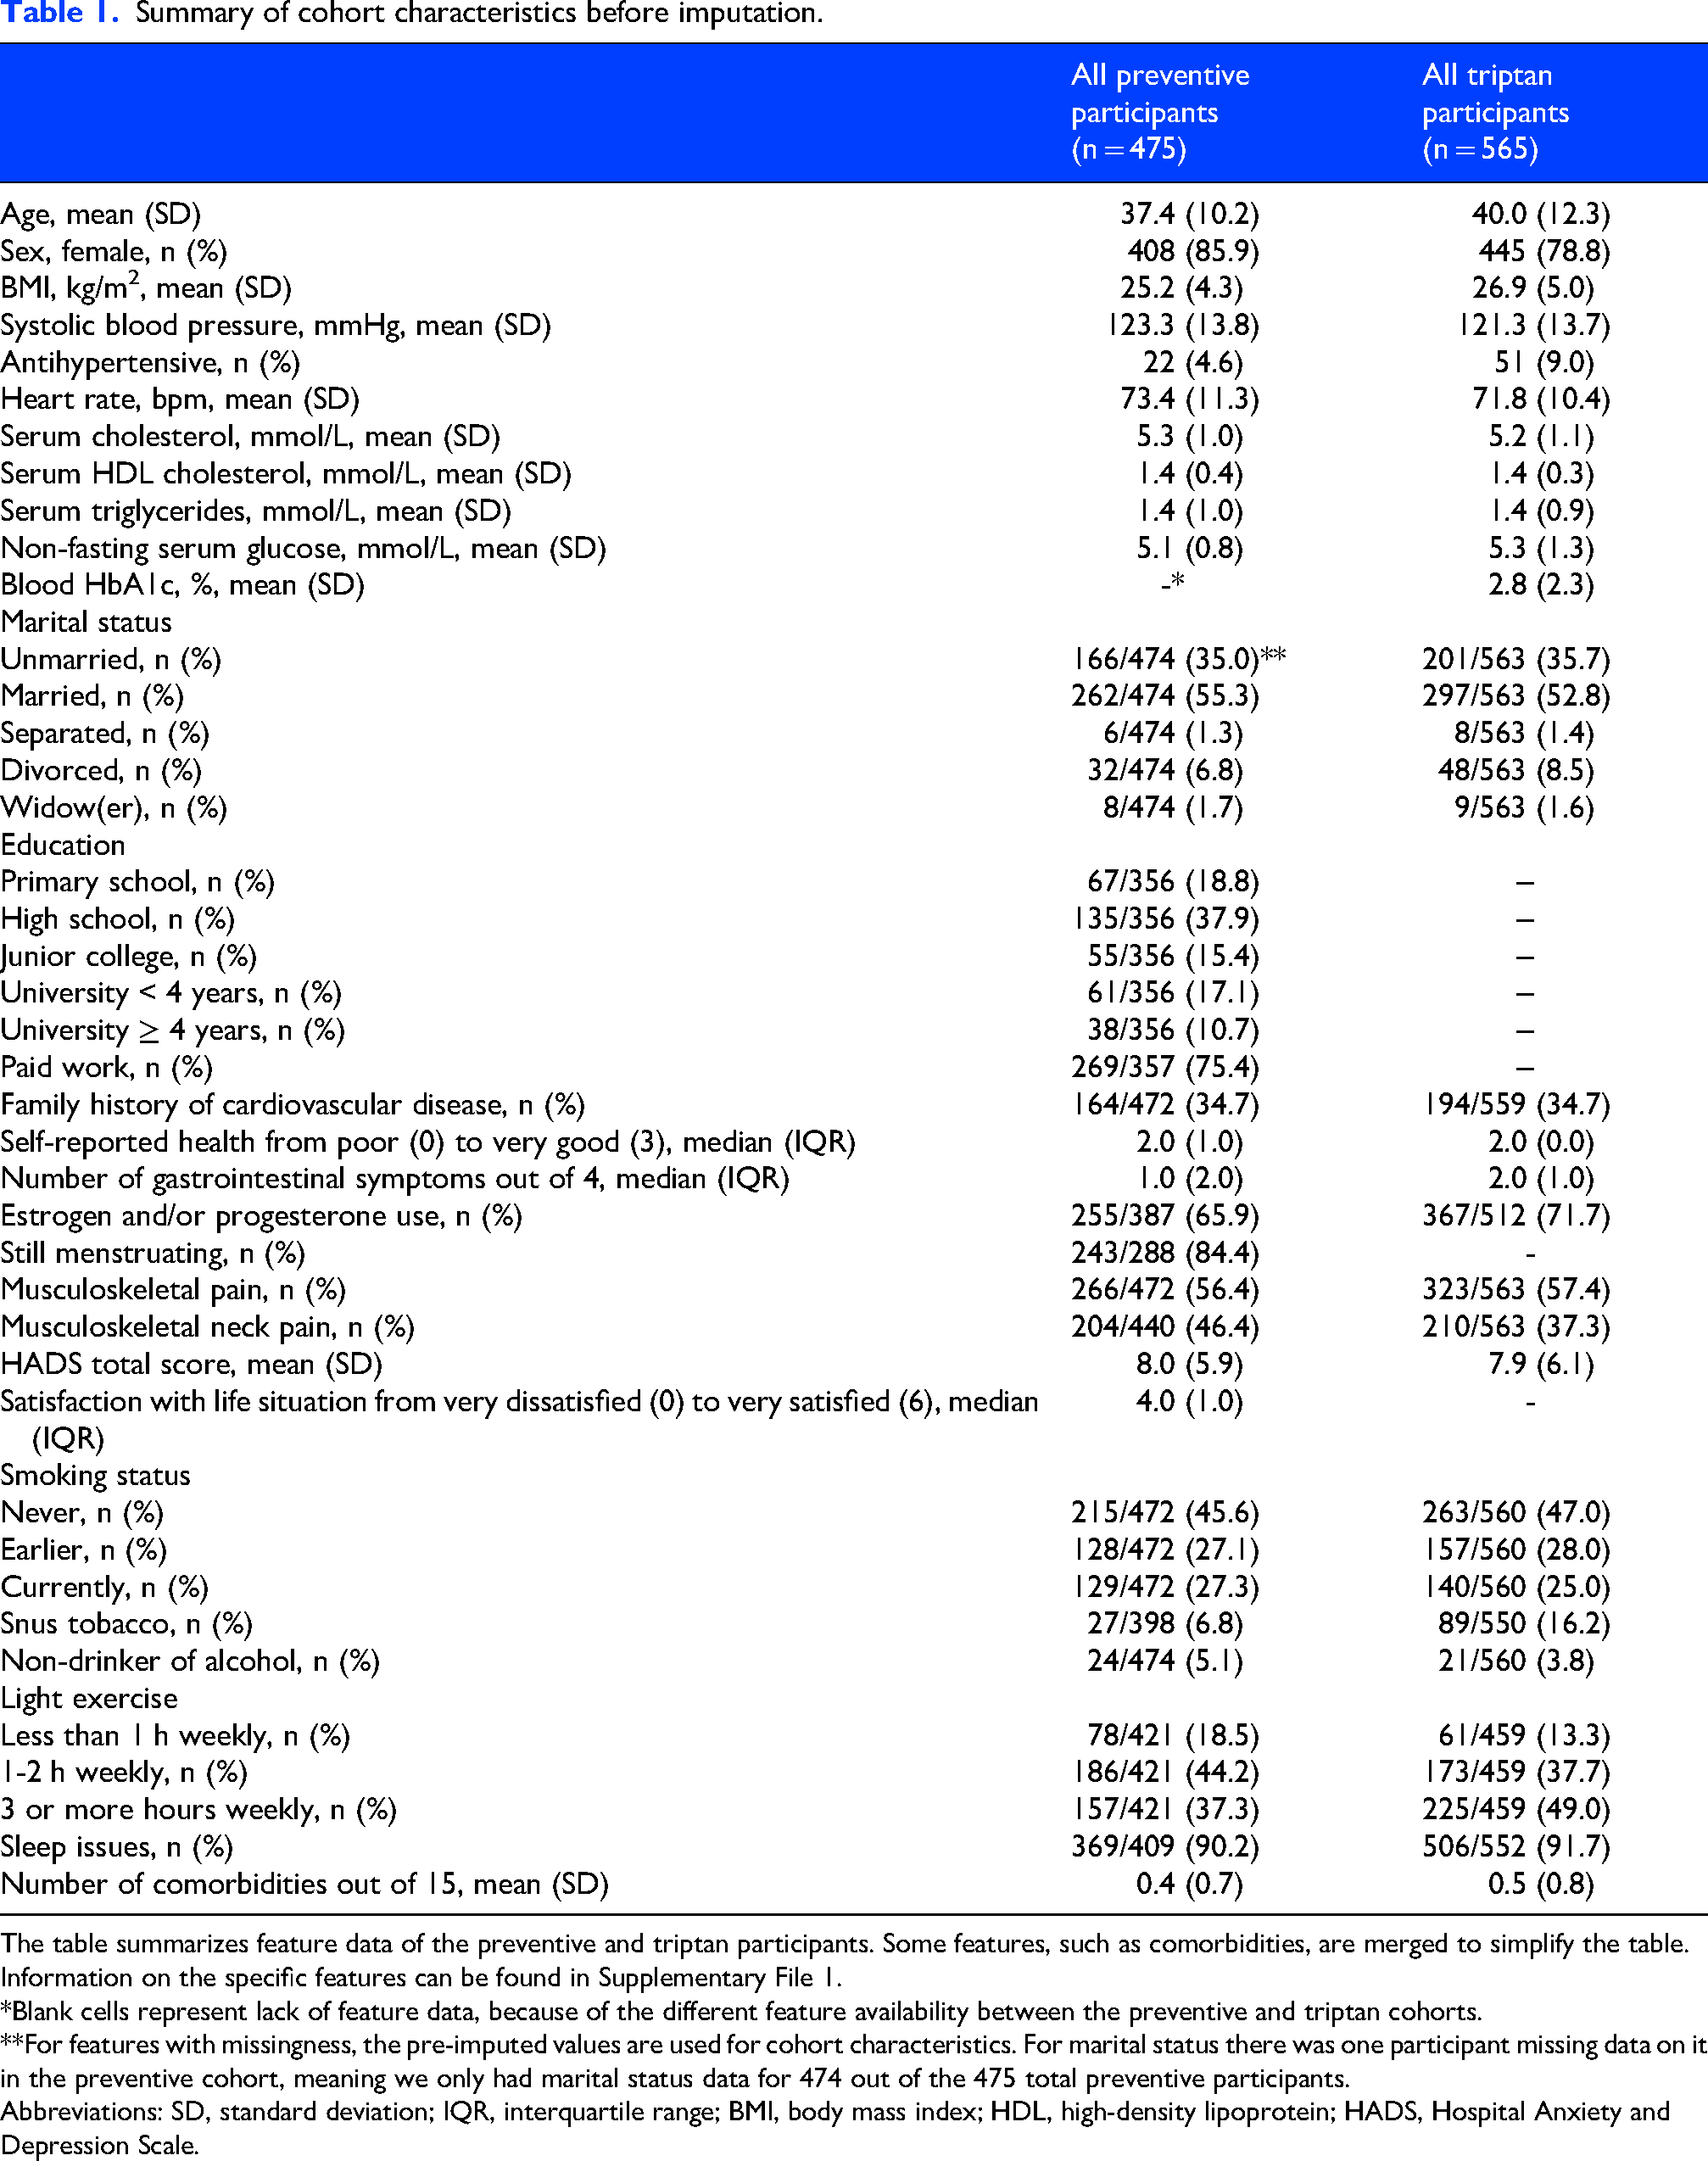
The table summarizes feature data of the preventive and triptan participants. Some features, such as comorbidities, are merged to simplify the table. Information on the specific features can be found in Supplementary File 1.
*Blank cells represent lack of feature data, because of the different feature availability between the preventive and triptan cohorts.
**For features with missingness, the pre-imputed values are used for cohort characteristics. For marital status there was one participant missing data on it in the preventive cohort, meaning we only had marital status data for 474 out of the 475 total preventive participants.
Abbreviations: SD, standard deviation; IQR, interquartile range; BMI, body mass index; HDL, high-density lipoprotein; HADS, Hospital Anxiety and Depression Scale.
Preventive response prediction with standard ML models
Using only clinical features, the best models achieved AUCs of 0.58 for amitriptyline, 0.69 for beta-blockers, 0.59 for candesartan and 0.56 for topiramate when tested on the unseen test data. The models trained on genotype features achieved AUCs of 0.76 for amitriptyline, 0.74 for beta-blockers, 0.38 for candesartan and 0.26 for topiramate. Making use of both clinical and genotype features, the best models achieved AUCs of 0.47 for amitriptyline, 0.55 for beta-blockers, 0.45 for candesartan and 0.30 for topiramate. See Table 2 for cross validation, validation and test results. Full test results are reported in Supplementary File 4.
Preventive treatment response predictions in the training, validation and test sets with standard ML models.
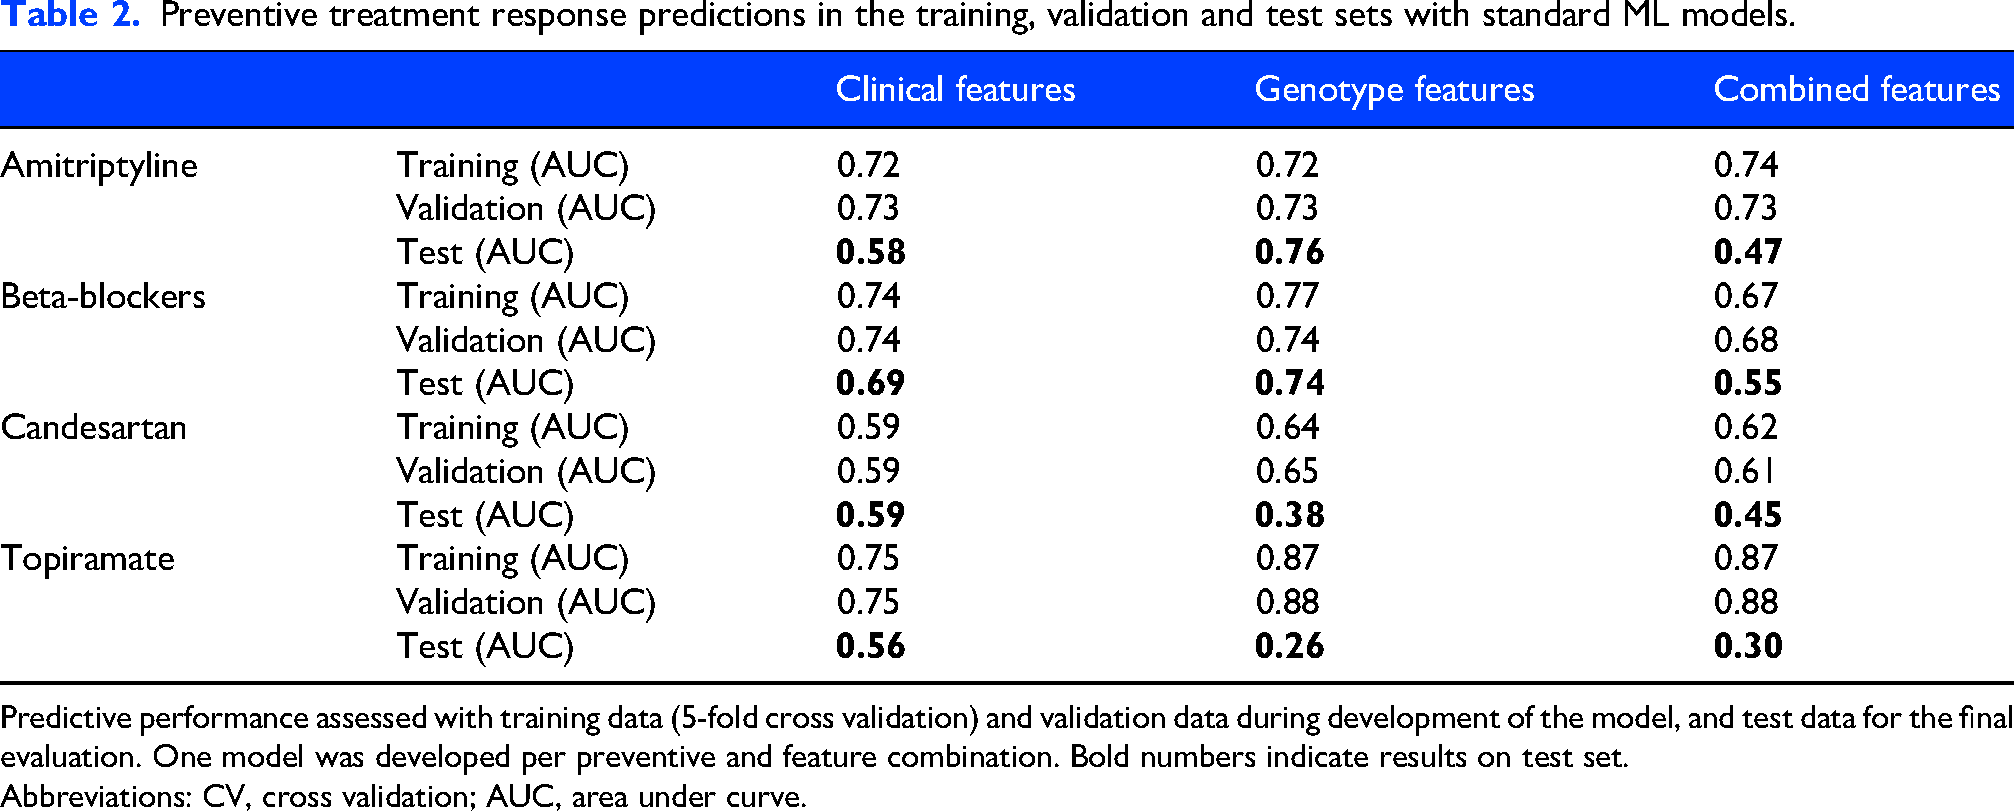
Predictive performance assessed with training data (5-fold cross validation) and validation data during development of the model, and test data for the final evaluation. One model was developed per preventive and feature combination. Bold numbers indicate results on test set.
Abbreviations: CV, cross validation; AUC, area under curve.
Preventive response prediction with causal inference models
The AUCs for the best causal inference model trained on clinical features were 0.60 for beta-blockers and <0.50 for the remaining preventives (Table 3). Similarly, the best model trained on genotype features achieved AUC >0.50 for amitriptyline only (AUC 0.68). When all available features were used, AUC was 0.80 for amitriptyline, 0.52 for beta-blockers, 0.30 for candesartan and 0.56 for topiramate.
Preventive treatment response predictions in the validation and test sets with causal inference models.
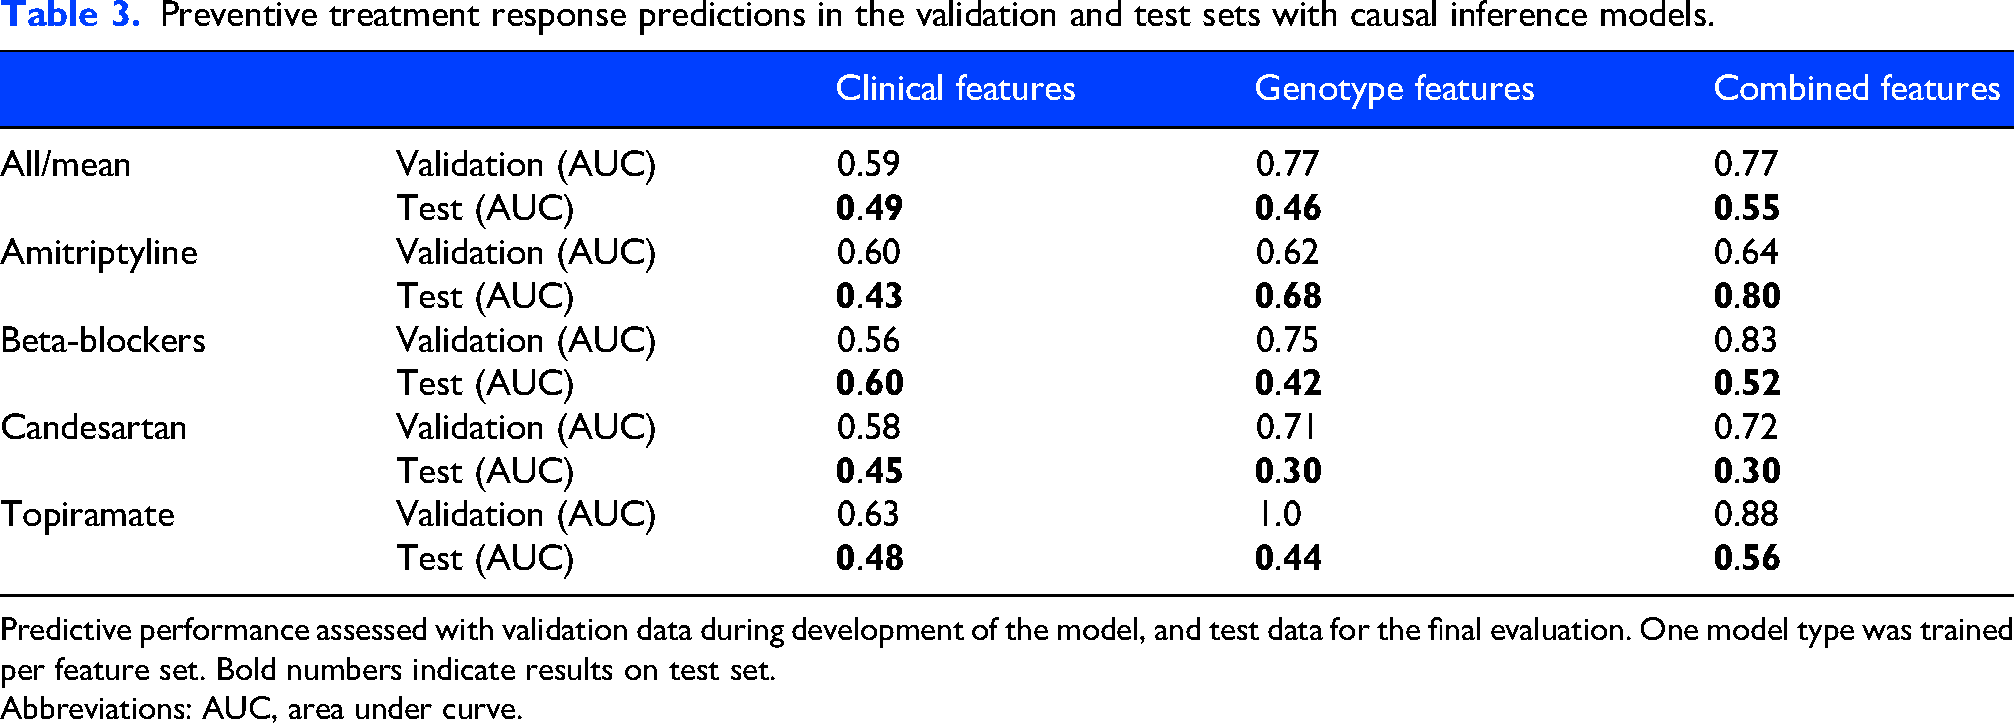
Predictive performance assessed with validation data during development of the model, and test data for the final evaluation. One model type was trained per feature set. Bold numbers indicate results on test set.
Abbreviations: AUC, area under curve.
Triptan retention prediction
The results of the triptan and sumatriptan retention prediction models can be seen in Table 4. For triptans in general, the AUCs were 0.56 with clinical features and 0.50 or lower with both genotype and the combined features. In contrast, for sumatriptan the AUC was below 0.50 with clinical features but 0.58 with genotype and 0.55 with combined features.
Evaluation of triptan and sumatriptan treatment retention predictions.
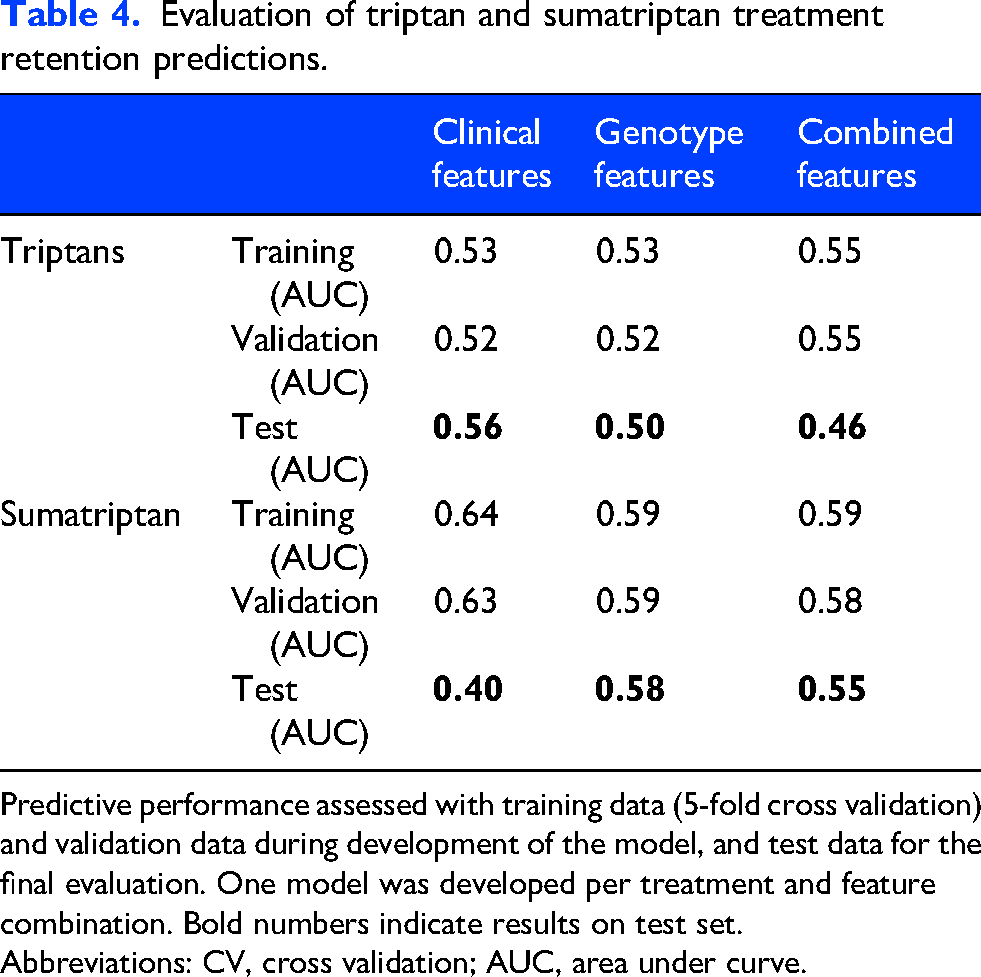
Predictive performance assessed with training data (5-fold cross validation) and validation data during development of the model, and test data for the final evaluation. One model was developed per treatment and feature combination. Bold numbers indicate results on test set.
Abbreviations: CV, cross validation; AUC, area under curve.
Model explainability
Looking at the ten most important features for each preventive (Figure 2), several features were important predictors for more than one treatment: serum HDL (high-density lipoprotein) cholesterol level, serum triglyceride level, use of systemic estrogen, age at time of menarche, systolic and diastolic blood pressure, heart rate, number of weekly work hours, HADS (Hospital Anxiety and Depression Score) anxiety and depression scores, CONOR (Cohort of Norway) mental health index and the number of hours of weekly light exercise. Most of these features can be found in Figure 3, where the ten most important features across all treatments are represented by mean absolute SHAP values. Here, the use of systemic estrogen was the most important feature. Summarized, the most important groups of features across treatments were hormone related features, lipid level measurements and hemodynamic parameters.
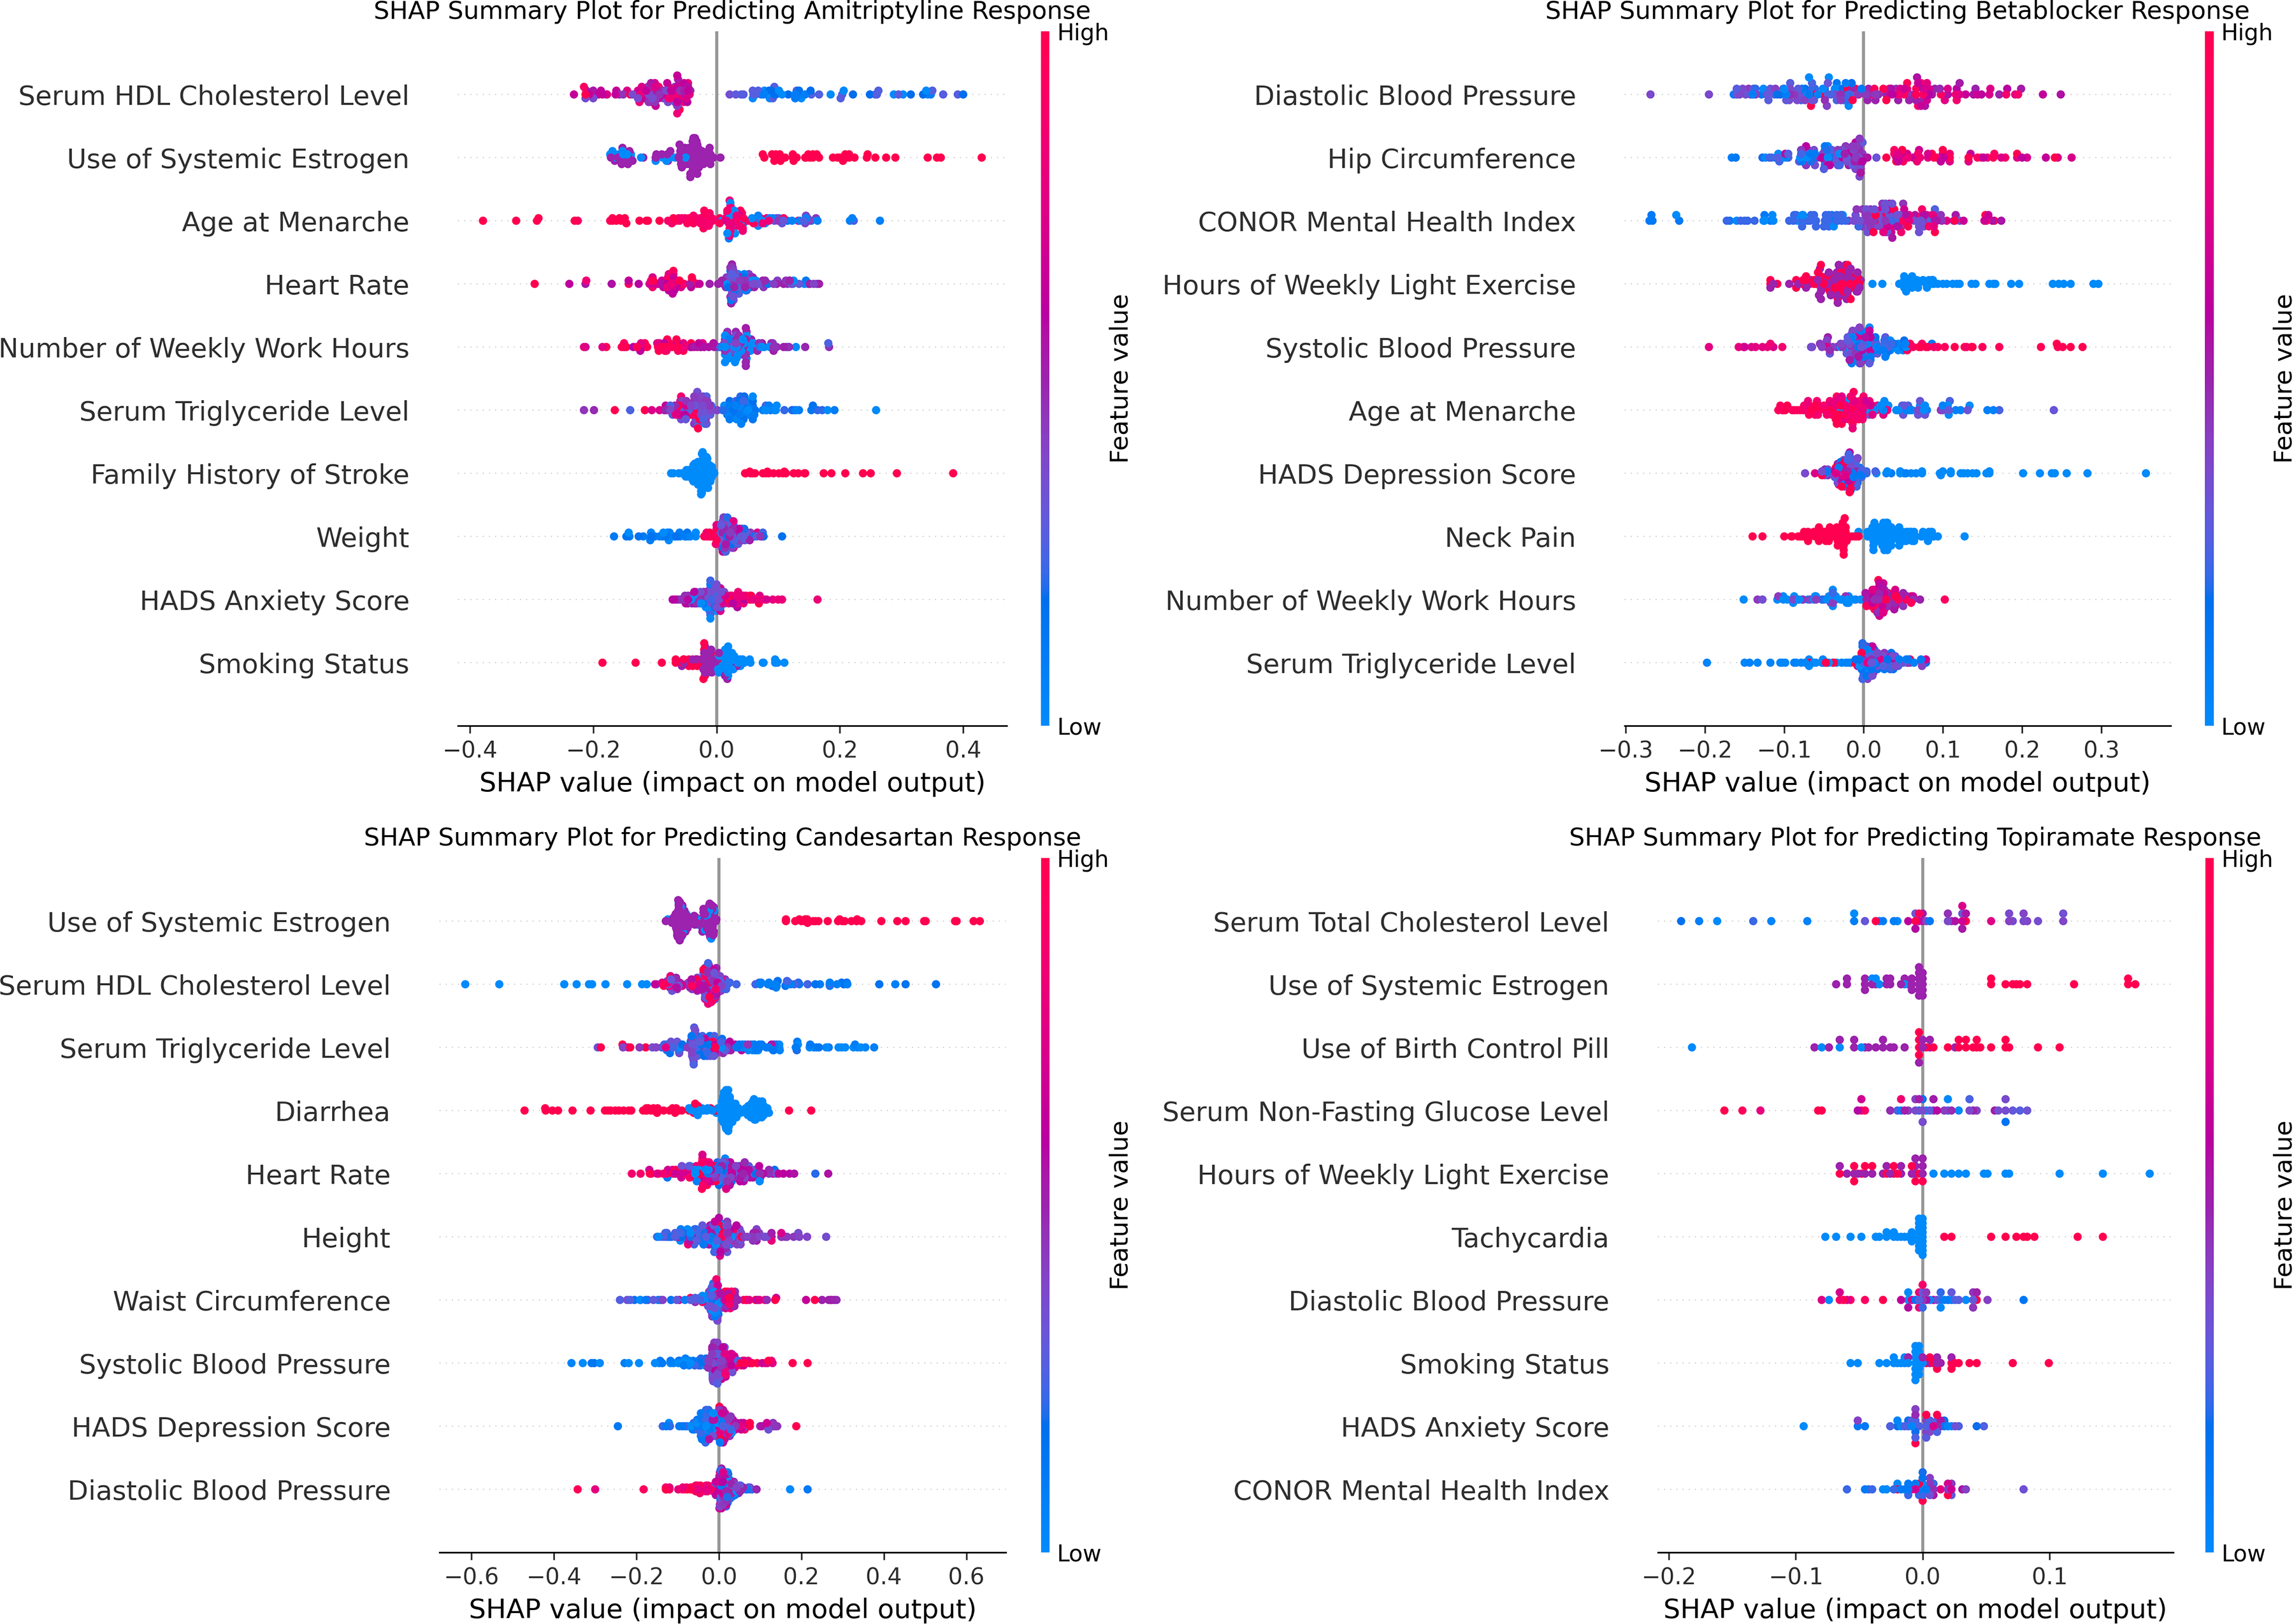
SHAP summary plots for each preventive treatment. Abbreviations: HDL, high-density lipoprotein; HADS, Hospital Anxiety and Depression Scale; CONOR, Cohort of Norway; SHAP, SHapley Additive exPlanation
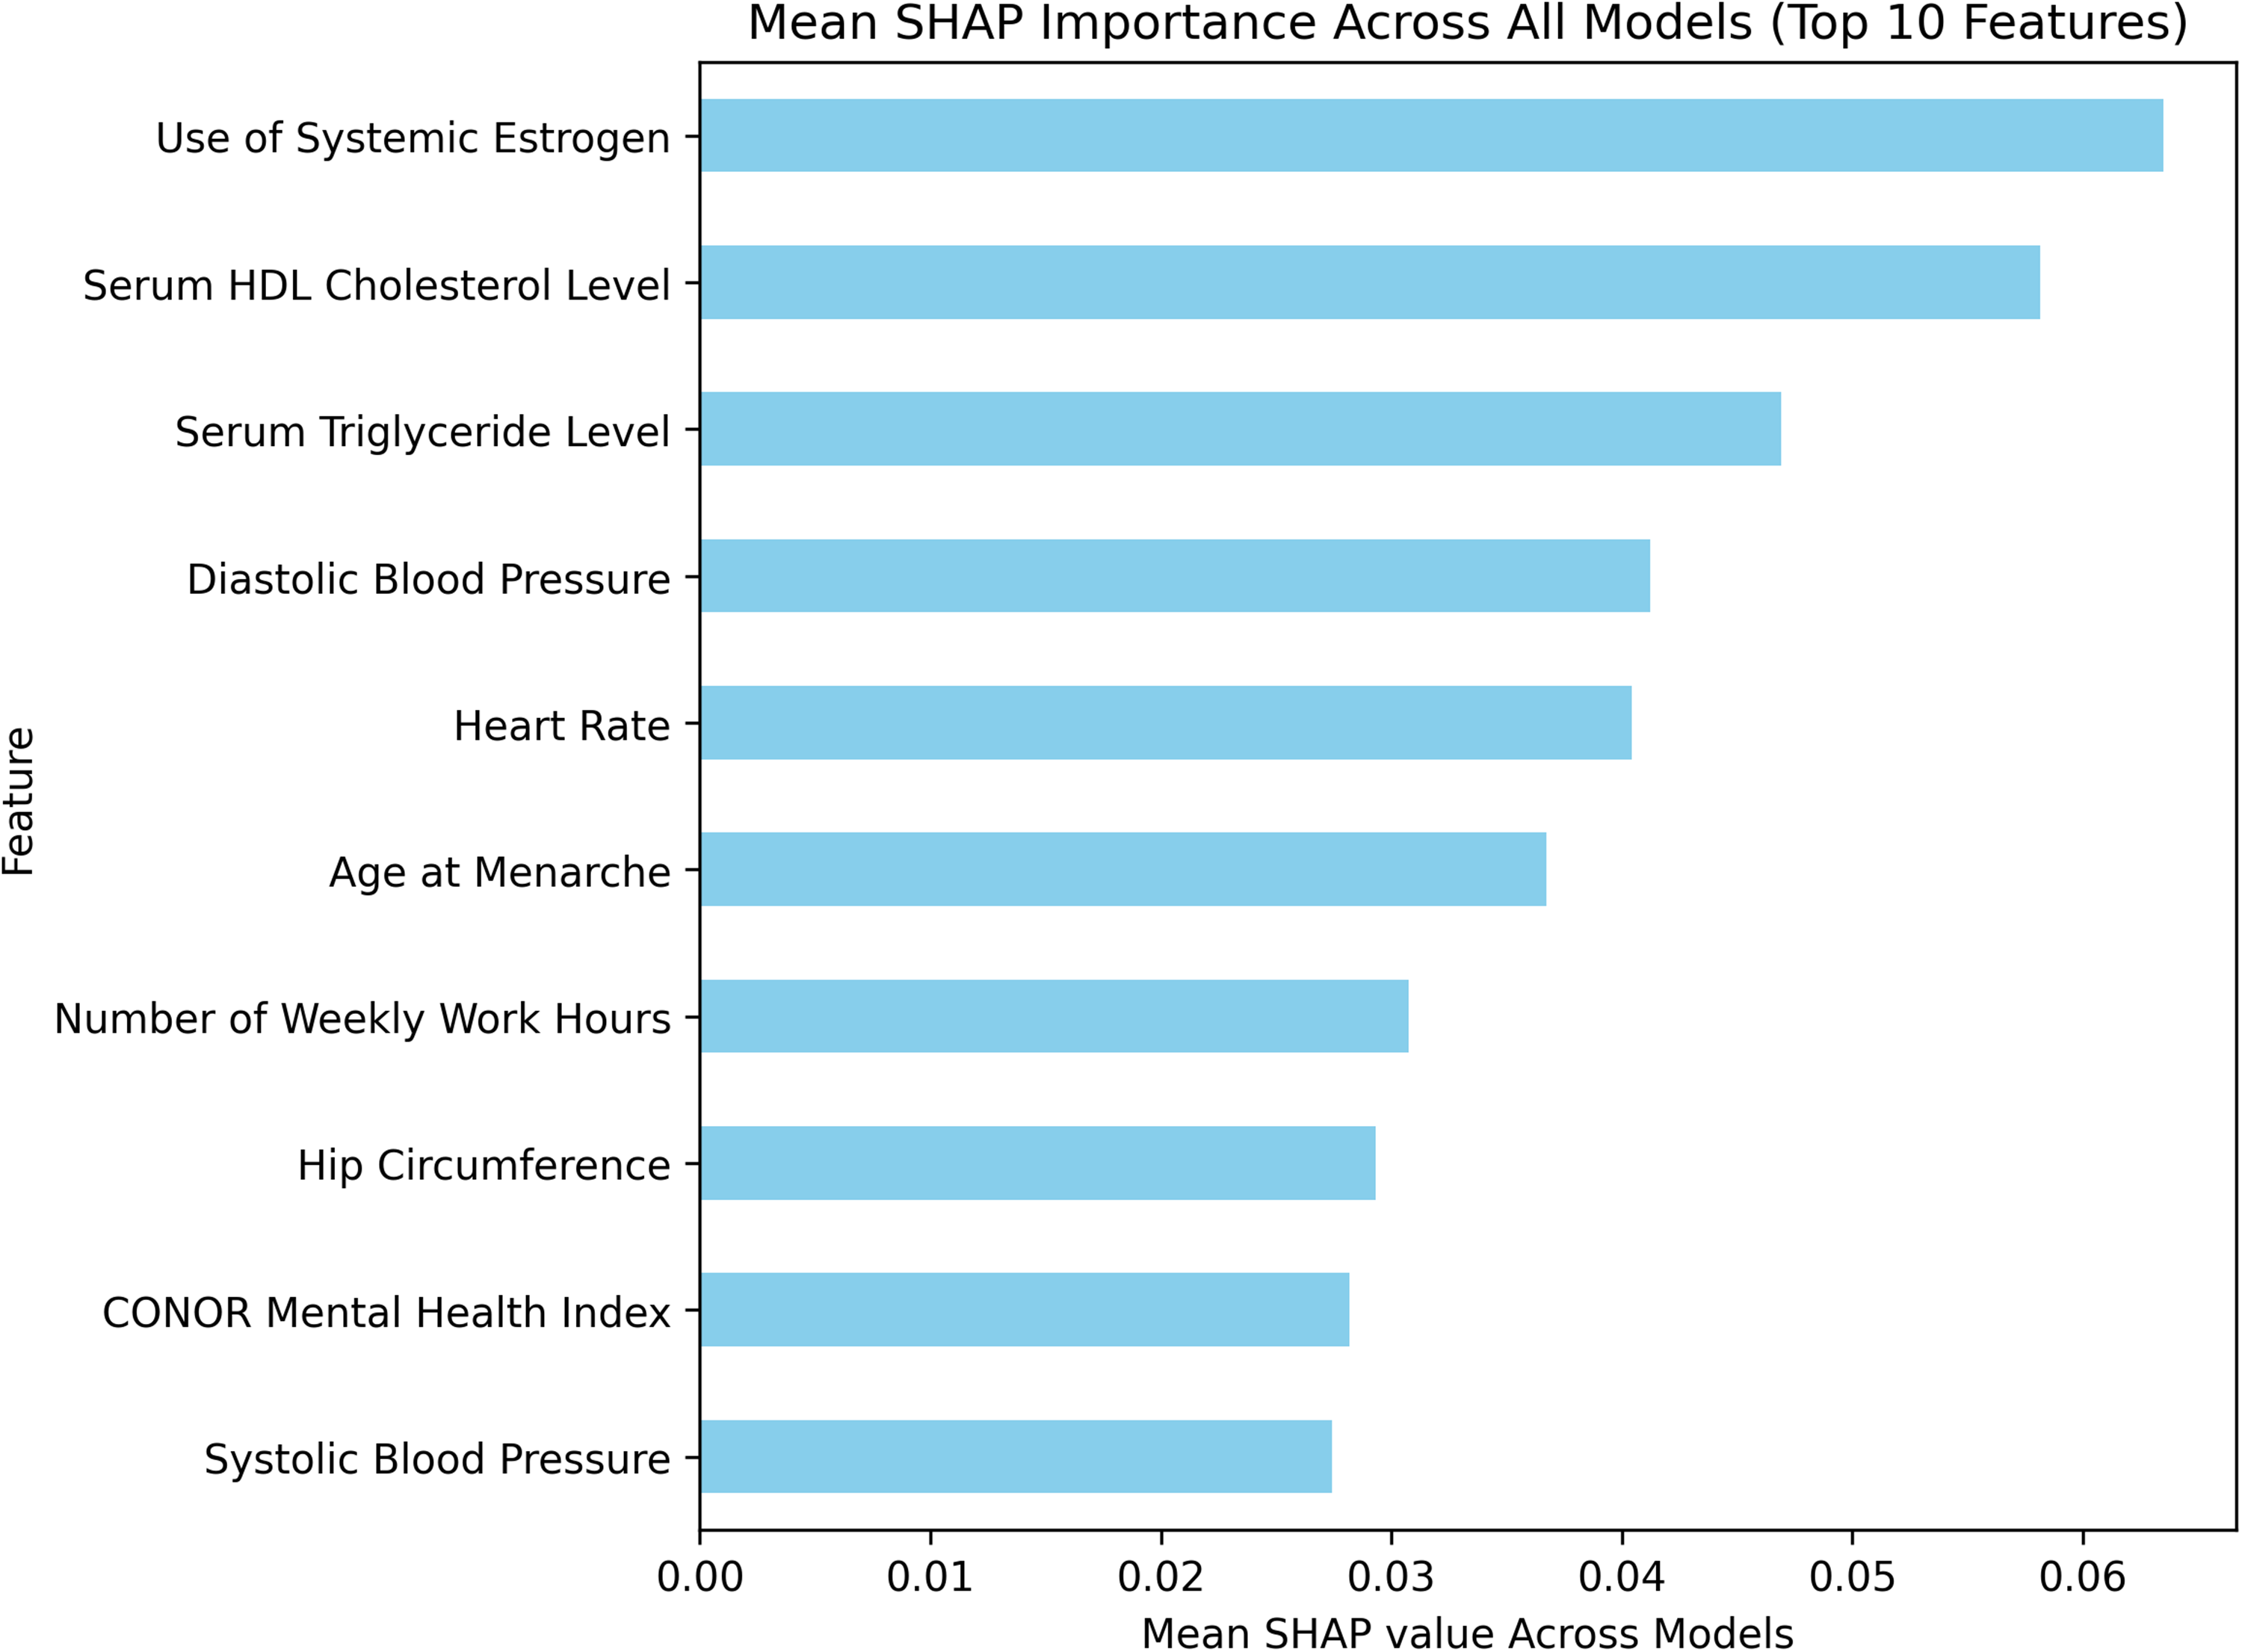
SHAP bar plot of ten most important features across all four models. SHAP values for each feature of each preventive treatment were estimated. Then, the mean of the absolute SHAP values was calculated, and the ten highest mean SHAP values were represented in the bar plot. Abbreviations: HDL, high-density lipoprotein; CONOR, Cohort of Norway; SHAP, SHapley Additive exPlanation
Discussion
We found that test set AUCs were consistently higher than 0.50 when preventive treatment responses were predicted using only clinical data. This suggests that the clinical models are promising despite some overfitting, with test AUCs ranging from 0.56 to 0.69 between the four preventives. Although the predictive performance is modest in absolute terms, the models may still outperform current guidelines in predicting preventive treatment responses, which may not be better than chance levels. 6 When including genetic data and causal inference models, results were poor and many models overfitted to the training and validation data. The study's overall poor to modest results may reflect limitations like small sample size, case definition, confounding by indication and proxy outcomes.
Interestingly, using non-headache clinical features to predict preventive response, our results are comparable to an American cohort study where similar models were developed using detailed headache questionnaire data of 4260 migraine patients. 11 They reported AUCs from 0.58 to 0.67 for beta-blockers, tricyclic antidepressants, verapamil, topiramate, gabapentin and onabotulinumtoxinA, while the CGRP inhibitors stood out with AUC 0.83. The close similarity between the AUCs reported in that study and those observed in our models suggests that factors beyond headache-specific characteristics contribute significantly to migraine treatment response predictions. A similar pattern has been observed in the context of migraine diagnosis, where non-headache features were shown to carry predictive value. 36 The importance of non-headache features in migraine-related predictions supports the view of migraine as a complex condition, where headache is only one manifestation of a broader underlying condition. 37
Results of prediction models for migraine treatment responses have generally been more optimistic than our results. A systematic review by Chen et al. 12 evaluated 10 studies where models were developed to predict responses to treatments like transcutaneous auricular vagus nerve stimulation, CGRP monoclonal antibodies, acupuncture, non-steroidal anti-inflammatory drugs and sumatriptan. The pooled AUC was high at 0.86, but heterogeneity between studies was observed and all studies were assessed as having a high risk of bias. Additionally, the models were evaluated using k-fold or leave-one-out cross validation without a held-out test set, increasing the risk of overly optimistic performance estimates. Chen et al. concluded that the reliability of the high AUC values is limited. In this context, our modest results appear reasonable given the strict internal validation applied to our models.
During the modelling process, we observed that ensemble tree models consistently outperformed the more complex Multilayer Perceptron. In fact, the best model types in all cases were XGBoost, AdaBoost, Random Forest, or Gradient Boosting. These models performed best when hyperparameters simplified the architecture, such as using a low number of estimators (see Supplementary File 5). These observations align with prior findings that lower complexity models can outperform higher complexity models when sample sizes are small.38,39 Even for medium sample sizes of around 10,000, tree-based models often surpass deep learning models. 40 Similarly, the causal inference models failed to achieve AUCs > 0.50 on the test data in most cases, likely reflecting a mismatch between the model complexity and limited sample size. To address this limitation, Forest Diffusion oversampling was used to increase the sample size. This improved the ensemble tree models and may have potential for future applications in small, imbalanced medical datasets. However, oversampling yielded little improvement in the causal inference models. Although such models ultimately proved inappropriate for our study, their potential to infer migraine treatment effects should not be discounted in settings with larger training samples.
Regarding triptans, the models performed better than chance only when using clinical data (AUC 0.56). Contrary, for sumatriptan this occurred only with genotype (AUC 0.58) and combined data (AUC 0.55). The differing feature dependencies between the two analyses warrant cautious interpretation of these results. However, we do believe that prediction models for triptan response should be further researched, as multiple predictors of sumatriptan response have already been identified such as left hippocampal volume (specificity 84.6%, sensitivity 57.9%, accuracy 68.8%) and several headache related features.41,42
An important aspect of this work was to assess the influence of genetic data on machine prescription. In our trial, the models achieved test AUCs of 0.76 and 0.74 for amitriptyline and beta-blockers respectively when using genotype data alone. The models were seemingly appropriately fitted according to the training, validation and test performance. However, AUC was < 0.50 for candesartan and topiramate, and when clinical and genotype data were combined, the response predictions for both amitriptyline and beta-blockers were considerably worsened. This may be explained by the unfavorable sample-to-feature ratio resulting in fragile models. The apparent superiority of clinical over genotype features in our findings might also be attributed to the richness of the clinical data, which indirectly describes the downstream manifestation of genotype and thus makes genetic data redundant. Despite these findings, previous studies have demonstrated associations between triptan response and polygenic risk load, 14 and between verapamil response and genetic data. 43 Furthermore, genetic data can improve ML predictions of treatment responses in other contexts, such as cancer.44,45 Thus, it seems that genetic data when used alone may be of value, however, in combination with clinical data, it appears to be less important for clinical predictive tasks.
The most important clinical feature across the four preventives was use of systemic estrogen, where current or prior use lead the models to predict positive treatment response. Estrogen use directly and indirectly conveys information on three areas known to be associated with migraine: age, 46 sex, 47 and estrogen levels 48 – possibly explaining its importance in the models. Notably, age and sex alone were not important predictors. However, age at menarche was important, substantiating the association between hormone-related features and migraine. 48 Novel predictors were also identified, including lipid levels and hemodynamic parameters. While these features are not typically associated with migraine management, they are cardiovascular risk factors and might as such be associated with migraine 49 and migraine preventive response. The consistency in which the same features were important across different treatments (Figure 2) suggests that the models are capturing genuine patterns rather than noise, although it remains unclear whether these reflect treatment response or prescribing patterns.
Strengths and limitations
This study has several strengths. First, the modelling approach is thorough and exhaustive with appropriate out-of-sample evaluation. Second, it is the first study to combine clinical and genotype data to predict migraine treatment effects. Third, the population-based design enhances generalizability compared to single-center studies, which potentially may reflect local prescribing practices.
This study also has several limitations. First are the small sample sizes in both the preventive (n = 475) and triptan (n = 565) datasets which make the models susceptible to overfitting and fragile across multiple outcomes. Second, is that the number and types of features were restricted by the availability and quality of the HUNT data, precluding inclusion of all relevant features such as headache features, presence of aura and headache days at baseline. There are also potentially long gaps between when features were assessed and when outcome was assessed. Many clinical features will change over time, leading to potential feature misclassification and attenuation of associations. Moreover, the genotypic features we used were migraine risk loci. While these risk loci may represent different underlying migraine causes, other loci could be more relevant to predict response to migraine treatments. These feature-related limitations likely limit the achievable accuracy of model predictions.
Third, using triptan dispensations to identify migraine patients introduces potential misclassification. Some individuals may receive triptans for cluster headache, or as part of a diagnostic headache workup without a confirmed migraine diagnosis. In addition, migraine sufferers who did not dispense triptans, i.e., due to prior inefficacy or contraindications, will be missed. These factors may limit the generalizability of the findings to patients who meet strict clinical migraine criteria. On the other hand, requiring rigorously documented clinical diagnoses generally restricts sample sizes, which in turn limits the potential of advanced modelling techniques. Although this study faces sample-size issues, the use of a broader, prescription-based cohort definition maximizes the number of eligible participants and can leverage the breadth of large registry data. Consequently, models derived from such a cohort should be validated on an independent sample defined by established clinical migraine criteria. Fourth is that the method for preventive response assessment is only a proxy for true treatment response. The assumption that a reduction in triptan dispensations indicates a reduction in migraine days and therefore efficacy of a preventive may be intuitive but lacks validation. The ground truth therapy response may therefore be misclassified in the preventive trials, possibly hampering model applicability. For example, preventive medications are often started at low doses and gradually titrated upward if early response is not reached, meaning those who first respond on high doses might be misclassified as non-responders because response is assessed 90 days after preventive start. Additionally, patients may stop dispensing triptans after starting a preventive due to poor triptan response, and this might lead to misclassification of preventive non-responders as responders. Other factors that might lead to preventive response (and triptan retention) misclassification include triptan adherence, physician prescribing practices, access to medication, and counseling regarding medication-overuse headache. In light of these limitations, it remains uncertain whether the proxy outcomes accurately reflect true treatment response, which may also contribute to the modest AUCs.
Finally, it is worth noting that patients could have received a preventive for non-migraine indications, raising the risk of confounding by indication where the model learns to predict prescription patterns rather than true clinical outcomes. Furthermore, preventives used for non-migraine indications may be associated with a smaller placebo effect, as the patients may not be expecting an effect on their migraine. It might also increase the risk of including participants with low-frequency episodic migraine without indication for preventive treatment that nevertheless started treatment because of another morbidity. On the other hand, many migraine preventives are used for multiple indications,23,24 and their pharmacologic efficacy does not depend on the reason for prescription. Excluding patients prescribed these agents for non-migraine indications may therefore lead to selection bias and limit model generalizability, which should be the main priority when developing models for future clinical utilization.
Future directions
We believe that the long-term objective of treatment response prediction models should be to aid clinicians in personalizing treatment to their patients. To be used in this context, the models need to be generalizable and applicable. An external validation of the preventive ML models on true out-of-sample data is therefore planned (clinicaltrials.gov ID: NCT06893874), where migraine patients across Norway will keep a headache diary to assess preventive response. The study will assess the validity of the proxy preventive outcome and the generalizability of the preventive models. Validation of the proxy preventive outcome is important for interpreting the results of this study and may also be highly valuable, as it would enable the use of large registry databases to develop future predictive models of preventive treatment response.
Applicability may be limited by the large number of input features required by these models. If external validation yields promising results, strategies to improve clinical usability should be explored. These may include automated extraction of input data from electronic health records, collection of patient-reported information through pre-visit questionnaires and feature selection to reduce model complexity.
Conclusion
We developed ML models that were able to predict treatment responses to four migraine preventives using clinical data with modest accuracy. The addition of genotype data and using causal inference models did not improve results, and developing models that predict triptan and sumatriptan retention with meaningful accuracy was proven to be very challenging, likely due to insufficient sample size. The most important preventive response predictors were hormone-related features, lipid levels and hemodynamic parameters. Lastly, we found that balancing with tree-based generative diffusion models might be a valuable option for small and imbalanced tabular datasets. The main limitation of this study is the lack of headache-specific data, limiting accurate cohort definition and treatment response assessment. All in all, this work underscores that ML could eventually aid in tailoring preventive migraine treatment, though further external validation of current prediction models is needed before clinical application, and better models can probably be made with larger datasets.
Article highlights
Machine learning models can predict treatment response to migraine preventives with modest accuracy.
Inclusion of genotype data in the models did not improve performance, however, this could be a result of the low sample size.
Predictions of triptan retention were unreliable.
Supplemental Material
sj-docx-1-cep-10.1177_03331024261467723 - Supplemental material for Prediction of migraine treatment response with clinical and genetic data: A machine learning analysis of the HUNT study
Supplemental material, sj-docx-1-cep-10.1177_03331024261467723 for Prediction of migraine treatment response with clinical and genetic data: A machine learning analysis of the HUNT study by Håkon Kvisle Abildsnes, Antonios Danelakis, Samita Giri, Dominic Giles, Manjit Matharu, Parashkev Nachev, Marte Helene Bjørk, Bendik S. Winsvold, Knut Hagen, Sigrid Børte, Joan Crespi Vidal, Erling Tronvik and Anker Stubberud in Cephalalgia
Supplemental Material
sj-docx-2-cep-10.1177_03331024261467723 - Supplemental material for Prediction of migraine treatment response with clinical and genetic data: A machine learning analysis of the HUNT study
Supplemental material, sj-docx-2-cep-10.1177_03331024261467723 for Prediction of migraine treatment response with clinical and genetic data: A machine learning analysis of the HUNT study by Håkon Kvisle Abildsnes, Antonios Danelakis, Samita Giri, Dominic Giles, Manjit Matharu, Parashkev Nachev, Marte Helene Bjørk, Bendik S. Winsvold, Knut Hagen, Sigrid Børte, Joan Crespi Vidal, Erling Tronvik and Anker Stubberud in Cephalalgia
Supplemental Material
sj-png-3-cep-10.1177_03331024261467723 - Supplemental material for Prediction of migraine treatment response with clinical and genetic data: A machine learning analysis of the HUNT study
Supplemental material, sj-png-3-cep-10.1177_03331024261467723 for Prediction of migraine treatment response with clinical and genetic data: A machine learning analysis of the HUNT study by Håkon Kvisle Abildsnes, Antonios Danelakis, Samita Giri, Dominic Giles, Manjit Matharu, Parashkev Nachev, Marte Helene Bjørk, Bendik S. Winsvold, Knut Hagen, Sigrid Børte, Joan Crespi Vidal, Erling Tronvik and Anker Stubberud in Cephalalgia
Supplemental Material
sj-png-4-cep-10.1177_03331024261467723 - Supplemental material for Prediction of migraine treatment response with clinical and genetic data: A machine learning analysis of the HUNT study
Supplemental material, sj-png-4-cep-10.1177_03331024261467723 for Prediction of migraine treatment response with clinical and genetic data: A machine learning analysis of the HUNT study by Håkon Kvisle Abildsnes, Antonios Danelakis, Samita Giri, Dominic Giles, Manjit Matharu, Parashkev Nachev, Marte Helene Bjørk, Bendik S. Winsvold, Knut Hagen, Sigrid Børte, Joan Crespi Vidal, Erling Tronvik and Anker Stubberud in Cephalalgia
Supplemental Material
sj-png-5-cep-10.1177_03331024261467723 - Supplemental material for Prediction of migraine treatment response with clinical and genetic data: A machine learning analysis of the HUNT study
Supplemental material, sj-png-5-cep-10.1177_03331024261467723 for Prediction of migraine treatment response with clinical and genetic data: A machine learning analysis of the HUNT study by Håkon Kvisle Abildsnes, Antonios Danelakis, Samita Giri, Dominic Giles, Manjit Matharu, Parashkev Nachev, Marte Helene Bjørk, Bendik S. Winsvold, Knut Hagen, Sigrid Børte, Joan Crespi Vidal, Erling Tronvik and Anker Stubberud in Cephalalgia
Supplemental Material
sj-png-6-cep-10.1177_03331024261467723 - Supplemental material for Prediction of migraine treatment response with clinical and genetic data: A machine learning analysis of the HUNT study
Supplemental material, sj-png-6-cep-10.1177_03331024261467723 for Prediction of migraine treatment response with clinical and genetic data: A machine learning analysis of the HUNT study by Håkon Kvisle Abildsnes, Antonios Danelakis, Samita Giri, Dominic Giles, Manjit Matharu, Parashkev Nachev, Marte Helene Bjørk, Bendik S. Winsvold, Knut Hagen, Sigrid Børte, Joan Crespi Vidal, Erling Tronvik and Anker Stubberud in Cephalalgia
Supplemental Material
sj-png-7-cep-10.1177_03331024261467723 - Supplemental material for Prediction of migraine treatment response with clinical and genetic data: A machine learning analysis of the HUNT study
Supplemental material, sj-png-7-cep-10.1177_03331024261467723 for Prediction of migraine treatment response with clinical and genetic data: A machine learning analysis of the HUNT study by Håkon Kvisle Abildsnes, Antonios Danelakis, Samita Giri, Dominic Giles, Manjit Matharu, Parashkev Nachev, Marte Helene Bjørk, Bendik S. Winsvold, Knut Hagen, Sigrid Børte, Joan Crespi Vidal, Erling Tronvik and Anker Stubberud in Cephalalgia
Supplemental Material
sj-docx-8-cep-10.1177_03331024261467723 - Supplemental material for Prediction of migraine treatment response with clinical and genetic data: A machine learning analysis of the HUNT study
Supplemental material, sj-docx-8-cep-10.1177_03331024261467723 for Prediction of migraine treatment response with clinical and genetic data: A machine learning analysis of the HUNT study by Håkon Kvisle Abildsnes, Antonios Danelakis, Samita Giri, Dominic Giles, Manjit Matharu, Parashkev Nachev, Marte Helene Bjørk, Bendik S. Winsvold, Knut Hagen, Sigrid Børte, Joan Crespi Vidal, Erling Tronvik and Anker Stubberud in Cephalalgia
Supplemental Material
sj-docx-9-cep-10.1177_03331024261467723 - Supplemental material for Prediction of migraine treatment response with clinical and genetic data: A machine learning analysis of the HUNT study
Supplemental material, sj-docx-9-cep-10.1177_03331024261467723 for Prediction of migraine treatment response with clinical and genetic data: A machine learning analysis of the HUNT study by Håkon Kvisle Abildsnes, Antonios Danelakis, Samita Giri, Dominic Giles, Manjit Matharu, Parashkev Nachev, Marte Helene Bjørk, Bendik S. Winsvold, Knut Hagen, Sigrid Børte, Joan Crespi Vidal, Erling Tronvik and Anker Stubberud in Cephalalgia
Supplemental Material
sj-docx-10-cep-10.1177_03331024261467723 - Supplemental material for Prediction of migraine treatment response with clinical and genetic data: A machine learning analysis of the HUNT study
Supplemental material, sj-docx-10-cep-10.1177_03331024261467723 for Prediction of migraine treatment response with clinical and genetic data: A machine learning analysis of the HUNT study by Håkon Kvisle Abildsnes, Antonios Danelakis, Samita Giri, Dominic Giles, Manjit Matharu, Parashkev Nachev, Marte Helene Bjørk, Bendik S. Winsvold, Knut Hagen, Sigrid Børte, Joan Crespi Vidal, Erling Tronvik and Anker Stubberud in Cephalalgia
Footnotes
Acknowledgements
The AI chatbot ChatGPT (from chatgpt.com) was used to polish the manuscript. Input included sentences and single paragraphs from the unfinished manuscript, prompting the bot to output improved rewrites. All suggestons were subsequently reviewed by the authors.
The Trøndelag Health Study (HUNT) is a collaboration between HUNT Research Centre (Faculty of Medicine and Health Sciences (MH), Norwegian University of Science and Technology – NTNU), Trøndelag County Council, Central Norway Regional Health Authority, and the Norwegian Institute of Public Health.
The genotyping in HUNT was financed by the National Institutes of Health (NIH) (grant number NIH R35 HL135824-03); Stiftelsen Kristian Gerhardt Jebsen (grant number SKGJ-MED-015); University of Michigan; the Research Council of Norway; the Liaison Committee for Education, Research and Innovation in Central Norway; and the Joint Research Committee between St Olav's Hospital and the Faculty of Medicine and Health Sciences, NTNU.
The genotyping and imputation efforts in HUNT were a collaboration between researchers from the Department of Public Health and Nursing (ISM) (MH, NTNU), and the University of Michigan Medical School and the University of Michigan School of Public Health. The genotyping was performed at the Genomics Core Facility (GCF) (MH, NTNU).
The Norwegian headache patient organization (Hodepine Norge) was involved in design of the study, but played no role in the conduct, reporting or interpretation the study.
ORCID iDs

Ethical considerations
This study has been approved by the Regional Committee for Medical and Health Research (#2015/576/REK Midt and #2014/144/REK Midt).
Consent to participate
Participation in HUNT is based on informed, written consent.
Consent for publication
The authors agree to publish with Cephalalgia, if the manuscript is accepted.
Author contributions
All authors are responsible for the reported research and have read and approved this final version of the manuscript for submission to Cephalalgia.
Funding
The authors disclosed receipt of the following financial support for the research, authorship, and/or publication of this article: This study was funded by the Research Council of Norway and supported by the South-Eastern Norway Regional Health Authority (grant no. 2023089 to B.S.W.). The funders had no role in study design, data collection, analysis and interpretation of data, or writing of this manuscript.
The genotyping in HUNT was financed by the Research Council of Norway, the Stiftelsen Kristian Gerhard Jebsen, the Liaison Committee for Education, Research and Innovation in Central Norway, the Joint Research Committee between St Olavs hospital and the Faculty of Medicine and Health Sciences, NTNU (FFU), and the National Institutes of Health; University of Michigan; USA. The GCF is funded by the Faculty of Medicine and Health Sciences at NTNU and the Central Norway Regional Health Authority.
Declaration of conflicting interests
Anker Stubberud has received lecture honoraria from TEVA. Anker Stubberud and Erling Tronvik are shareholders and patent holders of Nordic Brain Tech AS and the Cerebri app. Marte-Helene Bjørk has the last 5 years received consultancy, advisory board and/or speaking honoraria from Eisai, AbbVie, Angelini Pharma, Novartis, Pfizer, UCB, Lilly, Teva, Organon, Jazz Pharmaceuticals, Lundbeck, and BestPractice (funded by pharmaceutical industry), as well as institutional grants for post authorization safety studies from the marketing authorization holders of valproate in Europe.
Data availability statement
The datasets used in the study contain sensitive personal information and are therefore not publicly available. The analytical code, including the full prediction models, is not publicly available either but may be provided upon reasonable request. The prediction models are not meant for clinical application until further external validation has been performed. No study protocol was prepared, and the study was not registered.
Open practices
Not applicable
Supplemental material
Supplemental material for this article is available online.
References
Supplementary Material
Please find the following supplemental material available below.
For Open Access articles published under a Creative Commons License, all supplemental material carries the same license as the article it is associated with.
For non-Open Access articles published, all supplemental material carries a non-exclusive license, and permission requests for re-use of supplemental material or any part of supplemental material shall be sent directly to the copyright owner as specified in the copyright notice associated with the article.


