






Abstract
The impact of adverse weather conditions on transportation operation and safety is the focus of many studies; however, comprehensive research detailing the differences in driving behavior and performance during adverse conditions is limited. Many previous studies utilized aggregate traffic and weather data (e.g., average speed, headway, and global weather information) to formulate conclusions about the impact of weather on network operation and safety; however, research into specific factors associated with driver performance and behavior are notably absent. A novel approach, presented in this paper, fills this gap by considering disaggregate trajectory-level data available through the SHRP2 Naturalistic Driving Study and Roadway Information Database. Parametric ordinal logistic regression and non-parametric classification tree modeling were utilized to better understand speed selection behavior in adverse weather conditions. The results indicate that the most important factors impacting driver speed selection are weather conditions, traffic conditions, and the posted speed limit. Moreover, it was found that drivers are more likely to significantly reduce their speed in snowy weather conditions, as compared with other adverse weather conditions (such as rain and fog). The purpose of this study was to gather insights into driver speed preferences in different weather conditions, such that efficient logic can be introduced for a realistic variable speed limit system—aimed at maximizing speed compliance and reducing speed variations. This study provides valuable information related to drivers’ interaction with real-time changes in roadway and weather conditions, leading to a better understanding of the effectiveness of operational countermeasures.
Adverse weather conditions are known to be one of the main contributing factors affecting traffic operation and safety. Inclement weather conditions impede drivers’ ability to perceive and react to their environment, and this decrease in driver performance has a dramatic impact on network-wide operations and the predictability of traffic flow. Studies have shown that drivers may reduce their speed, maintain a larger headway, and drive more carefully in adverse conditions to compensate for reduced visibility and slippery road conditions ( 1 ). A previous study investigated the impact of rain on freeway capacity, revealing that wet pavement and decreased visibility affects drivers’ speed selection and roadway capacity ( 2 ). Although this study focused on the impact of heavy rain, other studies have shown that light rain can also affect travel speed and roadway capacity (3,4). A study by Kyte et al. showed that both light rain and snow can reduce speed up to 50% ( 5 ). In addition, the study identified a 9 km/h speed reduction during wind speeds >48 km/h; however, the impact of reduced visibility on speed reduction was found to be marginal. Another study using the same test sites revealed that snow caused a speed reduction of 18 km/h ( 6 ). Ibrahim and Hall investigated the difference in traffic conditions during light rain, heavy rain, and snow compared with matching trips in clear weather conditions using the data from two rainy, two snowy, and six clear weather days. Results indicated a 3–5% speed reduction during light rain and snow, a 14–15% speed reduction because of heavy rain, and a 30–40% speed reduction caused by heavy snow ( 4 ).
According to the Fatality Analysis Reporting System, >5,800 fatal crashes between 2005 and 2014 occurred during adverse weather conditions. Previous studies have attempted to quantify the impact of weather conditions on car crashes; however, the results are not globally consistent ( 7 ). Based on a National Highway Traffic Safety Administration report, adverse weather conditions contributed to 15% of fatal, 19% of injury, and 23% of property-damage-only crashes ( 8 ). Other studies in Canada and the UK revealed that weather-related factors contributed to approximately 30 and 20% of crashes in those locations, respectively (9,10). Although the magnitude of impact of adverse conditions on weather-related crash risk estimates varies, the overall trend from these studies indicates a significant increase in crash risk during adverse weather conditions.
While the safety and operational effects of adverse weather on transportation networks have been extensively researched, specific considerations related to driver behavior and performance is noticeably absent from these studies. To address this gap, this research leverages trajectory-level vehicle data in adverse and clear weather conditions collected by the second Strategic Highway Research Program (SHRP2). SHRP2 created a comprehensive naturalistic driving study (NDS) database, which comprises data from >3,400 participants spanning a time period of 3 years (2010–2013). The advantage of using naturalistic driving data is that the data are not collected in a controlled environment, such as driving simulators, instrumented research vehicle tests, or self-reporting questionnaires; therefore, the collected data are more representative of natural driving and contain a wide variety of environmental and traffic conditions.
This study is intended to develop insights into driver preferences for speed, while correlating these preferences and behavior with environmental and traffic conditions that can be used to establish an effective variable speed limit (VSL) system. This research evaluates additional aspects of driver behavior and performance that can be used to develop effective countermeasures to reduce the impact of adverse weather on freeway operations.
Data Preparation
The SHRP2 safety data comprise two complementary databases: the NDS database and the Roadway Information Database (RID). As part of the SHRP2 NDS, >3,400 participants were recruited and their driving behavior was recorded continuously during their participation, which ranged from a few months to a couple of years. The RID contains inventory data related to the six NDS states (Florida, Indiana, New York, North Carolina, Pennsylvania, and Washington) and includes additional data on crash histories, traffic patterns, weather conditions, work zones, and ongoing safety campaigns. The NDS and RID can be linked to provide a rich data source associating driving behavior with roadway and environmental characteristics ( 11 ). The following sections describe the initial acquisition of SHRP2 NDS trips, the data reduction procedures established for efficient data processing, and the subset of data selected for the speed selection modeling presented in this paper.
Data Acquisition
Characteristics of weather conditions for each NDS trip are not readily known; therefore, the Wyoming research team identified three unique and complementary data acquisition methodologies to query the large NDS database and extract weather-related trips:
A representation of routes flagged in the spatial-temporal query for trips occurring within a 5 nautical mile radius of a weather station or weather-related crash is shown in Figure 1. In this image, the weather station is located directly off Interstate 275; however, trips traversing Interstate 75 could be flagged if they pass through the represented 5 nautical mile radius.
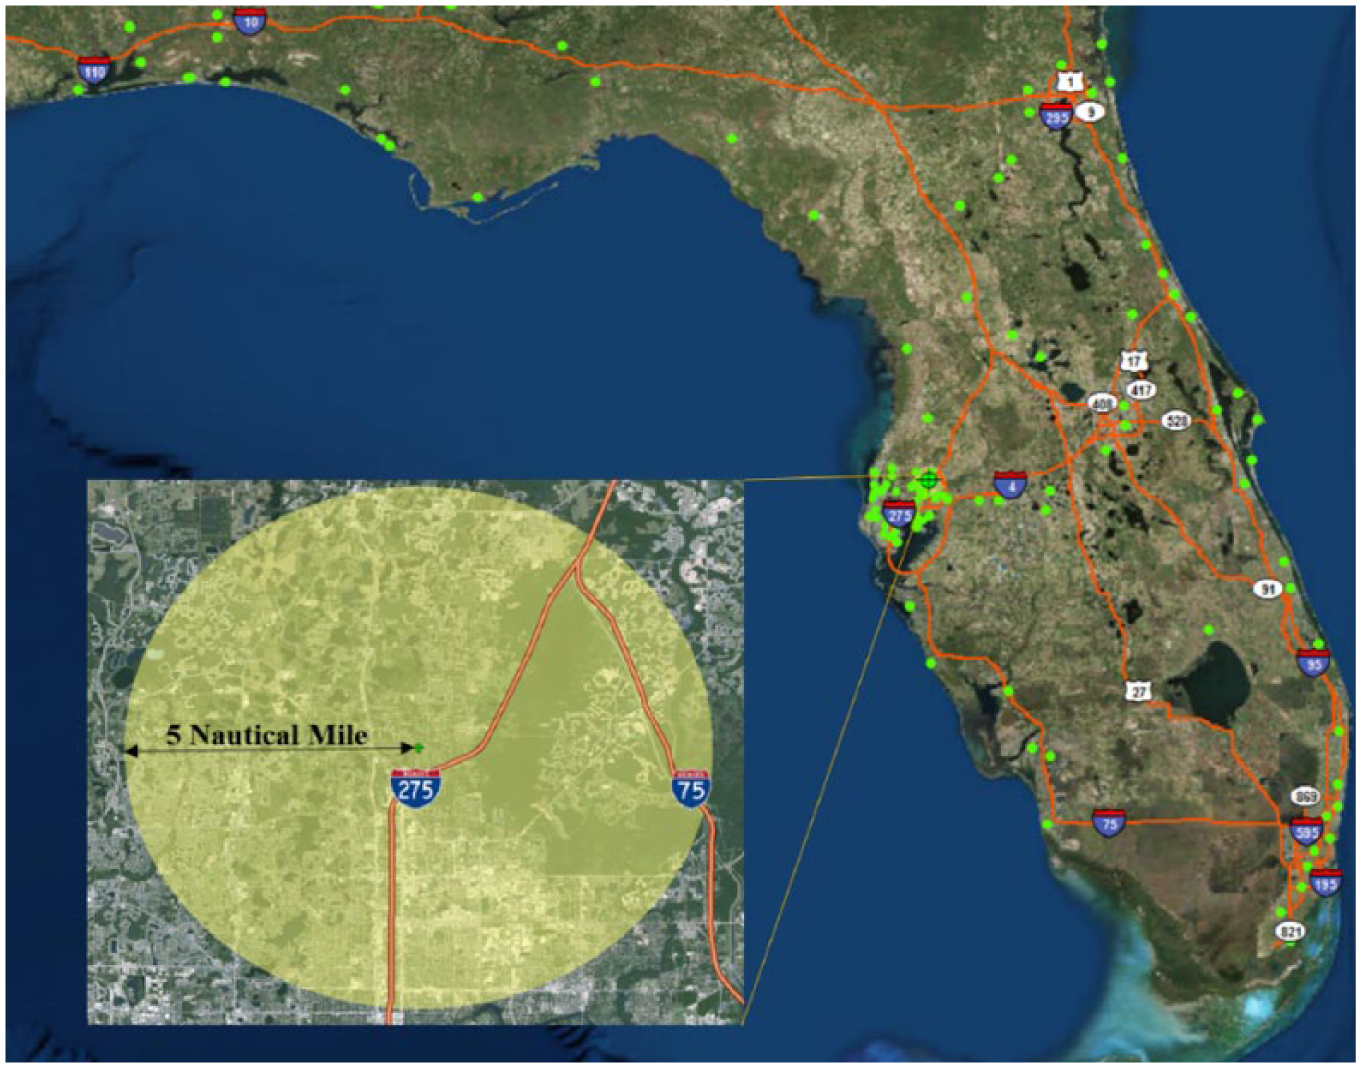
Location of weather stations in Florida and a 5 nautical mile coverage area for a sample weather station.
Using the three data acquisition methods, the research team received >33,000 trips, one-third potentially occurring in adverse weather conditions and the remaining representing matched trips (same driver, same vehicle, and same route) in clear conditions. The identified NDS trips involved 1,523 drivers between 16 years and 99 years of age, with the majority of the drivers in young age group: 16–29 years old. Gender representation was balanced in most age groups, with the exception of a slight overrepresentation of female drivers between 20 years and 24 years old. The total duration of the received trip data represents over 11,205 h of driving.
Data Reduction
Extensive manual video observation and preliminary processing was conducted to screen the received NDS trips and filter out trips flagged as “weather-related” but which actually occurred in clear weather or dry surface conditions. This preliminary screening process was required because the data acquisition query protocol included a wide temporal coverage of adverse weather events over an entire day, which allowed for the collection of trips that would not have been otherwise identified. Of the received trips, 4,094 (37%) freeway trips were verified to have adverse weather or road surface conditions.
The research team developed the Wyoming NDS Data Analysis Tool (DAT), which enables a semi-automatic process for reducing the time series and video data. The DAT reduces the dimensionality of the data by extracting relevant time series variables for the identification of driving behavior characteristics in inclement weather conditions. Next, each trip is reduced to 1-min segments of time series data to increase the usability during analyses and enable manual video observation. Manual video observation was required to verify the roadway type, weather conditions, surface conditions, visibility, and traffic conditions. The research team established discrete categories and options for each manually observed condition (e.g., traffic conditions were reported according to perceived level of service: A, B, C, D, E, F), and detailed descriptions and images were used to train video reviewers and limit bias in the observation. The video reviewers leveraged the benefits of Wyoming’s Visualization and Visibility Identification Tool for efficiently reporting conditions for each trip ( 12 ).
Trips Used in Speed Selection Study
In this study, a total of 212 trips in adverse weather conditions (22 trips in fog; 102 trips in rain; and 88 trips in snow—plus 424 matching clear weather trips) were randomly selected from the extensive Wyoming NDS database. The selected NDS trips involve 145 drivers between 16 years and 89 years old, with the majority of drivers in the young age group (16–29 years old). Gender was mainly balanced among age groups, except for a slight overrepresentation of female drivers between 20 and 24, which follows the same distribution that is reported by Virginia Tech Transportation Institute (VTTI) for all SHRP2 NDS trips.
A total of 14,923 1-min segments—equivalent to nearly 249 hours and 18,453 km (rain: 3,582 km; snow: 1,615 km; and fog: 954 km) of driving, plus their matching trips in clear weather conditions—were processed. The speed limit data provided in the RID was used to merge speed limits with each 1-min segment. Once non-freeway segments were removed, 10,606 1-min segments were used to model driver speed selection.
Methodology
To identify the impact of weather conditions on driver speed selection, two models using both parametric and non-parametric methods were developed. Parametric models, such as probit and logistic regression models, provide the relationship between a response variable and predictors. However, parametric models have some limitations—they cannot provide a high level of prediction accuracy because there are many embedded assumptions ( 13 ). Another complication in using parametric models is their inability to automatically handle missing values ( 14 ). These shortcomings cannot be addressed using common parametric models such as logistic and probit models (13,15). Despite their limitations, parametric logistic/probit models are effective in interpreting the marginal effects of various risk factors (16,17). On the other hand, there are several key advantages of using non-parametric models, including the ability to provide high prediction accuracy, handle missing values automatically, and process many explanatory variables in a timely manner—all of which might be extremely beneficial for assessing traffic operation and safety in real time with weather and traffic data directly ingested into the model ( 14 ). However, the trade-off is that their classification results cannot be explicitly interpreted ( 13 ).
In this study both ordinal logistic regression (parametric) and classification and regression tree (non-parametric) methods are used to analyze the impact of various factors (e.g., weather and roadway conditions) on speed selection.
Ordinal Logistic Regression
Logistic regression is a common model used in traffic safety and operation studies. Logistic regression allows the formulation of predictive models on a probabilistic basis. Similar to other regression analyses, it predicts the value of a dependent variable from one or more explanatory variable(s). Logistic regression can be applied to a binary, nominal, or ordinal dependent variable. Logistic regression (Equation 1) can also be utilized to rank the relative importance of the response variables (18,19).
Equation 1 shows a logistic regression model with x representing the independent variable and P(x) indicating the probability of success for a binary response variable y—considering explanatory variable x.
An ordinal logistic regression (ordered logit) model was applied for this analysis because of the ordinal nature of speed selection that would not be accounted for in multinomial analyses.
Classification and Regression Tree Model (CART)
Decision tree modeling can be used for both continuous and nominal dependent variables. Utilizing a decision tree to classify a nominal dependent variable is called a classification tree (20,21). Classification can be defined as a procedure for predicting the “class” of an object—considering the object’s features ( 22 ). Classification models are built from a training dataset in which trends of explanatory and response variables are identified and used to predict the value of the target variable for different datasets ( 23 ). The two main components of decision trees are the “root node” and the “leaf node.” The “root node” is the node located at the top of the tree, which contains all ingested data, and the “leaf node” refers to the termination node, which has the lowest impurity.
The root node is divided into two child nodes, based on the independent variable (splitter) that creates the best homogeneity. This procedure of partitioning the target variable recursively is repeated until all of the data in each node reach their highest homogeneity. At that point, tree growth stops, and the node(s) that do not have any branches become the “leaf node(s).” Each path from the top of the tree (root node) to the bottom/termination of the tree (leaf node) can be considered a rule. Following this sequence, the data in each child node are purer (more homogenous) than the data in the upper parent node ( 24 ).
To identify possible splits among all variables, a splitting criterion is generated. The splitting criterion is the main design component of a decision tree ( 25 ). In a decision tree learning algorithm, the splitting criterion’s role is to measure the quality of each possible split among all variables. Two common tests used to generate splitting criteria are: (1) chi-square and (2) Gini reduction. In this study, the Gini splitting criterion is used to select the variable and split pattern to best partition the node. Gini impurity indicates the data purity; in other words, it shows the probability of incorrect classification for a randomly chosen record from the specific node in the data subset.
Variable importance measure (VIM) is one of the main outputs of the classification tree model, showing the most important factors affecting the target variable ( 26 ). In this study, the most significant factors affecting driver speed selection—considering adverse weather conditions—were identified using the VIM.
Preliminary Analysis
A preliminary analysis was conducted to better understand the differences between driver speed behavior in clear and adverse weather conditions using the matched trips. The distribution and variation of speeds between clear and adverse weather were investigated in free-flow traffic conditions. Investigating the speed distribution in free-flow conditions is important for VSL applications, as the speed is not affected by the interaction with traffic.
Six possible scenarios were considered and compared as shown in Figure 2, including trips in snow, rain, fog, and their matched trips in clear weather conditions. The advantage of using this matching technique is that environmental, traffic, and roadway conditions are controlled as the weather-related trips are matched with trips in clear conditions that have the same driver, traversed the same route, and are in similar traffic conditions.

Observed and fitted distributions for speeds during adverse and clear weather under free-flow traffic. (a) Speed distribution in snow and (b) speed distribution in matched clear weather. (c) Speed distribution in rain and (d) speed distribution in matched clear weather. (e) Speed distribution in fog and (f) speed distribution in matched clear weather.
Results from the preliminary analysis revealed that free-flow speed followed a Weibull distribution in snow and normal distribution in rain and fog. A T-test revealed that the average speed in snow, rain, and fog was significantly lower than clear weather conditions; specifically, the average speed was found to be 18.35 km/h (snow), 6.17 km/h (rain), and 4.25 km/h (fog) lower than the correlated speed in clear conditions, indicating that drivers exhibit greater speed reduction in snow conditions than in rain and fog.
Modeling Speed Selection and Discussion of Key Factors
The ordered logit and classification tree models were calibrated using all reduced data; representing a dataset of 10,606 1-min segments of NDS trips occurring in various weather and traffic conditions (matching was not required for this analysis). The speed selection was considered as a dependent variable with four speed intervals. These intervals were selected based on the median of the speed selection above or below the speed limit. The four-quantile intervals were defined to be:
Speed reduction >14%,
Speed reduction between 0% and 14%,
Speed increase between 0% and 10%, and
Speed increase >10%.
These intervals were selected to establish equal sample sizes throughout each speed selection category because modeling with an unbalanced dataset may lead to a skewed distribution of predicted values and result in low model prediction accuracies ( 13 ). Moreover, it is practical for decision makers in the traffic management center to adjust the VSL based on the speed that a larger number of drivers are following, as opposed to using unrealistic speed, which may be illogical to many drivers.
Therefore, speed selection is the dependent variable for both models. The remaining explanatory variables consist of information extracted from questionnaires, including driver demographics (e.g., age, marital status, gender, and education), driver experience, roadway factors, environmental conditions, and traffic conditions. A full description of the variables used in the OLR and CART modeling procedures for driver percent speed selection in different weather conditions is shown in Table 1.
Description of Variables

Ordinal Logistic Model
To confirm the suitability and fitness of the model, the log likelihood ratio was used. The multi-collinearity was assessed by calculating the variance inflation factor (VIF) for each explanatory variable, which indicates how much the variance of an estimated regression coefficient increases if the predictors are correlated. A VIF between 5 and 10 shows high correlation between predictors, and a VIF >10 indicates that the regression coefficients are poorly estimated because of multi-collinearity ( 27 ). The explanatory variables introduced to the model produced VIF values between 1.03 and 1.40, excluding any concerning multi-collinearity. Only statistically significant variables were retained in the final model.
Table 2 provides the results of the Ordered Logit Model. Adverse weather conditions (snow, rain, and fog) were found to have a significant effect on speed selection, indicating that drivers exhibit a greater speed reduction during adverse weather conditions. In addition, this finding shows the negative effect of adverse weather conditions on drivers’ performance. Specifically, results show that the odds of drivers reducing their speed were 9.29, 1.55, and 1.29 times higher for drivers traveling in snow, rain, and fog conditions, respectively, in comparison with drivers who were driving in clear weather conditions.
Estimation of Ordered Logit Model for Speed Selection in Different Weather Conditions

Findings related to visibility indicate that drivers are more likely to reduce their speed when their visibility is impaired. This finding correlates with findings from previous studies that show visibility is one of the most important factors affecting driver speed (6,28). The derived model indicates that the odds of a driver reducing their speed were 1.75 times greater in adverse visibility conditions, compared with good visibility conditions.
As expected, traffic conditions had a significant negative effect on speed selection. The odds of a driver experiencing speed reduction were 3.6 times greater for drivers who were driving in higher traffic density compared with those traveling in free-flow conditions (level of service A and B). This finding is in agreement with previous studies (29,30). Further consideration of driver demographics (i.e., gender) indicated that female drivers were 1.09 times more likely to reduce their speed than their male counterparts.
An analysis of driver demographic information, using the developed speed selection model, reveals that drivers older than 40 years old were 1.23 times more likely to reduce their speed in comparison with younger drivers. In addition, when considering miles traveled in the previous year as an indicator for driver experience, it was determined to be a significant factor in the developed speed selection model. The results indicated that drivers who drove >10,000 miles in the previous year were less likely to reduce their speed in comparison with drivers who drove <10,000 miles.
Classification Tree Model
Three data subsets were considered in developing the classification tree model (i.e., training, validation, and testing datasets). Moreover, 60% of the data was allocated to the training dataset, 30% to the validation, and 10% to the testing datasets. More specifically, among the 10,606 observations used for developing the classification tree model, 6,363 observations were assigned to the training subset, 3,181 to the validation subset and 1,060 observations to the testing subset. Figure 3 shows the decision tree diagram for drivers’ speed selection in different weather conditions produced from the training dataset. In each node box, the node number and the percentage of data in each category are provided. One beneficial characteristic of a decision tree, compared with other modeling methods, is that it gives decision makers rules to address “if-then” questions efficiently.

Classification tree diagram for speed selection model.
The misclassification rate, based on the training and validation datasets, indicated that the best tree could be obtained with 15 terminal nodes. In other words, with 15 terminal nodes, the misclassification rate for the model reaches a minimum value of 0.42 and remains fairly steady with the increases of nodes beyond 15. Node 3, on the right side, shows the data related to driving in snowy conditions. On the right branch of the tree, there are four terminal nodes (nodes 7, 13, 24, and 25). In three of these terminal nodes, the drivers were predicted to reduce their speed by >14% (Class Label 1), which implies that if a driver is traveling in snowy conditions, he/she is more likely reduce their speed, regardless of other factors.
As a function of traffic conditions, node 3 is split into node 6 and terminal node 7; terminal node 7 shows that when a driver travels in any level of traffic congestion (not in free-flow conditions) with snow-covered road surface conditions, there is an 86% probability that the driver will reduce their speed by >14%. Node 6 is further split into node 12 and terminal node 13 based on visibility conditions. Node 13 shows that 56% of drivers are likely to reduce their speed by >14% in snowy surface conditions, free-flow traffic, and reduced visibility. Node 12 is split into node 24 and 25, based on driver mileage (from the previous year). Lastly, node 24 shows that if a driver drove <10,000 miles last year, they were 59% more likely to reduce their speed >14%—indicating that less experienced drivers are more likely to reduce their speed in the aforementioned weather, traffic, and visibility conditions. The other rules in the developed classification tree model can be interpreted in the same manner.
Table 3 provides the relative variable importance, which is one of the most important classification tree outputs.
Relative Importance of Variables
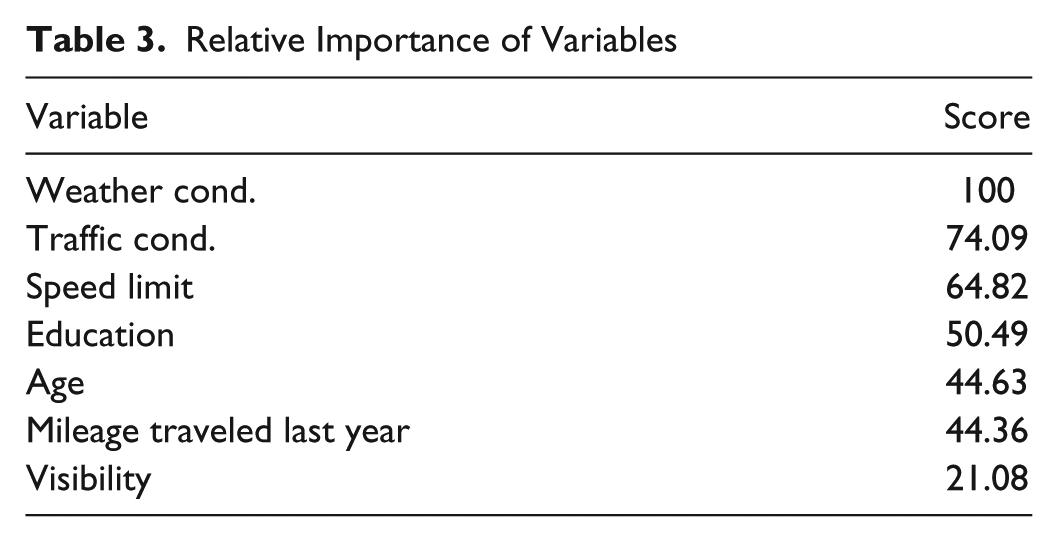
As can be seen in Table 3, weather conditions turned out to be the most important variable affecting driver speed selection based on the developed classification tree model. This finding is consistent with the previous study demonstrating the effect of weather conditions on driver speed selection ( 30 ). Traffic conditions were the second most important variable affecting driver speed selection, followed by posted speed limit, education level, age, mileage traveled last year, and the visibility conditions.
Model Efficiency
The area under the Receiver Operating Characteristic (ROC) curve is used to compare the two developed models. The ROC value can be between 0.5 (for a poorly fitted model) and 1.0 (for a perfectly fitted model) ( 31 ). The ROC indices for both developed models are significantly >0.5 (ROC Indexes were 0.773 and 0.770 for the classification tree and OLR respectively); therefore, results indicate that both models can assess driver speed selection behavior well, with the classification tree slightly outperforming the OLR model.
Conclusions
Multiple data sources—including the SHRP2 NDS, SHRP2 RID, and NCDC—were used in three complementary methodologies to identify weather-related trips from the SHRP2 NDS database. The Wyoming NDS DAT was used by the research team to efficiently process the trip data into homogeneous 1-min segments of data with known weather, traffic, and roadway conditions. The processed data were used as input into speed selection models generated in this study.
Both parametric logistic regression and non-parametric classification tree models were developed to better understand driver speed selection in different weather conditions, that is, snow, rain, and fog. Each modeling technique has its advantages and disadvantages. Although the classification tree model can easily explain the complex interactions between several explanatory variables, it is difficult to fully describe the complicated effects of contributing factors owing to non-linearity and the interaction effects in the logistic regression ( 13 ). On the other hand, using parametric logistic regression is beneficial in interpreting the marginal effect of risk factors. Therefore, it is justified to use both models to take the advantage of the benefits and compensate for the shortcomings of each method. Combined, the use of parametric and non-parametric speed selection models provides a deeper understanding of speed selection behavior in adverse weather conditions. The focus of this paper was not to show that one model is superior to the other one; it attempts instead to show how the two proposed complementary parametric and non-parametric approaches can help researchers provide better insights into the factors that impact speed selection in adverse weather conditions.
The speed selection models revealed that among various adverse weather conditions, drivers are more likely to reduce their speed in snowy weather conditions. Specifically, the odds of drivers reducing their speed were 9.29 times higher in snowy weather conditions, followed by rain and fog with 1.55 and 1.29 times, respectively (compared with clear conditions). In addition, variable importance analysis using the classification tree method revealed that weather conditions, traffic conditions, and the posted speed limit are the three most important variables affecting driver speed selection behavior.
Selecting the appropriate driving speed for prevailing conditions is considered one of the most important driving tasks on high-speed facilities. Because of the previously limited understanding of the interaction between driver behavior/performance and weather conditions, the continuation of this research aims to establish a Connected Human-in-the-Loop VSL system, which is aligned with the SHRP2 Task Force’s focus areas. An important component of the driver–weather interaction is the characterization of traffic flow, because heterogeneity in driver behavior exists between adverse weather conditions and traffic flow conditions, meaning that driving behavior is different for different levels of congestion and weather conditions. Modeling variation in driver behavior with adverse weather conditions and traffic flow states is crucial to assigning effective VSLs, as these algorithms must consider the impact of both weather and traffic conditions when suggesting the safest and most efficient speed.
An additional benefit from these developed models may be introduced in connected vehicle applications, where the VSL system could be expanded to incorporate mobile vehicle data as an input and to export VSL data to on-board units (OBUs). The OBUs could then provide speed advisories, regulatory speeds, or other related advisories to the driver. Messages, such as “turn off cruise control,” could be sent in real time to more effectively regulate driving speed and preserve a safe flow of traffic. If unusual traffic patterns are detected or inclement weather events are forecasted or experienced, these geospatial locations could be flagged for implementation of an appropriate and timely mitigation strategy to reduce the impact of the adverse weather condition.
Footnotes
Acknowledgements
This work was conducted under the second Strategic Highway Research Program (SHRP2), which is administrated by the Transportation Research Board (TRB) of the National Academies of Sciences, Engineering, and Medicine, and it was sponsored by the Federal Highway Administration (FHWA) in cooperation with American Association of State Highway and Transportation Officials (AASHTO).
The Standing Committee on Surface Transportation Weather (AH010) peer-reviewed this paper (18-01096).