
Abstract
The free-floating bike-sharing system (FFBS) is an innovative public bicycle service, which is widely popular throughout China. In comparison to traditional station-based system, FFBS allows cyclists to park the bicycles in any non-motorized parking area so that the convenience can be improved greatly. Moreover, smart devices inside the free-floating bicycle can provide real-time tracking information which offers convenience for intelligent management. This study adopts the structural equation model to measure what factors influence people’s willingness to use the system and how the indicators inside the system interact with each other. Unlike the long-standing use of maximum likelihood estimation method, an approach of partial least squares estimation is used in this paper to remove the restriction of multivariate normal distribution. Based on the questionnaire carried out in 32 locations in Shanghai, a conceptual framework cyclist satisfaction index model is established, which includes three levels with 50 indicators. Then, to analyze the different perception among different kinds of cyclists, the study divides them into two groups: commuters and non-commuters. The parameter calibration for commuters and non-commuters are calculated separately. Finally, by virtue of importance-performance analysis (IPA) matrices, the problems in the existing service system are identified. The results demonstrate five aspects including riding environment, riding safety, government intervention, laws and staff service need urgent improvement. According to these findings, innovative countermeasures such as monitoring platform and electronic fences are under construction to prompt the use of FFBS.
The bike-sharing system originated in the Netherlands and was put into practice worldwide for its advantages such as convenience, flexibility and low carbon emission ( 1 ). However, traditional systems have a major drawback: that is, cyclists must rent and return bicycles in fixed rental stations which reduces the efficiency of the system. As a result, in 2014, the first FFBS company, OFO, was established in China. This innovative way of bicycle use avoids construction of expensive docking stations and kiosk machines. In addition, FFBS can truly realize the seamless connection between public transit and the bike-sharing system because people can park the bicycles in any non-motor vehicle parking area rather than waste time finding docking stations which may be far from rail transit stations or bus stops. As a result, FFBS rapidly gained popularity in China and soon reached a massive scale. Now, nearly forty cities in the country have rolled out FFBS, with twenty million users.
Introduction of the FFBS in the City of Shanghai
There are more than 12 FFBS companies who have launched over 1 million free-floating bicycles in Shanghai city. Two of the biggest enterprises are OFO and Mobike. Smart locks are installed inside the free-floating bicycles and cyclists scan the QR codes on the bicycles with their mobile phones so that the locks will open automatically. The rent fare is charged by the hour but frequent preferential benefits can help to reduce the price. Users pay a deposit before joining the system.
Research Motivation and Objectives
Despite the popularity of FFBS, users’ feedback and their degree of satisfaction have not been analyzed in detail. As a result, the main objectives of this study are the following:
It analyzes the relationship between cyclist satisfaction, perceived quality, cyclist loyalty and complaints, and users’ socioeconomic and current usage characteristics by the model’s path coefficients.
It discusses the weights of indicators according to the loading coefficients of their corresponding latent variables. Then, the factors which influence the latent variables the most can be identified.
It allows a comparison to be made between commuters and non-commuters with regard to their different perceptions of the service quality.
The findings of this study can help to identify FFBS operation and management strategies in order to retain and attract people to use the system.
Literature Review
The degree of customer satisfaction is a key influence on the profits of companies. Many researchers have developed customer satisfaction theories and methodologies. Cronin and Taylor ( 3 ) analyzed the relationship between customer satisfaction, service quality and purchase intentions in several kinds of service industries. They found that service quality was an antecedent of customer satisfaction and customer satisfaction had a significant effect on purchasing power. Boulding et al. ( 4 ) showed that there’s a strong connection between customer satisfaction and loyalty. Based on prior studies, Eugene et al. ( 5 ) came up with a customer satisfaction index (CSI) based on their findings from Swedish firms. In 1996, Fornell further improved the CSI model, taking into consideration six variables, customer expectations, perceived quality, perceived value, overall customer satisfaction, customer complaints and customer loyalty, and renamed it the American customer satisfaction index (ACSI) ( 6 ). In the ACSI model, perceived quality and customer expectations are regarded as incentives, and customer complaints and customer loyalty are two outcomes of overall customer satisfaction.
After the conceptual framework was established, a lot of research focused on measuring customer satisfaction by quantitative methods, including the analytic hierarchy process (AHP), grey relational analysis and the structural equation model (SEM). In regard to AHP, Li et al. ( 7 ) proposed a customer satisfaction evaluation method for customized product development. They determined criteria weights through integrating entropy weight and the AHP method. Lan et al. ( 8 ) introduced a model using the triangular fuzzy concept to determine the weight of each index. A case study from two large express companies was used to demonstrate the feasibility and practicality of the proposed model for examining customer satisfaction. As for the method of grey relational analysis, Perng et al. ( 9 ) adopted modified grey relational analysis to establish the priority relations of product categories for shopping purposes and satisfaction. Martinez et al. ( 10 ) used the grey relational analysis to gauge the levels of service satisfaction of the banks and compared the effects of different variables on service satisfaction. However, these two approaches are both devoted to calculating the weights of variables from a subjective perspective. When there are many indicators, optimal values and judgment matrix are difficult to estimate.
As a result, SEM becomes more and more popular because it can increase the validity of a coefficient by reducing measurement error (11, 12). As an extension of the traditional regression model, SEM combines path estimation, factor analysis and regression analysis ( 13 ). Most importantly, SEM can deal with several dependent variables and analyze the relationship between each two factors. As the assessment of customer satisfaction can be complex, with some variables being both dependent and independent, SEM can be used to examine a network of interrelated variables with direct or indirect connections. SEM takes several manifest variables as the indicators of certain latent variables whose influences cannot be measured directly (14, 15). So the model consists of two parts: the measurement model which explains the relationship between manifest variables and latent variables, and the structural model which presents the relationship between latent variables.
In the field of transportation, close attention has been paid to public transit passengers’ satisfaction in recent years. The user satisfaction of a public transport system is defined as the overall level of attainment of a customer’s expectation, measured as the percentage of the expectations actually fulfilled ( 16 ). Realizing what elements and to what degree they influence people’s feeling of taking public transit would help improve the systems, thus attracting more passengers ( 17 ). The most commonly used method in the literature is SEM (18–25). For instance, DeFrancisco et al. ( 23 ) tried to find out the association between passengers’ current travel attitude, demographics and their attitudes toward the current system. Shaaban et al. (24) presented a SEM to show that three key factors—namely, service at bus stops, bus service, and service of bus drivers—were strongly correlated to the mode of choice. However, the parameter estimation method of SEM in previous papers is mainly based on maximum likelihood (ML). ML estimation relies on the hypothesis that observed data obey multivariate normal distribution which is not easy to meet in reality ( 26 ). Moreover, it would lead to unreliable results when observed variables are not continuous or the sample is not big enough ( 27 ). Partial least square (PLS) can solve ML estimation drawbacks and allow ordinal discrete variables to be put into the model. Also, the sample size can be smaller than 500 using PLS estimation ( 28 ). Shen et al. ( 25 ) first compared PLS and ML estimation in the case study of Suzhou urban rail transit and found that the PLS model provided more reasonable parameters. Nonetheless, Shen still followed Fornell’s original framework. As a result, passengers’ demographics and travel characteristics were not included in Shen’s model. Meanwhile, most studies based on the SEM method often treated passengers as a whole group and did not have an insight into the influence of passengers with different usage patterns.
Given this background, using the PLS estimation method this paper aims to measure the degree of satisfaction of cyclists. Cyclists’ current usage characteristics and demographics are also included in the model, thus depicting a more comprehensive structure compared to previous studies. Additionally, the models of commuters and non-commuters are calibrated separately so that the perception difference between these two groups of people can be determined.
Methodology
Data Preparation
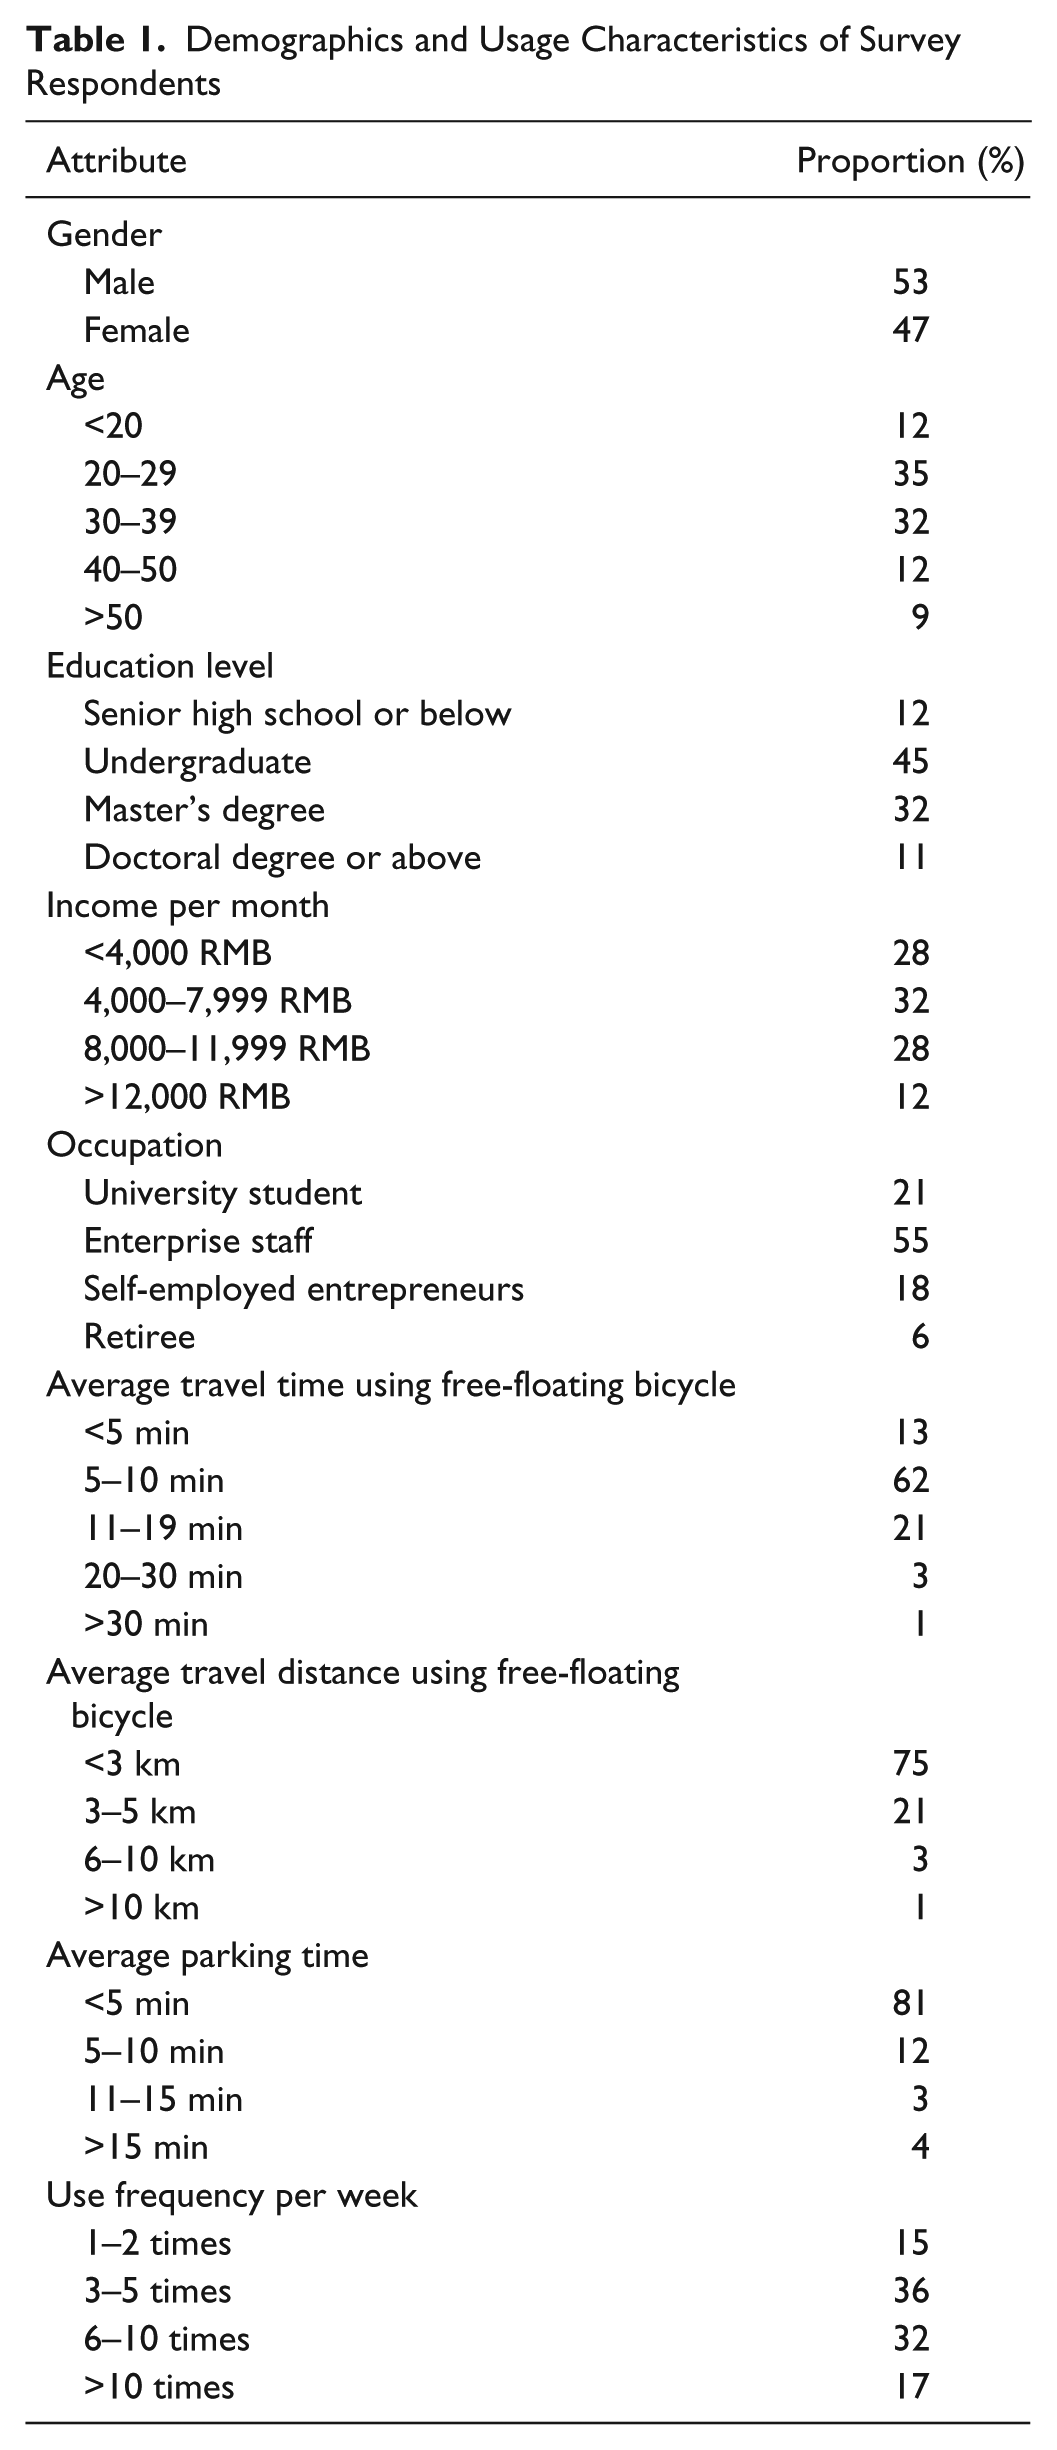
Before the formal survey, a preliminary list of indicators were developed which were meant to be put in the questionnaire according to respondents’ ideas during pre-survey. Then twenty experienced managers from traffic departments, free-floating bike-sharing enterprises and residential communities were interviews. Managers graded each of the indicators (5 class marking system) according to necessity and importance from their point of view. Some indicators were removed and some were combined based on the managers’ opinions. A questionnaire was conducted from May 15, 2017 to June 30, 2017. There were 32 survey sites, which comprised 12 main rail transit stations, 8 large residential areas, 7 large companies and 5 university campuses. Therefore, the respondents were restricted to university students, enterprise staff, self-employed entrepreneurs and retirees. Of the 800 questionnaires sent out, 768 were returned. The final available sample size was 724. Travelers who had used free-floating bicycles were defined as respondents and asked to fill in questionnaires. The questionnaire contained four parts: (a) demographics: gender, age, occupation, educational level, income per month; (b) current usage characteristics: average travel time, average travel distance, average parking time and usage frequency per week; (c) respondents’ degree of satisfaction with 11 aspects of FFBS, comprising cleanliness of bicycle, convenience of bicycle usage, riding environment, riding safety, accessibility, charging standard, laws and regulations, staff service, parking conditions, information distribution, and government intervention; (d) respondents’ satisfaction, loyalty and complaints about FFBS. Most questions were rated on a 5-point scale with 1 denoting “strongly dissatisfied” and 5 denoting “strongly satisfied,” except for questions related to individual information which were rated according to the classification presented in Table 1. Taking income as an example, it is a 4-point scale question with 1 denoting “<4,000 RMB” and 4 denoting “>12,000 RMB.”
Demographics and Usage Characteristics of Survey Respondents
Descriptive Analysis
According to the statistical data obtained from the survey, some traits of FFBS users can be summarized (Table 1). People who are under the age of 40 account for 67% of the users among the respondents. People 40 years of age or older may not choose to use this system because of not having mobile phones or having a physical restriction. Income levels of the respondents showed that 40% earn more than 8,000 RMB when the average monthly income in Shanghai is about 6,500 RMB ( 29 ). Additionally, most of them (88%) have a bachelor’s degree or above. It indicates that people with a good education background tend to have higher acceptance of FFBS. A significant portion of cyclists (39%) use free-floating bicycles more than six times a week, but the average travel distance per time is within 3 km (75%).
When it comes to occupation, 55% of people surveyed are enterprise staff who work fixed hours and need to commute during peak hours every work day. The rest of respondents, who are university students (21%) or self-employed entrepreneurs (18%) do not have fixed working hours, so their trip schedules are more flexible. As for retirees, who only account for 6% of respondents, they usually travel for shopping, visiting relatives or some other recreation purpose. As a result, enterprise staff are defined as commuters with the others as non-commuters. Liu et al. ( 30 ) claimed that commuters and non-commuters have perception differences toward the external environment. In this paper, a comparison between commuters and non-commuters of their perception of service quality and degree of satisfaction with the FFBS is performed.
Model Construction
As shown in Figure 1, the CSI model has three levels. The first level describes the relationship between demographics, current usage characteristics, perceived quality, cyclist satisfaction, loyalty and complaints. Cronin et al. ( 31 ) found that there is a positive correlation between service quality and satisfaction. At the same time, satisfaction is regarded as the overall affective response to a perceived discrepancy between prior expectations and perceived performance after consumption ( 32 ). The association between satisfaction, loyalty and complaints is well documented by the literature (33–35). Therefore, four hypotheses, H1–H4, are described as follows:
H1: Perceived quality positively influences cyclist satisfaction
H2: Cyclist satisfaction positively influences cyclist loyalty
H3: Cyclist complaints negatively influence cyclist loyalty
H4: Cyclist satisfaction negatively influences cyclist complaints
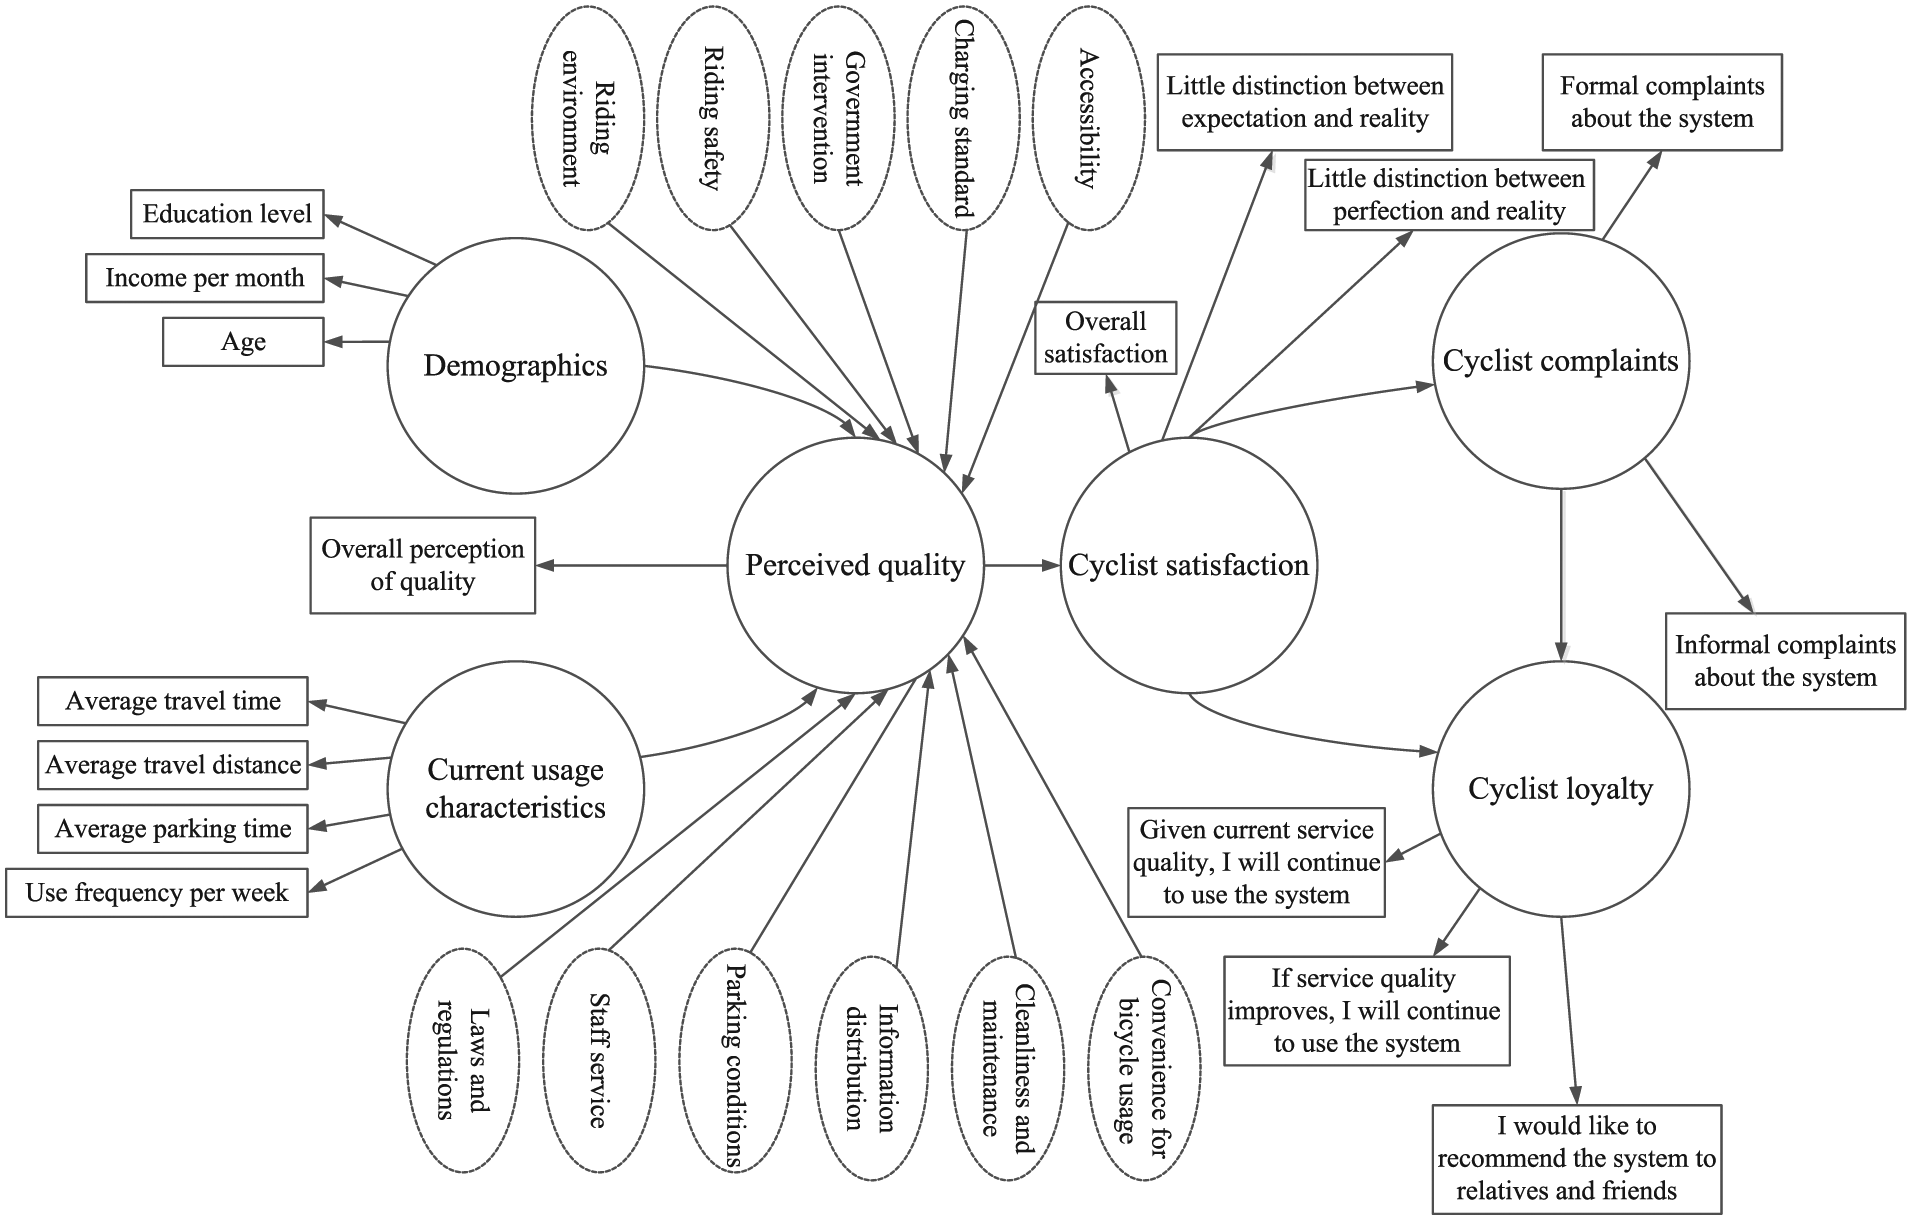
Conceptual framework of the CSI model for FFBS.
DeFrancisco et al. ( 23 ) mentioned that users’ demographics such as annual income, age and car ownership affected their attitude toward carpooling. Deutsch et al. ( 36 ) pointed out that demographics play an important role in understanding people’s interaction with their surroundings. Similarly, in this case, cyclists’ socioeconomic characteristics and their current usage status can be treated as two elements which influence perceived quality. Therefore, H5 and H6 are presented as follows:
H5: Demographics positively influence perceived quality
H6: Current usage characteristics positively influence perceived quality
The second level of the model is the relationship between perceived quality and 11 latent variables which are subject to it. Based on previous literature, the selection of attributes differed from person to person. For example, Eboli and Mazzulla ( 37 ) referred to 11 dimensions including cleanliness, comfort, information, safety and so forth. Liou et al. ( 38 ) included convenience, driver attitude, equipment and reliability when evaluating bus drivers’ service quality. In this study, subordinate latent variables were chosen partly based on our literature review. At the same time, the traits of FFBS which are different from other transportation systems were extracted. They are cleanliness and maintenance, convenience of bicycle usage, riding environment, riding safety, accessibility, charging standard, laws and regulations, staff service, parking conditions, information distribution, and government intervention. The hypotheses H7–H17 are presented as follows:
H7: Cleanliness and maintenance positively influence perceived quality
H8: Convenience of bicycle usage positively influences quality
H9: Riding environment positively influences perceived quality
H10: Riding safety positively influences perceived quality
H11: Accessibility positively influences perceived quality
H12: Charging standard positively influences perceived quality
H13: Laws and regulations positively influence perceived quality
H14: Staff service positively influences perceived quality
H15: Parking conditions positively influence perceived quality
H16: Information distribution positively influences perceived quality
H17: Government intervention positively influences perceived quality
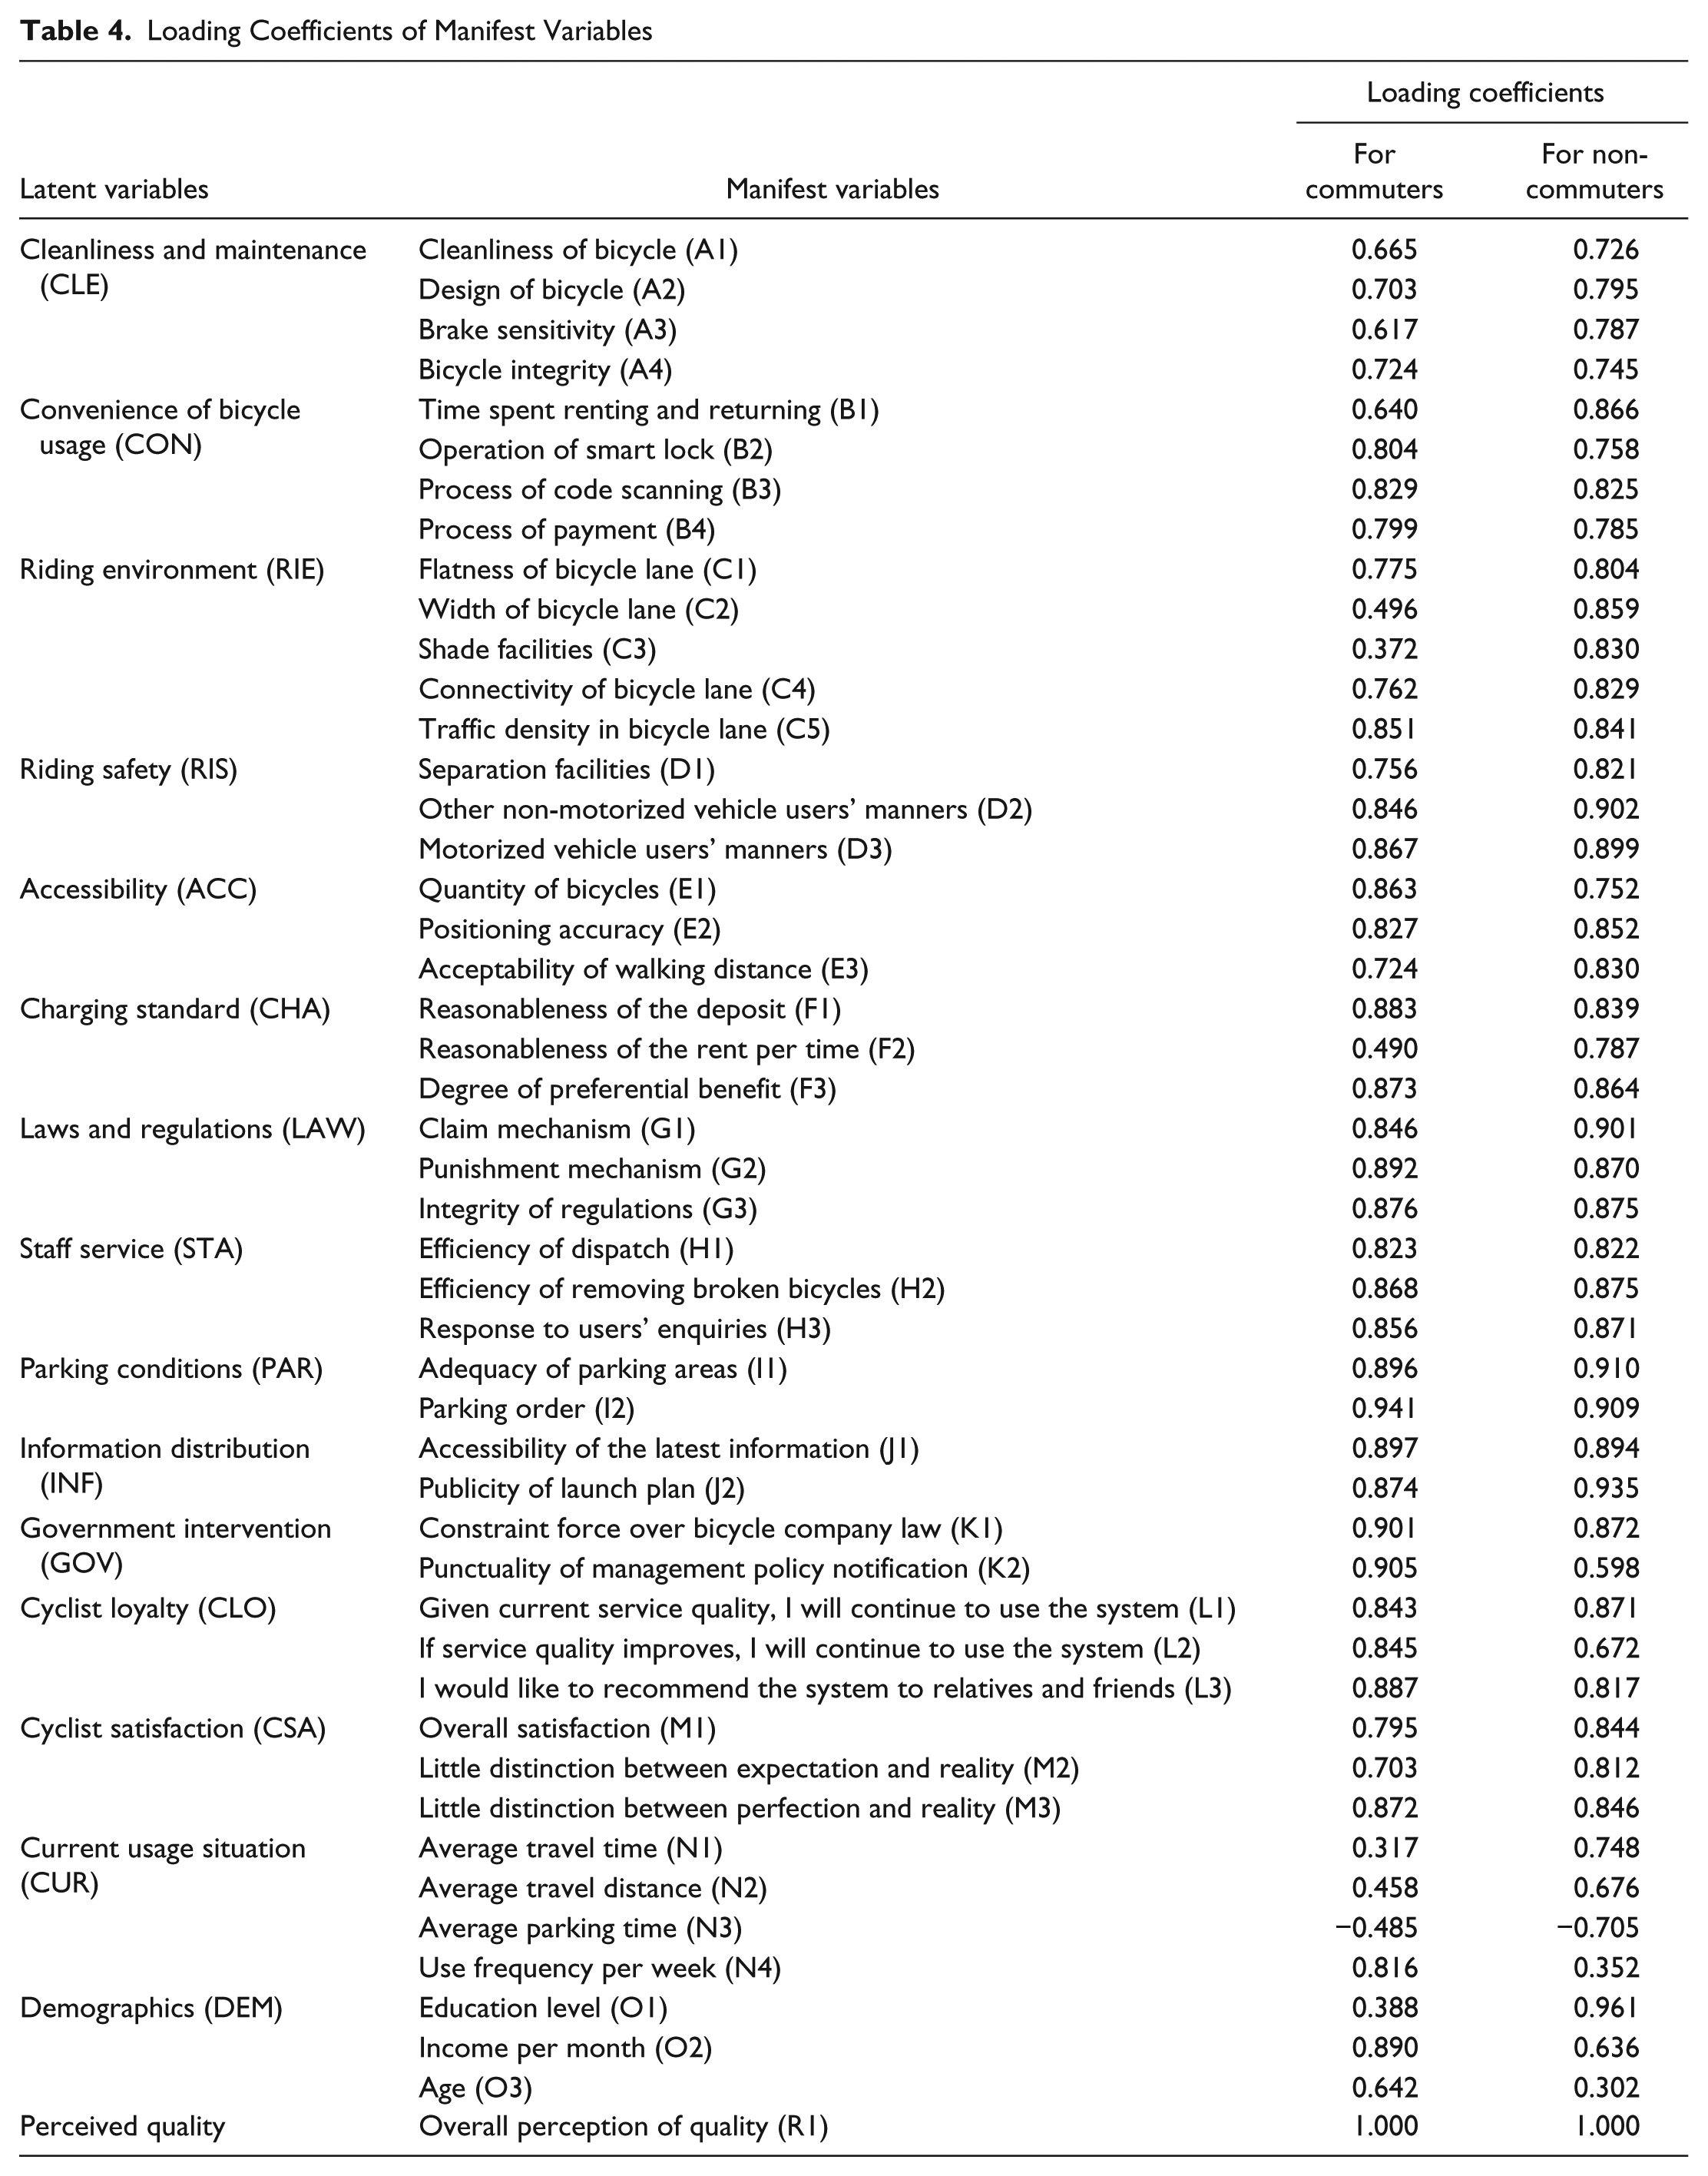
Lastly, the association between the latent variables and their manifest variables are defined as the third level of the model. There are 50 manifest variables considered in this research. These variables are attached to different latent variables. For example, formal complaints about the system (P1) and informal complains about the system (P2) both belong to the latent variable cyclist complaints (CCO). Others abbreviations and their corresponding manifest variables are shown in Table 4.
The structural part of the model can be calculated as follows:
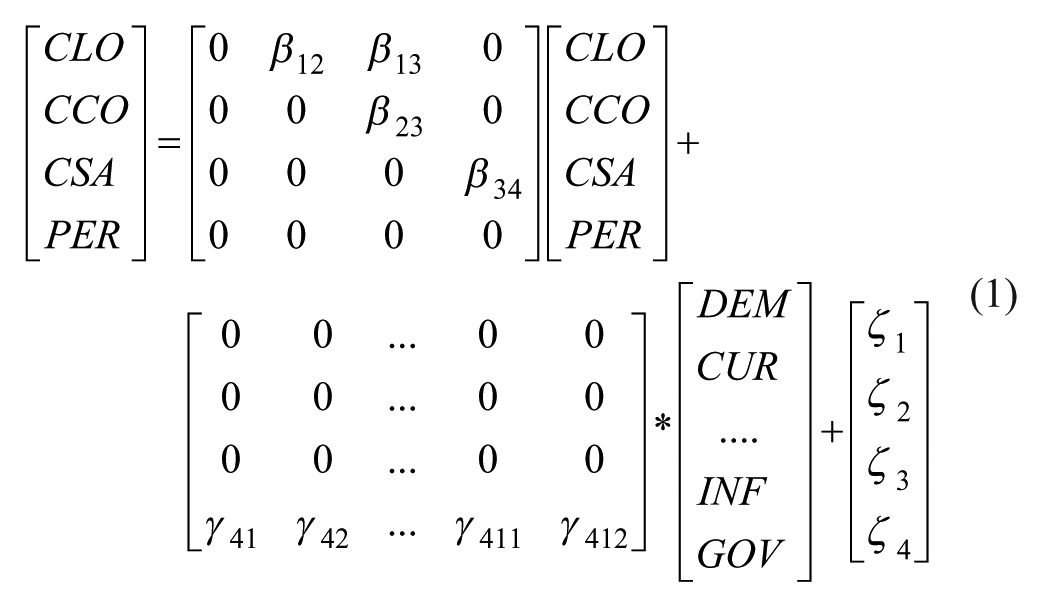
where
The measurement part of the model can be estimated as follows:
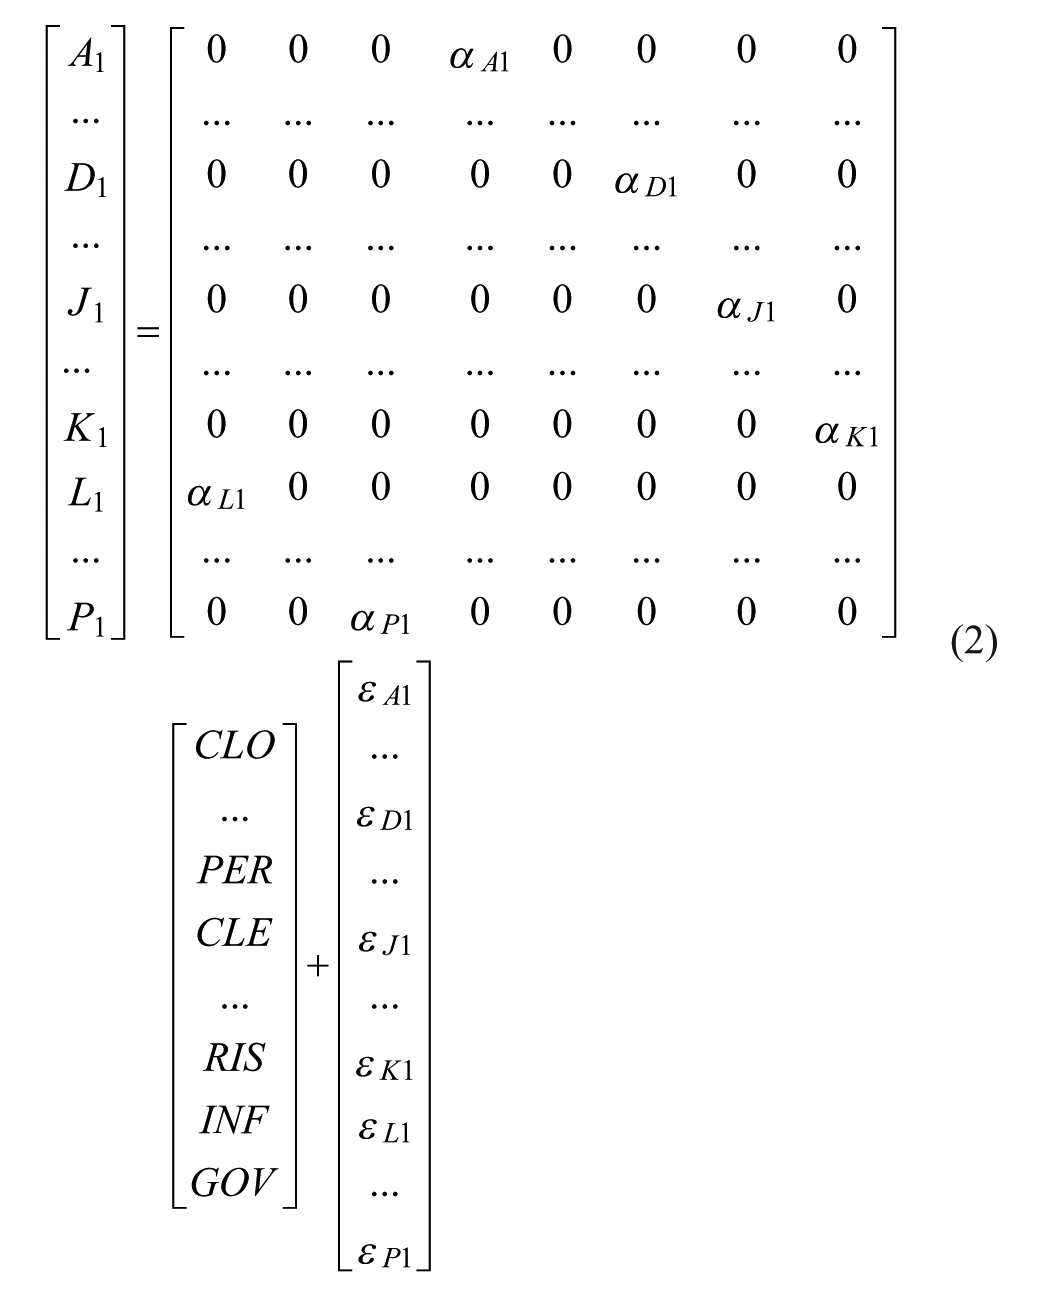
where
Validity and Reliability Test
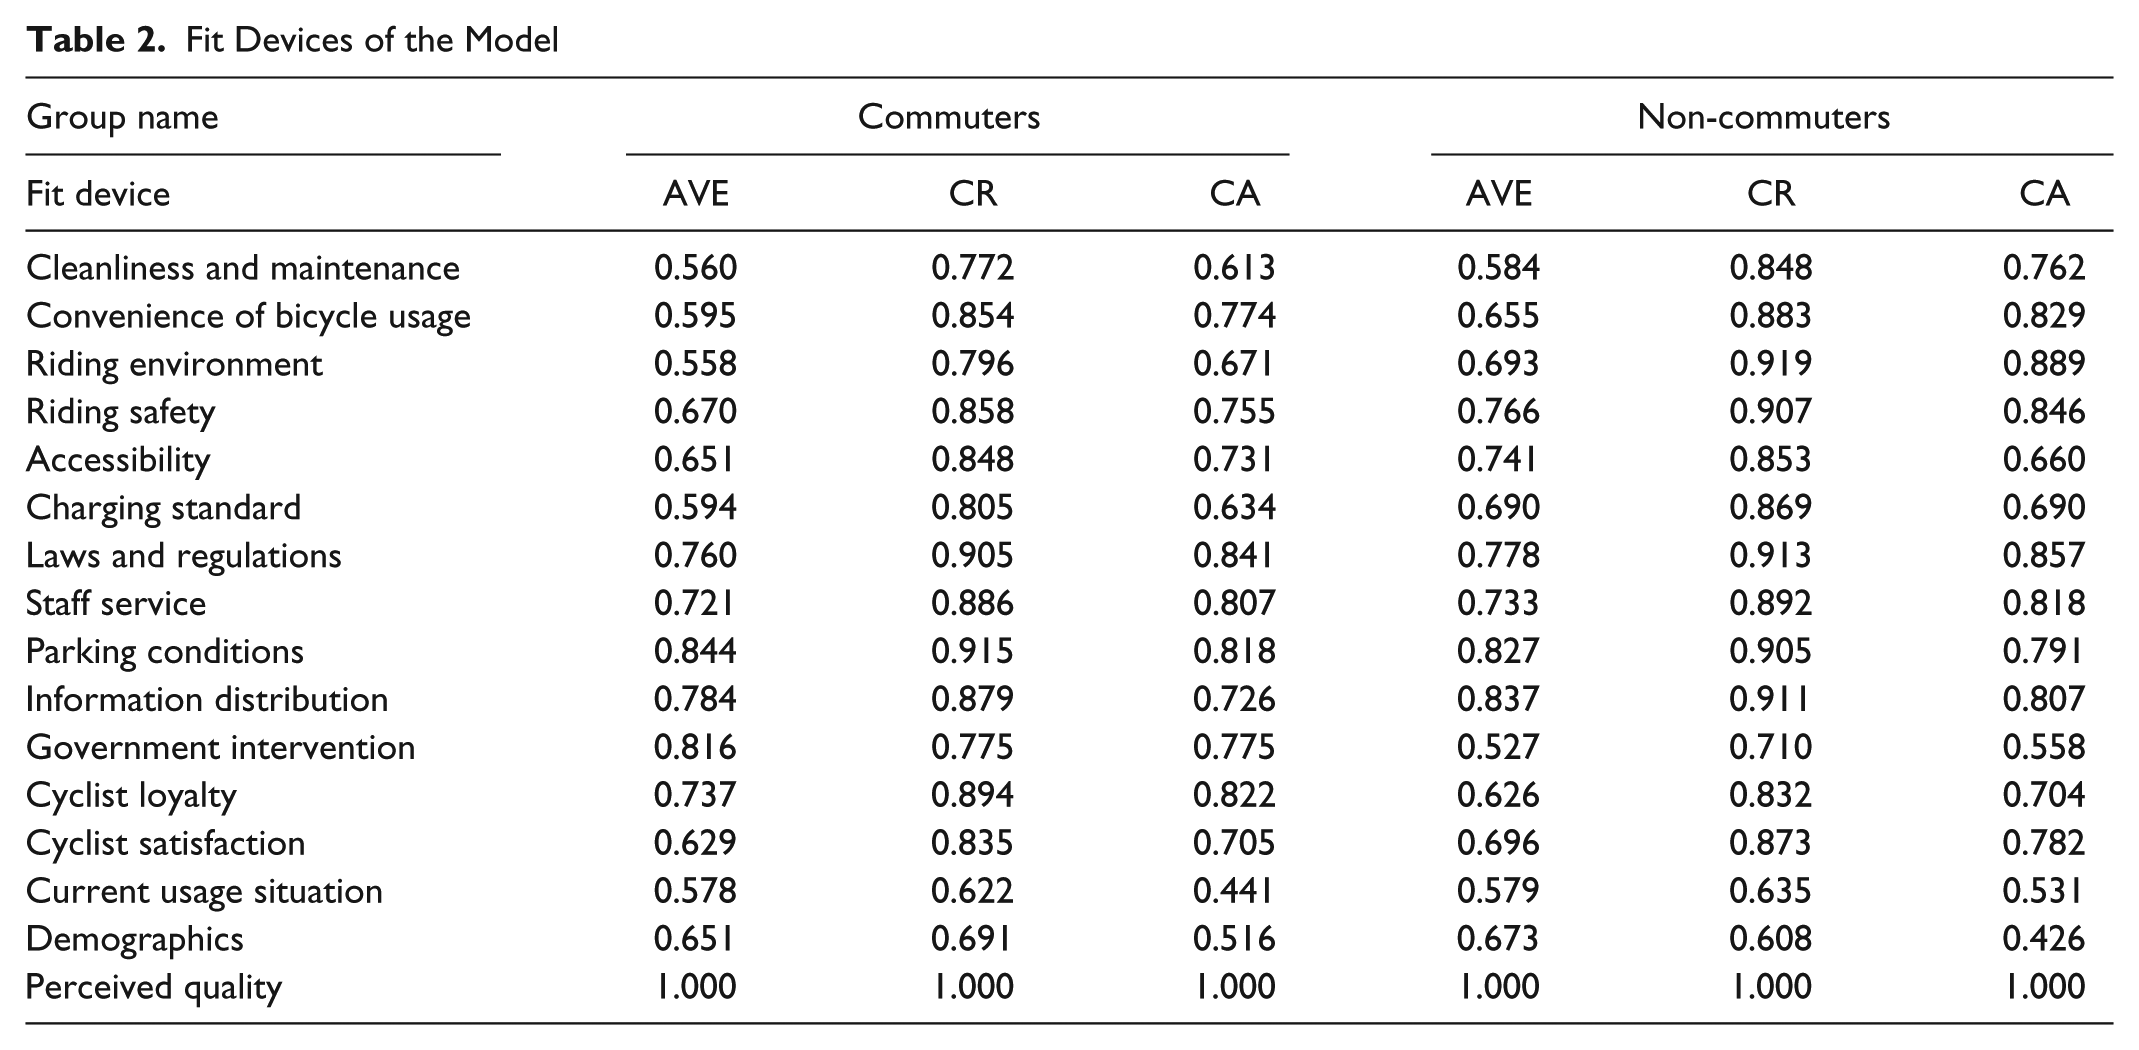
The calibration of the CSI model is based on the software SmartPLS3.0. Fit devices are adopted to examine the appropriateness of the model. Cronbach’s Alpha (CA) is a widely used index to measure how well the manifest variables explain their corresponding latent variables. Generally, when CA is greater than 0.35, the model is considered to be acceptable ( 39 ). Composite reliability (CR) and average variance extracted (AVE) are also two vital indexes. CR is required to be greater than 0.6 and AVE should be over 0.5 (27, 40).
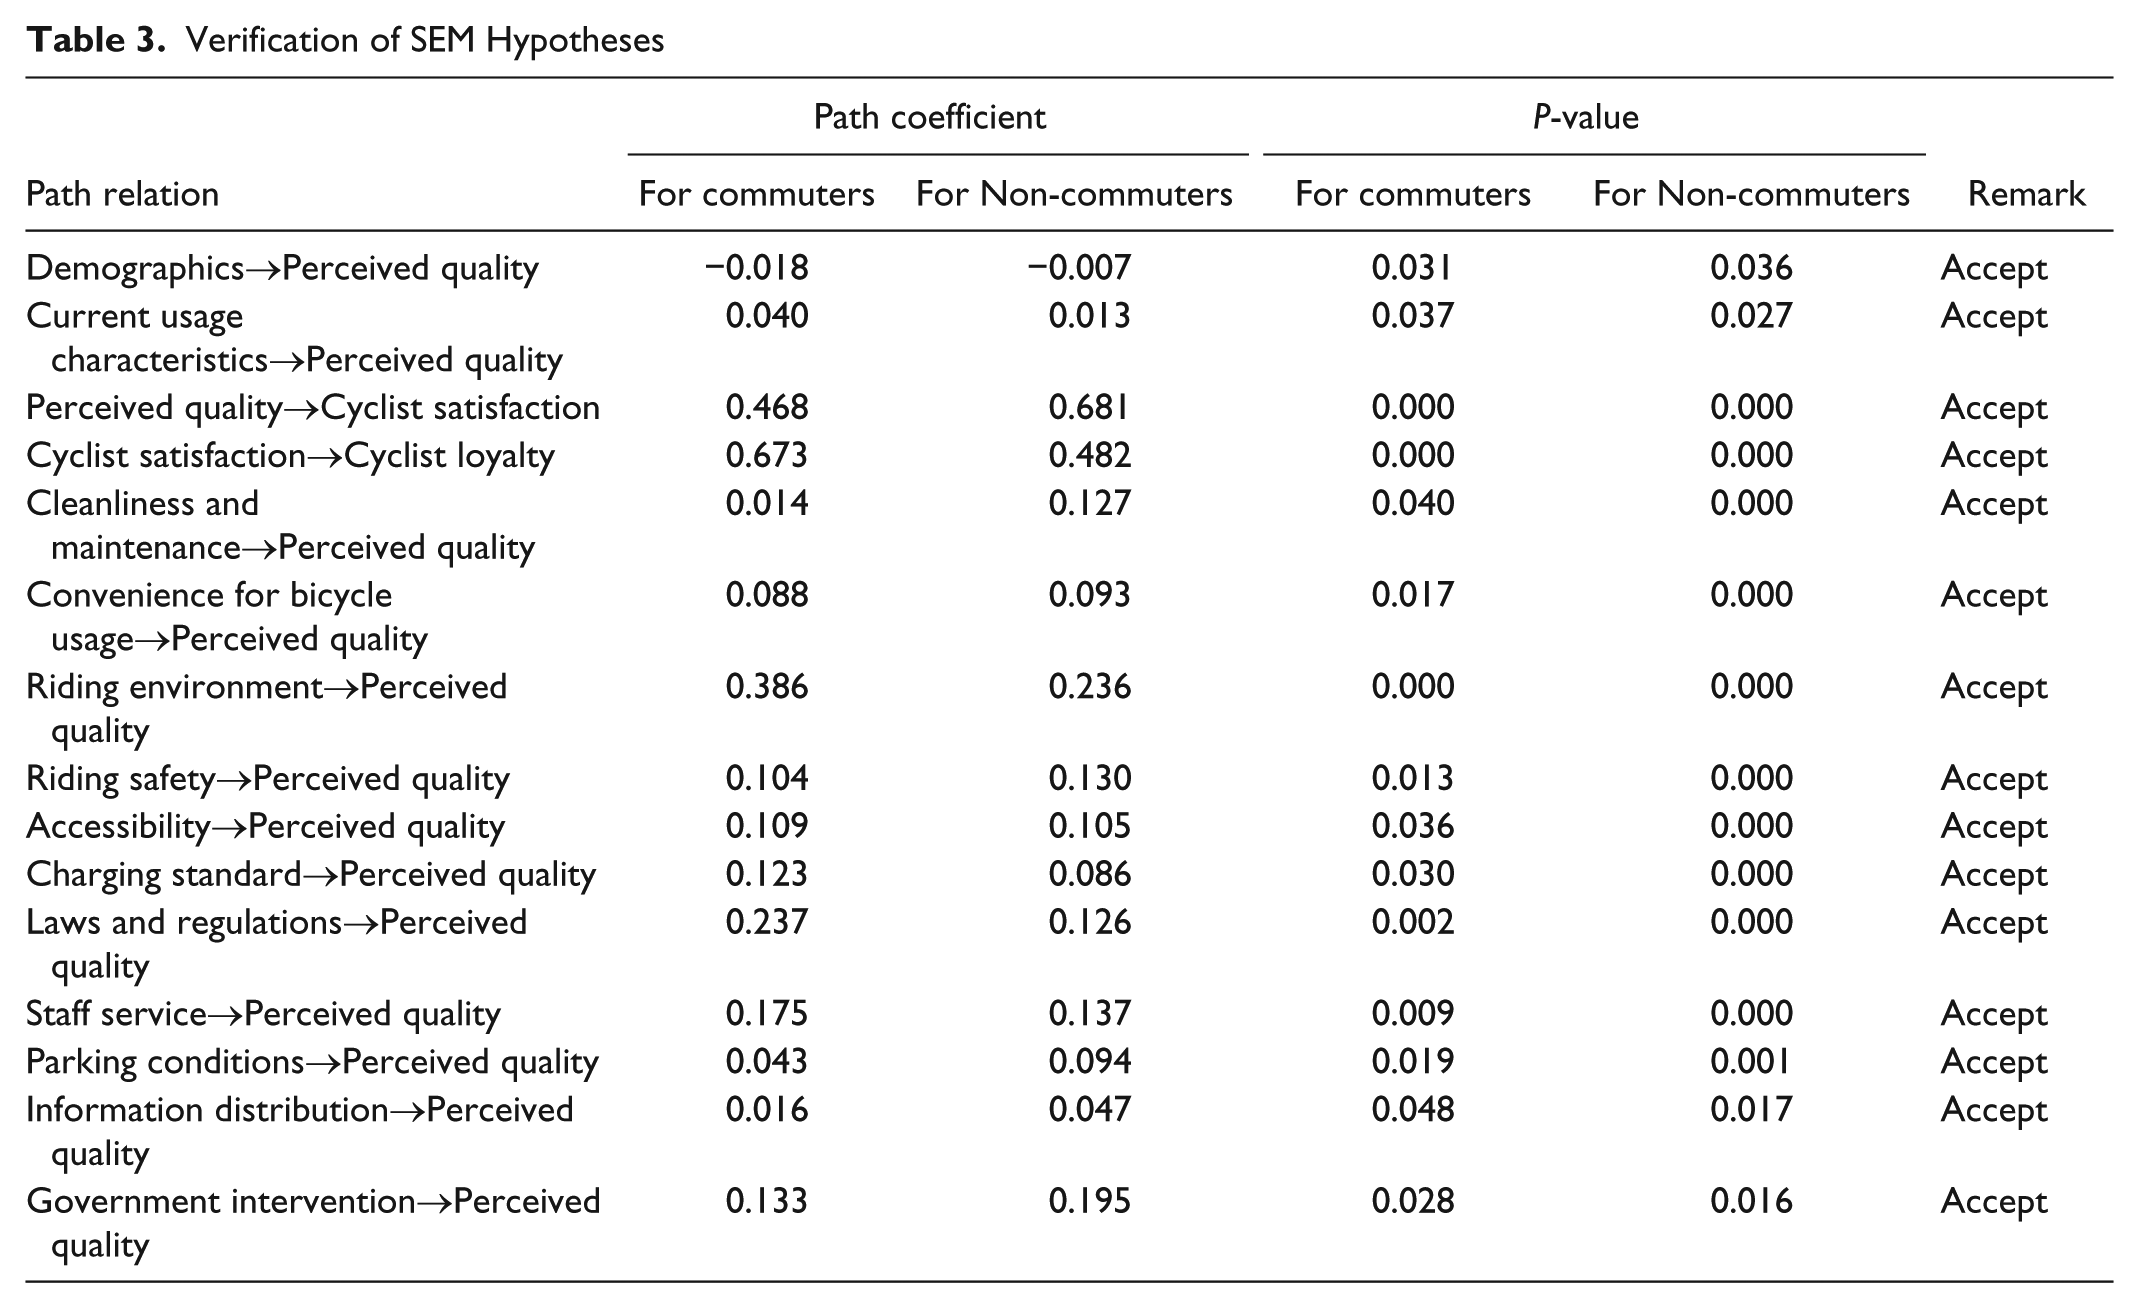
The initial estimation results show that CA, CR and AVE for cyclist complaints are far below the criteria which means that the two manifest variables, “Formal complaints about the system” and “Informal complains about the system,” cannot clearly explain cyclist complaints. This may be because respondents have difficulty in understanding the discrepancy between formal and informal complaints. Therefore, the unreliable construct, “cyclist complaints,” is excluded from the model and the final results of model fit are shown in Table 2. Fit devices of all the latent variables meet the test criterion. What’s more, p-value of each path is lower than 0.05 (shown in Table 3), thus proving the validation of the model.
Fit Devices of the Model
Verification of SEM Hypotheses
Model Results and IPA Analysis
According to Table 3, all of the hypotheses proposed in this part of the model construction are proved to be reasonable, although the correlation between demographics and perceived quality is negative, which is contrary to the original hypothesis. In fact, it shows that cyclists with increased age, higher income and higher education have stricter FFBS quality requirements. This phenomenon appears more obvious among commuters, as the path coefficient (−0.018) is more than twice as much as that of non-commuters (−0.007). As for current usage characteristics, shortening the average parking time will improve cyclists’ perception of service quality, with −0.485 and −0.705 of loading coefficients for commuters and non-commuters respectively (presented in Table 4). Non-commuters focus more on the time spent and travel distance of bicycle riding. Those who travel longer distances have a better experience because they may acquire a better understanding of the system. However, among commuters, frequency of use has the largest magnitude with a coefficient of 0.816. The reason lies in that, according to the survey, commuters use FFBS more frequently, particularly on weekdays, so their attitude towards the system is more sensitive to the number of times they travel by free-floating bicycle.
Loading Coefficients of Manifest Variables
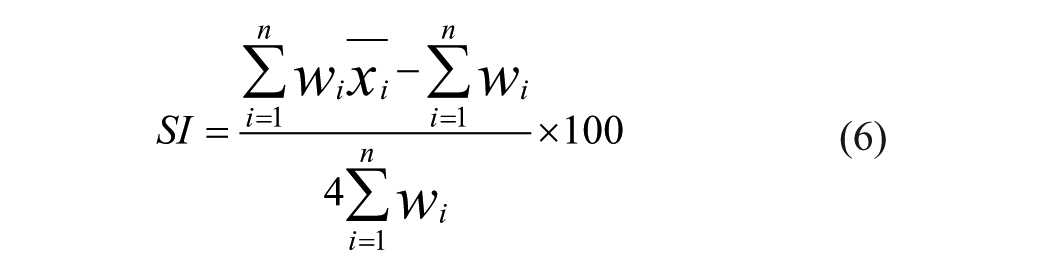
To gain a deep understanding of how the 11 dimensions (cleanliness and maintenance, convenience for bicycle usage, riding environment, etc.) interact with perceived quality, a term called satisfaction index (SI) is proposed. SI is a standard for satisfaction evaluation using the centesimal system which can be calculated as follows:

where


where
In this study, formulas (3)–(5) can be simplified given the 5-point scale:
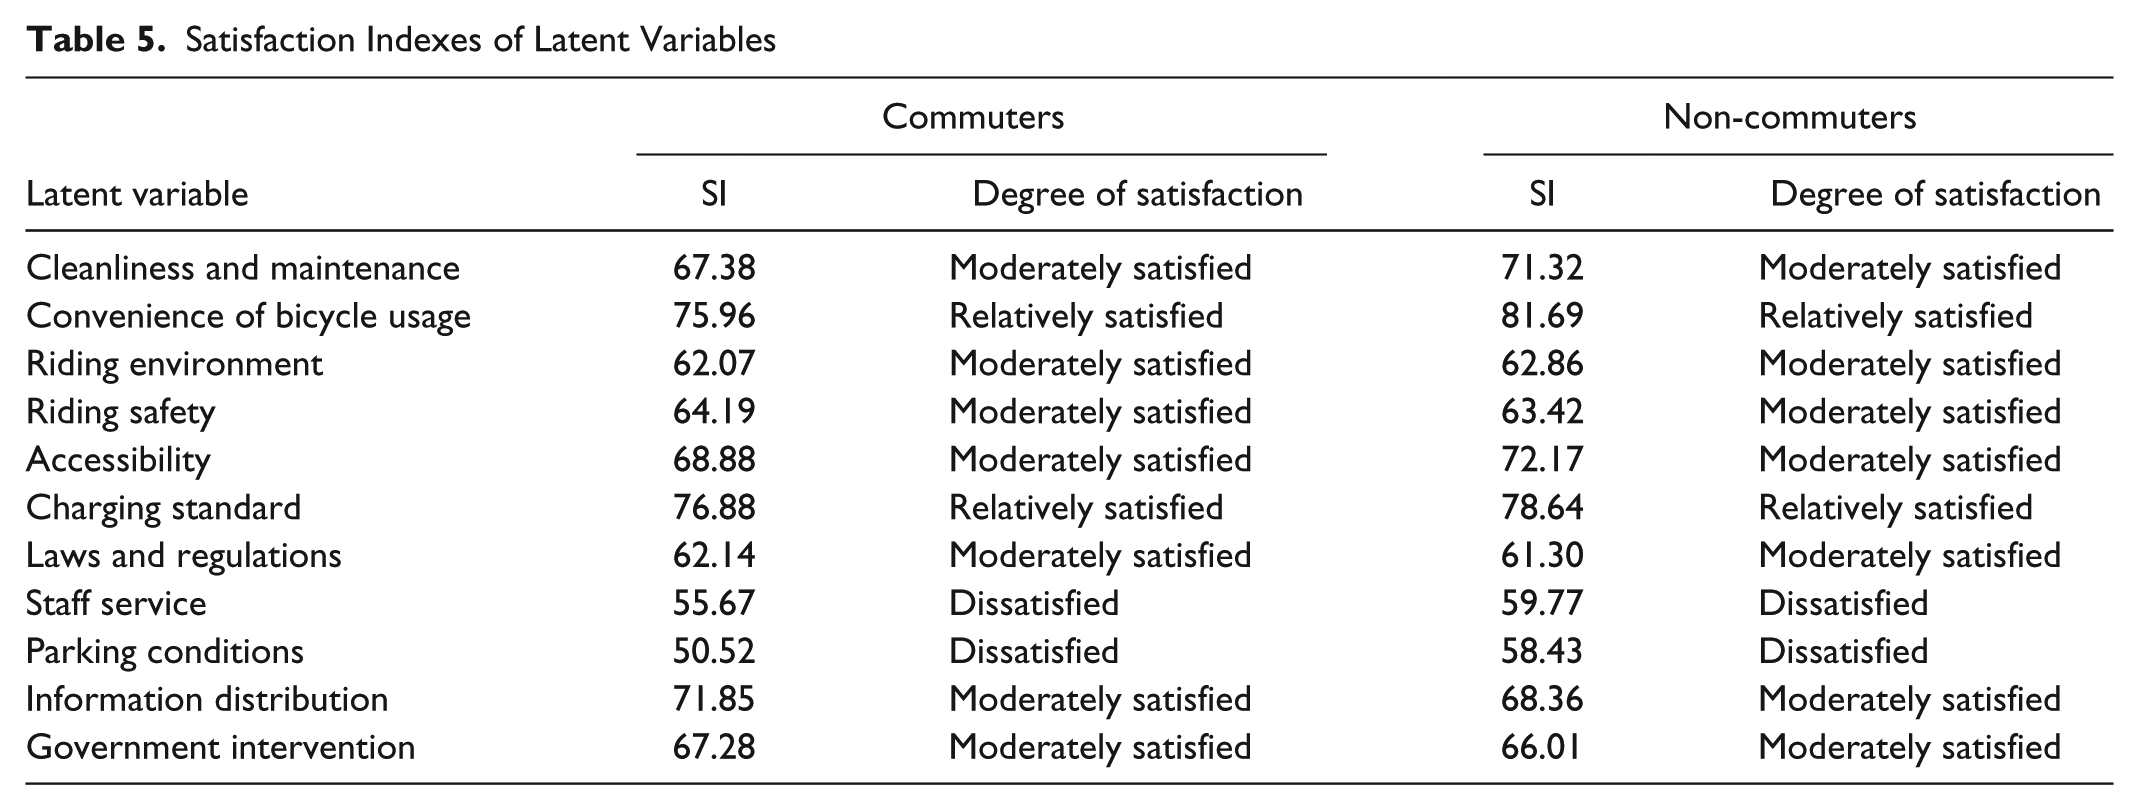
The results of the 11 perspectives of perceived quality measured in this way are demonstrated in Table 5. A score less than 60 means cyclists are dissatisfied with this aspect of the FFBS. A score between 60 and 75 represents “moderately satisfied” and a score between 75 and 90 means “relatively satisfied.” When the score is over 90, it means cyclists are very satisfied with this aspect. Commuters’ and non-commuters’ degrees of satisfaction are basically consistent with each other. In particular, parking conditions and staff service perform badly, with SI lower than 60, which means the current conditions of these two service dimensions need to be improved. The remaining nine dimensions perform relatively well. However, the scores are all below 90. Charging standard has the highest SI among commuters, whereas convenience of bicycle usage is the most satisfying for people do not commute on weekdays. In general, non-commuters think more highly of FFBS than commuters when comparing the average values of SI across the 11 dimensions. One of the probable causes could be that most of their trips are not as urgent as commuters’. As a result, they seem to be more tolerant of the shortcomings of the system.
Satisfaction Indexes of Latent Variables
Importance-performance analysis (IPA) is a useful quantitative approach to identifying the key points of improvement for the FFBS. The performance is the SI of the 11 dimensions of perceived quality and the importance is presented by path coefficients. The results of IPA are illustrated in Figure 2, with the x-axis denoting the importance and the y-axis the performance. The four quadrants are divided based on the mean value of SI as well as the mean value of the path coefficients of the 11 service aspects. They are marked as I, II, III, and IV, which mean “Keep up the good work,” “Concentrate here,” “Lower priority,” and “Possible overkill” respectively ( 41 ). Obviously, indicators in Quadrant II need the most attention because they perform badly at present but have the greatest impact on the system.
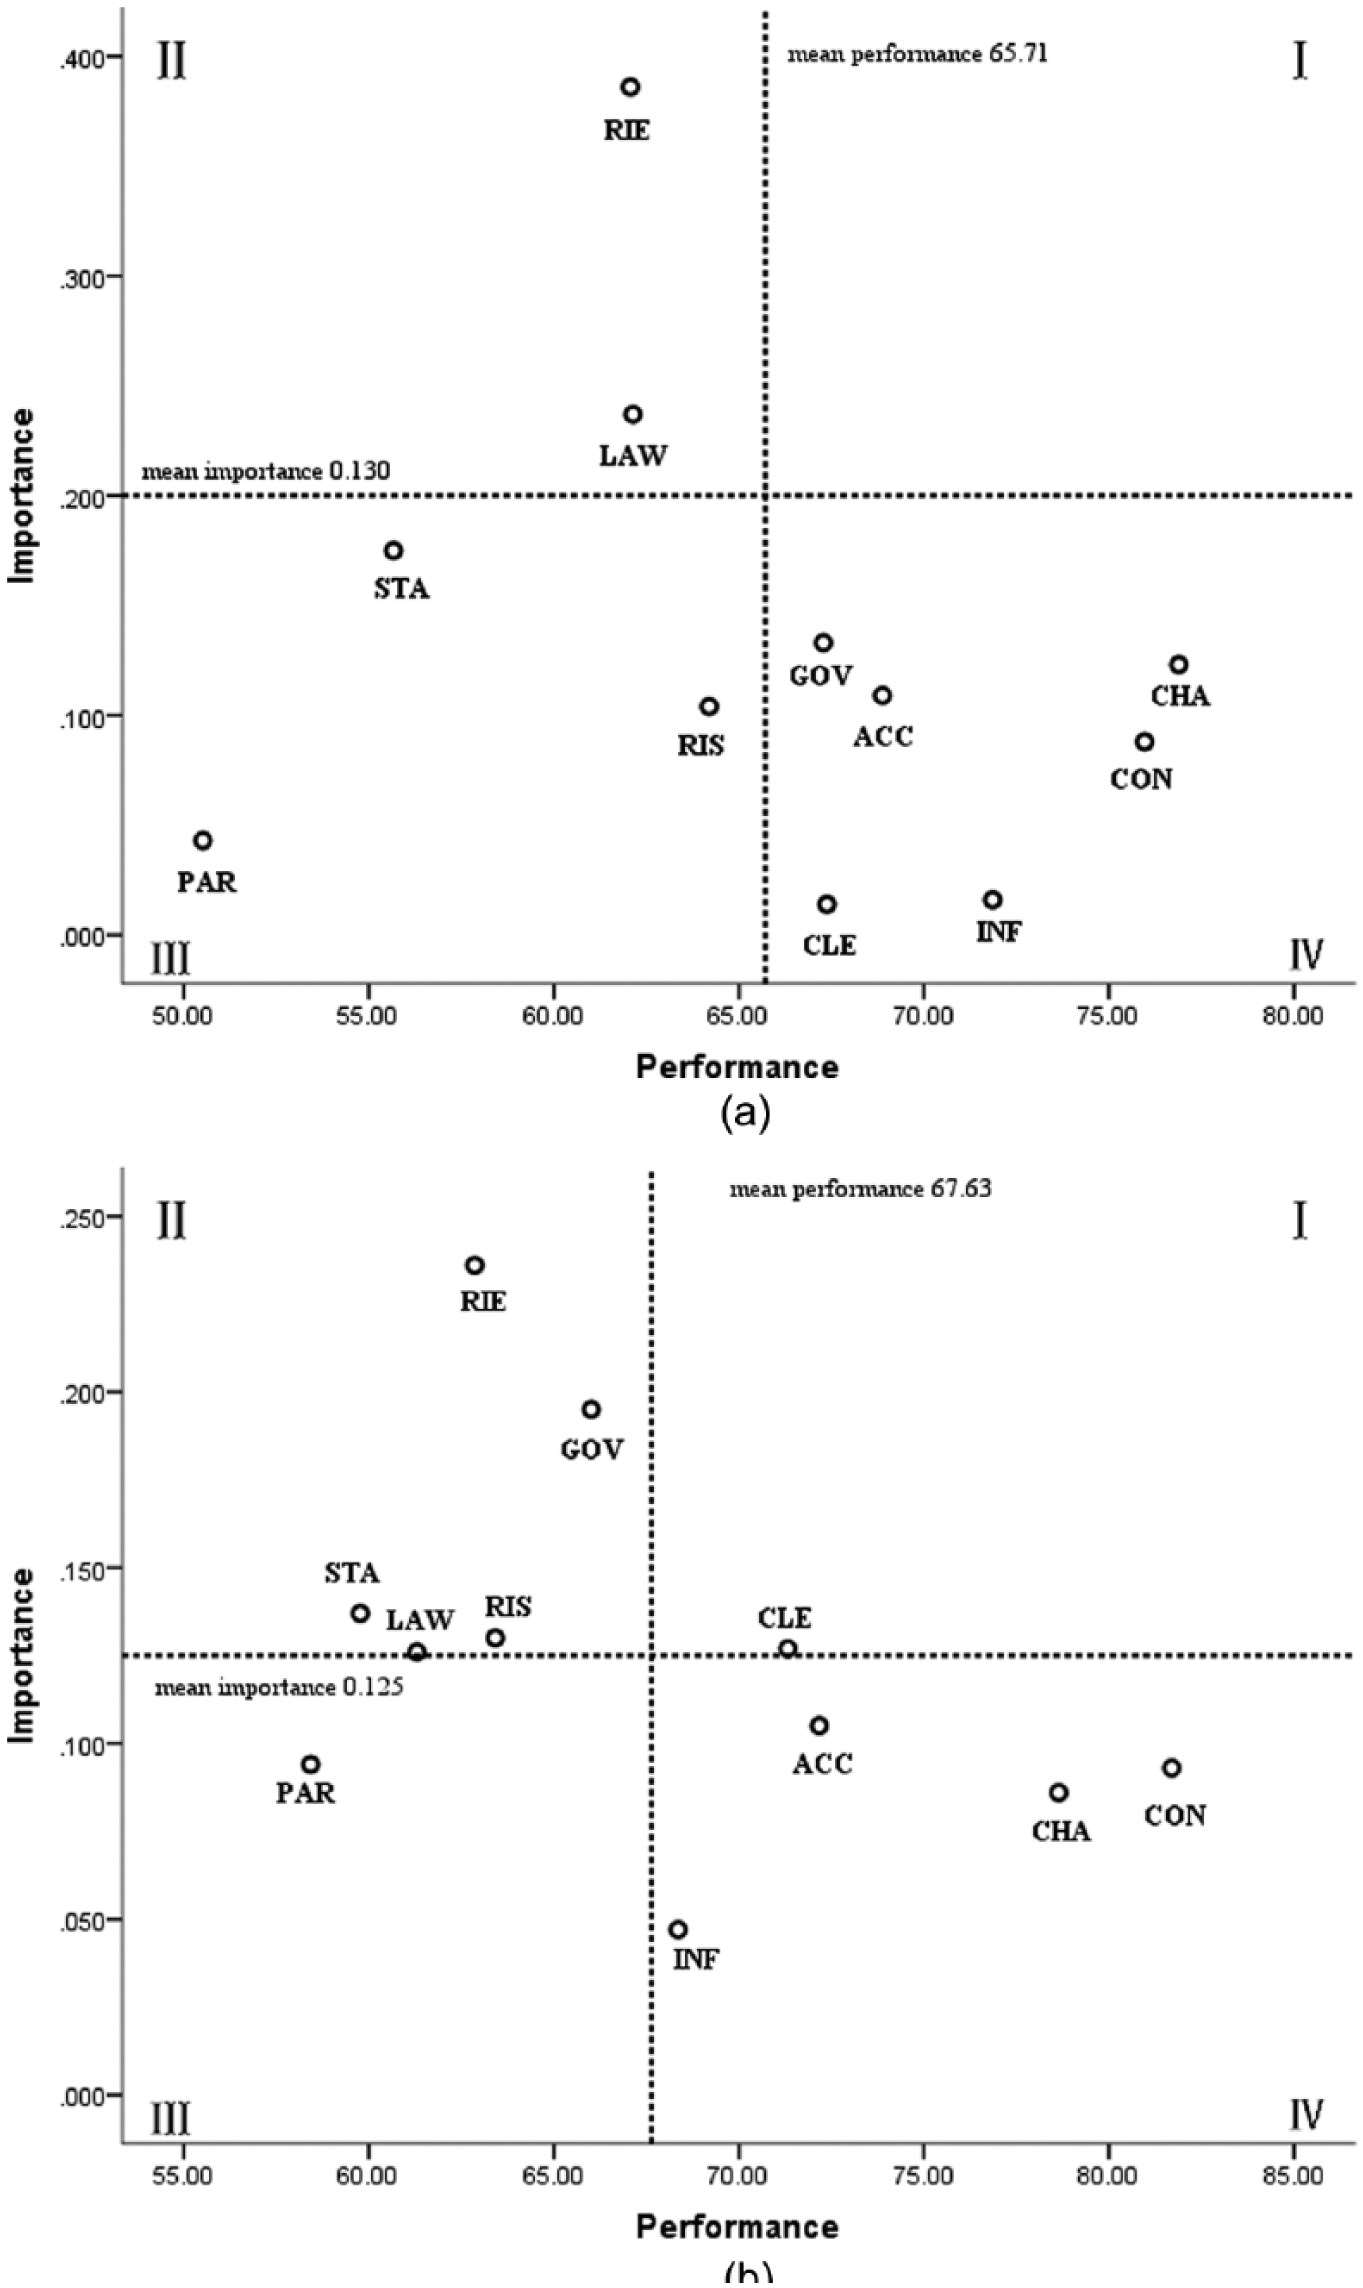
(a) IPA matrix result for commuters, and (b) IPA matrix result for non-commuters.
From the perspective of commuters (Figure 2a), riding environment and laws and regulations are in Quadrant II which means commuters think the problems of these two indicators must be solved immediately, or they will became the major stumbling block of the FFBS. In Quadrant III, there are three indicators including parking conditions, staff service and riding safety, which indicates that they perform badly but have a lower priority for improved. The remaining indicators are all in Quadrant IV. That is to say, they just need to maintain the present state. However, the non-commuters’ attitude (Figure 2b) is not the same as the commuters’. From their point of view, three dimensions including government intervention, riding safety and staff service should be added to Quadrant II, because among the non-commuters surveyed, university students and retirees occupied a fairly large proportion. University students were the initial users of the FFBS in Shanghai, as FFBS companies such as OFO first put free-floating bicycles on school campuses. So they may have more requirements of the FFBS after having used the system for a while. With regard to the retirees, they prefer to have better service because they may have more difficulty using the app compared to young people. Meanwhile, they give priority to riding safety because of their physical limitations.
Conclusion and Future Work
The objective of this research was to assess the potential of the FFBS and how to increase its usage and effectiveness. To achieve these goals, a questionnaire was conducted to answer three main questions: “Who is using the FFBS?” “What are the demographics and travel characteristics of FFBS users?” and most importantly, “What factors influence their degree of satisfaction of the system?”
According to the descriptive analysis, most users are aged between 20 and 40, with relatively high education levels. The majority of them earn less than 12,000 RMB monthly, which represents a middle income level in Shanghai. The travel time is often 20 minutes or less and the average travel distance is mostly below 5 km. SEM was used as a tool to analyze how the elements inside the system interacted with each other. The results show that demographics have a negative relationship and users’ current travel characteristics have a positive relationship with perceived quality. The direct impact of cyclist satisfaction on cyclist loyalty is very large. IPA analysis reveals that five dimensions of the FFBS must be improved urgently. They are riding environment, riding safety, government intervention, laws and regulations, and staff service.
Based on findings from the research, some important policy implications can be determined to help optimize the system. First of all, to optimize the current riding environment and safety situation, Tironi ( 42 ) once suggested that quality of bicycle facilities affected the amount of people who traveled by bikes. Using the Shanghai statistics, the mean width of non-motorized lanes is 3.1 m. However, there is a big difference between arterial roads (3.5 m) and branch roads (2.45 m). Moreover, the width of non-motorized lanes demonstrates a decrease from the urban area to the outskirts. Therefore, there is a need to provide a higher level of service on the branch roads by widening the cycle lanes, especially for those in the suburbs. Connectivity of bicycle lanes should also be strengthened.
At present, government enforcement related to the FFBS is relatively weak. How to balance the relationships among governors, cyclists, and FFBS enterprises is a key issue to be solved. For example, the responsibilities and obligations of FFBS companies must be clarified in writing. The number of FFBS companies and the number of bicycles they have should be controlled, within reason. For this purpose, governors have been working an information platform, which allows the real-time data sharing. Data retrieved from GPS devices installed in free-floating bicycles will be sent to the platform. Managers will obtain an understanding of bicycle routes, the number of bicycles in service, real-time locations and bicycle fault information. Ranking of all companies is assessed monthly according to their operational situation and problem-solving efficiency. In addition, cyclists’ behaviors should also be supervised via the establishment of a credit mechanism so that violations of regulations can be punished by reducing credit scores or fining the cyclists.
Meanwhile, electronic fences are being built in several pilot areas. When cyclists park the free-floating bicycles in places where parking is forbidden, the built-in smart device will identify the mistake and remind users. Users will continue to be billed until they park bicycles in right the place.
Although the study has made some discoveries, several limitations still exist. First, “cyclist complaints” was excluded from the model initially because of the deficiency of the questionnaire design, but it is an important aspect which reflects cyclists’ dissatisfaction with services. Second, respondents who were surveyed this time only included four occupations, which may lead to deviation in model results. In that case, further investigation and better survey design are needed to improve the CSI model in the future.
Footnotes
Acknowledgements
This study is supported by the Humanities & Social Sciences Project of the Chinese Ministry of Education (17YJC630179), Key Project of National Natural Science Foundation(71734004) and the Fundamental Research Funds for the Central Universities (20160629 and wx0160020170889).
The Standing Committee on Transportation in the Developing Countries (ABE90) peer-reviewed this paper (18-05091).