
Abstract
Intersection crashes during nighttime hours may occur because of poor driver visual cognition of conflicting traffic or intersection presence. In rural areas, the only source of lighting is typically provided by vehicle headlights. Roadway lighting enhances driver recognition of intersection presence and visibility of signs and markings. Destination lighting provides some illumination for the intersection but is not intended to fully illuminate all approaches. Destination lighting has been widely used in Iowa but the effectiveness has not been well documented. This study, therefore, sought to evaluate the effect on safety of destination lighting at rural intersections. As part of an extensive data collection effort, locations with destination/street lighting were gathered with the assistance of several state agencies. After manual selection of a similar number of control intersections, propensity score matching using the caliper width technique was used to match 245 treatments with 245 control sites. Negative binomial regression was used to evaluate crash frequency data. The presence of destination lighting at stop-controlled cross-intersections generally reduced the night-to-day crash ratio by 19%. The presence of treatment or destination lighting was associated with a 33%–39% increase in daytime crashes across all models but was associated with an 18%–33% reduction in nighttime crashes. Injuries in nighttime crashes decreased by 24% and total nighttime crashes reduced by 33%. Property damage crashes were reduced by 18%.
Unlit or inadequately lit intersections reduce the ability of drivers to recognize upcoming intersections during nighttime hours. Drivers also face difficulty in safely negotiating the intersection as the lack of adequate lighting increases the likelihood of not detecting conflicting vehicles or pedestrians. In general, the nighttime crash rate is about 1.6 times that in daytime ( 1 , 2 ). Around 27% of total crashes and 45% of fatalities occur under dark conditions even though nighttime volume does not account for the same proportion ( 3 ). Hallmark et al. ( 4 ) conducted a cross-sectional analysis of the effects on safety of various treatments at 223 rural intersections. Their model indicated that the expected mean number of nighttime crashes was 2.01 times higher for unlighted intersections than for lighted intersections.
Standards and best practices are available for full-scale lighting of intersections. However, the addition of lighting structures and wiring can be a significant cost for rural agencies and may not be justified under lower volume conditions. One solution, commonly used in Iowa and other U.S. states, is destination lighting.
Destination lighting is intended to visually mark an upcoming intersection so drivers are alerted to its presence. In most cases, a single head is placed on the nearest utility pole which reduces the need for additional structures and wiring. The primary objective of destination lighting is to guide a driver to the intersection though this may not provide sufficient lighting to increase visibility ( 5 ). Destination lighting is typically placed at one approach but it is not unusual for lights to be placed on multiple approaches. Although destination lighting does not provide a full lighting footprint, it does provide some illumination for the intersection. Destination lighting can be a good countermeasure for rural intersections where nighttime crashes involve running stop sign or a failure to yield. Figure 1 exhibits a typical destination lighting configuration.
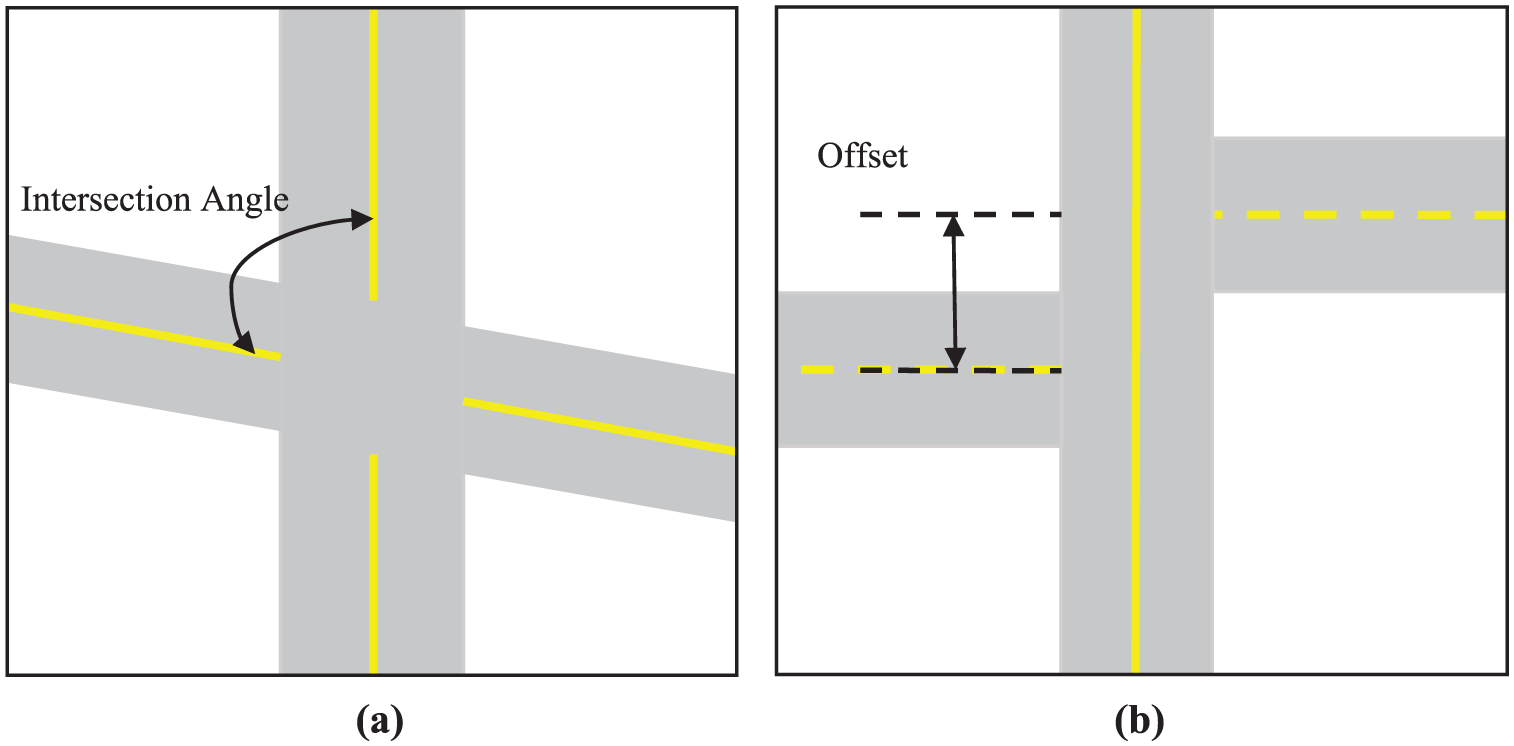
Intersection angle and offset distance.
The Traffic and Safety Manual issued by Iowa Department of Transportation (DOT) provides lighting warrants for full lighting and destination lighting. According to the manual, destination lighting should be placed at intersections with more than approximately 1,750 entering vehicles in comparison to 3,500 entering vehicles for full lighting. Destination lighting should also be considered when the night-to-day crash ratio exceeds 1.0 and there exists a minimum of two reportable night crashes in a five-year period ( 6 ).
Although various studies have assessed the safety of intersection lighting, the effect of destination lighting has not been well studied. The objective of this research was to examine the relationship between traffic, crash, and roadway characteristics at stop-controlled cross intersections provided with destination lighting in Iowa. Crash frequency models were developed to identify the safety effectiveness of providing destination lighting at cross-intersections.
Background
Previous literature examined the safety benefits of full lighting of rural intersections that generally serve higher traffic volumes than secondary road intersections. The safety benefits of destination lighting at intersections carrying relatively low volumes have not been adequately reported. One study by Carstens and Berns ( 5 ) identified and evaluated safety related to destination lighting at secondary road intersections in Iowa. The study showed results from two comparisons. First, crashes were compared between before-and-after periods at 91 secondary road intersections. The study failed to show any reduction in crashes associated with the installation of destination lighting. Second, crash experience at 102 lighted intersections were compared with unlighted ones. No significant differences were observed in the crash rates at lighted and unlighted locations.
Previous studies evaluated safety of street lighting at rural intersections and indicated reduction in nighttime crashes associated with the installation. Isebrands et al. ( 7 ) evaluated the effectiveness of roadway lighting in reducing nighttime crashes at isolated rural intersections. The study evaluated the effect of lighting at 33 intersections with 3 years of before-and-after data. Results indicated nighttime crash rate to be a statistically significant 37% lower after lighting was installed.
In another study, Isebrands et al. ( 8 ) conducted a before-and-after analysis for installation of street lighting at 48 isolated rural intersections in Minnesota to evaluate the effect on crash rates. The results indicated a 13% reduction in nighttime crash frequency. The ratio of nighttime crashes to total crashes was reduced by 21% and the ratio of nighttime crashes to daytime crashes was reduced by 36% in the after period. The nighttime crash rate was seen to be reduced by 19%. On the other hand, there was an increase in the daytime crash rate by 26% from the before to after period.
Several other studies evaluated the safety of installing full scale lighting at intersections at night. Bullough et al. ( 9 ) examined the theoretical relationships among lighting, visibility, and safety using a statistical and an analytical approach, for different intersection types in Minnesota. Overall, the presence of roadway intersection lighting was found to be associated with an approximately 12% lower night-to-day crash ratio than at unlighted intersections. Results also suggested that visual performance improvements from roadway lighting could be used for predicting improvements in crash frequency.
Donnell et al. ( 10 ) evaluated the statistical association between the presence of intersection lighting and the night-to-day crash ratio in Minnesota. When traffic volume and other safety-related intersection design features were accounted for, intersections with fixed roadway lighting have fewer expected nighttime crashes and more expected daytime crashes than intersections without lighting. The nighttime crash frequency and night-to-day crash ratio decreased by 7.6% and 12% respectively. Sasidharan et al. ( 11 ) found that fixed roadway lighting reduces expected nighttime crashes by approximately 6%.
Bruneau and Morin ( 12 ) compared the safety aspects of roadway lighting at rural and near-urban three-way and four-way junctions by standard and nonstandard lighting. Rural lighting significantly reduced the nighttime crash rate by 29% for nonstandard lighting and by 39% for standard lighting, in comparison to darkness.
Walker et al. ( 13 ) evaluated the influence of lighting on crash frequency at 47 rural at-grade intersections in Iowa for a 3-year period before and after the installation of lighting. Installation of lighting resulted in an overall significant reduction in the average of nighttime crashes by 49%. The average nighttime crash rate per million entering vehicles was 1.89 before lighting and 0.91 after lighting indicating a reduction of 52%. Lipinski and Wortman ( 14 ) also analyzed crash data for rural at-grade intersections in Illinois. The results indicated that the overall night-to-day crash ratio decreased from 0.33 to 0.26 (by 22%), after the intersections were lighted. The results also showed a 45% reduction in the nighttime crash rate and a 35% reduction in the total crash rate at all intersections. Wortman et al. ( 15 ) collected physical characteristics, traffic volume, and crashes at rural at-grade intersections in Illinois. It was found that the lighting produced a significant reduction in nighttime crashes by 30%. The above studies are summarized in Table 1.
Crash Reduction Percentages from Previous Studies
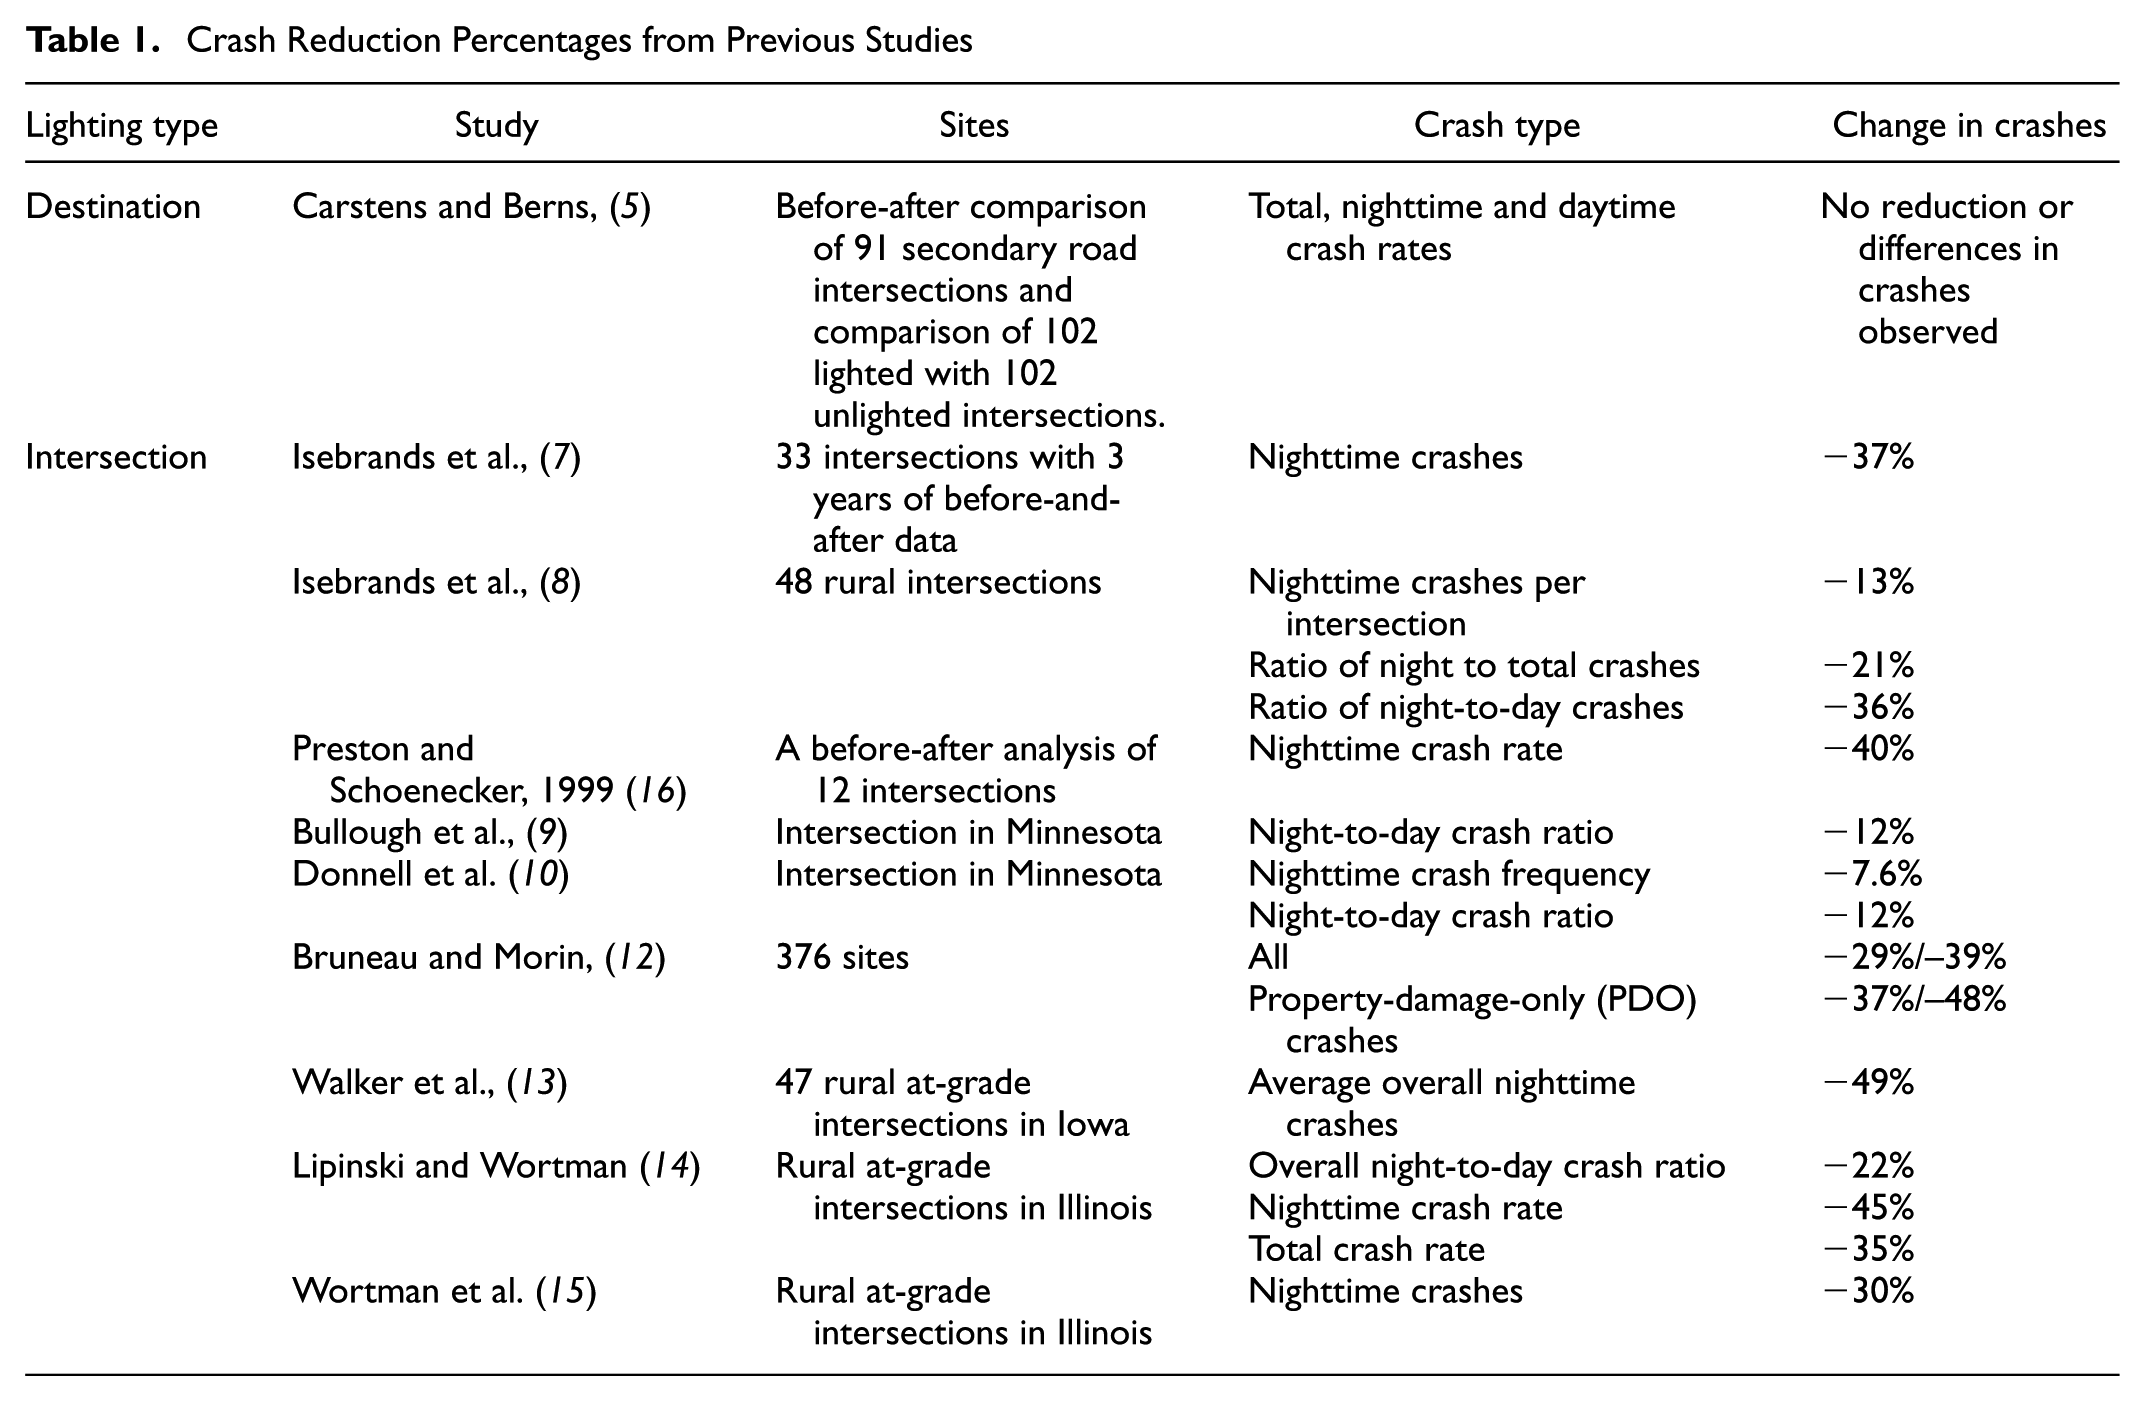
In many of the above studies, type of lighting (i.e., regular versus destination) was not indicated. As a result, although lighting in general has shown a positive safety benefit, the impact of destination lighting is still relatively unknown. Since destination lighting is significantly cheaper for rural agencies to install, this study investigated the safety effectiveness of the installation of destination lighting at rural secondary roads.
Methodology
A database was developed which included the traffic and geometric characteristics of the intersections of interest. The traffic, roadway, and geometric data of each intersection were merged with crash frequency data over a 10-year analysis period from 2005 to 2014.
Identification of Treatment Sites
The Institute of Transportation (InTrans) and the Iowa Department of Transportation (DOT) developed an intersection database for the State of Iowa. The intersection dataset also contained information about all rural and urban intersection characteristics in Iowa in the form of geographic information system (GIS) shape files.
Intersection locations on most public roadways were identified and associated characteristics such as type of traffic control (i.e., stop, yield, and signal), presence of overhead lighting, and so forth were coded. Intersections were spatially located and queried in ArcMap so that intersections with characteristics of interest could be identified. As part of the extensive process of data collection, several state agencies were contacted to identify locations with destination lighting. At the end of the process, a total of 309 intersections with destination lighting were obtained with 306 being four-legged and three being T-intersections. Given the extremely small number of T-intersections, the study was concentrated on four-legged intersections only.
Identified locations of destination lighting were checked against sources such as Google Street View, Microsoft Birdseye, and Google Aerial View to confirm the presence of the lighting. Intersection characteristics such as number of approaches and intersection angle were also extracted. Characteristics, specific to individual approaches such as roadway surface type (i.e., gravel, paved), advanced stop sign rumble strips, and advance signing were recorded. The presence of destination lighting and other intersection or approach characteristics were confirmed using multiple data sources.
Identification of Control Sites
Control sites with no lighting but with similar roadway characteristics were identified using a similar methodology as described above. One control location was selected for each treatment intersection. The first step in identifying candidates was to check intersections in proximity to the treatment intersection. A control intersection was manually identified using ArcGIS to match a corresponding treatment intersection using the following important variables (in most cases the first four criteria were matched for treatment and control intersections):
Type of intersection: intersection configuration (i.e., four-lane/two-lane stop control; two-lane/two-lane stop control)
Type of traffic control (i.e., two-way stop)
Proximity
Volume on minor vs. major roads (within 500 vehicles per day if possible)
Channelization (turn lane)
Presence of rumble strips or countermeasures (such as raised median)
Intersection Approach Database
Once an initial set of locations was identified, additional data for individual approaches of the treatment and control approaches were aggregated. The intersection approach dataset contained the following factors:
Traffic mode
Pavement surface type
One- or two-way
Intersection angle
Offset distance
Left-turn type
Left-turn bay length
Number of exclusive left-turn lanes
Left-turn offset
Right-turn channelization
Number of exclusive right-turn lanes
Traffic control exclusive right-turn
Right-turn offset
Median type
Traffic control
Crosswalk type
Transverse rumble strips
Intersection angle was recorded as the interior (smaller angle) of the most angled member of the intersection. It reflects the angle of traffic as it approaches the intersection. The offset distance was the measure of distance from the centerline of one roadway to the centerline of the opposite roadway. Both of these attributes were measured in ArcGIS. Figure 1 shows the measurement of the intersection angle and offset distance.
Traffic Data
The Iowa DOT maintains a roadway inventory used to obtain the traffic volume data for each of the approach roadways in an intersection. Annual Average Daily Traffic (AADT) figures for each of the approaches were obtained for the middle year for the ten-year study period 2006–2016. Daily entering vehicles were calculated for all the intersections using Equation 1 which assumes a 50/50 directional split of segment volumes ( 6 ).

where:
DEV = Daily entering volume for an intersection
Iowa Crash Database
The Iowa DOT maintains a historical crash database that includes geographically referenced information detailing the driver, vehicle, roadway, and environmental factors associated with each police-reported crash. Crash-level data provided information about the location, date, severity level, and other general information about each crash. Crashes occurring within 250 feet of each intersection were obtained for the 11 years from 2006 to 2016. Various records were consulted to ensure lighting was present at treatment sites during the entire 11-year study period.
Crash Severity levels were designated as follows: Fatal Injury (K), Disabling Injury (A), Visible Injury (B), Possible Injury (C), and Property-Damage-Only (PDO). Time of crash was used to identify nighttime crashes. Crashes at dusk and dawn were not included in the calculation of nighttime crashes.
Total nighttime and daytime crashes were determined for each of the treatment and control sites. An original model was developed to develop a CMF for nighttime crashes. It was not possible to determine when lighting had been installed so a cross-sectional rather than a before-and-after analysis was conducted. However, results were not conclusive. It was determined that this was likely because lighting had been installed at locations which had a nighttime crash problem which differed from control intersections and thus resulted in selection bias.
A preliminary simple comparison of the data indicated that there were significant differences in the ratio of day-to-night crashes at treatment versus control intersections suggesting the treatment is more effective at night. This method has been used by others to compare the relative safety of lighting such as Jackett and Frith ( 17 ) and Bhagavathula et al. ( 18 ) who used the night-time to day-time crash ratio to assess road luminance.
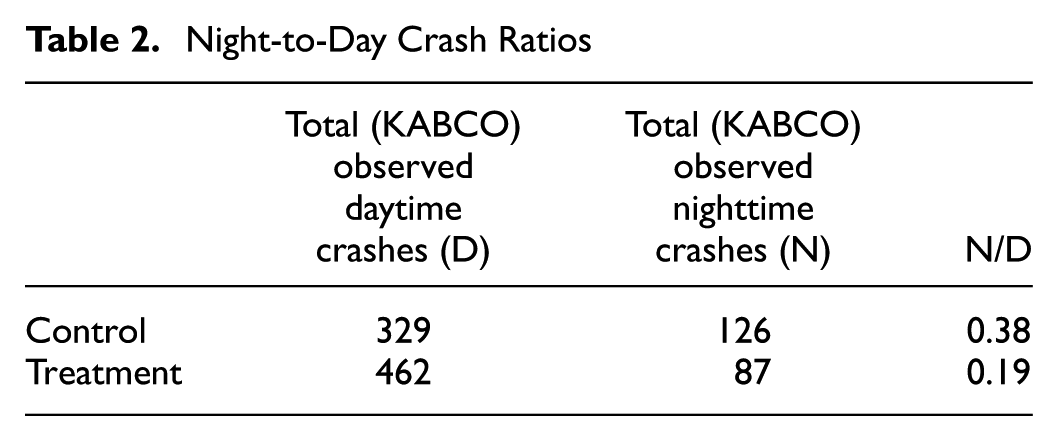
As noted in Table 2, the night-to-day crash ratio for treatment sites with destination lighting was 0.19 while the ratio for control sites was 0.38. As a result, this simple comparison indicates that the ratio of night-to-day crashes at treatment sites is about 50% lower than for control sites.
Night-to-Day Crash Ratios
Descriptive Statistics
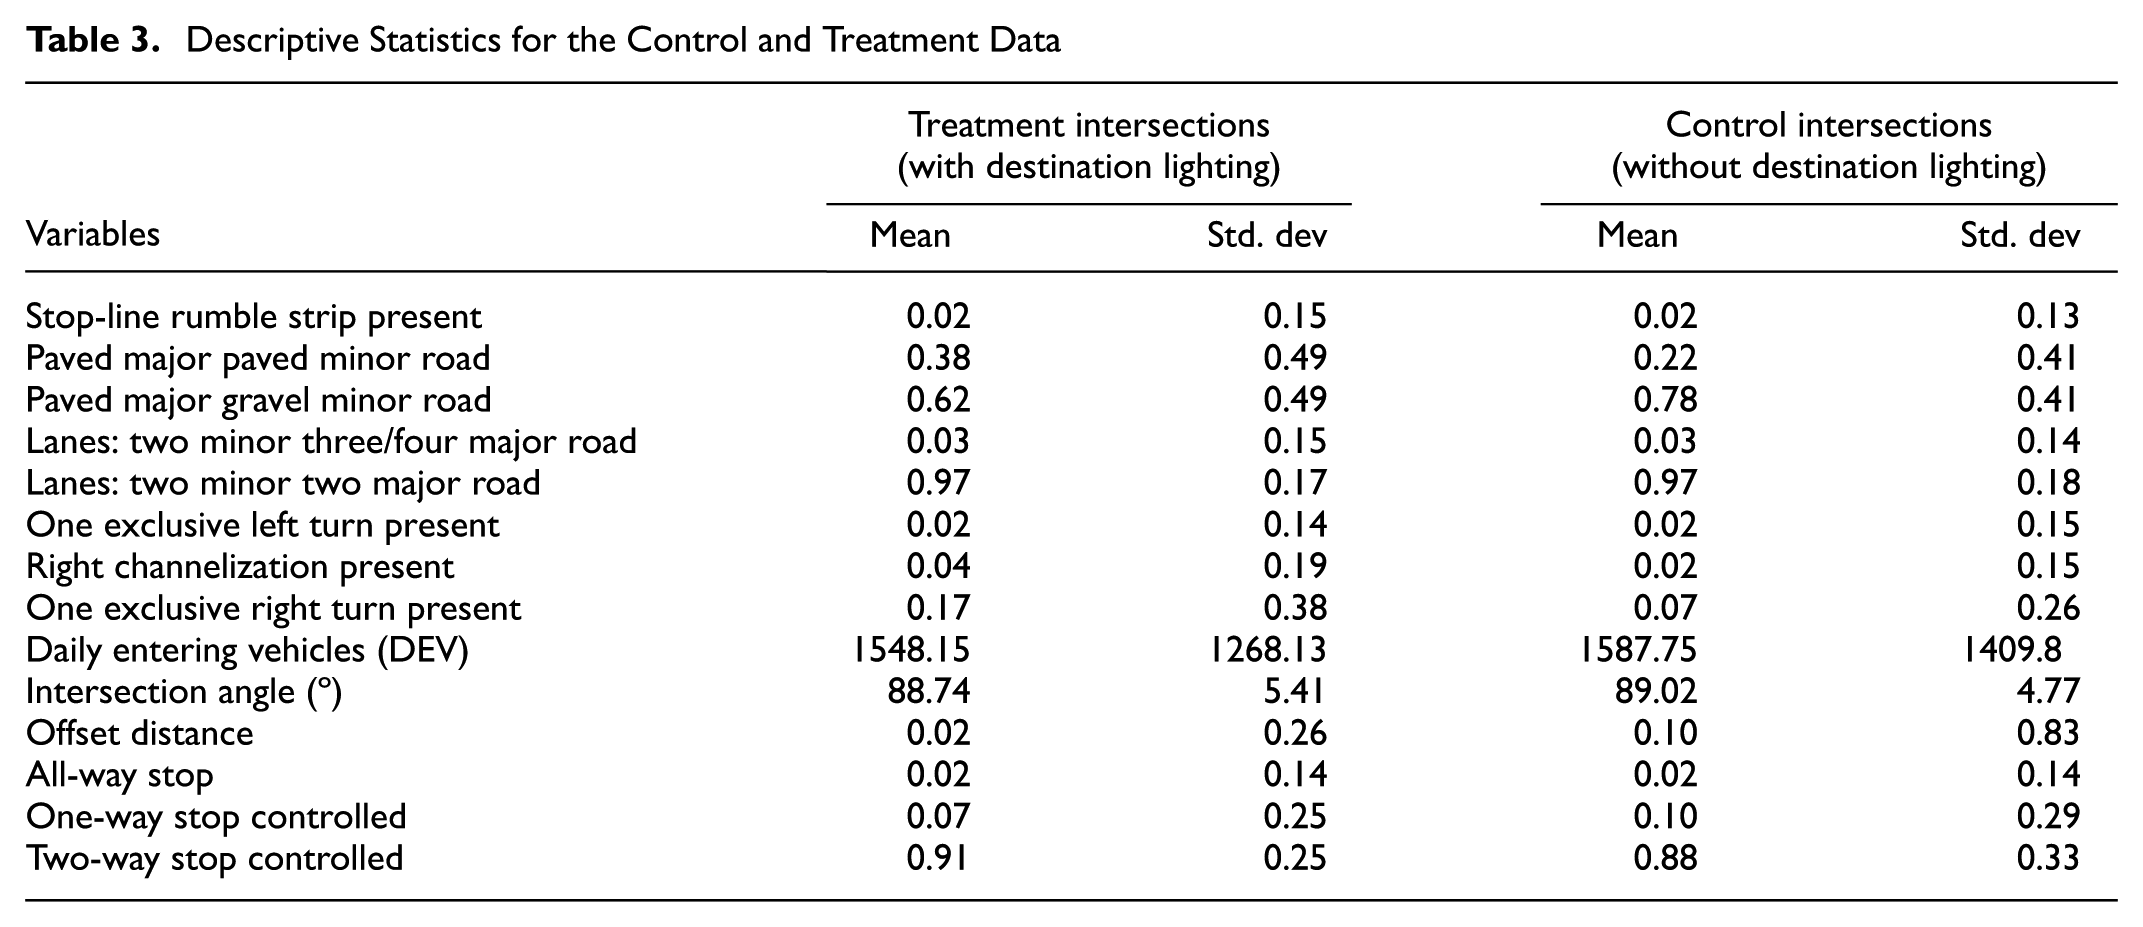
Table 3 summarizes the descriptive statistics of variables for treatment and control intersections separately. The 245 treatment and 245 control intersections experienced a total of 213 nighttime crashes during the analysis period. Table 3 also provides mean and standard deviation of the variables. For the continuous variables, DEV, it can be seen that the mean values are comparable for both the treatment and control sites. For categorical variables the mean shows the percentage of intersections in which the variable was present. For example, one exclusive right-turn lane was present in 17% and 7% of the treatment and control intersections respectively.
Descriptive Statistics for the Control and Treatment Data
Statistical Analysis
Estimation of Propensity Scores
Propensity score matching was used to compare the “likeness” of treatment and control sites. The method matches a treatment case with one or more control cases based on each case’s propensity score. This procedure proves to be helpful for observational cross-sectional studies. It has been pointed out by Cao et al. ( 19 ) that an almost “identical” observation in the control group could be found for an observation in the treatment group. This matching is approximately equivalent to the process in which one of the two “same” observations is assigned into a treatment group and the other is assigned into a control group. If the process is repeated for all observations in the treatment group, observations in the matched treatment group should not differ from those in the matched control group.
Propensity score matching was performed to find balance between treatment and control intersections utilized in the study. A caliper was used to avoid large differences between scores as suggested by Guo and Fraser ( 20 ), Sasidharan and Donnell ( 11 ). A caliper width of 0.25 times the standard deviation of the propensity scores for the treated locations was used in previous research ( 12 ). A range of caliper widths was tested by Wood et al. ( 21 ). It has been pointed out in the same study that narrow caliper widths tend to reduce the sample size for use in the potential outcomes model, relative to a wider caliper width. Different caliper widths of (0.25/0.20/0.15/0.10) times standard deviations were used and a caliper was set at 0.2 times the standard deviation beyond which improvement in matching was not observed.
The dependent variable was a dummy variable that indicated the presence or absence of destination lighting. The propensity score was estimated by using a logit model, which has the following form ( 21 ):

where,
Pr (yi =0) = propensity score (probability of having destination lighting),
β0 = intercept term
βj’s = parameters to be estimated, and
Xij’s = independent variables.
This logit model form was applied to different selections from the list of available covariates, and the model with the best fit was used to estimate the propensity scores. The best fit represented the set of covariates that produced significant coefficients in the estimation of the logit model and that minimized the negative log-likelihood of the model.
The “MatchIt” package within the statistical software ‘R’ was used to generate the propensity scores for the project. The data set was set up in a way such that it consisted of cases in rows and variables in columns. A nearest-neighbor technique was used to match the cases. This technique matched a treated unit to a control unit that is closest in distance measure. The propensity score method selected for this study was caliper-based (0.2 times standard deviation), 1:1 nearest-neighbor matching without replacement ( 20 ). About 245 treatment and control sites were matched according to variables of traffic volume, presence of rumble strips, county, and so forth.
Crash Frequency Analysis
Installation dates could not be obtained for more than a small percentage of treatment sites. As a result, a before-and-after study could not be conducted as noted above. Models were developed for target intersection-related crashes. A target crash was defined as any non-animal, intersection-related crash. Animal crashes were not included since the presence of an animal is an unexpected event and lighting has not historically been used to address animal crashes.
Separate models were developed across all severities (fatal, major, injury, minor, possible, and property-damage-only), for injury severities (fatal, major, injury, minor) and property-damage-only crashes. Cross-sectional crash models using negative binomial generalized linear regression analysis were developed with an indicator variable for the presence and absence of destination lighting. Once the databases were compiled, a series of statistical analyses were conducted to ascertain how crashes were affected by traffic, geometric, and site characteristics. Various count data model frameworks were considered in the development of crash prediction models. As a starting point, a Poisson regression model was estimated, where the probability of intersection i experiencing yi crashes during a specific period is:

where λi is the Poisson parameter for segment i, which is equal to the expected number of crashes at the intersection during the analysis period, E[yi]. Poisson regression models are estimated by specifying Poisson parameter λi as a function of explanatory variables, with the most common form given below:

where Xi is a vector of explanatory variables and β is a vector of estimable parameters. The negative binomial model is derived by rewriting the Poisson parameter for each segment i as follows:

where EXP(εi) is a gamma-distributed error term with mean one and variance α. The term α is known as the over-dispersion parameter, which reflects the additional variation in crash counts beyond the Poisson model (where α is assumed to be equal to zero). The addition of this term allows the variance to differ from the mean as:

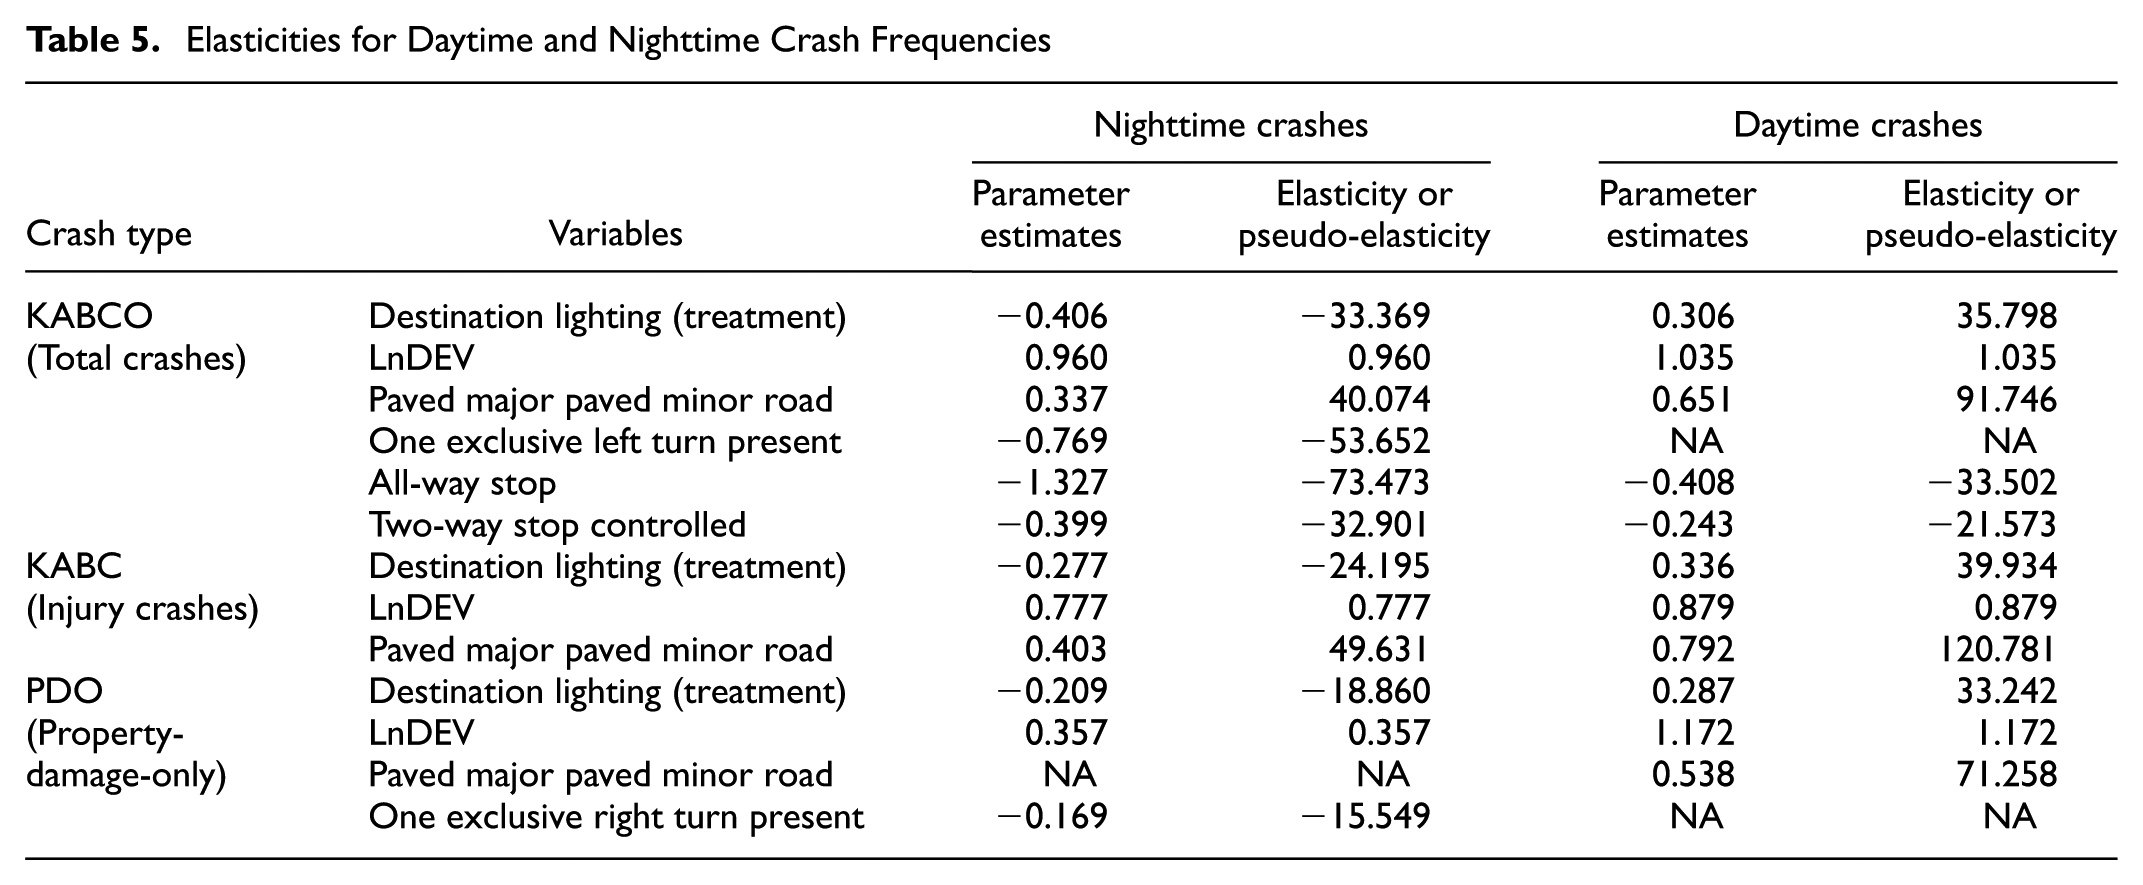
Elasticities were calculated according to Donnell et al. ( 10 ). Elasticities can be defined as the percentage change in expected crash frequency given a 1% change in a continuous explanatory variable. For log-log functional form, it is simply calculated as the parameter estimate. Pseudo-elasticities were calculated for indicator variables. Pseudo-elasticities represent the percentage change in expected crash frequency given a change in the value of the indicator variable from zero to one. The elasticity of the expected crash frequency for an indicator variable can be defined as Equation 7:

Results
Donnel et al. ( 10 ) also used negative binomial regression to model night and day crash ratios. Elasticities for continuous variables like AADT and pseudo elasticities in the form of percentages for indicator variables in the model were calculated according to a study by Donnell et al. ( 9 ). The elasticities computed based on the daytime and nighttime crash frequency models shown in Table 4 are provided in Table 5.
Nighttime and Daytime Crash Frequency Models
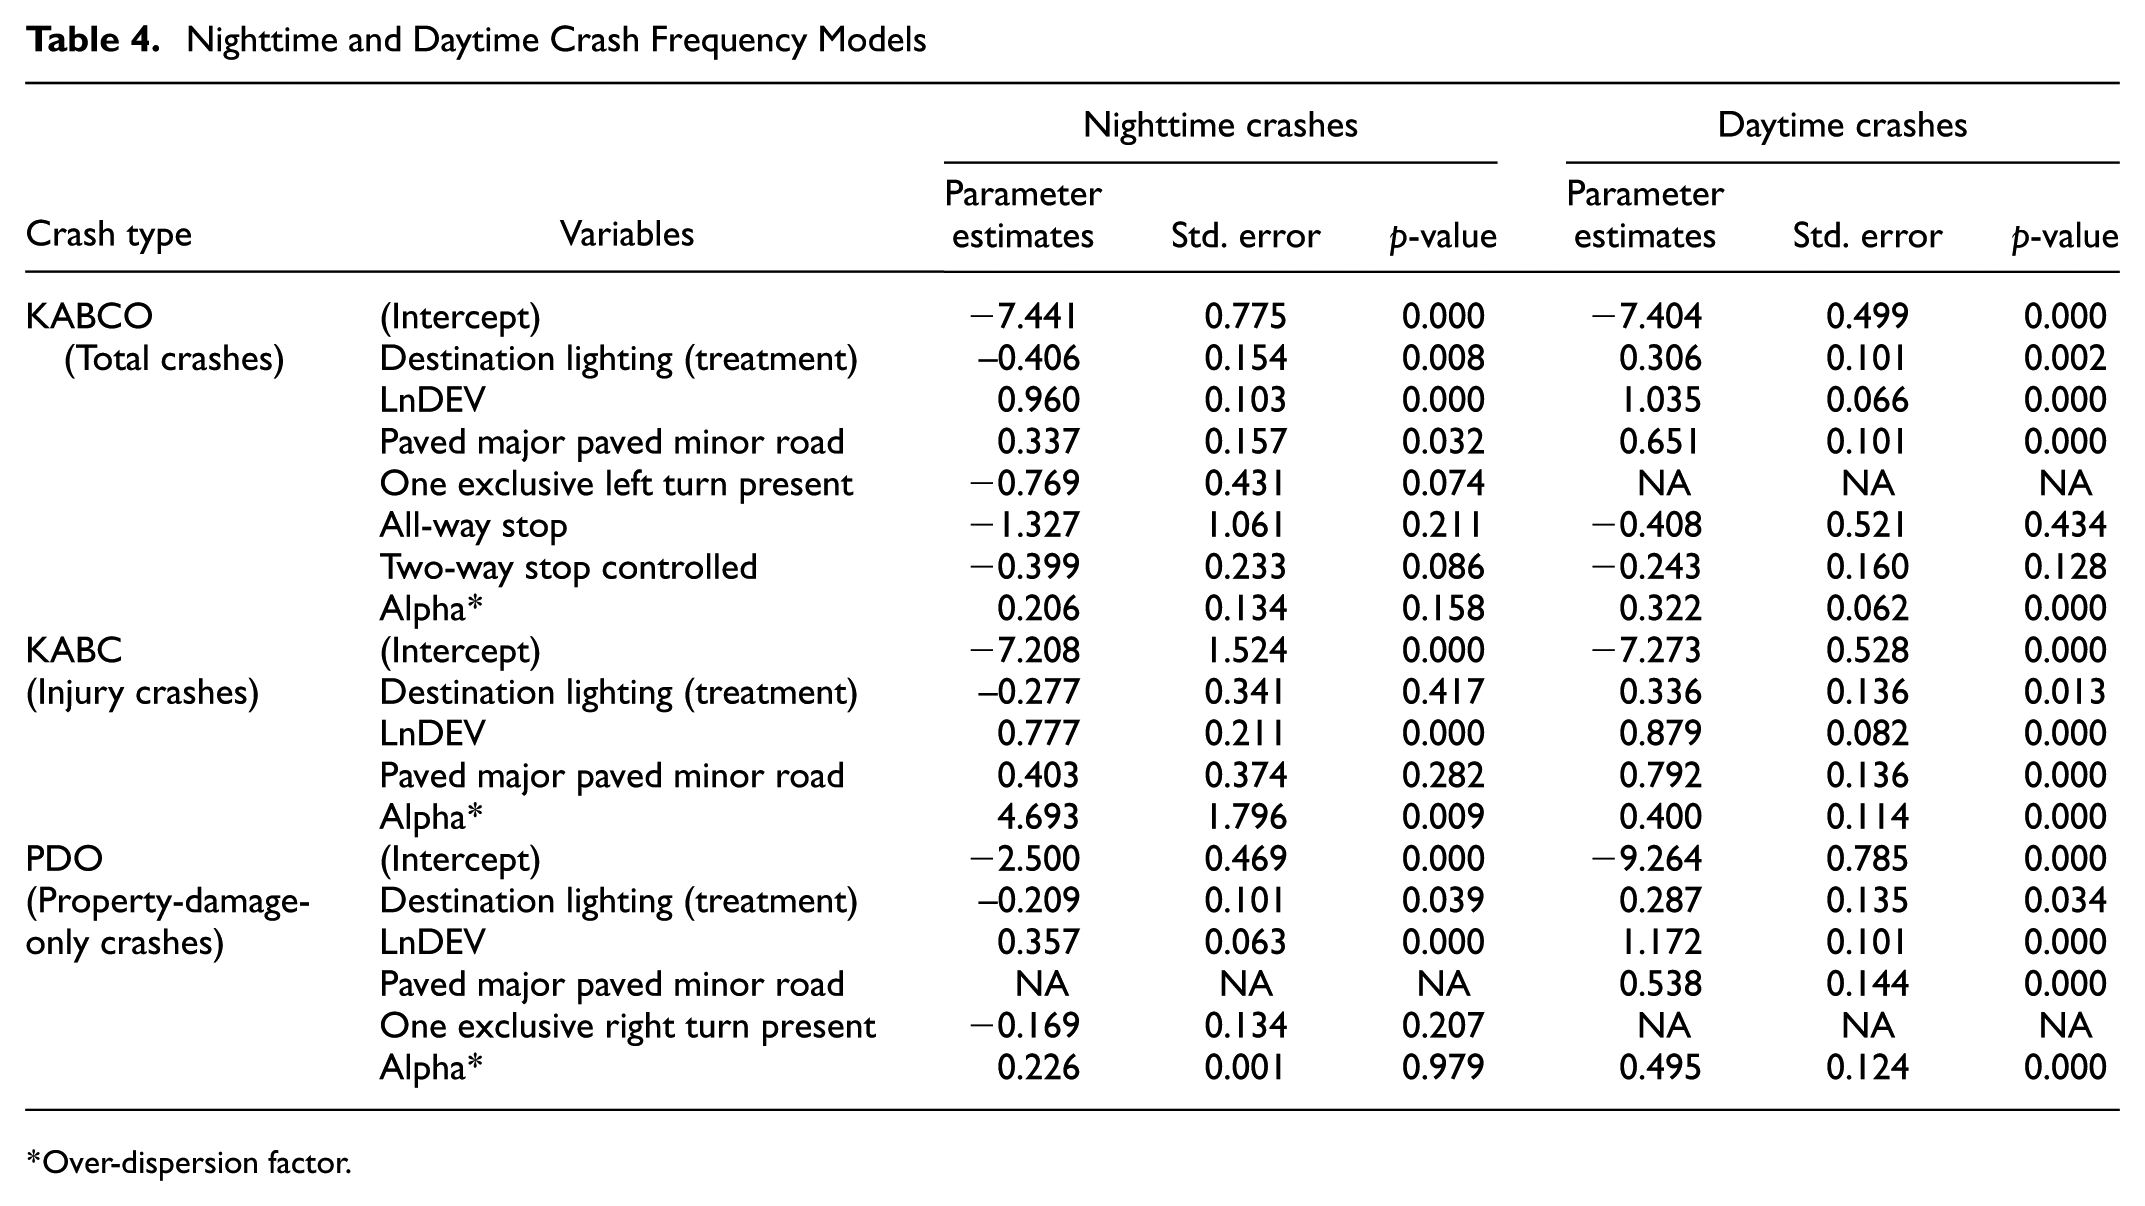
Over-dispersion factor.
Elasticities for Daytime and Nighttime Crash Frequencies
Separate models for nighttime and daytime crashes were evaluated. The parameter estimates of the statistically significant variables (at 95% confidence level) in the cross-sectional models are shown in Table 4. The standard errors and p-values are also provided for the parameter estimates or, in other words, beta estimates in Table 4. It can be seen from Table 4 that the coefficient of destination lighting is negatively related to all types of nighttime crashes which suggests that destination lighting has the potential to reduce nighttime crashes.
The elasticities for daily entering volumes are similar across all the nighttime and daytime crash frequency models. In both cases, however, the nighttime elasticities are lower than the daytime elasticities. A 1% increase in major road average AADT was associated with approximately a 0.4% to 1.2% increase in crash frequency. It was seen that the treatment elasticities change sign when the expected daytime and nighttime crash frequencies across all models are compared. This suggests that the presence of treatment or destination lighting is associated with a 33%–39% increase in daytime crashes across all models, but was associated with an 18%–33% reduction in nighttime crashes.
Injury nighttime crashes decreased by 24% and total nighttime crashes by 33%. Property-damage-only crashes were reduced by 18%. The correlation between increased daytime crashes and destination likely suggests the treatment was applied at locations with a higher number of crashes.
The presence of an exclusive left-turn lane reduced total nighttime crashes by 54%. All-way stop and two-way stop controlled intersections were safer than the one-way stop controlled intersections for both daytime and nighttime total crashes. Since only four-approach intersections were included, a one-way stop controlled intersection was the rare situation where only one of four approaches had stop sign control. Intersections with paved major as well as paved minor roads did not show any safety effect when compared with intersections with paved major and unpaved minor roads across all the models. The presence of an exclusive right-turn lane reduced property-damage-only nighttime crashes by 16%.
Discussion
This study examined the safety effectiveness of the installation of destination light at stop controlled cross intersections in Iowa. Preliminary night-to-day crash ratios showed the night-to-day crash ratio for treatment sites with destination lighting was 0.19 while the ratio for control sites was 0.38. This indicated that around 0.19 nighttime crashes result for every daytime crash at treatment sites while around 0.38 night crashes occur at control sites for every daytime crash. Thus, this simple comparison showed that the ratio of night-to-day crashes at treatment sites is about 50% lower than for control sites.
Various factors affecting the frequency of crashes occurring on the study sites were also analyzed. Propensity score matching using the caliper width technique was used to match treatment and control sites in this study. Crash frequency data were analyzed using negative binomial regression models. The presence of treatment or destination lighting was associated with a 33%–39% increase in daytime crashes across all models, but was associated with an 18%–33% reduction in nighttime crashes. This suggests, as expected, that destination lighting has been utilized at locations which exhibited a crash problem. As a result, destination lighting provided a significant safety benefit. Injury nighttime crashes decreased by 24% and total nighttime crashes reduced by 33%. Property damage crashes were reduced by 18%.
Ultimately, the results of this study provided important insights that may be used for understanding the importance of providing destination lighting at stop controlled cross intersections. Moving forward, the extensive databases developed as a part of this study may also be supplemented with additional information, such as shoulder information and information of guard rails. As intersections continue to be an emphasis area for improving safety, the identification of these factors will allow for the proactive and cost-effective implementation of various safety measures.
Footnotes
Acknowledgements
The team wishes to thank the Iowa Department of Transportation and the Midwest Transportation Center who provided funding for this project.
Author Contributions
The authors confirm contribution to the paper as follows: study conception and design: Hallmark, Goswamy, Pawlovich; data collection: Litteral, Goswamy; analysis and interpretation of results: Hallmark, Goswamy, Pawlovich; draft manuscript preparation: Hallmark, Goswamy, Pawlovich, Litteral. All authors reviewed the results and approved the final version of the manuscript.
The Standing Committee on Visibility (AND40) peer-reviewed this paper (18-05605).