
Abstract
Steel-concrete composite construction is used extensively in bridges across North America. The welded shear stud is the standard connector used today, but other connectors, such as the through-bolt connector, may have advantages for precast construction or applications where better fatigue resistance or deconstructability is desired. The standard method of assessing the performance of a shear connector is through the use of push tests. However, the load-slip curves that result from these tests do not accurately predict load-slip behavior at the shear interface of the beams and girders they are meant to simulate. In this paper, a model is presented that predicts composite beam behavior using elastic material properties and nonlinear shear connector load-slip curves. The finite element (FE) model features link connector elements between a steel beam and concrete slab that can be programmed to simulate different connector types. Although the model can be used with push test load-slip curves as inputs, it is shown that a much better prediction can be made using force-deformation data from experimental beam tests or FE analysis. Results are discussed for stud connectors and through-bolt connectors, and it is shown that while through-bolts allow more interfacial slip and overall deflection, material stresses and composite interaction are not affected as much as might be expected. The outcome of this work is a comparison tool which can be used to assess the viability of current and future shear connection alternatives with the goal of achieving an economical and structurally sound shear connector.
Steel-concrete composite construction is common because it is a structurally efficient use of material, and the resulting geometries are well suited for many structural applications. The role of the shear connector is to tie the materials together at the interface, allowing the transfer of longitudinal shear forces. Mechanical shear connectors are used extensively in composite construction for building floor systems and bridge deck systems. The welded shear stud is by far the most common connector type currently used in new construction; the welding process is completed using efficient stud-gun welding technology, and the connection between steel beams or girders and cast-in-place concrete is stiff and ductile. However, the welded stud connection has drawbacks when considering fatigue performance, disassembly (for bridge re-decking or replacement), and precast construction. The through-bolt connection may have certain advantages over the welded shear stud, including fatigue performance and rapid non-destructive deconstruction, but proper validation of performance is required. This connection features high strength through-bolts that clamp precast deck panels to beams or girders, relying on friction and dowel action to transmit interfacial shear.
A common test to assess the performance of a shear connector is called a push test. Push tests feature a vertical steel beam connected to two concrete slabs with shear connectors that are tested in direct shear. Although widely used, the push test fails to take into account bending, interfacial friction, and force redistribution between connectors. The output from a push test is a load-slip curve that gives information about the strength, stiffness, and ductility of a connector, but fails to provide a complete quantitative measure of the degree of composite action it will provide. Ultimately the role of a shear connector is to induce composite action, and a push test fails to assess a connector directly in this regard.
The main alternative to push tests is scaled beam tests, which are expensive and can be impractical. The research presented herein circumvents this issue by combining the use of push tests and basic composite beam finite element (FE) modeling to create a practical and accurate way to assess the performance of shear connectors under static loading, and conditions where the steel and concrete materials are behaving elastically. It can also be used to find accurate individual connector stress ranges to optimize fatigue design. The model presented has been validated through laboratory beam tests and a detailed 3D solid FE model.
Shear Connection and Composite Interaction Concepts
The degree of shear connection and the degree of composite interaction in a composite beam are concepts that are commonly misunderstood and frequently used interchangeably. It is necessary to define both of these terms clearly, as they are essential for evaluating shear connection performance. The degree of shear connection refers to the equilibrium of forces in a composite beam at the ultimate strength limit state (ULS), while the degree of composite interaction deals with the compatibility of displacements (and strains), namely the shape of the strain profile through the depth of a given section ( 1 ). The two terms are related to each other, but they are not interchangeable.
The degree of shear connection, η, is shown in Equation 1 and is defined as the ratio of the ultimate shear strength of the interface in a shear span, Fi, to the minimum strength necessary for the section to develop its full composite flexural capacity at the end of the shear span, Ff.

Figure 1a shows the longitudinal equilibrium of forces at the ULS for a full shear connection (η = 1), partial shear connection (0 < η < 1), and no shear connection (η = 0). In design codes, the shear strength of the interface is calculated using the ultimate strength of all shear connectors in the shear span (Ascfu), neglecting friction and bond. The section can reach its full flexural capacity when Fi is equal to Ff, which is the lesser of the steel beam area multiplied by the yield strength of the material (Asfy) and the product of the stress block factor α1, the concrete area Ac, and the 28-day compressive strength of concrete, f′c. It should be noted that the shear span is determined using a moment envelope for moving loads, and is independent of the load at any given time. As a result, a beam or girder can be described as having a constant degree of shear connection.
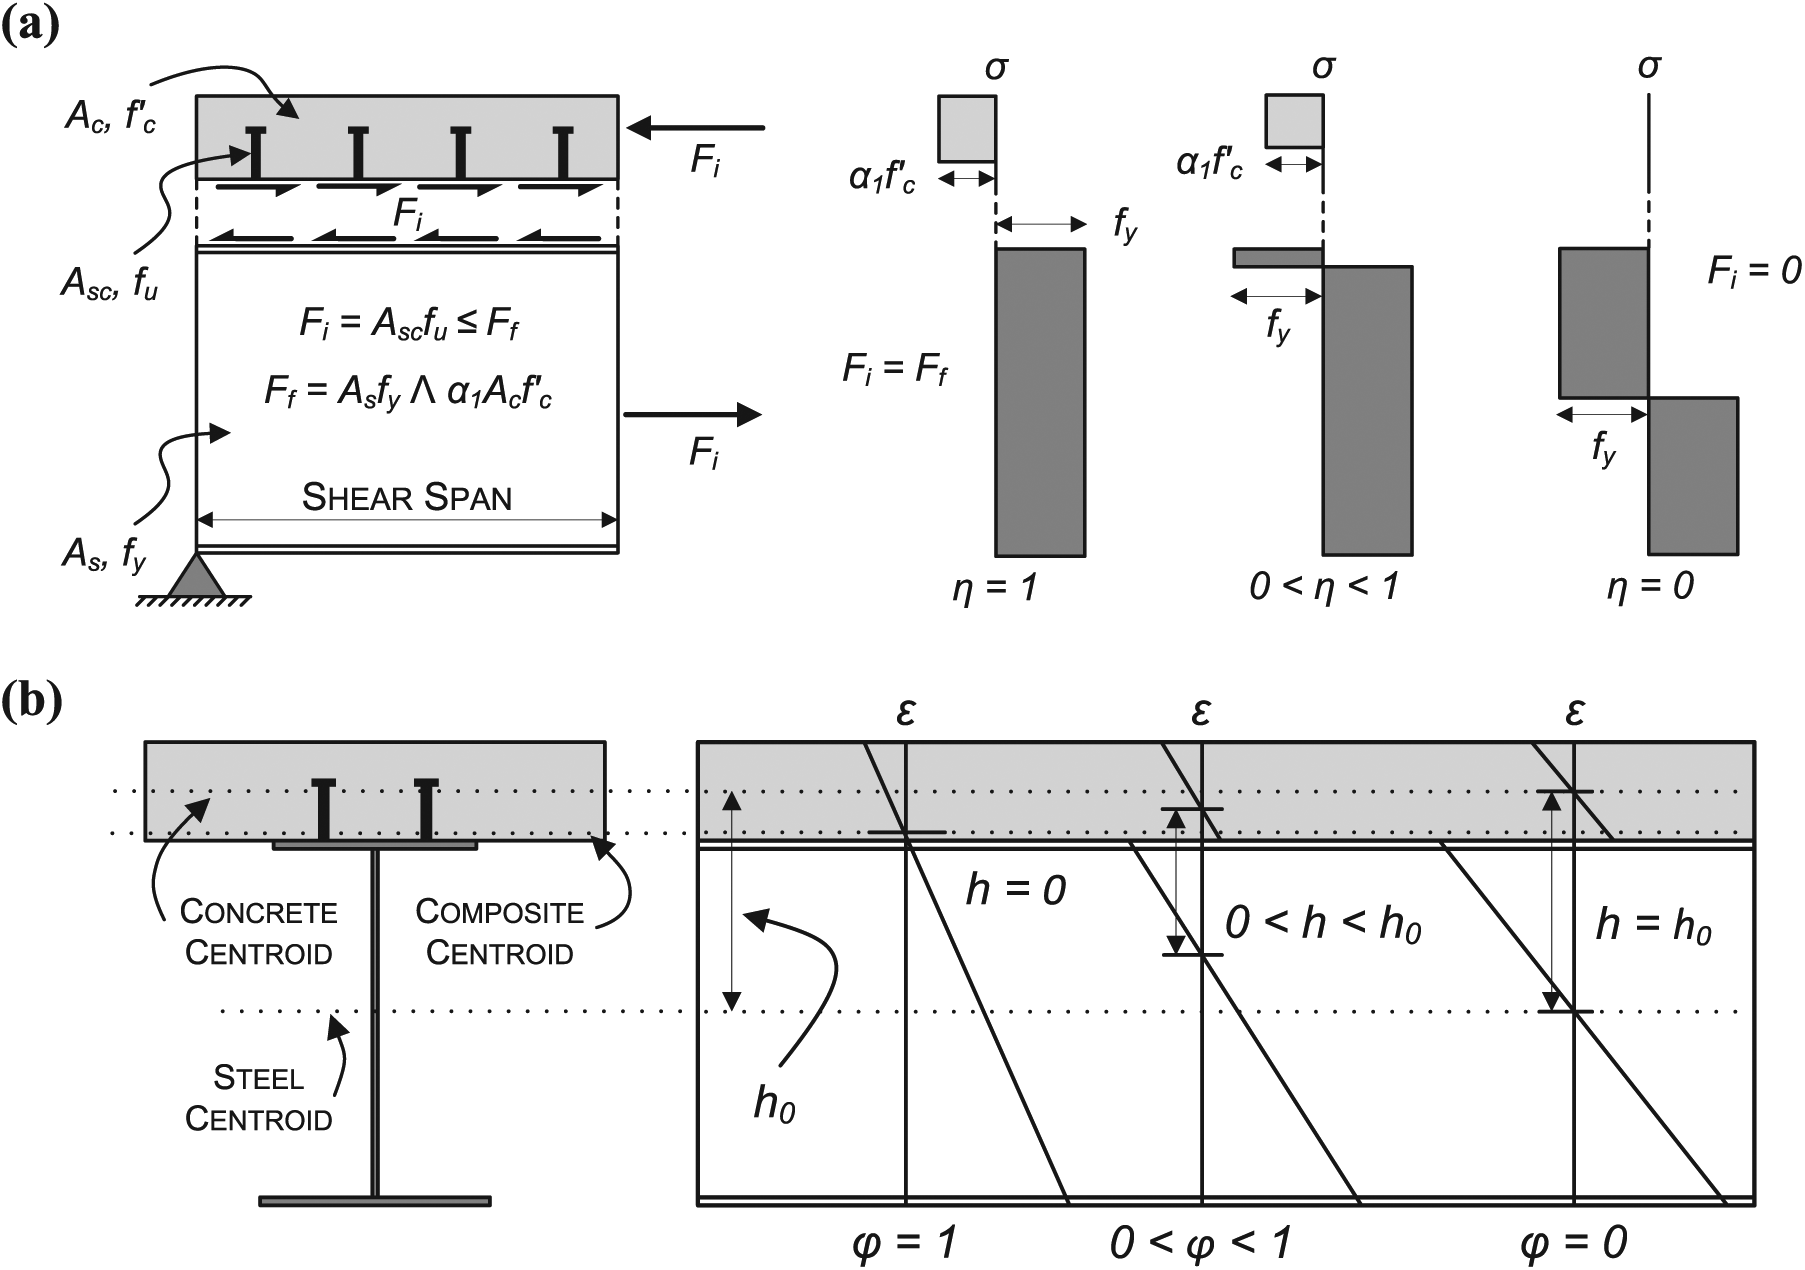
Degrees of (a) shear connection and (b) composite interaction.
The degree of composite interaction, ϕ, is difficult to define completely without the use of differential calculus and compatibility equations. In 1951 Newmark et al. published a classic paper on linear elastic partial-interaction theory, which was later extended and simplified. The laborious theory development will not be shown here (see ( 1 , 2 )). Instead, since the calculation of the degree of composite interaction is not required in the design, a simplified definition shall suffice. This simplified degree of composite interaction is given by Equation 2 and is defined using the ratio of the neutral axis separation, h, to the maximum neutral axis separation, h0. This maximum neutral axis separation is the distance between the steel and concrete neutral axes if there was no composite interaction (i.e., steel and concrete are bending on their own and share the same curvature). Figure 1b shows three beam strain profiles illustrating full or complete interaction (ϕ = 1), partial interaction (0 < ϕ < 1), and no interaction (ϕ = 0). It should be noted that all mechanical shear connectors require slip to resist force, and thus full interaction is only possible through a stiff chemical bond. The strain discontinuity in partial and non-interactive strain profiles is indicative of interfacial slip. This slip strain (or slip per unit of beam length) can be integrated over the length of the beam to find the total slip at any point.

Unlike the degree of shear connection, the degree of composite interaction is not defined at a particular section along a composite beam, nor is it defined under a particular loading condition. As a result, a beam or girder cannot be described as having a constant degree of composite interaction. The degree of composite interaction changes with loading, over the length of the beam, and even over the life of a beam; it has been shown that the stiffness of a composite beam decreases when subjected to repeated loading ( 3 ). In contrast to the degree of shear connection, the degree of composite interaction is difficult to calculate by hand. Due to its simplicity and ease of calculation, the level of shear connection is commonly used to characterize composite action for design purposes. This is despite the fact that the degree of composite interaction is the actual measure of the performance of connectors along the shear interface, since it directly measures the ability of the connector to resist slip and transfer force into the concrete slab.
Background
Design Assumptions
To simplify the design and analysis of composite beams, the degree of composite interaction is often assumed to be complete (100%), particularly in design codes. Newmark et al. stated, in 1951, that this assumption is reasonable for a properly designed beam ( 2 ). Additional to the assumption of full interaction, design codes neglect the effects of friction along the steel-concrete interface, instead assuming that shear is carried only by the connectors. The Canadian steel design code for buildings places a limit of 40% on the degree of shear connection that must be provided, stating that below 40% shear connection, composite action cannot be assured ( 4 , 5 ).
In contrast to the code for steel buildings, the Canadian Highway Bridge Design Code (CHBDC) ( 6 ) and the AASHTO Load and Resistance Factor Design (LRFD) Bridge Design Specifications ( 7 ) do not permit partial shear connections, stating that the full capacity of a composite section must be developed through shear connection regardless of the loading conditions ( 6 , 8 ). Yura, Methvin, and Engelhardt contend that current bridge code design rules may require an excessive number of shear studs, to the point where it can be difficult to fit them all in the beam ( 3 ). They recommend that partial composite action be considered for bridges, so that shear connection design is based on required strength and not on cross section properties, and that the lower limit for shear connection should be placed at 50% ( 3 ). However, one should keep in mind that in most bridges the number of shear connectors required is governed by the fatigue limit state, and this may require more studs than a full shear connection in any case.
Partial Shear Connection and Strength
The basic effect of a partial shear connection on strength is that it theoretically changes the ultimate failure mode of the composite beam to failure of the shear connectors. Additionally, as the number of shear connectors decreases, the degree of composite interaction also decreases and interfacial slip increases; concerns regarding cyclic interfacial slip may be the primary motivation for requiring a full shear connection in bridges. According to Yura et al., partial shear connection construction has been used in the building industry since 1969, and the majority of composite beams designed today use a partial connection ( 3 ). The reason is that a partially shear-connected beam is very efficient; it can be shown that a beam with 50% shear connection will have approximately 75–85% of the moment capacity compared with the same beam with 100% shear connection. It may be thought by some that having a full shear connection carries significance when it comes to preventing interfacial slip. However, from the definitions laid out previously, it is clear that slip depends on the stiffness of the connection, not on the strength. As a result, there is no transition in the way a composite beam behaves as the level of shear connection reaches the “full” value. The only change that occurs is in the overall failure mode of the beam; with a partial shear connection the failure mode is no longer controlled by the cross section, but is instead initiated in the shear connection itself. This itself is dubious, since the magnitude of interfacial slip required to fail a shear connector (under static loading) is not likely to occur.
Partial Composite Interaction and Fatigue
The assumption of complete interaction in composite beams is conservative from a fatigue perspective. Complete interaction assumes that shear connectors are rigid, and therefore attract or develop more connector shear force than they actually do. The elastic calculation of shear flow with a full interaction assumption leads to overestimated connector design shear forces. Despite not being accounted for, it is known that partial interaction is inevitable under service loads when mechanical shear connectors are used, and although the interfacial slip only has a small effect on strength, it can have a significant influence on the fatigue life of a composite beam or girder. In the past, rigorous hand calculations would have been needed to calculate the beneficial effects of partial interaction and interfacial friction. At present, however, commercially available FE analysis packages enable modeling that will take partial interaction into account based on known (input) connector stiffness or load-slip response. This stiffness data can be in the form of a single number (termed the “modulus of shear connectors” by Newark et al.), or a full load-slip curve obtained from shear connector push tests ( 2 ). Furthermore, Oehlers and Seracino ( 9 ) devised a simplified method to incorporate partial interaction into design or analysis, by using linear segments to approximate the shear flow force range envelope obtained from computer simulation and partial interaction theory. Even small reductions in the connector design force manifest themselves in significant extensions of fatigue life.
Comparison of Push Tests and Beams
Mechanical shear connectors were first proposed for composite construction in the 1920s, but it was not until the 1960s that systematic testing began. The use of push tests began early on as both an ultimate and fatigue strength measurement tool. A push test is a relatively inexpensive test used to study shear across an interface, meant to replicate the longitudinal shear in a composite beam. Push tests remain standard practice today (see Eurocode 4 Annex B, ( 10 )). Although they have been confirmed as a reliable method for determining shear capacity ( 9 ) they do not perfectly simulate the shear behavior in a beam. The value of push test results is questionable due to the difference in boundary conditions that results ( 11 ). In a push test, the shear forces on individual connectors remain constant relative to one another throughout the test. A beam test, on the other hand, features force redistribution; when one shear connector begins to crack and fail (in fatigue, for example), other neighboring connectors compensate and accumulate shear force, and the crack grows more slowly because the cracked connector now attracts less force. Additionally, the force being transferred to the slab does not remain constant as connectors begin to plastically deform. Furthermore, a beam test engages friction at the slab-beam interface, which lessens the force transferred through the connectors.
It is worth comparing the strain profile of the composite section in the push test and beam test cases, and discussing the interfacial slip. The key difference between beams and push tests is in the way the connector shear forces arise. In the beam, the externally applied load causes a strain gradient with a discontinuity at the interface (also called “slip strain”), and connectors are subjected to shear force in order to resist the accumulation of slip due to the strain discontinuity along the length of the beam. In a push test, however, connectors resist shear force because they are part of the load path between the applied load and the balancing reaction at the base of the specimen. A push test is determinate, while a composite beam is not. Figure 2 shows the strain profiles and final deformed shapes in each case.
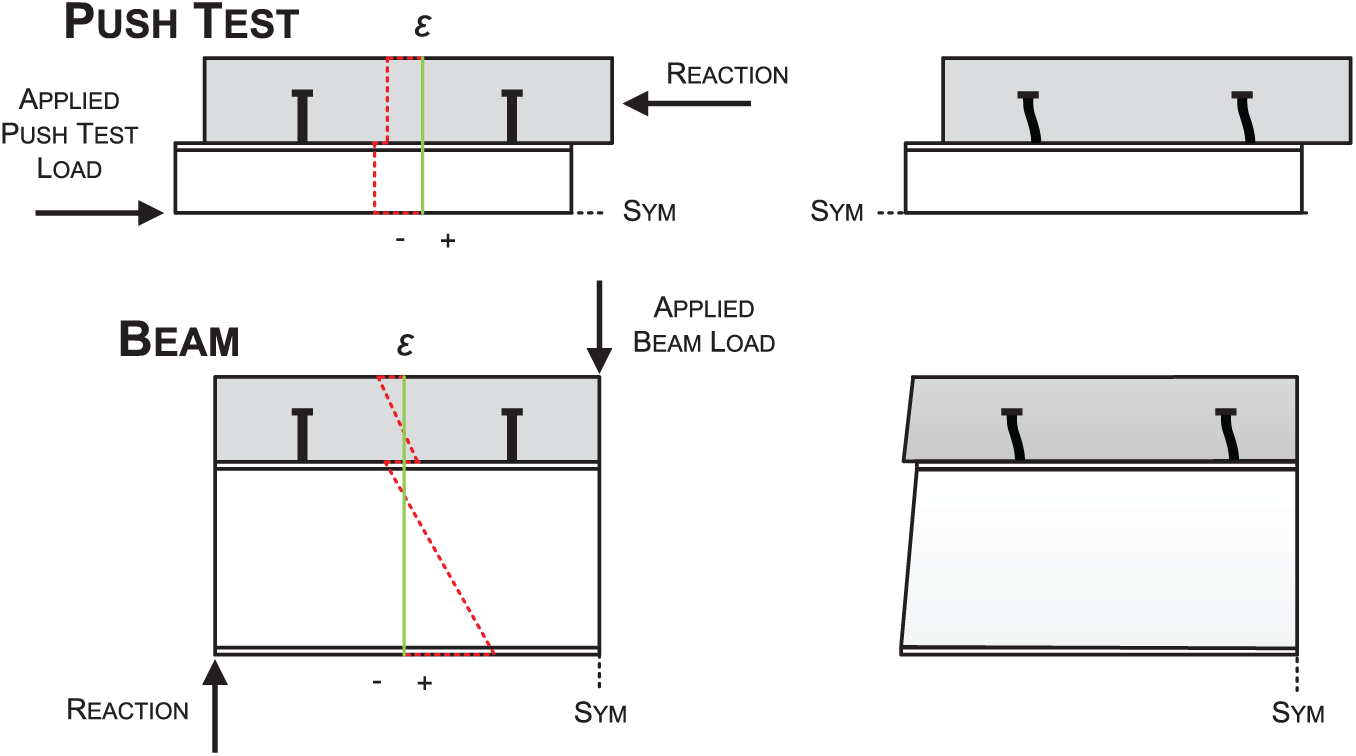
Strain profiles in push tests and beams.
A push test is useful for generating load-slip curves for shear connectors. These curves give information about connector strength, stiffness, and ductility. The drawback of the load-slip curve is that it does not give a quantitative indication of the composite action that may result from the presence of a connector in a beam. Since the induction of composite action is the primary function of a shear connector, a model is needed to evaluate connectors on this basis.
Research Challenge and Objectives
The main objective of the modeling procedure developed and described here is to provide a tool to evaluate shear connectors for their intended behavior. This behavior includes the degree of composite interaction that results from the shear connection, and by extension includes cross-sectional stresses, and beam deflections. The analysis tool will allow for the comparison between connector types with known load-slip curves, including studs and through-bolts, as well as other shear connection types. In the following sections, an FE model is presented, which takes a load-slip curve from a push test, and uses this curve to model the composite beam and slab behavior through the use of multilinear links. In addition, a shear stud force-deformation relationship obtained from a beam test will be used as the model input and the results will be compared with those obtained using data from push tests.
Finite Element Analysis
FE Beam Model Description
A SAP2000 model was programmed using the CSi Application Programming Interface (API) ( 12 ). The model works in conjunction with a spreadsheet, which contains necessary geometry and material data. In particular, the spreadsheet contains the load-slip properties of the shear connectors, represented as multilinear links with load-slip behavior defined by the user. This load-slip behavior is the key variable in the research presented. The model contains simplifications, including elastic material behavior for the steel and concrete, which allow it to run analyses quickly. As a result, validation of the model was necessary in order to assess the significance of these simplifications.
Figure 3 depicts the prototype composite beam to be modeled and a schematic of the model. The concrete deck is represented by shell elements, while the model uses beam elements for the steel beam. The two are connected using multilinear link elements representing shear connectors. The model uses a “division” size specified by the user, which splits the deck and steel beam into segments. The division size is recommended to be small (about 25 mm or 1 inch) to allow for versatility in accommodating different connector spacings and for more locations where data is output (link elements can only connect to shell and beam element ends and edges). In order to prevent ingress (overlap) between the concrete deck and the steel beam, gap link elements were used at every division and given rigid properties in the vertical direction. Friction is not included in the beam model at any point in this research, but is possible to implement by altering the gap link element properties.
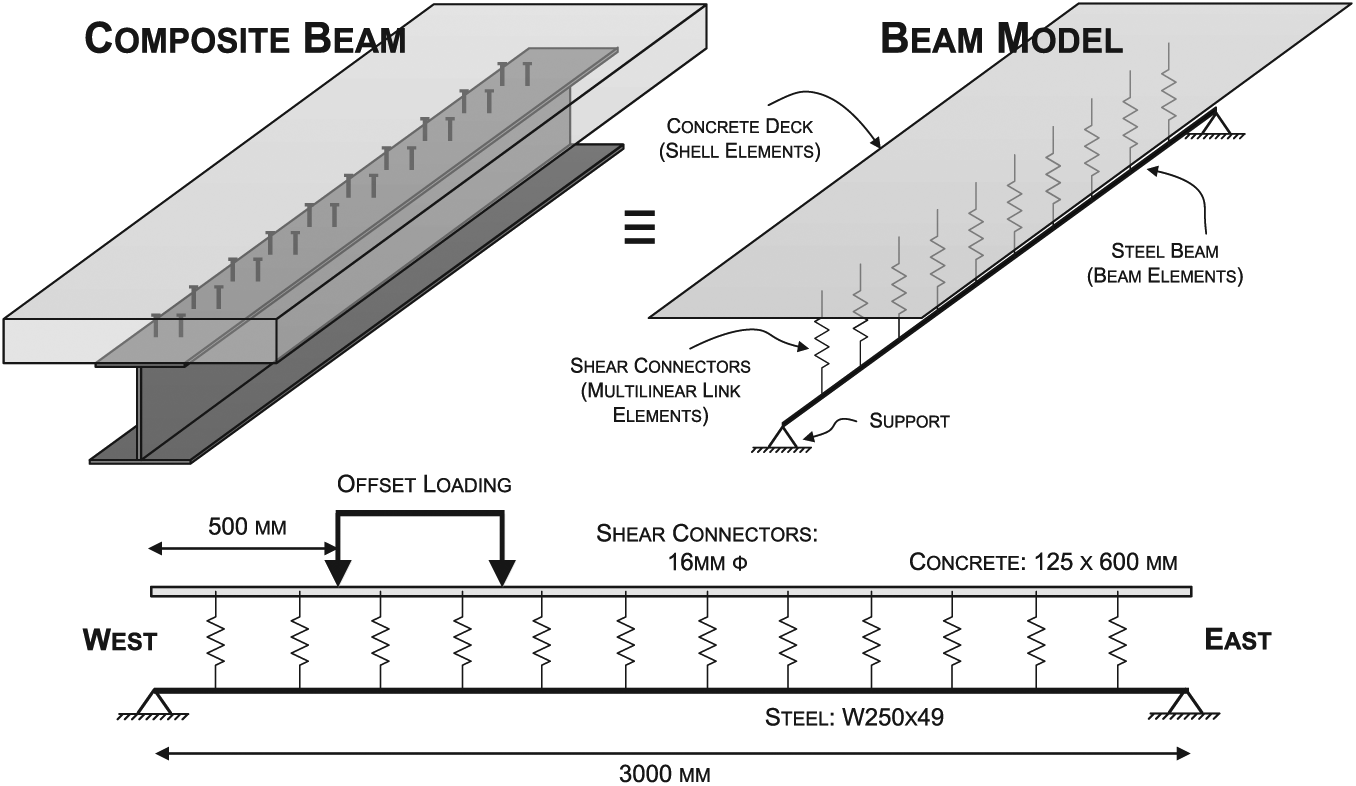
FE beam model showing element types, geometry, and loading setup.
The SAP model is set up for parametric analysis, allowing material properties, loading, and geometry (including connector spacing), to be specified by the user. However, for the purposes of this research the geometry and loading setup has been set to match beam specimens from an experimental program previously completed at the University of Waterloo ( 13 ) to allow for model validation. Validation was also completed using an ABAQUS 3D solid FE model, developed previously ( 13 ).
Model Geometry and Loading
Twelve full-scale composite beam specimens were tested to investigate the fatigue of shear connectors ( 13 ). The static tests conducted prior to fatigue testing were used to validate the SAP FE model, along with results from an ABAQUS 3D solid FE model. The specimens were simply supported with a 3,000 mm (approximately 10’) span and consisted of a W250×49 (imperial designation W10×33) steel section connected to a 600 mm (2’) wide and 125 mm (5”) thick concrete slab. The strength of the concrete was approximately 45 MPa (6,500 psi), and 24 welded shear studs per beam, each 16 mm (5/8”) in diameter, were used at a spacing of 125 mm (5”, two studs per row). The loading configuration consisted of two point loads that were offset from the beam midspan to create a varying shear diagram along the length of the beam. This geometry corresponds to a degree of shear connection of 33%. A full description of the FE model can be found in ( 11 ) and a schematic is shown in Figure 3.
Load-Slip Relationships
Three load-slip relationships were used in the SAP model for the results that will be discussed. Two of these come from push tests completed by Chen et al. in 2014 (further description can be found in ( 14 )), and the other comes from the beam tests described in the preceding section and detailed in ( 13 ). In order to obtain stud load-slip data from the beam tests, linear variable displacement transducers were used to obtain slip values before and after a row of studs, and strain gauges on the steel were used to calculate the force in the slab transferred by those studs. Each load-slip curve was approximated by linear segments, following the measured load and slip data. The curves, with loads normalized for a single stud, are shown in Figure 4, along with the force-deformation data from studs in the ABAQUS 3D solid beam model. The first three curves, which are used as the SAP model inputs, are given abbreviations for reference (shown in the Figure 4 legend). The stud beam test curve is referred to as “SBT,” the stud push test curve as “SPT,” and the through-bolt push test curve as “TBPT.”
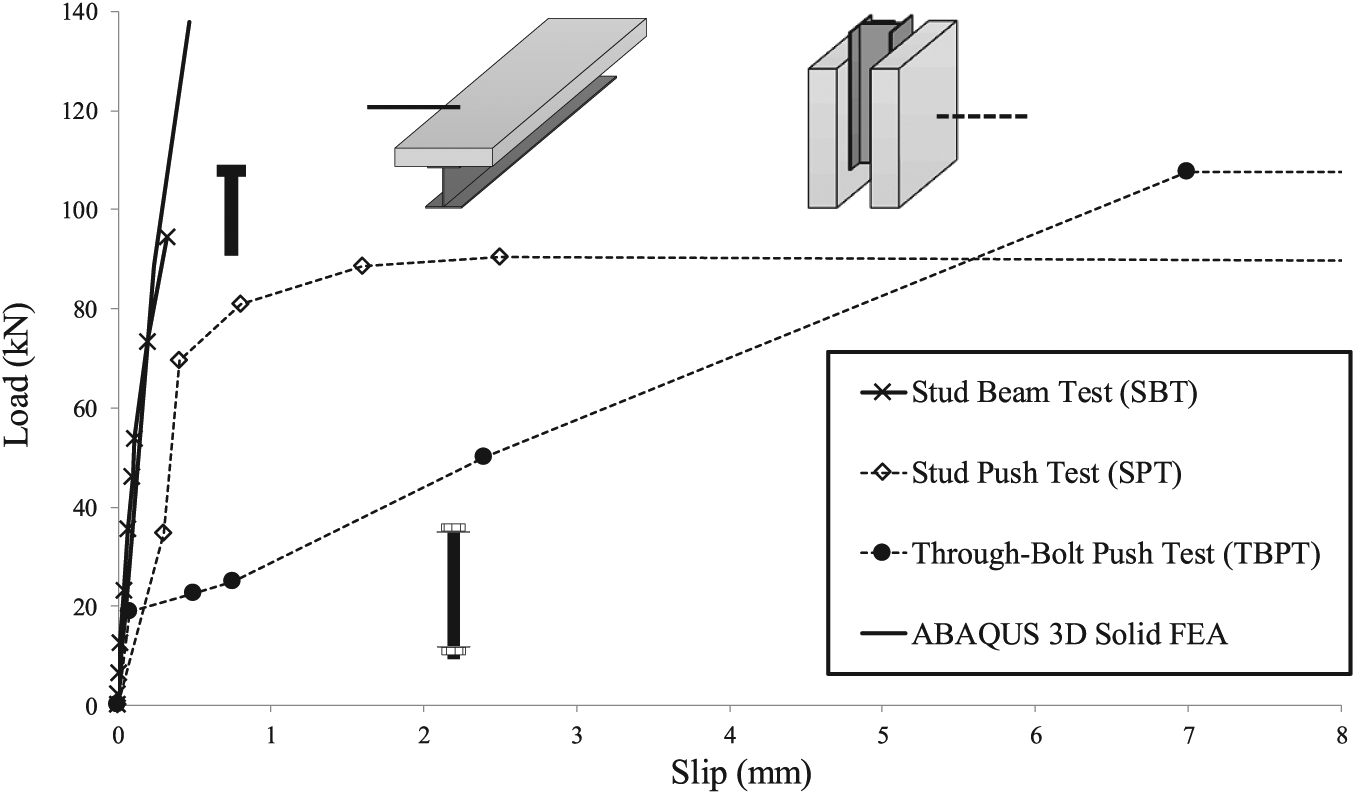
Force-deformation (or “load-slip”) curves used as SAP model inputs.
Note the strong correlation between the load-slip results from the stud beam test and the stud beam FE model; both curves are significantly stiffer than the stud push test curve, and both have higher ultimate strengths. These characteristics can be attributed to differing boundary conditions and adjacent geometry; neighboring studs prevent slip in beams, even as studs yield, and this does not occur in push tests. The early reduction in stiffness for the bolt connector is a result of the bolt slipping into bearing as friction is overcome. After this point, the stiffness is increased again and ductility and strength are achieved through dowel action of the bolt.
Results and Discussion
Comparison of Model Connector Stress and Interfacial Slip Results
A comparison of connector stresses and interfacial slips between the SAP FE results using the stud beam test (SBT), stud push test (SPT), and through-bolt push test (TBPT) load-slip curves will now be shown and discussed. Figure 5a shows connector stresses along the beam length for each analysis, along with the results of the stud beam FE results from ABAQUS and the stud stresses calculated from elastic theory assuming full composite interaction. These results correspond to a beam loading of 200 kN or 45 kips (100 kN at 500 mm and 1,000 mm from the west end, or 22.5 kips at approximately 20” and 40”). The stresses were computed using Equation 3, where V is the transverse shear, Q is the second moment of area of the transformed section, s is the connector spacing, I is the moment of inertia of the transformed section, and A is the area of the shear connector.

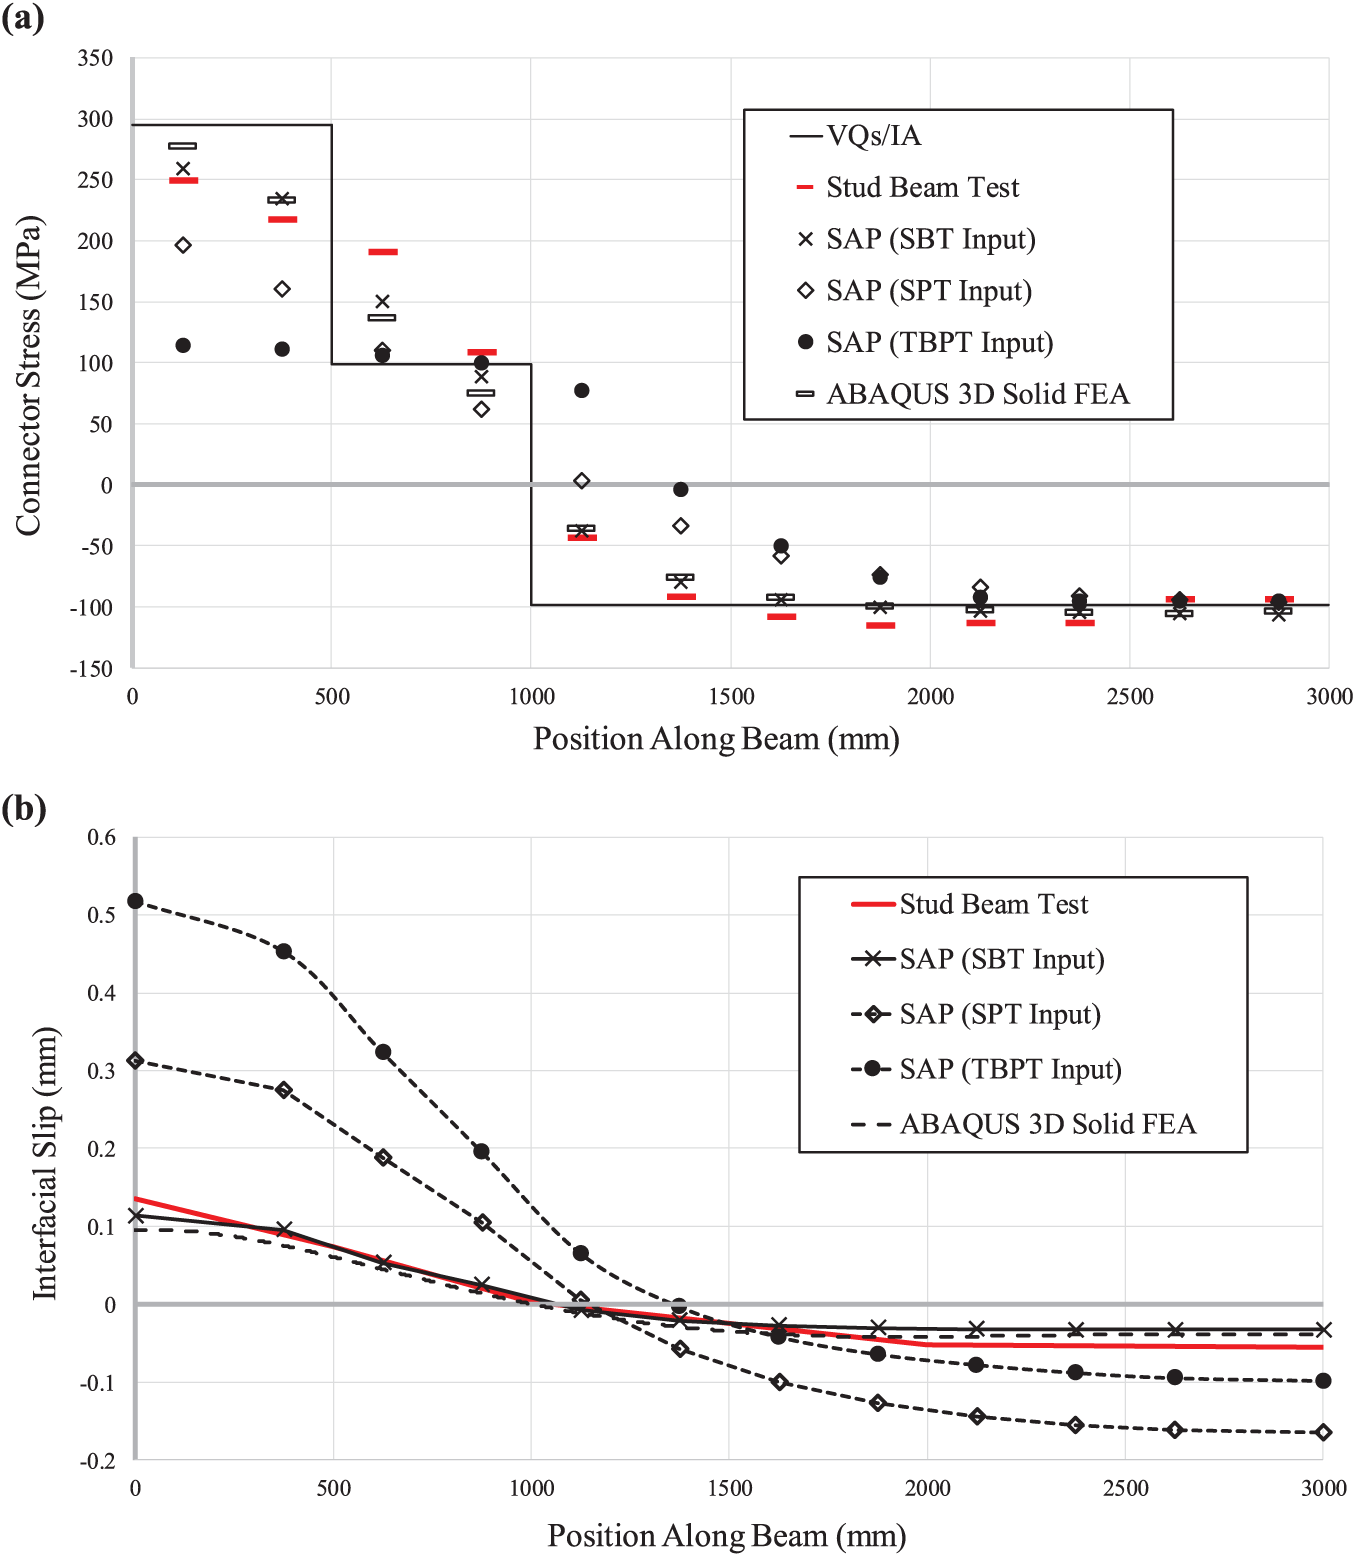
(a) Connector stresses and (b) interfacial slip along the beam for a load of 200 kN.
Note the high degree of correlation between the connector stresses predicted by Equation 3, the experimental measurements, the ABAQUS model, and the SAP model using the SBT load-slip curve as the multilinear link input. The SAP model results are within 5% of the ABAQUS FE results and 12% of the experimental measurements on average. However, using the SPT load-slip curve results in significantly lower stresses (on average 30% lower than when using the beam test load-slip curve). These results indicate that using push tests to approximate the interface shear resistance will result in an underestimation of connector stiffness and force.
In addition to examining stud connector stresses, the interfacial slip values along the length of the beam can also be compared to assess the connector performance. Figure 5b shows the predicted slip values for the three SAP model results and the ABAQUS model. Additionally, the results from the experimental beam test ( 13 ) are shown. It is apparent that the SAP model using the SBT load-slip curve gives slip values that are similar to the solid ABAQUS model and the experiment, but the SAP FE results using the push test load-slip curve give much larger slip values. The values using the through-bolt load-slip curve are even larger, owing to the reduced stiffness of that connection type.
Comparison of Model Degree of Composite Interaction Results
While connector stress and slip are important metrics, the primary goal of the analyses was to assess the connectors in terms of the degree of composite interaction they induce. Figure 6 shows the degree of composite interaction along the beam length, according to the definition shown in Figure 1b and given in Equation 2. Interaction values along the beam length vary significantly, reflecting the restraint of slip around the leading face of each connector, and less restraint on the trailing face. The “leading” connector face is the one farthest from the maximum moment (in this beam the maximum moment is 1,000 mm from the west end, denoted as the zero mm position along the beam).
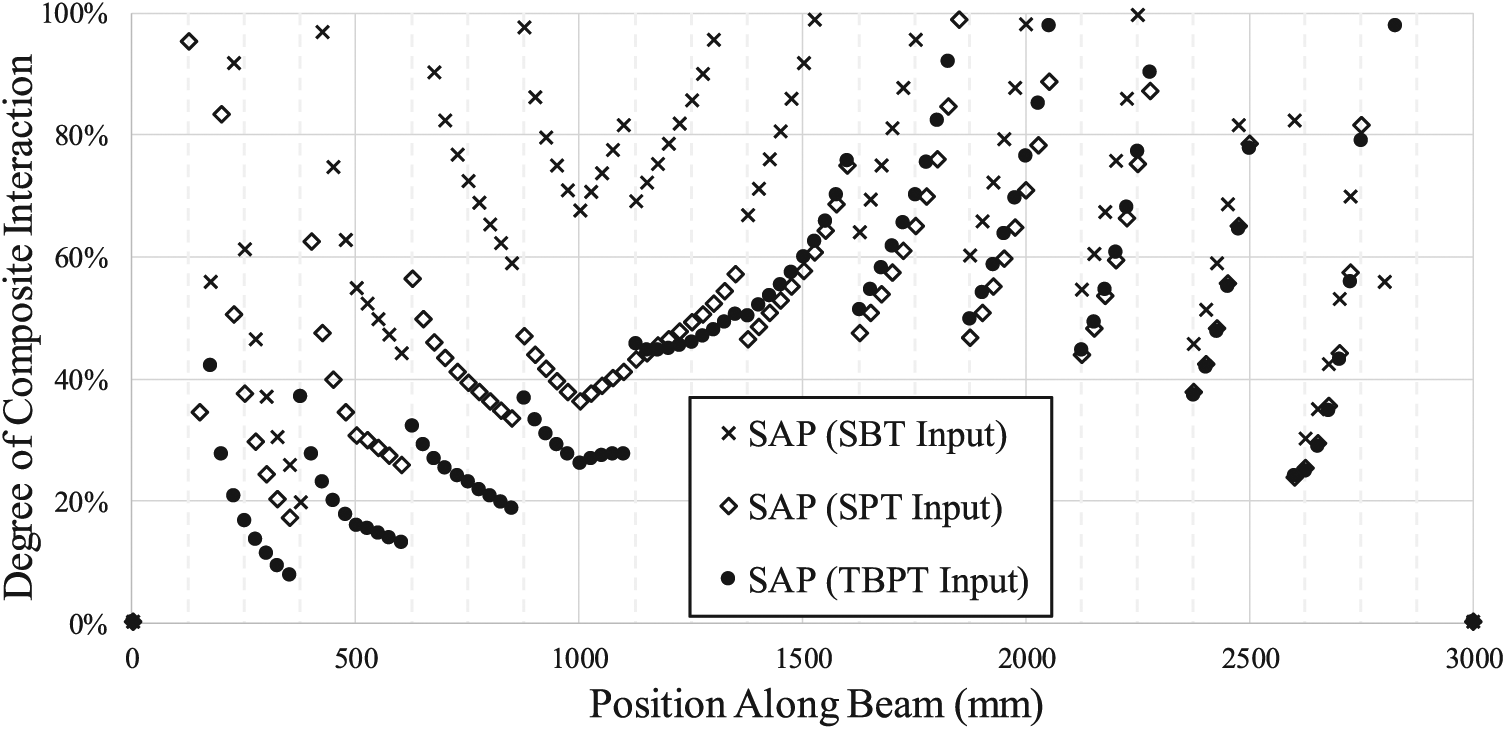
Degree of composite interaction along the beam length for a load of 200 kN.
In general, the analysis results using the SBT load-slip curve to define the link elements show higher values of composite interaction, with an average value of 69.6%, whereas the beam using the SPT curve links averaged 50.4%. Both show a parabolic trend, with the degree of composite interaction peaking around midspan. To explain the increased interaction near the point of maximum moment and the midspan one must look to Figure 5, and observe where there is the lowest amount of slip for the highest connector force. The amount of composite interaction at any point is completely driven by the compatibility of displacements, which is why the type of load-slip curve used to define the flexibility of the connector is so important to the results. All three results also exhibit larger variation toward both ends of the beam. This is because the percentage difference in the compressive force in the slab is larger on either side of the outside connectors (those toward both beam ends) than it is on the inside connectors.
The difference between the SPT results and the through-bolt results can again be seen primarily on the west end of the beam, where the slip is high (for slip values, see Figure 5). Prior to the initiation of slip in the through-bolt connection (at a connector load of about 19 kN or stress of 93 MPa, see Figure 4), the stiffness of a stud and a through-bolt connector are comparable. As a result, in the region of the beam where bolt slip has not occurred (from about 1,300 to 3,000 mm), similar levels of composite interaction develop.
Summary of Results
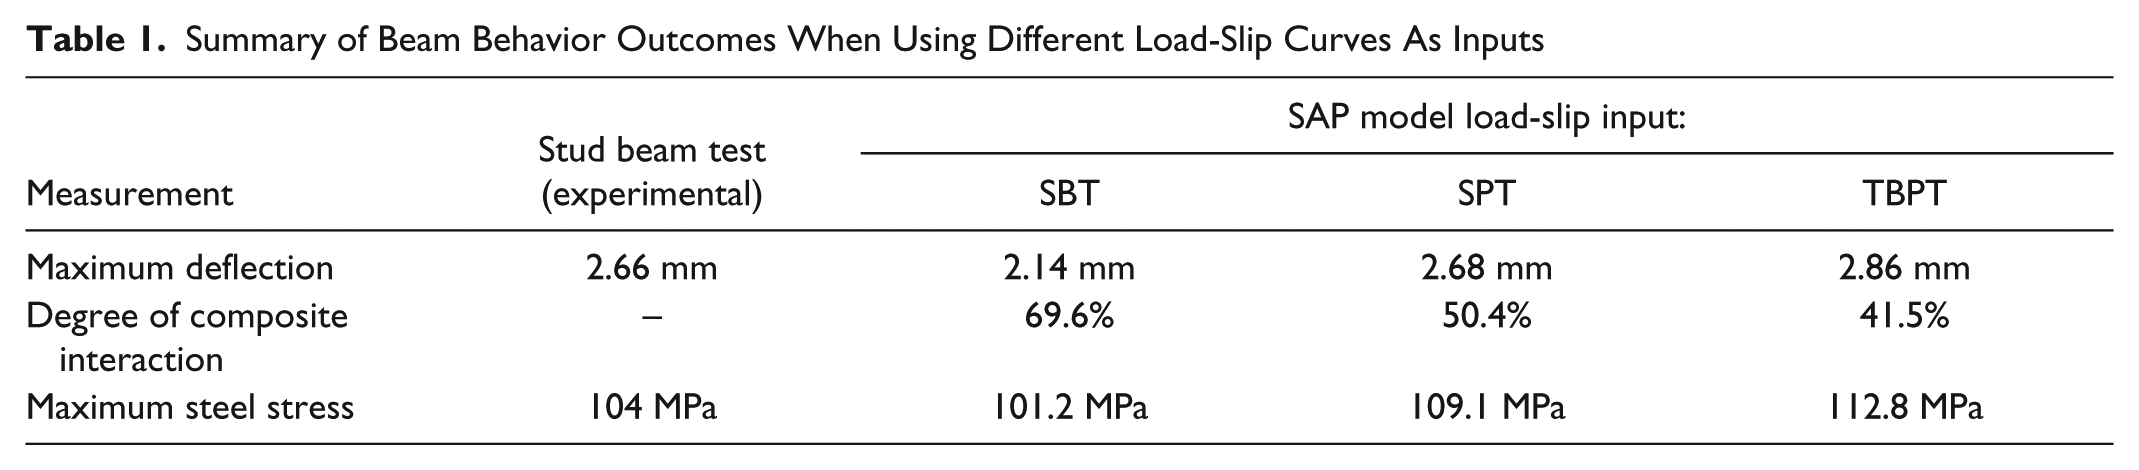
Table 1 summarizes the outcomes of using each of the three shear connector load-slip inputs, while also showing the experimental SBT results. The average deflection from the tests and the maximum steel stress lie between the SAP model results using the SBT curve and the SPT curve. Comparing the model results using the link element properties based on the push test results, the through-bolts result in a 7% increase in maximum beam deflection, an 18% decrease in average degree of composite interaction, and a 3% increase in maximum stress in the steel beam bottom flange compared with studs. The increase in the maximum stress in the beam is small compared with the overall decrease in degree of composite interaction, because the maximum stress occurs where the beam moment is highest and shear is not. The reduction in degree of composite interaction is most affected in areas of high shear where slip has accumulated. The maximum moment is, by definition, the end of the shear span and the location where the interfacial slip vanishes.
Summary of Beam Behavior Outcomes When Using Different Load-Slip Curves As Inputs
Conclusion
A simple FE model has been presented that allows for the input of a load-slip curve for a given shear connector type and outputs beam behavior including degree of composite interaction, deflection, material and connector stresses, and interfacial slip. The load-slip curve input can be in the form of force-deformation data from a beam test, or load-slip data from a push test. The work presented in this paper has led to the following conclusions:
The degree of composite interaction is the proper measure of composite performance, while the degree of shear connection only applies at the ultimate limit state, and only refers to one location along a composite beam. Although the calculation for the degree of composite interaction is not simple, it is made easier through the use of FE models, such as the one described in this paper.
Shear connector force-deformation results from beam tests are better indicators of beam behavior than results from push tests. The FE model results using the beam load-slip curve input (SBT) matched the experimental results well for connector stresses and interfacial slip.
Bolt slip in through-bolt connectors significantly increases interfacial slip and decreases the degree of composite interaction in a beam. However, it influences maximum material stresses to a lesser degree because maximum stresses do not occur in areas of high shear and slip. For a proper comparison between stud and bolt connectors, load-slip data for through-bolts should be obtained from beam tests.
Although the fatigue limit state (FLS) currently prevails over the ultimate limit state for the design of shear connectors, this may not be the case for connections using bolts. As a result, the current research may be useful for the design of full bridges to determine accurate stud stress ranges for FLS design, but it may be doubly useful for through-bolts or other novel connectors, affecting both FLS and ULS.
Additional questions about through-bolt shear connections remain, such as the effect of repeated loading on connectors above and below the bolt slip loads and how such loads may affect bolt pretension and overall connection integrity. This research is currently on-going at the University of Waterloo, and it is hoped that bolted beam tests (both static and fatigue) will contribute to the development of a viable alternative to shear studs in applications where deconstruction, fatigue resistance, and precast construction are factors.
Footnotes
Acknowledgements
Financial support for this research provided by the Canadian Institute of Steel Construction (CISC), the Natural Sciences and Engineering Research Council of Canada (NSERC), and the Ministry of Transportation of Ontario (MTO) is gratefully acknowledged. Technical input was also provided by Taylor Porter and is much appreciated by the authors.
Author Contributions
The authors confirm contribution to the paper as follows: study conception and design: Matthew Sjaarda (MS), Scott Walbridge (SW), Jeffrey West (JW); data collection: MS; analysis and interpretation of results: MS, SW, JW; draft manuscript preparation: MS. All authors reviewed the results and approved the final version of the manuscript.
The Standing Committee on Steel Bridges (AFF20) peer-reviewed this paper (18-06059).