
Abstract
Rear-end crash is the most common type of on-road traffic crash, and cell phone use contributes to the increase of rear-end crashes. The effects of cell phone use on driving performance have been thoroughly investigated in previous research with various measurements. However, change in driver’s visual performance while using a cell phone in situations with high rear-end risk has not yet been fully understood. This driving simulator study investigated drivers’ eye movement performance in a rear-end collision avoidance maneuver during cell phone conversation. Eye movement data of 36 participants were collected in a car-following scenario featuring imminent rear-end collision. The whole collision avoidance process was divided into four stages for eye movement data analysis, including normal driving stage, brake response stage, deceleration adjusting stage, and speed recovering stage. Results showed that the average pupil size, fixation duration, and dwell time on the leading vehicle increased significantly during the brake response and deceleration adjusting stages. This indicated that the drivers’ cognitive workload increased during these stages. Drivers used blink inhibition and quick saccade as a visual compensation strategy to mitigate the increased workload from cell phone use during the brake response stage. However, in the deceleration adjusting stage, the cell phone use condition led to a lower fixation frequency on the leading vehicle than in the no phone use condition. Professional drivers were found to pay more visual attention to the leading vehicle than non-professional drivers in the normal driving stage.
As information technology is developing at a rapid pace in modern society, the amount of available information increases significantly along with people’s demand, which also increases the motivations to multitask ( 1 ). Driver distraction has been recognized as an increasing contributing factor to road crashes. In the US 100-car naturalistic study, it was found that nearly 80% of the crashes and near-crashes involved driver distraction ( 2 ). The widespread use of cell phones has made this a main modality of driver distraction while driving. Many studies have shown that both hand-held and hands-free cell phone use led to an increased risk of crash involvement in both simulated situations and real-world situations ( 3 ). Specifically, driver distraction induced by cell phone use increased the driver’s involvement in rear-end collisions ( 4 ). In an observational study containing over 400 teen drivers, at least 75% of them were observed engaging in a potentially distracting behavior (coded as operating/looking at the phone) before moderate to severe rear-end crashes ( 5 ).
A growing body of research has shown the negative interference of cell phone use on driving tasks, such as the increase in reaction time ( 6 ), the deterioration of speed control and lateral control abilities ( 7 , 8 ), and the impairment of allocation of visual attention ( 9 ), and so on. Meanwhile, other research suggested that the increased workload resulting from cell phone use prompted drivers to compensate and drive more conservatively. The induced compensation actions included a larger following distance gap ( 10 ), a reduction in driving speed ( 11 ), and an increase in deceleration rate in risky situations ( 12 ).
Multitasking drivers may divert their eyes to the secondary tasks and degrade the level of attention required to attend to critical events, which can result in disastrous consequences. Visual information was considered as the main source of information in driving ( 13 ). Eye movement patterns were predictors of visual attention, and visual attention was crucial to maintain driving safety ( 14 ). According to a recent 100-car naturalistic driving study, if the drivers could balance visual attention on and off the road effectively in a near-crash situation, they would have more opportunities to avoid the crash ( 15 ). Driving simulation research showed that receiving and particularly sending text messages decreased the amount of time drivers spent looking at the forward roadway by up to 29% ( 16 ). Sodhi and Reimer found that during driving with a secondary cognitive task, drivers’ standard deviations of fixation displacements were shorter than those observed during normal driving ( 17 ). In addition to the distraction interference, drivers’ demographic factors (such as driving experience and gender) were deemed as potential factors in a traffic crash ( 18 , 19 ). Underwood suggested that one of the fundamental changes in skill that marked the transition from novice to advanced driver was the efficiency of visual search strategies ( 20 ). White and Caird classified drivers’ looked-but-failed-to-see errors accurately by discriminant function analysis using passenger conversation and driver gender as predictors ( 21 ).
Up to now, considerable research has investigated the impact of secondary tasks on drivers’ visual performance. Most of it focused on the visually based secondary tasks such as texting ( 16 ) or using In-Vehicle Information Systems ( 22 ). Some other research investigated the changes of drivers’ eye movements during a secondary cognitive task. For example, an increase in blink frequency was observed in research by Tsai et al. when drivers performed auditory and driving combined tasks, and the mean pupil diameter and horizontal vergence also increased when subjects had good performance in the auditory task ( 23 ). Research by Niezgoda et al. indicated that change in pupil size was the most sensitive measure of change in cognitive demand, whereas the fixation location and blink rate were less sensitive measures ( 24 ). In most of the research, the effects of secondary tasks on the drivers’ eye movements and visual performance were tested in normal driving situations, such as freeway driving or drivers approaching an intersection or negotiating a curve. However, the high-demand and high-risk driving circumstances, such as a car-following situation with high rear-end collision risk in which driver distraction may play an important role in safety, were barely considered in the research. It remains largely unclear how drivers’ visual search scanning strategies change and how the visual attention is affected by secondary cognitive tasks under such circumstances.
Therefore, by using a driving simulation experiment combined with advanced eye-tracking technology that provided noninvasive eye movement measures, this study investigated drivers’ visual performance in a rear-end collision avoidance process with the interference of hands-free and hand-held cell phone conversation. Various variables that can measure visual demand and cognitive workload, such as pupil size, blink frequency, blink duration, saccade frequency, saccade duration, fixation frequency, fixation duration, and dwell time were collected during the experiment.
The objectives of the study were: (1) to investigate drivers’ eye movement pattern during the rear-end collision avoidance process; (2) to identify the effects of cell phone conversation (including both hands-free and hand-held), driving experience, and gender on visual performance during the collision avoidance; and (3) to test whether there were visual compensation strategies adopted by distracted drivers.
Methodology
Participants
Forty-five participants in total were recruited for this research. A balance of driver gender (male and female drivers) and driving experience (professional and non-professional drivers) was considered in the participant recruitment. However, because of motion sickness and problems in eye movement calibration, only 36 drivers, including 17 male (eight professional and nine non-professional) and 19 female (nine professional and 10 non-professional), completed the experiment. The average age of participants was 35. Age ranged from 31 to 40 years old, with a standard deviation of 3.2 years. Each participant held a valid driver’s license with at least two years of driving experience. The professional drivers were full-time taxi drivers with an average mileage of 71.2 thousand kilometers per year and an average self-reported crash record of three per million kilometers. The non-professional drivers used their vehicles only for daily travel, and their average mileage and self-reported accident record were 20.5 thousand kilometers per year and 11 per million kilometers, respectively.
Apparatus
This study used the BJTU (Beijing Jiaotong University) driving simulator for the experiment and data collection, as shown in Figure 1a. The BJTU driving simulator is a high-performance, high-fidelity driving simulator with a linear motion base capable of operating with 1 degree of freedom. It is an automatic control vehicle composed of a full-size cabin (Ford Focus) with a real operational interface, environmental noise and vibration system, digital video recording system, and the central console. The simulated environment is projected with a front/peripheral field of view of 300 degrees at a resolution of 1400 × 1050 pixels. The simulator lab also provides the software (Simvista and Simcreator) for driving scenario design, virtual traffic environment simulation, and virtual road modeling.
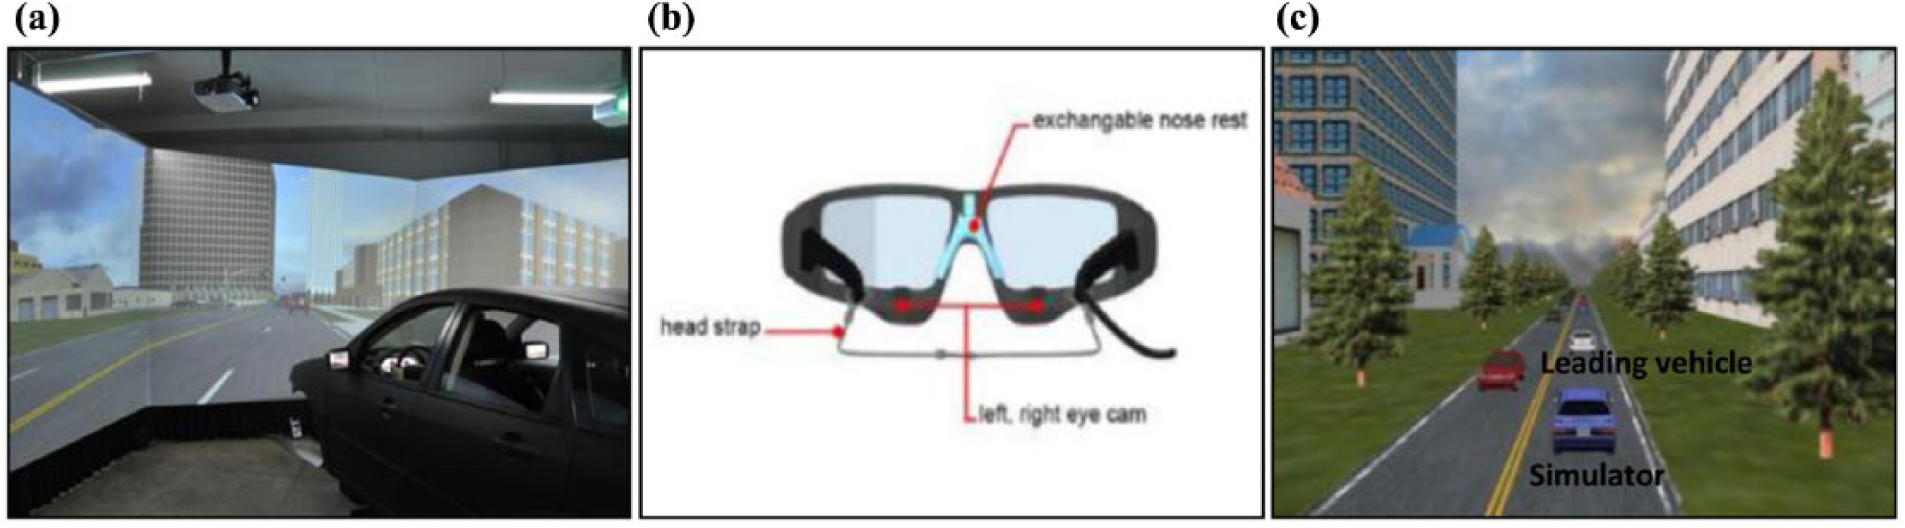
(a) BJTU driving simulator, (b) eye-tracking system, and (c) car-following scenario.
A head-mounted eye-tracking system (SensoMotoric Instruments Eye Tracking Glasses [SMI ETG]) was used to collect the participants’ eye movement data (see Figure 1b). The eye-tracking system recorded the front view and eye movements of participants. The specific data about eye movement activities (e.g., fixation, saccade, blink), such as time, duration, and counts, were extracted with the SMI software.
Scenario Design
The driving route was a 4-km, two-way, two-lane road with a speed limit of 80 km/h. A high density vehicle flow (600~700 vehicles per hour per lane) was scripted to create a car-following situation for participants and prevent overtaking maneuvers (Figure 1c). As the traffic volume was close to capacity, the operating speed of the vehicles on the road was about 40–50 km/h, which was nearly down to half of the posted speed limit. At the end of the car-following event, each participant would encounter a potential rear-end collision situation by decelerating the leading vehicle (LV) from 40 km/h to 4 km/h with a deceleration rate of 6 m/s2. The speed of the following vehicle, the distance, and the time headway between the leading and following vehicles were all non-pre-set for drivers when the potential rear-end collision was triggered. The scenario was created to mimic a common real-life driving situation in which the drivers followed the LV in an individually preferred way.
Each participant drove the same route three times under three types of cell phone use conditions. The three conditions were no phone conversation, hands-free cell phone conversation, and hand-held cell phone conversation. Each participant was subjected to only one type of cell phone conversation per drive. To eliminate the experiment order effect, the three sessions of drive were administered in a random sequence by using the “RANDBETWEEN” function in Excel. Some other measures were also taken to reduce the expectancy effects from multiple exposures to the same event. For example, several intersections and curve segments were arranged on the route before the car-following road segments to enrich the drivers’ driving experience; ambient vehicles were also arranged to travel in front of the simulator and drive away at intersections before drivers entered the test segments.
The cell phone conversation task in the experiment was a series of unit digit arithmetic problems that the drivers were requested to answer. In the hand-held situation, the participants were asked to hold the cell phone to their ear with one hand, whereas in the hands-free task the participants could use both their hands to control the steering wheel.
Experiment Procedure and Data Collection
On arrival, each participant was briefed on the requirements of the experiment and asked to read and sign an informed consent form. The participants were instructed to drive as they normally do in real-life situations. They started with a practice drive of at least 5 min to become familiar with the driving simulator. Before an actual recording of driver’s eye movement data, a “3 points” method was applied to calibrate each driver’s fixation points. After wearing the head-mounted eye-tracking glasses, the driver was instructed to gaze at three different points one by one in the front screen to complete the fixation calibration process. During the experiment, participants were also notified that they could quit driving at any time in case of motion sickness or discomfort. Between each session the participants had 10 min rest to mitigate motion sickness and learning effects.
During the experiment, the raw eye movement data were sampled at 30 Hz. Key eye movement variables extracted from the raw data included (1) pupil size, that is, average pupil diameter (mm); (2) blink frequency (number of blinks per second) and average blink duration (ms); (3) saccade frequency (number of saccades per second) and average saccade duration (ms); (4) fixation frequency (number of fixations per second) and average fixation duration (ms), the LV being selected as the area of interest (AOI) of the simulator drivers, on which the fixation details were collected; and (5) dwell time on LV (%), representing the percentage of the sum of durations from all fixations and saccades that hit the AOI.
Drivers’ Rear-End Collision Avoidance Process
The driving scenario forced the driver to perform an emergency brake to avoid a rear-end collision in a car-following situation. It should be noted that as the drivers could choose their own speed, distance, and time headway in the car-following situation, the urgency level of the potential rear-end collision might be different for different drivers. Therefore, the driving style that the driver adopted in the car-following stage might influence the subsequent rear-end collision avoidance performance and the collision result. According to the findings of a previous study, no matter which kind of car-following strategy the drivers applied, the rear-end collision avoidance process could be divided into several main stages ( 25 ). A maximum value of deceleration rate existed during the braking process, after which the drivers started to release the brake pedal. Thus the collision avoidance process was divided into four stages which were normal driving stage, brake response stage, deceleration adjusting stage, and speed recovering stage (see Figure 2). Recent research suggested that drivers’ brake actions in emergent situations came in response to the developing situation kinematics, probably mediated by visual looming, rather than some pre-defined “hazard onset” (e.g., LV brake light onset) ( 26 ). However, because of the current limitation in data collection, it was difficult to determine at what point the visual looming became a hazard for drivers that they had to respond to. Thus in this study, it was assumed that the driver taking evasive response was aware of the LV brake light onset, and the brake response stage started from when the LV’s brake light was activated and ended when the driver initiated brake action. The following stage definitions and consequent analysis sectioning were based on these assumptions.
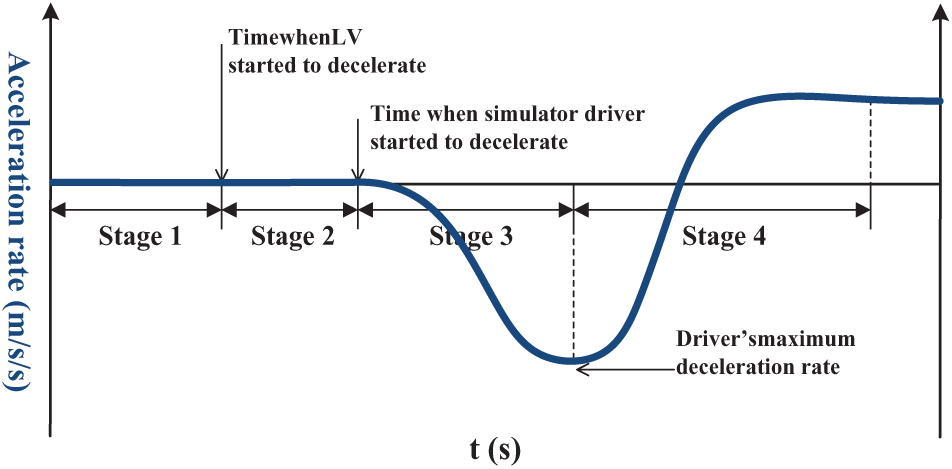
Four stages of rear-end collision avoidance process.
Independent and Dependent Variables
The independent variables in the study included cell phone use conditions, driver gender, and driving experience. It should be noted that in addition to the three cell phone use conditions, the study also considered whether drivers used a cell phone or not (binary variable) as a potential factor that might impose a significant effect on the eye movement variables. In such cases, the hands-free and hand-held cell phone use conditions were deemed as one condition to compare with the condition under no phone use. The dependent variables included pupil size, blink frequency, average blink duration, saccade frequency, average saccade duration, fixation frequency, average fixation duration, and dwell time on LV.
Based on the above four-stage division, basic statistical information on the eye movement variables in four stages was extracted. Specially, the frequency variables (i.e., blink frequency, saccade frequency and fixation frequency) represented the number of blinks, saccades and fixations per second within each stage duration, and they were calculated by the numbers within a certain stage divided by the duration of this stage. The average duration variables (i.e., average blink duration, average saccade duration, and average fixation duration) represented the average duration of all blinks, saccades, or fixations during each stage, and they were calculated by the sum duration of all blinks, saccades, or fixations within a certain stage divided by the numbers of blinks, saccades, or fixations in this stage, respectively. Because the duration of stages varied from individual to individual, the frequency variable and its corresponding duration variable were mutually independent and irreplaceable.
In the following data analysis, a repeated-measures analysis of variance (ANOVA) test (Type III) by stage was conducted to investigate significant changes of the eye movement variables across stages. At different stages, one-way ANOVA tests by cell phone use conditions, driver gender, and driving experience were conducted to examine the effects of these factors on drivers’ eye movement performance. Because the rear-end crash risk terminated before the last stage when drivers started to recover their speeds, the ANOVA tests would mainly focus on the first three stages.
Experiment Results
Eye Movement Descriptions in Four Stages
The basic measurements of all the eye movement variables in four collision avoidance stages are listed in Table 1. It shows that drivers’ average pupil size dilated after the normal driving stage. The blink frequency increased and the average blink duration decreased during the brake response and deceleration adjusting stage. There was no significant change in saccade frequency but the average saccade duration was shortened after the first stage. The drivers’ fixation frequency, average fixation duration, and dwell time on LV increased during the brake response and deceleration adjusting stages. The repeated-measures (within stages) ANOVA test (see Table 1) indicated that changes in drivers’ average pupil size, average fixation duration, and dwell time were significant among different stages.
Descriptive Statistics and Repeated Analysis of Variance for Drivers’ Eye Movement Variables
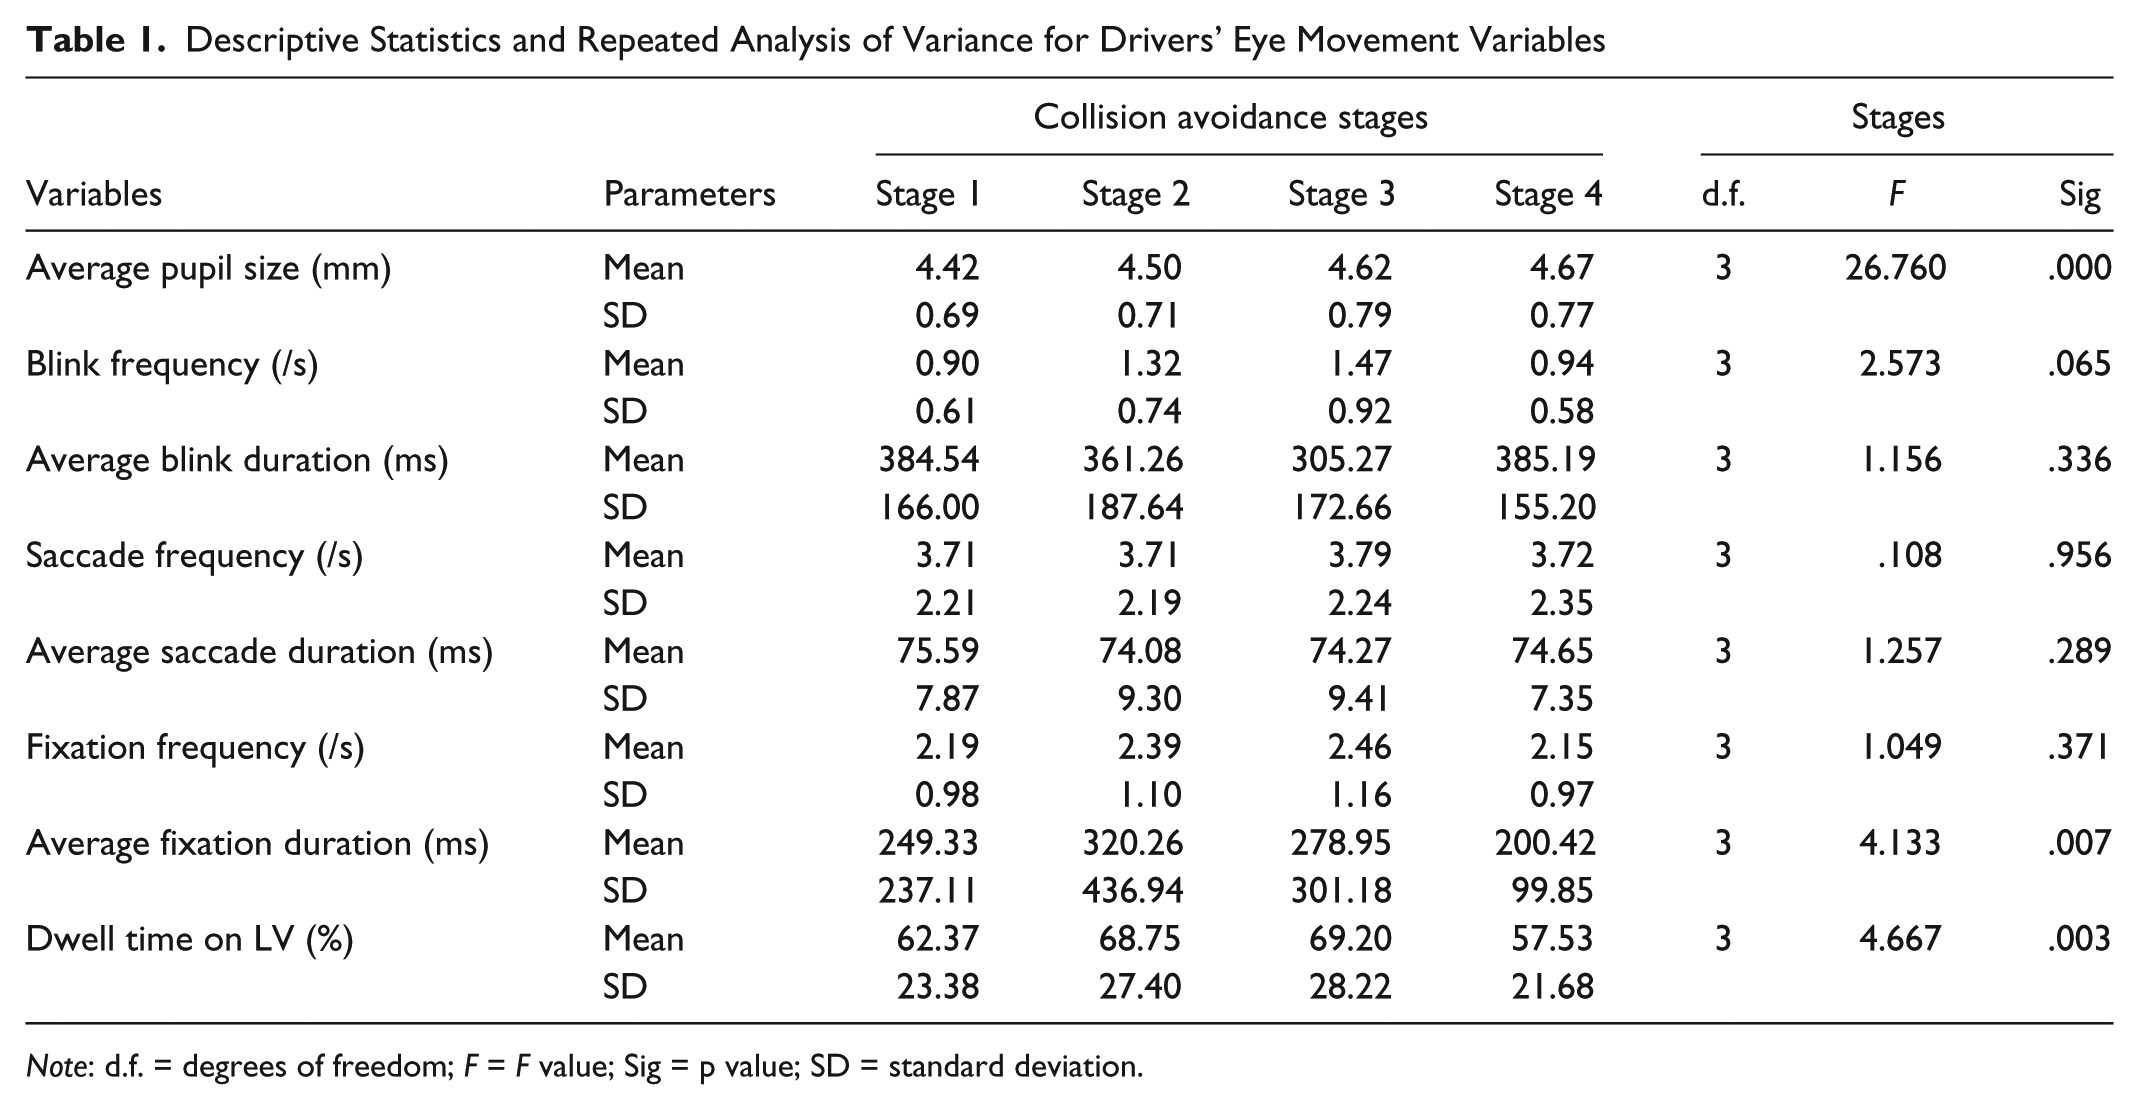
Note: d.f. = degrees of freedom; F = F value; Sig = p value; SD = standard deviation.
Stage 1: Normal Driving Stage
In the normal driving stage, drivers drove at steady speeds and followed the LV without any hint of an impending critical event. ANOVA results showed that driving experience had a significant effect on driver’s fixation frequency ([F] = 4.33, [p] < 0.05), but no significant effects of cell phone use or gender on the eye movement variables were observed. During the car-following process, professional drivers (mean [M] = 2.01, standard deviation [SD] = 0.93) had a higher fixation frequency on the LV than non-professional drivers (M = 2.40, SD = 1.00).
Stage 2: Brake Response Stage
In the brake response stage when drivers perceived the LV’s deceleration, significant effects of cell phone use on a driver’s eye movement activities were observed. ANOVA results showed that the different cell phone use conditions significantly influenced driver’s average saccade duration (F = 3.53, p < 0.05). Whether drivers used a cell phone or not also had a significant effect on the blink frequency (F = 4.65, p < 0.05). The average saccade duration was smaller when the driver used a cell phone (hands-free: M = 73.27, SD = 7.32; hand-held: M = 71.65, SD = 8.78) compared with the no phone use condition (M = 77.21, SD = 10.73). The blink frequency was also smaller in the cell phone use condition (M = 1.19, SD = 0.64) compared with the no phone use condition (M = 1.77, SD = 0.92). No significant effects of driver gender or driving experience were observed.
Stage 3: Deceleration Adjusting Stage
The deceleration adjusting stage was a stage when drivers performed collision avoidance actions to avoid a rear-end crash. Whether drivers used a cell phone or not had a significant effect on the fixation frequency (F = 5.84, p < 0.05). No significant effects of driver gender or driving experience were observed on the eye movements in this stage. When drivers were adjusting deceleration rate in response to the LV’s deceleration, their fixation frequencies on the hazard source were lower in cell phone use conditions (M = 2.87, SD = 1.29) than in the no phone use condition (M = 2.27, SD = 1.04).
Discussion
The study investigated drivers’ eye movement pattern during a rear-end collision avoidance process. Several visual measurements that can indicate changes of driver’s cognitive workload were effectively identified. The study also tested the effects of cell phone use and drivers’ characteristics (gender and driving experience) on the eye movement activities during different collision avoidance stages.
In the study, the changes of pupil size, fixation duration, and dwell time demonstrated the change of drivers’ cognitive workload across stages. From the normal driving stage to the speed recovering stage, drivers’ average pupil size increased by 5.7%. Pupil size is one of the most commonly recognized workload indicators that has been applied in different kinds of cognitive tasks ( 23 , 24 ). Early research by Hess noted the famous bi-directional effect of emotion on pupil change, reporting that the pupil constricted when people viewed unpleasant pictures but dilated when they viewed pleasant pictures ( 27 ). More recent research suggested that pupil dilation was determined by emotional arousal, independent of whether pictures were pleasant or unpleasant ( 28 ). The present study further supported the more recent discovery that pupil diameter could also increase when people processed unpleasant visual stimuli.
In addition to the pupil size, change of driver’s cognitive workload during the collision avoidance was also reflected by their fixation duration and dwell time on the hazard source. Both the fixation duration and dwell time on LV were comparatively higher in the brake response stage and deceleration adjusting stage than in the normal driving stage and speed recovering stage. In the brake response stage, drivers perceived the LV’s deceleration and the consequent rear-end collision risk, and so a preliminary collision avoidance strategy was formed accordingly. During the deceleration adjusting stage, the collision avoidance strategy was implemented by drivers through controlling the deceleration time as well as the deceleration rate. The increase of fixation duration and dwell time on the LV indicated that drivers’ visual demand increased with the increase of cognitive workload, and thus the visual attention on the hazard source was enhanced so that the drivers could better prepare for the imminent rear-end risk.
The effects of cell phone use on drivers’ eye movements were found in both the brake response stage (blink and saccade activities) and deceleration adjusting stage (fixation activity), and, interestingly, the effects in these two stages seemed to be contrary. In the brake response stage, efficient eye movements were conducted by drivers as a visual compensation strategy to mitigate the increased cognitive workload imposed by cell phone use, whereas in the deceleration adjusting stage the effects of cell phone use on eye movements seemed to be negative.
In the brake response stage, drivers with cell phone use had lower blink frequency than drivers without cell phone use. It has been commonly agreed in past research that eyeblink, especially endogenous eyeblink, can provide information about the process involved in attention and response programming and execution ( 29 , 30 ). Many studies have reported that blink frequency decreased significantly when subjects were performing tasks associated with heightened visual attention demands ( 31 , 32 ), and the effects were not restricted to visual task modality only. Some other research also found a decrease in the blink frequency of subjects when they were performing nonvisual tasks such as mental arithmetic, digit span, and auditory tracking ( 33 , 34 ). In this study, the significant decrease in blink frequency in the brake response stage further demonstrated that cognitive demands were important in determining blink occurrence and a correlation might exist between inhibition of blink and high cognitive demand. It should be noted that this finding of change in drivers’ blink frequency in a secondary auditory task conflicted with the finding of Tsai et al. ( 23 ). Instead of a decrease in blink frequency, Tsai et al.’s study indicated that the blink frequency increased when subjects performed an unchanging visual driving task and a taxing auditory task concurrently. The authors explained the result that the auditory task reduced subjects’ concentration on the visual driving task, and therefore the number of blinks increased because of the decrease of visual attention. However, previous research has reached a consensus that the inhibition of blinks was associated with increased visual attention, though it is still not clear whether the decrease of visual attention would lead to an increase in blinks or not.
Along with blink frequency, a significant effect of cell phone use was also observed in drivers’ saccade duration in the brake response stage. Drivers in the hand-held condition had the smallest saccade duration, followed by the hands-free condition and no phone use condition. Similarly, in the research of Fogarty and Stern, a time-locked relationship of blinks and saccadic eye movements was observed ( 35 ). The act of blinking caused a temporary loss of visual information as the eyelid created a barrier between the eye and the external environment, and long saccadic eye movements, which meant slow fixation transfer, caused a delay in the perception of important information. Therefore, it was suggested that the simultaneous occurrence of blink inhibition and quick saccadic eye movements was the most efficient strategy for drivers using cell phone to minimize visual information missing in the brake response stage.
In the deceleration adjusting stage, drivers using a cell phone were found to have lower fixation frequency on LV than no-phone-use drivers. Many previous studies showed that secondary in-vehicle visual-demand tasks (such as texting, using a navigation system or other In-Vehicle Information Systems) resulted in degraded visual attention, impaired driving performance, and increased crash risk ( 36 , 37 ). The present study further demonstrated that non-visual-demand task distraction could also interrupt drivers’ visual attention to the hazard source and this was probably because of the overlapped multi-tasks at this stage, which included both manual operation (adjusting the strength exerted on the brake pedal) and cognitive activities (calculating arithmetic problems). Finally, it should be pointed out that even though the study tested driver distraction from both hands-free and hand-held cell phone use, little difference between the two types of cell phone use with regards to their effects on the drivers’ eye movements was observed. From another point of view, however, this result reflected a notion that drivers’ conversation through hands-free phone or hand-held phone affected their visual search strategies in much the same way.
In regard to the drivers’ demographics, no difference of eye movements between male and female drivers was observed during the collision avoidance process. However, drivers’ profession significantly affected the fixation frequency on the LV in the normal driving stage and professional drivers had a higher fixation frequency than non-professional drivers. The professional taxi drivers paid more visual attention to the front LV in the car-following process, probably because their work required them to drive more carefully and their accumulated experience made it easier for them to focus more on the potential hazards in complex traffic situations. Similarly, in the research of Konstantopoulos et al., driving instructors and learner drivers were organised to drive under day, night, and rainy conditions in a simulator, and results showed that driving instructors were able to collect more information about the scene by employing more fixations across all three visibility conditions ( 38 ). The strategy of deploying frequent short fixations was considered crucial for experienced drivers in hazardous situations to maintain awareness and anticipate potential sources of hazard on the road.
Some limitations of the study should be pointed out. First, the study was conducted by using a driving simulator and the experiment scenario created was an emergent situation with high rear-end collision risk. Differences in drivers’ eye movements, risk assessment, and collision evasive response may exist between simulation and naturalistic on-road driving. However, it is not ethically possible to validate the present results against a real-world driving experiment as participants cannot be put in a critical situation with high collision risk. Second, an emergent pre-crash scenario was a small-likelihood event in reality, and drivers were unlikely to encounter one emergent conflict after another in a short span of time. Participants’ multiple exposure to safety-critical events may lead to potential confounding ( 39 ). Therefore, a stricter experiment control method (e.g., a long interval time between formal experiments) should be applied in future study.
Conclusion
Previous research investigated the effects of cognitive secondary tasks on drivers’ visual performance by using various eye movement measurements. However, only a few of them considered their effects in emergent situations, such as rear-end collisions, in which distraction tasks occur frequently. Therefore, the study investigated drivers’ eye movement pattern in a rear-end collision avoidance process under the influence of cell-phone-induced driver distraction. Specifically, a four-stage rear-end collision avoidance process was discovered in the study for eye movement pattern analysis. Significant changes were observed in several eye movement variables that can indicate the status of a driver’s cognitive workload, including the average pupil size, average fixation duration, and dwell time on the LV. The effects of cell phone conversation on visual performance were found to be contrary in the brake response stage and deceleration adjusting stage. For the former stage, visual compensation strategies were conducted by cell phone use drivers through reducing the blink frequency and saccade duration. However, in the latter stage, driver’s cell phone use behavior led to a low fixation frequency on the LV, which might explain the high near-collision risk of cell phone use drivers from the view of visual performance. In regard to the drivers’ characteristic factors, professional drivers were found to pay more visual attention to the LV than non-professional drivers in a normal car-following situation whereas no significant gender effect was observed during the whole collision avoidance process. Future study will test drivers’ eye movement activities in other collision scenarios (right-angle collision or head-on collision, for example) and investigate the correlation mechanism between eye movements and behavior actions to provide effective predictions of collision risk by applying a comprehensive measurement of collision avoidance performance.
Footnotes
Acknowledgements
This research was supported by the National Natural Science Foundation of China (71621001, 71771014) and Australian Research Council (ARC DP140102895).
Author Contributions
The authors confirm contribution to the paper as follows: study conception and design: Xuedong Yan; data collection: Xiaomeng Li and Yuting Zhang; analysis and interpretation of results: Xiaomeng Li and Andry Rakotonirainy; draft manuscript preparation: Xiaomeng Li, Andry Rakotonirainy, Xuedong Yan, Yuting Zhang.
All authors reviewed the results and approved the final version of the manuscript.
The Standing Committee on Vehicle User Characteristics (AND10) peer-reviewed this paper (18-03392).