
Abstract
A common method used to evaluate road designs for bicycling is a survey of stated opinions based on imagined bicycling experiences that are used to represent real experiences. However, we know little about the connection between imagined and real bicycling experiences. In this study, we examine the relationship between bicyclists’ (first-person experienced) and video survey participants’ (imagined) ratings of bicycling comfort and safety. We do this with real-world bike rides/surveys (n = 20) and a blocked experiment conducted through a web-based video survey of female undergraduates (n = 1,203). We show that imagined ratings resemble first-person experienced ratings, but that they have a systematic negative bias (approximately 10% to 15%). This suggests that imagined bicycling experiences seem less comfortable and safe compared with real experiences. We compare both methodological and psychological explanations for this result and the consequent bicycling implications for each.
Understanding what environments are comfortable and safe for bicyclists is essential for planners aiming to increase bicycling, particularly for non-experienced riders. Surveys probing people’s qualitative perceptions (or feelings) about bicycling environments thus have an important role in bicycle planning. Surveys help planners judge the perspectives of bicyclists and would-be bicyclists, and help determine bicyclists’ preferences for different road designs. For example, the New York City Bicycle Survey ( 1 ) included a series of questions about preferences for riding on different bicycle facilities. The results indicated that “riders are most interested in demarcated, differentiated, or otherwise dedicated bicycle lanes and greenways” (p. 11). Researchers also employ surveys in their efforts to better understand the connection between bicycling environments and bicycling behavior, and the subjective value that bicyclists place on different elements of the environment.
Surveys about the road environment for bicyclists tend to fall into three main categories: descriptive, comparative, and behavioral. Descriptive surveys ask people about their feelings, emotions, and attitudes toward different bicycling environments. These types of surveys require participants to score a qualitative concept (e.g., comfort) on a quantitative scale (e.g., Likert items, anchored 10 point scales). Comparative (i.e., stated preference/choice) bicycle surveys focus on tradeoffs between different bicycling environments. These surveys are perhaps more demanding of the imagination in that they require the participant to choose between hypothetical alternative bicycling environments (often with added information about time and cost). However, they have the benefit of providing a basis for estimating the economic value of each bicycling environment (e.g., [ 2 ]). Finally, behavioral bicycling surveys focus on how people behave in different bicycling environments. These surveys usually ask people where they will ride or where they think bicyclists should ride given new road designs; planners use the results to help improve safety. Each of these types of surveys has utilized textual or visual cues to prompt survey participants. For example, behavioral evaluations of the environment have been measured using text ( 3 ), abstract drawings ( 4 ), images ( 5 ), video ( 2 ), and most recently virtual reality ( 4 ). Although there is no agreement on the most appropriate medium for surveying hypothetical bicycling experiences, in general, more realistic survey methods may offer improved behavioral insights ( 6 ).
The goal of this study is to shed some light on the performance of these different survey methods. We focus on descriptive video surveys of bicyclist comfort and safety. These types of survey have two primary challenges. First, descriptive scales are commonly designed in absolute terms (e.g., the response to one Likert item should not be dependent on a response to another). However, participants may report scores in a relative sense by basing later scores on previous scores, consciously or unconsciously. For example, if a participant first reports to “strongly agree” with the statement I felt comfortable they may feel inclined to later report “strongly agree” to the statement I felt safe because they might feel the need for these responses to be consistent. Whereas had the participant received the statement I felt safe first, they may have reported “somewhat agree.” The degree to which participants use the scale as intended (as absolute) is unknown. Second, video is a unique medium in that it can represent an environment over time (even if only a very short time) in contrast to still graphics, images, and text. This means video has a more realistic appearance when surveying people about hypothetical bicycling experiences. However, the selection of video clips to match the hypothetical experience intended by the researcher makes this method more challenging. For example, if a researcher is interested in how comfortable a person is bicycling on a four-lane road with no bike lane, they can easily ask that directly using text. This leaves the context entirely up to the imagination of the participant. When representing that four-lane road with no bike lane in video, researchers have control of the context, but it comes with the cost of making many additional choices (e.g., time of day, weather conditions, amount/type/speed of vehicular traffic, width of road lanes, with or without on street parking, tree shade, etc.). No matter the choice of medium, all methods aimed at measuring hypothetical experiences have the challenge of ensuring that the participant response is based on the researcher-intended experimental manipulation.
Although our focus is on descriptive video surveys, all of these methods (and mediums) have an imagined component that makes them susceptible to misrepresenting real experiences and associated feelings. For many human behaviors, biases have been reported when comparing surveys of real and hypothetical experiences (e.g., product purchasing [ 7 ], moral decisions [ 8 ], travel behavior [9,10]). These biases can be problematic if planners make policy or design decisions based on surveys. For stated choice experiments, these biases (known as hypothetical bias) can range from anywhere between 25% and 300% ( 9 ). Studies of stated and revealed preferences about bicycling yield some evidence that these biases may be small for objective variables (e.g., expected travel time) ( 11 ). However, evidence on bias for subjective variables such as perceived comfort and safety is not currently available. In the context of judging comfortable and safe bicycling environments, it is unclear how representative surveys are of real bicycling experiences or real-life travel decisions. The uncertainty of the magnitude of potential misrepresentation motivates our primary research question: in surveys of bicycling comfort and safety, what is the relationship between imagined and experienced bicycling comfort and safety? In addition, because we represent qualitative feelings (comfort and safety) as quantities on an absolute scale, we pose a secondary methodological question: to what extent do survey participants use this scale in a relative way?
Methods
Study Design
We addressed our research questions through a sample of female undergraduates at the University of California, Davis who bicycled or participated in a video survey (hereafter referred to as the bicyclists and the video participants, respectively). The bicyclists’ ratings we refer to as first-person because they rate their real personal experience in the survey, whereas the video participants’ ratings we refer to as imagined because they are imagining a bicycling experience through the video. Importantly, this imagined experience is tied to the bicyclists’ experience because the video clips are taken from the bicyclists’ rides. We chose female undergraduates because they are a conservative target population when planning roads for bicycling ( 12 ), both because women are more sensitive to traffic safety (13,14), and because undergraduates do not have a lot of bicycling experience (i.e., none of the participants regularly bicycled for travel until coming to Davis). As an incentive, we awarded the bicyclists (n = 20) a $35 gift certificate for their participation, which included questionnaires, a mental stress test, an interview, and physiological measurements while bicycling. Because of the cost and duration of this experiment (3 to 4 h per participant) the bicyclist sample size is small. The bicyclists range from 2nd- to 4th-year students, all of whom had previously learned to bicycle when they were a child.
As a part of the bicyclists’ participation, they rode in three distinct road environments (Figure 1) while recording video. They rode in these environments in assigned orders designed to counterbalance first-order carry-over effects. An example of a first-order carry-over effect in this study would be if a bicyclist’s rating of a collector road was influenced by their prior rating of a major arterial. By balancing the order of roads the bicyclists experienced, we ensured there was no systematic effect of order on the aggregated ratings as a group. Bicyclists rated their experience on a 10-point comfort/safety scale by providing their most common level (mode) and range of levels (minimum and maximum) of comfort/safety. Note that we only asked participants about comfort/safety with regards to interacting with vehicular traffic (we would not expect bicyclists to consider, for example, pavement roughness as a direct factor in this measure; the expectation that bicyclists focused on interactions with vehicular traffic was confirmed in post-experiment interviews). The comfort/safety scale was a measure designed to encompass both feelings of comfort and safety. As these were difficult for the bicyclists to separate (e.g., responses to 5-point Likert statements about comfort and safety separately were nearly perfectly correlated) the combined term was used.
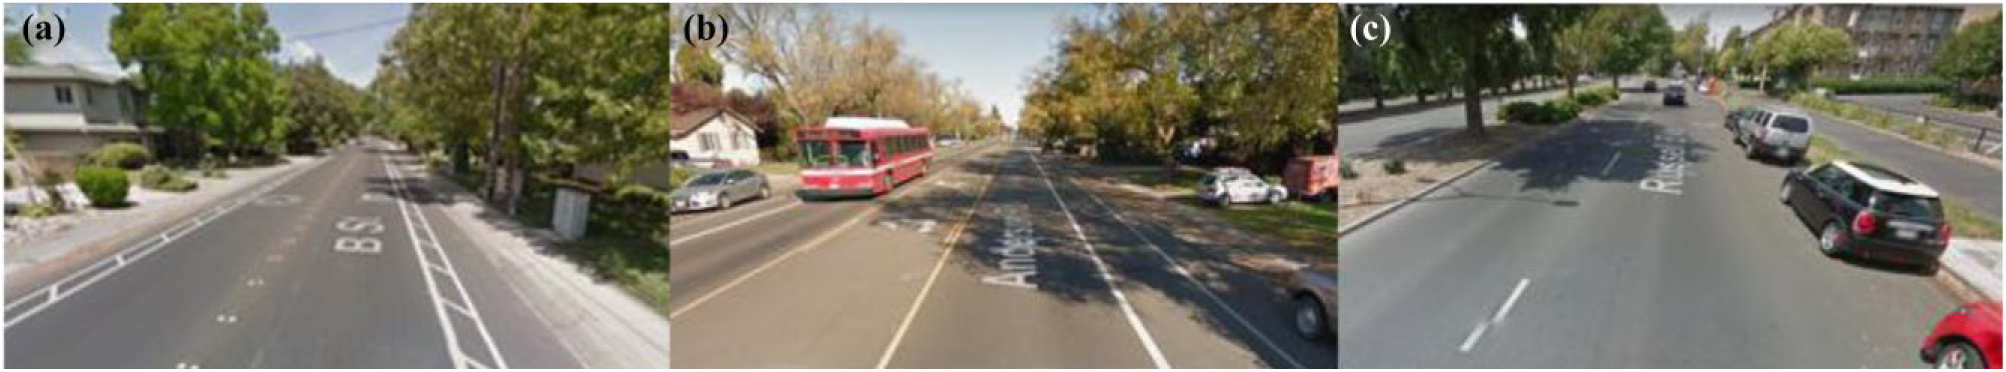
Experimental road environments: collector (a), minor arterial (b), major arterial (c). Images from Google Street View.
The video participants (n = 1,203) were assigned five short video clips (extracted from the recordings of the bicyclists’ rides) in a web survey and were asked to rate their comfort/safety on the same 10-point scale. This web survey was an add-on to the 2016–2017 University of California, Davis annual campus travel survey (see Gudz et al. for the 2015–2016 survey [ 15 ]). Although the video experiment had to be kept short to minimize overall survey burden, it allowed us access to a large sample of female undergraduates. The web survey consisted of a blocked experimental design. Each experimental block consisted of an “anchor” video (explained below), followed by four videos of one road type with four levels of traffic presented in geographic order of the bicyclists’ rides (e.g., in Block 1, A2 (light traffic on the collector) is presented first because it occurred at the beginning part of that road) (see Table 1). Experimental blocks were balanced between anchor and road type, but not between road type and traffic, nor between person and road type. Each participant received one experimental block, which presents five video clips. This design ensured we could make between-subject inferences about all experimental environments.
Experimental Design
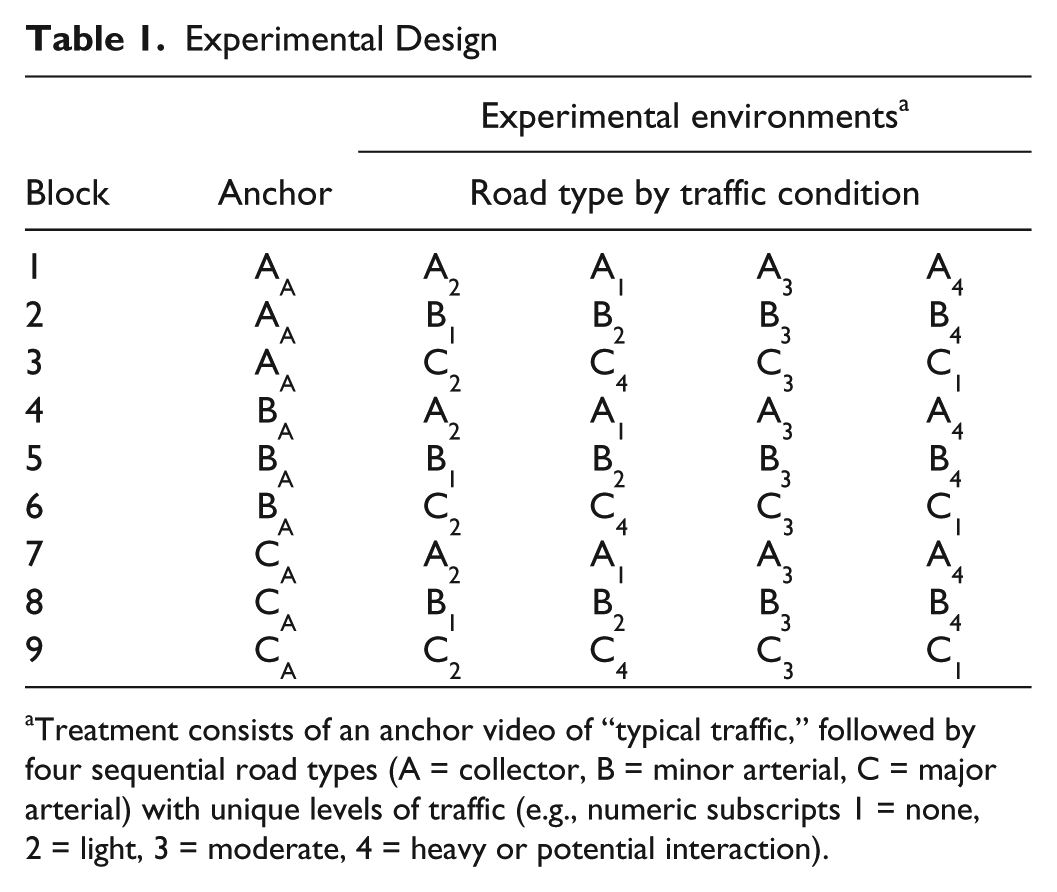
Treatment consists of an anchor video of “typical traffic,” followed by four sequential road types (A = collector, B = minor arterial, C = major arterial) with unique levels of traffic (e.g., numeric subscripts 1 = none, 2 = light, 3 = moderate, 4 = heavy or potential interaction).
What is An Anchor and Why Do We Use One?
We are loosely borrowing the concept of anchoring from Tversky and Kahneman ( 16 ). This concept is based on the observation that when asked to give a number, people will give different numbers depending on their exposure to an initial value or reference point. In situations where a numerically correct answer exists, this heuristic means that people tend to systematically favor deductions near the anchoring value. In our case, there is no correct value (we are measuring a subjective feeling), but we have a 10-point scale that is interpreted based on each video participants’ judgment of the endpoints (“uncomfortable/unsafe” and “safe/comfortable”). The concern is that the initial video a participant watches skews their ratings of subsequent videos: an initial video that rates as highly safe/comfortable could lead to overall higher ratings, whereas an initial video that rates as uncomfortable/unsafe could lead to overall lower ratings. Although our scale is intended to be absolute (not relative), by explicitly including a common anchoring video for each of the experimental blocks (one video for each road type with typical traffic conditions), we can examine the influence of the anchor on the remaining scores in case participants are using the scale in a relative way.
We used a different process to correct for anchoring with the bicyclists. Each bicyclist rated the roads immediately following their riding experience. Because of anchoring, these ratings could be biased by the bicyclist’s rating on the first road she rode (because she had nothing to compare it with). For example, if she rated the first road a 7, then found the next two roads to be more comfortable/safe, she would tend to give ratings of 8 or higher. But if that first road had instead come last, she might have given it a far lower rating in comparison with the other two. To correct for this, we gave the bicyclists the opportunity to adjust their ratings for any road in an interview at the end of the completed experiment. They did not have a predefined “anchor” the way the video participants did, but they were given the opportunity to adjust scores once they had experienced all of the road types.
Video Selection
Video clips of approximately 10 s were selected based on video quality, representativeness of the road environment, and representativeness of traffic conditions. The video camera was secured to the bicyclists’ helmets and thus the camera viewing angle closely matches the view angle of the bicyclists. Because head movements caused considerable shakiness in the image, we chose video clips where there was minimal head movement. We also avoided video clips where the sun angle was low enough to cause glare. To ensure representativeness of the road environment, we selected two video clips on the outward leg of each road type and two on the return leg (bicyclists rode out and back). We presented the four video clips for each road type in sequential (geographic) order as the bicyclist would have experienced them. However, the video clips for a road type were taken from up to four different bicyclists’ recordings, thus they are not representative of any individual experience. Finally, we selected video clips so as to balance traffic conditions across the roads: each road type includes a video clip that has no passing vehicles, one with a few slow-passing vehicles, one with fast passing or large vehicles, and finally one with either large passing vehicles or situations of potential vehicle conflict (see Table 1). Anchor videos were selected to illustrate a typical environment with typical traffic for each road type. For example, the collector anchor has only a slow-passing vehicle, whereas the major arterial anchor has many fast passing vehicles. Furthermore, anchor videos are distinct from non-anchor videos (e.g.,
Analysis
We estimated overall video participants’ comfort/safety by counting the number of responses at each point of the scale for each road type. We divided these counts by the number of responses to produce a normalized histogram. We estimated the bicyclists’ comfort/safety from the scores reported by the bicyclists after their rides (including any adjustments based on the interviews). To characterize their comfort/safety during their entire experience on a road type, we used each bicyclists’ mode, minimum, and maximum survey responses of comfort/safety to form a triangular distribution (min, mode, max). We combined each triangular distribution (one for every bicyclist) into an aggregated distribution for each road type by summing 10 bin histograms (one for each level in the 10-point scale) and dividing by the sum in each bin. This creates a normalized histogram that can be compared to the video participants’ comfort/safety histogram.
We conducted three different comparisons between imagined and first-person comfort/safety. First was a simple comparison of aggregated ratings representing the overall difference. Second, we repeatedly (100 iterations) sampled 20 individuals from an attitude-matched subset of the video participant population and compared the sample ratings to the first-person ratings. We did this to address two potential confounds in our sampling. First, our small bicyclist sample size could have randomly favored one side of the 10-point scale and had we had a larger sample we might have found that the bicyclists’ responses would have been less extreme. By repeatedly sampling 20 video participants, we could estimate a 20-person video sample variance. If the bicyclists’ ratings were within that variance, it strengthened the argument that sample size is the reason for disagreement between bicyclists and video participants. Second, we used an attitude-matched (self-reported bicycling ability and comfort on a four-lane road with no bike lane, hereafter referred to as ability and general comfort) subset to guard against the fact that our bicyclist sample was likely to favor women with greater ability and general comfort than the norm (because they volunteered for an on-road bicycling experiment). Finally, we compared the bicyclists’ ratings with the most able and comfortable video participants (those who responded in the highest category of both ability and general comfort). This comparison allowed us to examine the relationship between these attitudes and the comfort/safety rating to ensure they were appropriate variables to create a bicyclist-matched sample. In other words, we expect comfort/safety scores to be greatest for this biased sample. In all comparisons, we calculated three statistics to represent the differences. These were:
Kullback–Leibler (KL) divergence: This is the directional “distance” between two distributions. This measure has an intuitive interpretation in terms of information theory such that a divergence close to 0 would indicate both distributions have the same information, and a divergence close to 1 would indicate that knowing one distribution does not help in gaining information about the second distribution (see McElreath for an overview [ 17 ]).
Earth mover’s distance (EMD) ( 18 ): This is a true distance metric (bi-directional) that describes how much “work” it takes to move one distribution to another where “work” is the mass * distance.
Difference between the means.
Limitations
Our method has a few limitations. First, the video participants and the bicyclists were not the same people and thus we could not calculate an individual-level difference between ratings of comfort/safety. Instead, our analysis is at the aggregated group level and subject to ecological fallacy, meaning that findings at the aggregate level may not hold at the individual level ( 19 ); differences between imagined and first-person ratings for the groups do not necessarily mean that individuals would rate imagined and first-person comfort/safety with the same difference. Nonetheless, this is a first step toward estimating the magnitude of bias between bicycling comfort/safety surveys for imagined and first-person experiences. Second, our sample only covered female undergraduates and so should not be used to generalize to the entire population. Third, the sample size of the bicyclists was small, as is common for field studies, and much smaller than the sample of video participants. The small bicyclist sample size is likely to inflate the error of first-person comfort/safety. We partially addressed this by constructing triangular distributions of comfort/safety (as opposed to simple averages) for each bicyclist to provide a more representative view of comfort/safety for the small sample, and by using repeated subsampling of video participants to match sample size between groups (see above). Fourth, our sample of bicyclists was not random and may be biased toward women with more bicycling experience. We partially addressed this limitation by matching our video sample based on two common (across samples) attitude variables thought to influence comfort/safety responses (ability and general comfort).
Results and Discussion
Effect of Video Anchor
The effect of the anchor on video participants’ ratings was minimal across individual video ratings. This can be seen by comparing the distributions of ratings between the three anchors (Figure 2). Each panel in the left four columns of Figure 2 shows the aggregate distribution of scores for a given video (road type by traffic combination). The three box/violin plots on each panel demonstrate similar distributions for responses across the three anchor types. For example, the top left panel shows responses for the video of a collector with light traffic. The box/violin plots show that responses had similar medians, interquartile, and full ranges for each of the three anchors (x axis). Furthermore, the effect of the anchor on the average rating for road type (column 5 of Figure 2) was so small that the distribution of ratings looks identical. There are a few cases where there appear to be subtle differences in response based on the anchor video. For example, the video participants who received Block 7 (collector with the major arterial anchor) appeared to rate the collector as slightly more comfortable/safe than those participants with the other anchors. However, this was only when traffic was moderate and heavy on the collector. Similar subtle differences can be observed for other experimental environments (Figure 2), but nothing is indicative of clear anchoring bias. This is especially true given that the direction of influence from the anchors seems to vary. For example, were anchoring occurring we would expect the scores for the major arterial to be ordered by anchor: greatest for the collector, less for the minor arterial, and least for the major arterial. However, Figure 2 suggests that the bias is sometimes positive and sometimes negative. The lack of a clear anchoring effect suggests that either the video participants treated the scale as absolute, or that if they employed a relative ranking, it is unlikely to have caused significant bias. This is somewhat surprising given the 1–10 rating scale is only vaguely defined by its end points and because we fused comfort and safety constructs. Although we had expected to see some evidence of systematic anchoring, the lack of anchoring allowed us to treat the anchoring video as a regular video sample with no special role in the ratings. Because of this, we included all video ratings and the average rated for each participant resulting in n*6 (7,218) ratings for further analysis.
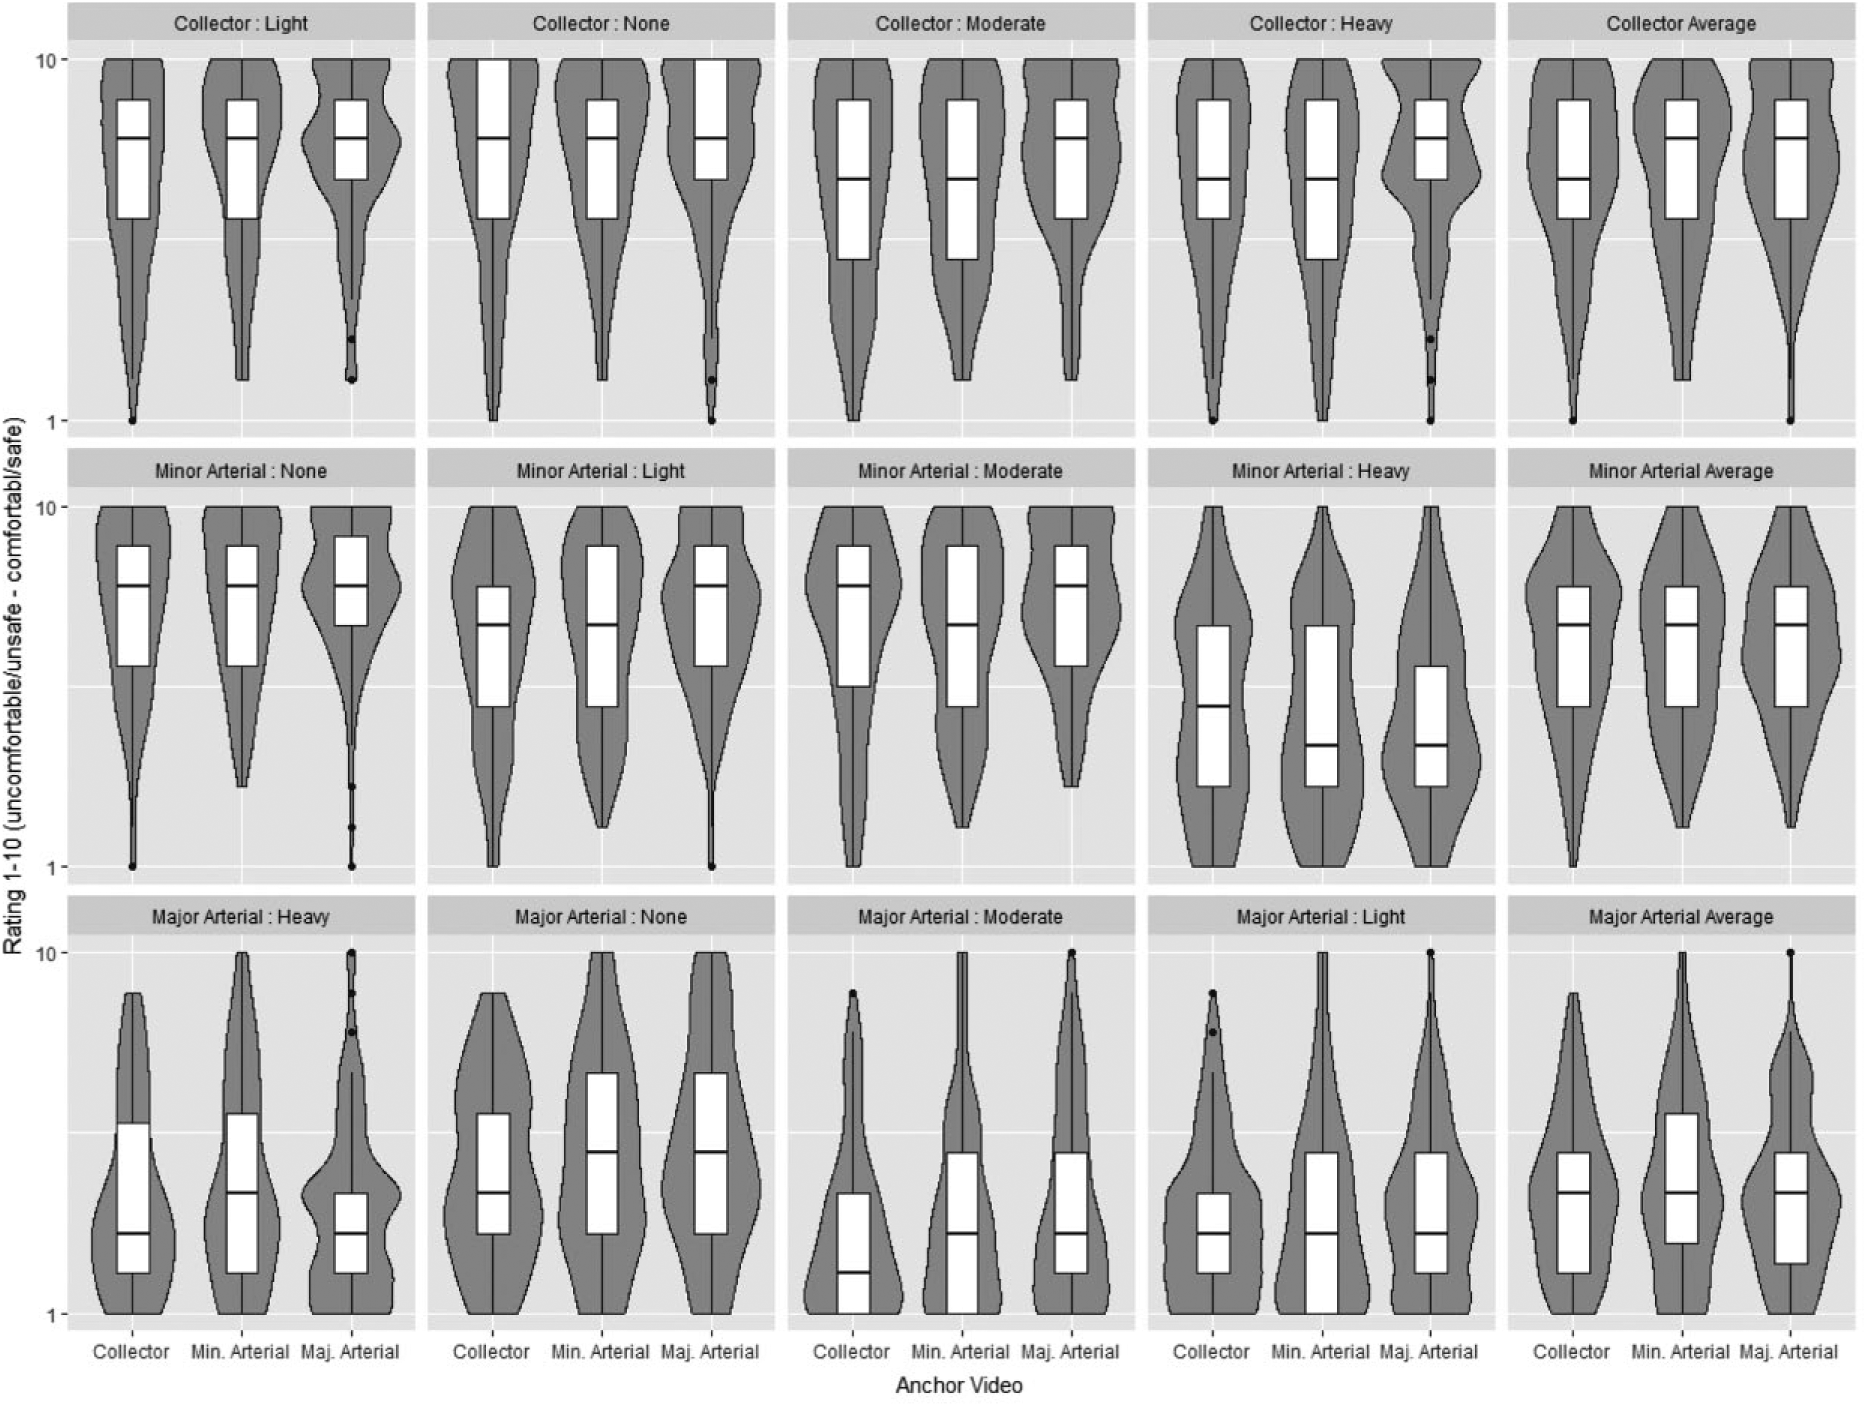
Box and violin plots showing the distribution of imagined ratings by anchor, grouped by experimental environments (road type by traffic condition). Panel rows represent road type, and columns represent the order the clips were presented. The last column is the user-provided average rating for all videos in their road type.
Comparing Imagined and First-Person Ratings of Bicycling Comfort/Safety
Our results indicate that survey responses are slightly more negative for video participants compared with the bicyclists (mean rating difference of about 1–1.5 on a 10-point scale) (Table 2). That is, video participants reported a 10% to 15% lower rating for comfort/safety on average. Not only did the mean estimates differ, but the distributions of estimated comfort/safety differ, most substantially in the lower range of scores (see EMD from Tables 2 and 3, and Figure 3). These results are consistent when we compare random samples of 20 attitude-matched video participants with the bicyclists (see Table 3). The standard deviation (SD) of the random samples suggests that there is some amount of uncertainty in the estimated bias given the small sample size. However, even at 2 SD above the mean estimate, the video participant comfort/safety scores were more negative (Table 3). This indicates a clear negative bias for video participants, even after controlling for attitudes. Although there is a clear negative bias, Figure 3 shows that the first-person experienced and imagined ratings are consistent in terms of their relative frequencies of scores. For example, both measures agree that the most common score for the collector is in the 8–10 range, whereas the least common in the 1–4 range. This indicates that the imagined experiences resembled the real experiences.
Distance Statistics Between Video Participant and Bicyclist Comfort/Safety
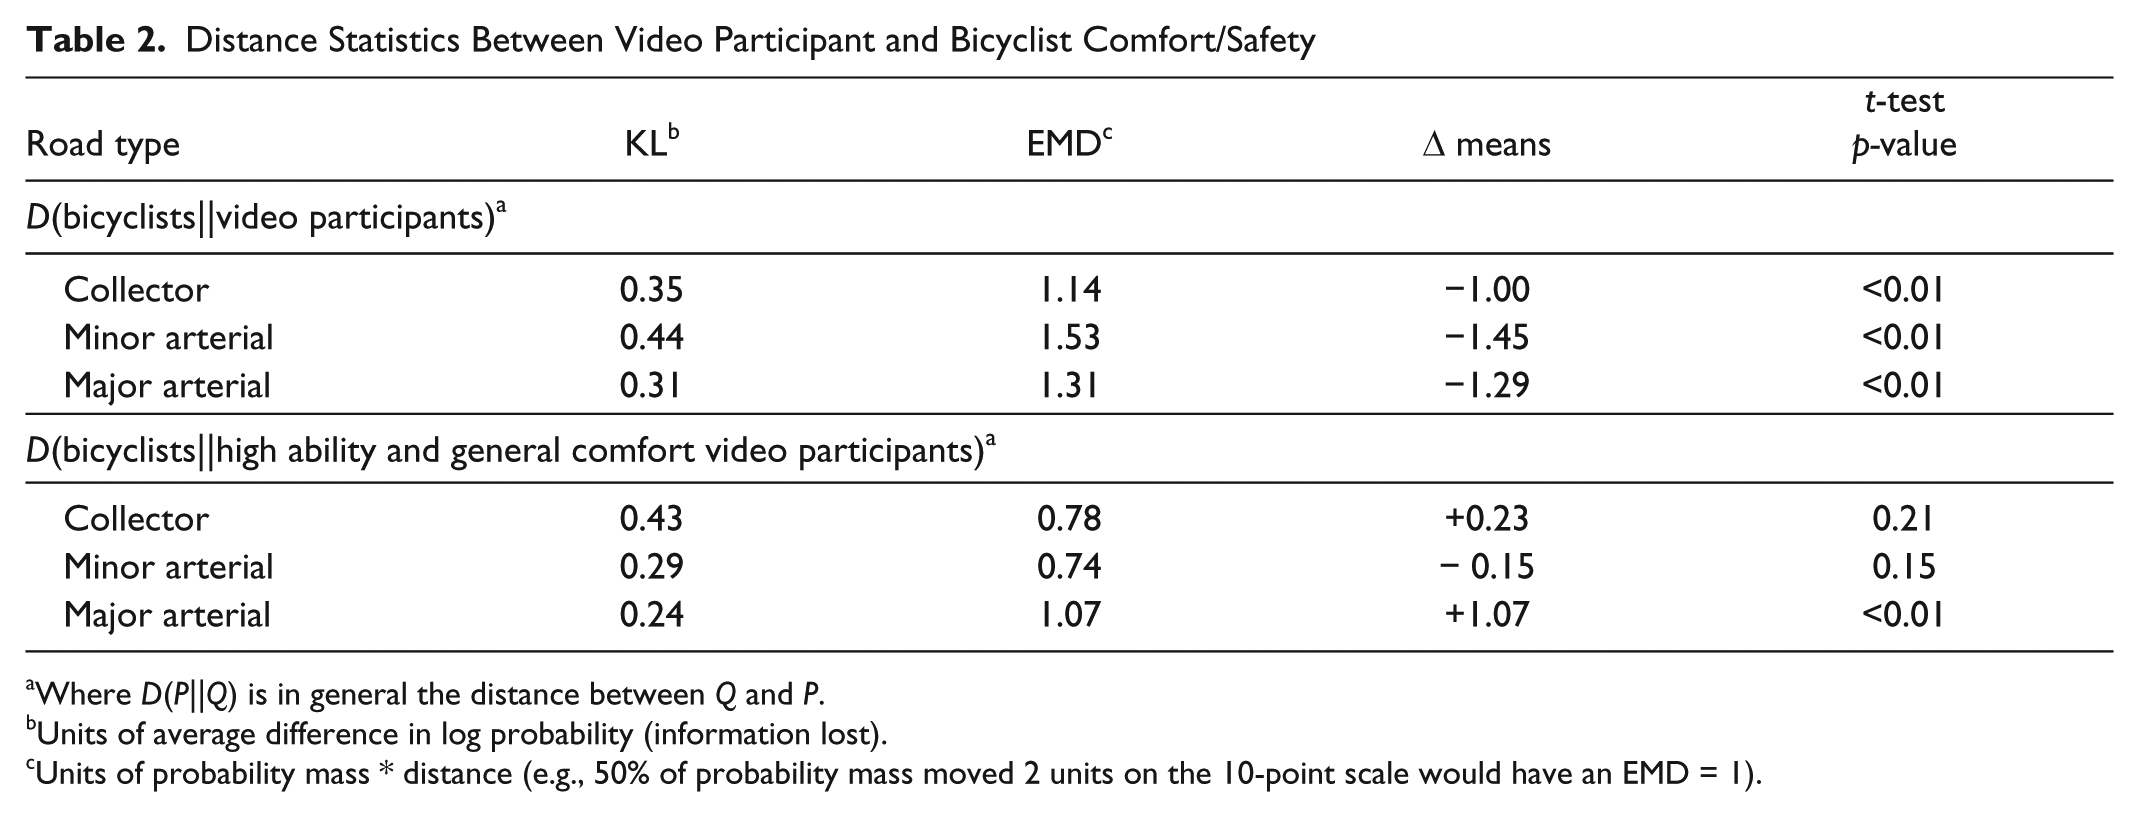
Where D(P‖Q) is in general the distance between Q and P.
Units of average difference in log probability (information lost).
Units of probability mass * distance (e.g., 50% of probability mass moved 2 units on the 10-point scale would have an EMD = 1).
Distance Statistics Between Video Participant and Repeat Samples of Attitude-Matched Bicyclist Comfort/Safety
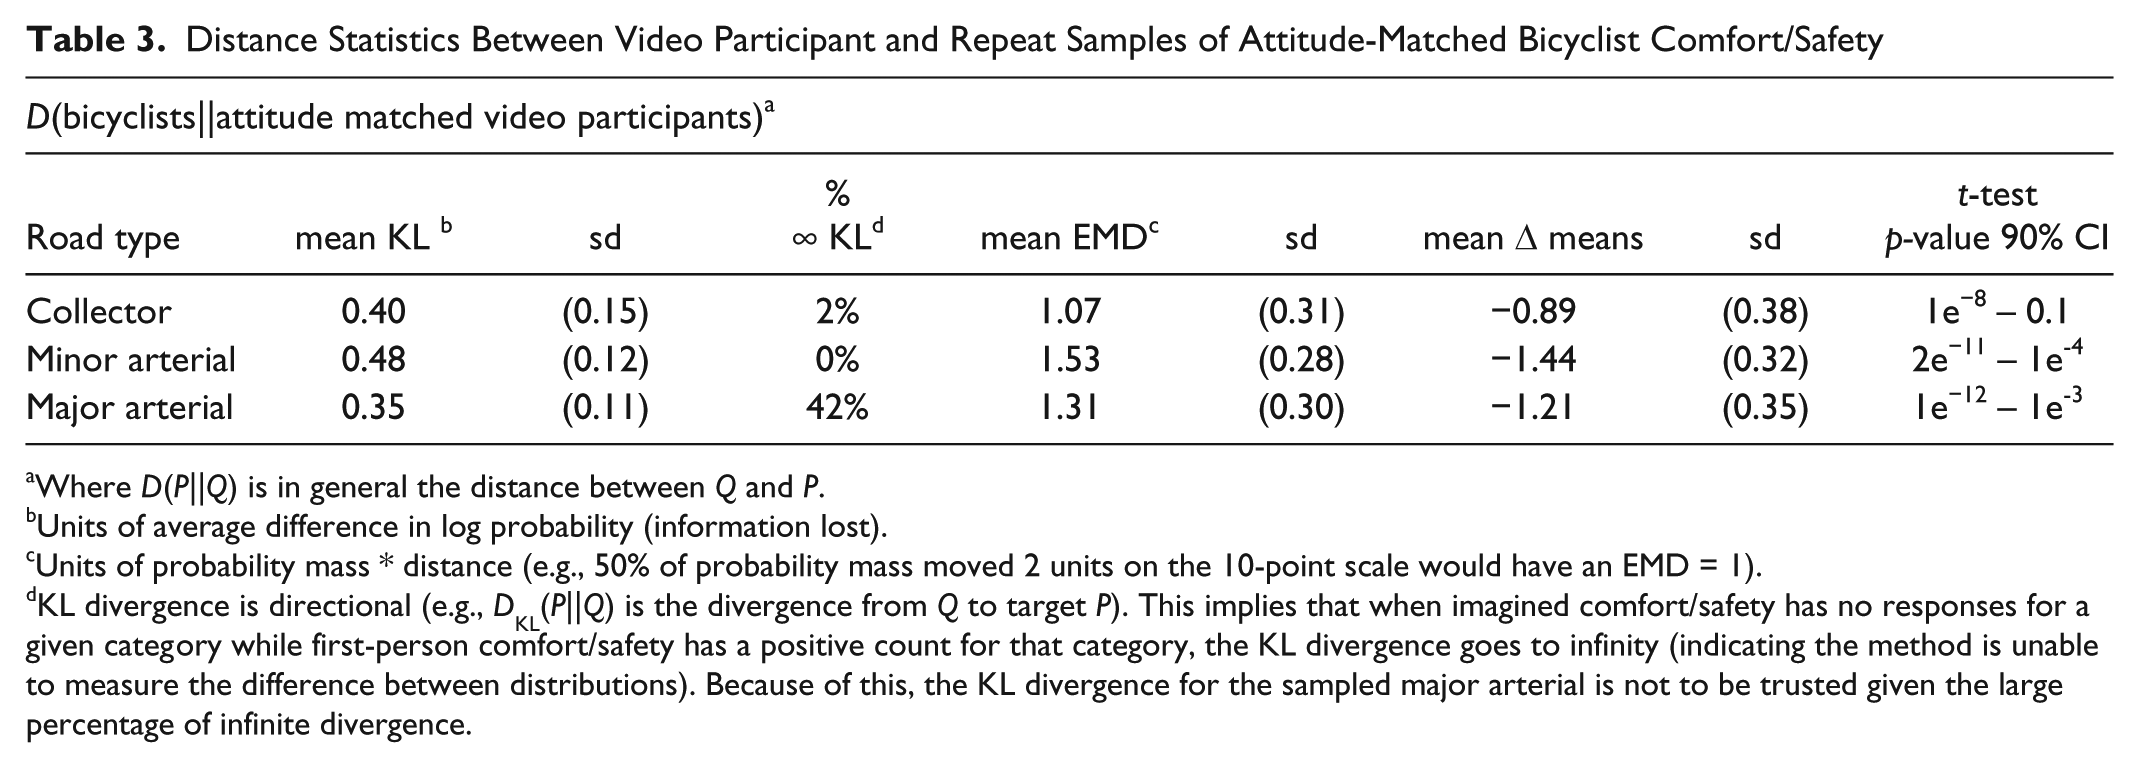
Where D(P‖Q) is in general the distance between Q and P.
Units of average difference in log probability (information lost).
Units of probability mass * distance (e.g., 50% of probability mass moved 2 units on the 10-point scale would have an EMD = 1).
KL divergence is directional (e.g., DKL(P‖Q) is the divergence from Q to target P). This implies that when imagined comfort/safety has no responses for a given category while first-person comfort/safety has a positive count for that category, the KL divergence goes to infinity (indicating the method is unable to measure the difference between distributions). Because of this, the KL divergence for the sampled major arterial is not to be trusted given the large percentage of infinite divergence.
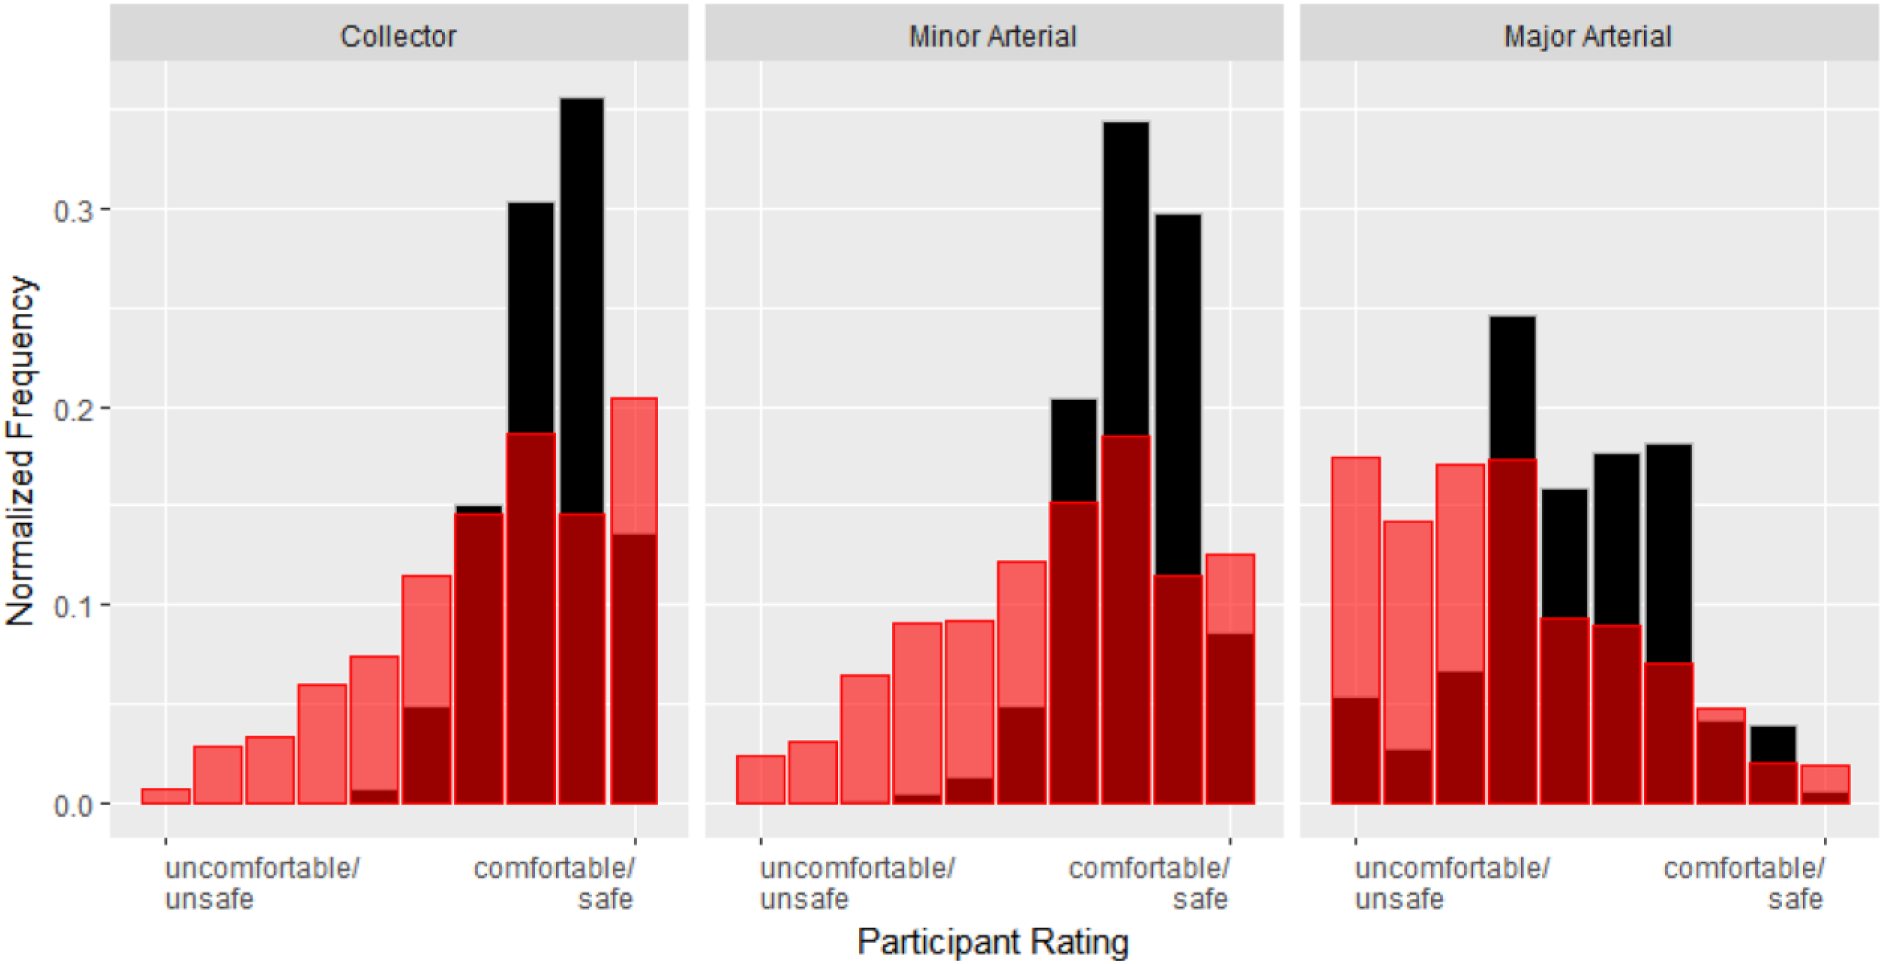
Aggregate normalized ratings of bicyclists’ ratings (black) and video participants’ ratings (light red), with overlap being dark red.
We also took the video participants with the strongest attitudes (highest category for ability and general comfort) to simulate a biased video participant sample (Table 2). This comparison suggests that ability and general comfort have a strong influence on imagined comfort/safety ratings. The video participants who were most able and most comfortable bicycling had a positive bias for the collector and major arterial compared with the bicyclists in general. This result supports our decision to match the video sample based on the bicyclists’ attitudes about ability and general comfort. It also parallels prior survey results that suggest people without bicycling experience report less comfort than their peers when bicycling on the same road types ( 20 ). This point is important for defining an appropriate subpopulation to survey as a basis for designing roads to make bicycling possible for the masses. These results indicate that the survey population should be defined not only based on demographics (e.g., age, gender) but also psychological measures (e.g., attitudes about ability and general comfort).
The differences between imagined and first-person ratings can probably be partially explained by the study design. We selected four levels of traffic conditions and presented them as having equal weight on the ride on that road type, whereas the bicyclists only experienced pockets of moderate to high traffic (Figure 4). This might have caused the video participants to have a negative bias as their exposure was to proportionally more traffic. However, we might expect that negative experiences (those during heavy traffic) had a stronger influence on the bicyclists’ ratings given that negative experience has a stronger psychological impact ( 21 ). Additional issues such as video wobble may have caused viewer discomfort, and lack of audio and peripheral views limited video participants’ ability to anticipate passing vehicles. Simultaneously, there are reasons why we might have expected the video participants to have a positive bias. First, the video participants were not exposed to any real safety threat compared with the bicyclists, so we would not expect them to have experienced true fear for their safety. In addition, subtle features of the road that could not be adequately captured by video (e.g., side winds and rough pavements) could make a road seem less comfortable/safe for a bicyclist (because those features can cause unexpected interactions with traffic), but not to a video participant.
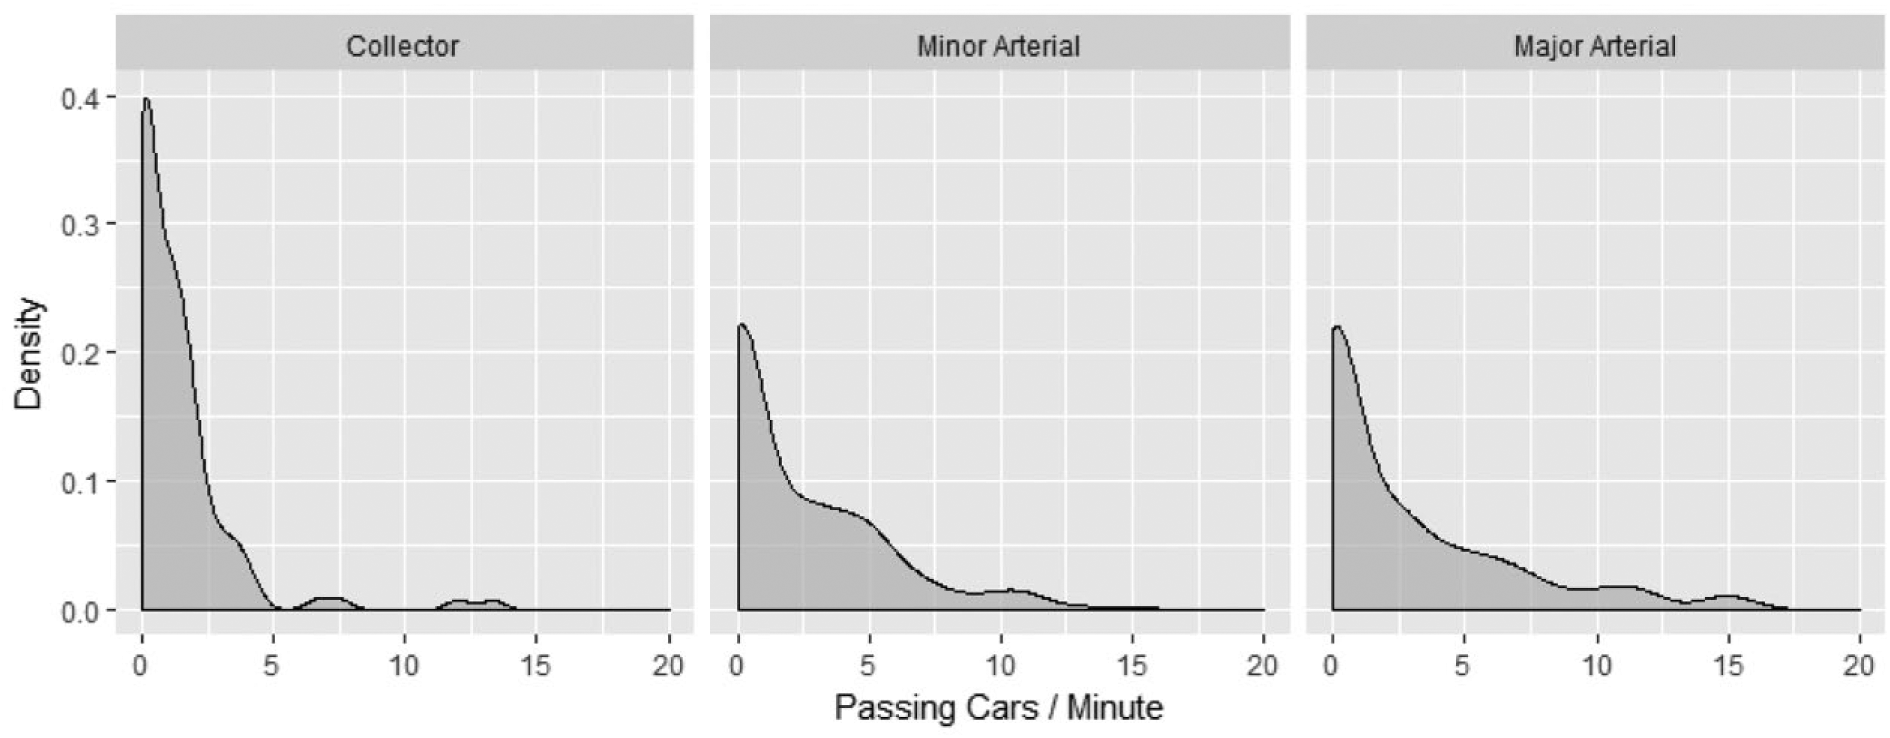
Bicyclists’ traffic rate (of right-most travel lane) frequency by road type.
Another explanation is that bicyclists may be basing their ratings on a small subset of salient moments during their ride that are unknown to us and thus impossible to select for the video experiment. This possibility is suggested by behavioral theories of retrospective evaluations such as the so-called peak end rule that suggests retrospective evaluations are largely based on some “peak” (or most intense) point and the end of an experience ( 22 ). However, because negative experiences loom larger than positive ones ( 21 ), the peak end rule suggests the bicyclists would focus on the most stressful moments, causing the video participants to be biased in the opposite direction (i.e., more comfortable). Moreover, our use of minimum, mode, and maximum comfort/safety ratings by the bicyclists attempts to encourage broader evaluations of first-person experiences.
When comparing road types, our results suggest that imagined experiences may have more subtle biases. KL divergences indicate that imagined comfort/safety provide less information about first-person comfort/safety when judging the minor arterial compared with the collector and major arterial (tables 2 and 3). It could be that our choice of video clips for this road type is to blame. Trying to represent a bicycle ride of 10–15 min in four 10-s video clips was challenging and we may have exaggerated a negative feature of the environment for this road type. For example, we chose a video clip of a slow-passing bus on both the minor and major arterials, whereas only 8 and 12 of 20 bicyclists experienced a bus passing on those road types, respectively. In addition, we chose a video clip of an approach to a left-hand turn on the minor arterial. It is the only video clip that demonstrates a bicyclist crossing a vehicular lane to enter a pocket bike lane at an intersection. Although every bicyclist undertook this maneuver, it could be that emphasizing it in one of four video clips exaggerated its relative importance on the comfort/safety of the minor arterial as a whole. Further examination of a wider range of road environments would be needed to determine what it is about the environment that is difficult to imagine.
Implications and Conclusions
Our results show that imagined ratings resemble first-person experienced ratings but with a systematic negative bias. Some of the negative bias may be due to our study design; however, similar systematic negative biases have been reported when comparing other examples of imagined and first-person surveys. For example, Krach et al. ( 23 ) show that social embarrassment (a negative emotion) can be much stronger for vicarious observers than for first-person experiences. Although social embarrassment is a different experience than bicycling comfort/safety, this parallel between surveys of imagined and first-person experience suggests a broader psychological reason for these results that merits further exploration.
The implications of these results are two-fold. First, if road environments seem less comfortable and less safe when people imagine themselves bicycling than they do when they are really bicycling, non-bicyclists may need real bicycling experiences before they would consider bicycling for normal day-to-day travel. Our results thus provide indirect evidence in support of bicycling programs that explicitly create real bicycling experiences (e.g., bike to work days, ciclovias). Second, in terms of aiding road design, video surveys may provide a conservative estimate of bicycling comfort/safety depending on the surveyed population. To provide an estimate of comfort/safety that inspires road designs to make bicycling possible for the masses, important attitudes such as bicycling ability and comfort should be considered in selecting the survey population.
Although this negative bias from video surveys is intriguing, it is by no means conclusive. Future surveys of first-person versus imagined bicycling experience are warranted across other populations and geographies to determine its validity. As Davis is one of the most bicycling friendly places in the United States, perceptions of comfortable and safe bicycling as reported by Davis residents may not be representative of those of other populations. In addition, broadening the scope of this research to include different presentations of video clips (or other mediums including virtual and augmented reality) and more subtle differences in road environments (as is typically done in stated preference surveys) will improve our understanding of the relationship between imagined and first-person experienced bicycling comfort and safety.
Footnotes
Acknowledgements
This research was funded by the University of California at Davis National Center for Sustainable Transportation. The authors thank the participants, Drew Heckathorn of UC Davis for administering the 2016–2017 campus travel survey, and to UC Davis Transportation and Parking Services for their support. Additional thanks to Mike Boswell and Huyen Le for insightful comments about interpretation of the results in light of behavioral theories of retrospetive evaluations.
Author Contributions
The authors confirm contribution to the paper as follows: study conception and design: DF; data collection: DF; analysis and interpretation of results: DF, SH; draft manuscript preparation: DF, SH. All authors reviewed the results and approved the final version of the manuscript.
The Standing Committee on Bicycle Transportation (ANF20) peer-reviewed this paper (18-02992).