
Abstract
This study used three-tier architecture to analyze the relationship between the highway traffic development difference and the economic development difference in China from 1997 to 2015. Their time distribution and trends of national and regional differences were quantified via both coefficient of variation and Theil index. Furthermore, the highway traffic connectivity was analyzed for each province. The obtained results showed that the difference of highway traffic development was significantly related to the difference of economic development, and poor connectivity of highway traffic was also strongly related to economic disparity. The investment difference of China’s highway infrastructure could be divided into an unstable stage (1997–2010), and a stable stage (2011–2015). The highway traffic development difference could also be divided into two stages (1997–2006 and 2007–2015). Following the construction of central and western regions in around 2006, this difference decreased significantly; however, large differences within region remained. Provinces in the central and western regions have low connectivity and several remote main cities are not connected via high-grade highways. China’s national economic difference has been constantly decreasing; however, the three regions follow different trends. Furthermore, with the development of the central and western regions, between-region economic differences decreased rapidly. To improve the level of regional equalization for highway development, the government should reduce differences between developed and undeveloped provinces for each region and connect remote cities, thus ultimately reducing differences in economic development and promoting a balanced regional development.
Transportation construction has been identified as one of the major drivers of the economic growth of China during the past decade ( 1 ). However, China has extensively pursued a biased development of its transportation infrastructure, concentrating the main portion of public investment on the eastern regions, which directly caused the observed diversity of regional economic growth in China ( 2 , 3 ). During the “12th Five-Year Plan”, which considered the difference between poor and wealthy regions, the government has formulated a different transport development strategy, which generally reflects a fairer approach. In “The plan of poverty alleviation for traffic construction in the contiguous poverty-stricken areas (2011–2020),” the government has formulated the main direction toward promoting the equalization of transportation services, which laid a solid foundation for the achievement of common prosperity. This study investigated the disequilibrium between highway infrastructure development and economic development at three levels (national, regional, and provincial).
The enthusiasm of the economist to discuss the critical function of infrastructure investment on economic development was inspired during the late 1980s ( 4 ). Since then, considerable research emerged that examined the relationship between highway investment and the resulting economic growth. A significant share of the relevant literature used a production function model to estimate the impact of public capital stock on the resulting output of multiple economic sectors ( 5 , 6 ). Output elasticities have been reported to vary widely, which is likely due to differences in utilized spatial levels of analysis, definitions of capital stock, estimation techniques, or underlying models ( 7 ). Various studies have been conducted that specifically examined spillover effects ( 5 , 8 ) by dividing the economic impact of the transportation infrastructure into either direct and indirect effects ( 9 ) or internal and external effects ( 10 ). Berechman et al. ( 11 ) used three models and retrieved output elasticities of 0.37, 0.34, and 0.01 for state, county, and municipality levels, respectively, with respect to the obtained public highway capital. However, all these models and studies failed to take reverse causality into account, consequently overestimating the infrastructure variable coefficients in the production function ( 12 ). Furthermore, by adopting vector auto-regression method and structural equation modeling, many studies tested whether road investments would lead to productivity growth or whether productivity growth entails increased road construction ( 13 , 14 ). In other words, long-term research has investigated the causal relationship between transportation and regional economic growth.
In general, economically underdeveloped areas have been associated with poor infrastructure ( 15 ). In Europe, differences in the provision of transport infrastructure display a similar geographical pattern with the gross domestic product (GDP) per capita ( 16 ). Due to the inequality of the regional economic development in China, the exploration of the relationship between this uneven transportation development and the disparity of regional economic development has become a hot topic. It is therefore necessary to conduct an in-depth analysis of the disparity trend of regional economic growth, and to discuss how to effectively utilize the means of infrastructure investment and policies to promote the coordinated development of the regional economy.
Numerous studies examined whether the transportation development of China had differential effects on different parts of the country: Wang verified the uneven distribution of regional railway construction as the main reason for the strong differences in the economic growth rate between eastern, central, and western regions ( 2 ). Yu et al. calculated the output elasticities of the infrastructures of the eastern, central, and western regions and found that the central region has the highest elasticity, and further suggested that infrastructure investment in the central region should receive more attention by the central government ( 17 ). Zhang reported that both the transportation infrastructure and the economic growth showed strong spatial concentration characteristics and followed a decreasing trend from eastern to western regions ( 18 ). Wang et al. utilized exploratory spatial data statistics to analyze the spatial distribution difference of the highway network of northwest China ( 19 ). Cao et al. adopted the Natural Breaks function of the ArcMap software to divide transportation development levels of 183 cities from 1991 to 2003 and found that the level of urban transportation development was distinctly correlated to the per capita industrial output at the 0.01 level ( 20 ). Demurger studied the differences in the development of the inter-provincial transport network, using the density of the road network, and analyzed whether underdeveloped infrastructure networks likely led to a growing regional disequilibrium in China ( 21 ). Fan and Chan-Kang analyzed the relationships between road investment, economic growth, and poverty reduction in China, concluding that areas for road investment should be chosen to balance economic growth and to reduce poverty. The authors further indicated that investing in the coastal areas would boost economic growth, while investing inland (especially in the southwestern region) will reduce poverty ( 3 ).
Apparently, transport improvement strongly impacts regional development. A previous study reported that the implementation of a national trunk highway system has been divided into two phases. During the first phase (1990–2000), the general trend aggravates the division of Chinese economic regions, although regional disparity would be mitigated to some extent during the second phase (2000–2020) ( 22 ). The Chinese government committed to a substantial highway investment to benefit a balanced economic growth and to improve equalization, consequently defining poor and remote areas as target areas. However, the trend of regional differentiation in China, and the missing knowledge on how to effectively use highway construction to alleviate this trend, continues to provide major problems for policy makers to achieve a coordinated development of the regional economy. It is therefore important to investigate the relationship between highway traffic development and economic development at different levels and for different regions, as this is of great significance for the formulation of reasonable traffic policies and for the eventual promotion of a sustained economic development.
Regional differences can be described via the coefficient of variation (CV) as well as via Theil’s inequality index. As an index of diversity, the CV has been widely applied to the fields of economics and sociology to investigate and compare social inequality across nations, cities, and other social aggregates ( 23 , 24 ). The Theil index is additively decomposable and satisfies several desirable properties as a measure of regional inequality ( 25 ). This decomposition of the global index in partial factorial contributions is interesting in political terms as well as due to its analytical implications; it furthermore clarifies the global role or contribution of each part ( 26 ). We chose the CV and the first order decomposition of the Theil index to further study the differences between China’s highway investment and the economic development during the past years (1997–2015). The spatial correlation dimension was used to calculate the development of highway networks and the connectivity among main cities, thus testing the correlation between the connectivity of traffic networks and the economic difference within provinces. Via an analysis of the national, regional, and provincial level over time, this study exposed differences between transportation development and economic development, which will help policy makers to make more informed decisions to achieve the equalization of the highway traffic development.
This paper is organized as follows: First, the available data and the data source is described. Next, a framework for analysis and the utilized method is presented. The trends of highway investment growth as well as the regional differences within China are reviewed, and China’s highway construction differences and economic differences are analyzed. Finally, the relationship between connectivity and economic differences of the main cities for each province are presented. The paper concludes with a summary of the key findings and a discussion of necessary policy amendments.
Data and Data Source
This study chose 31 provincial administrative units of China (identical to the provinces used in this paper) as study area. According to the level of economic and technological development and its geographical location, the study area can be divided into three economic zones (identical to the economic regions used in this paper). Figure 1 shows the per capita GDP distribution and adjacency relationships of provinces and regions in the research area of China.
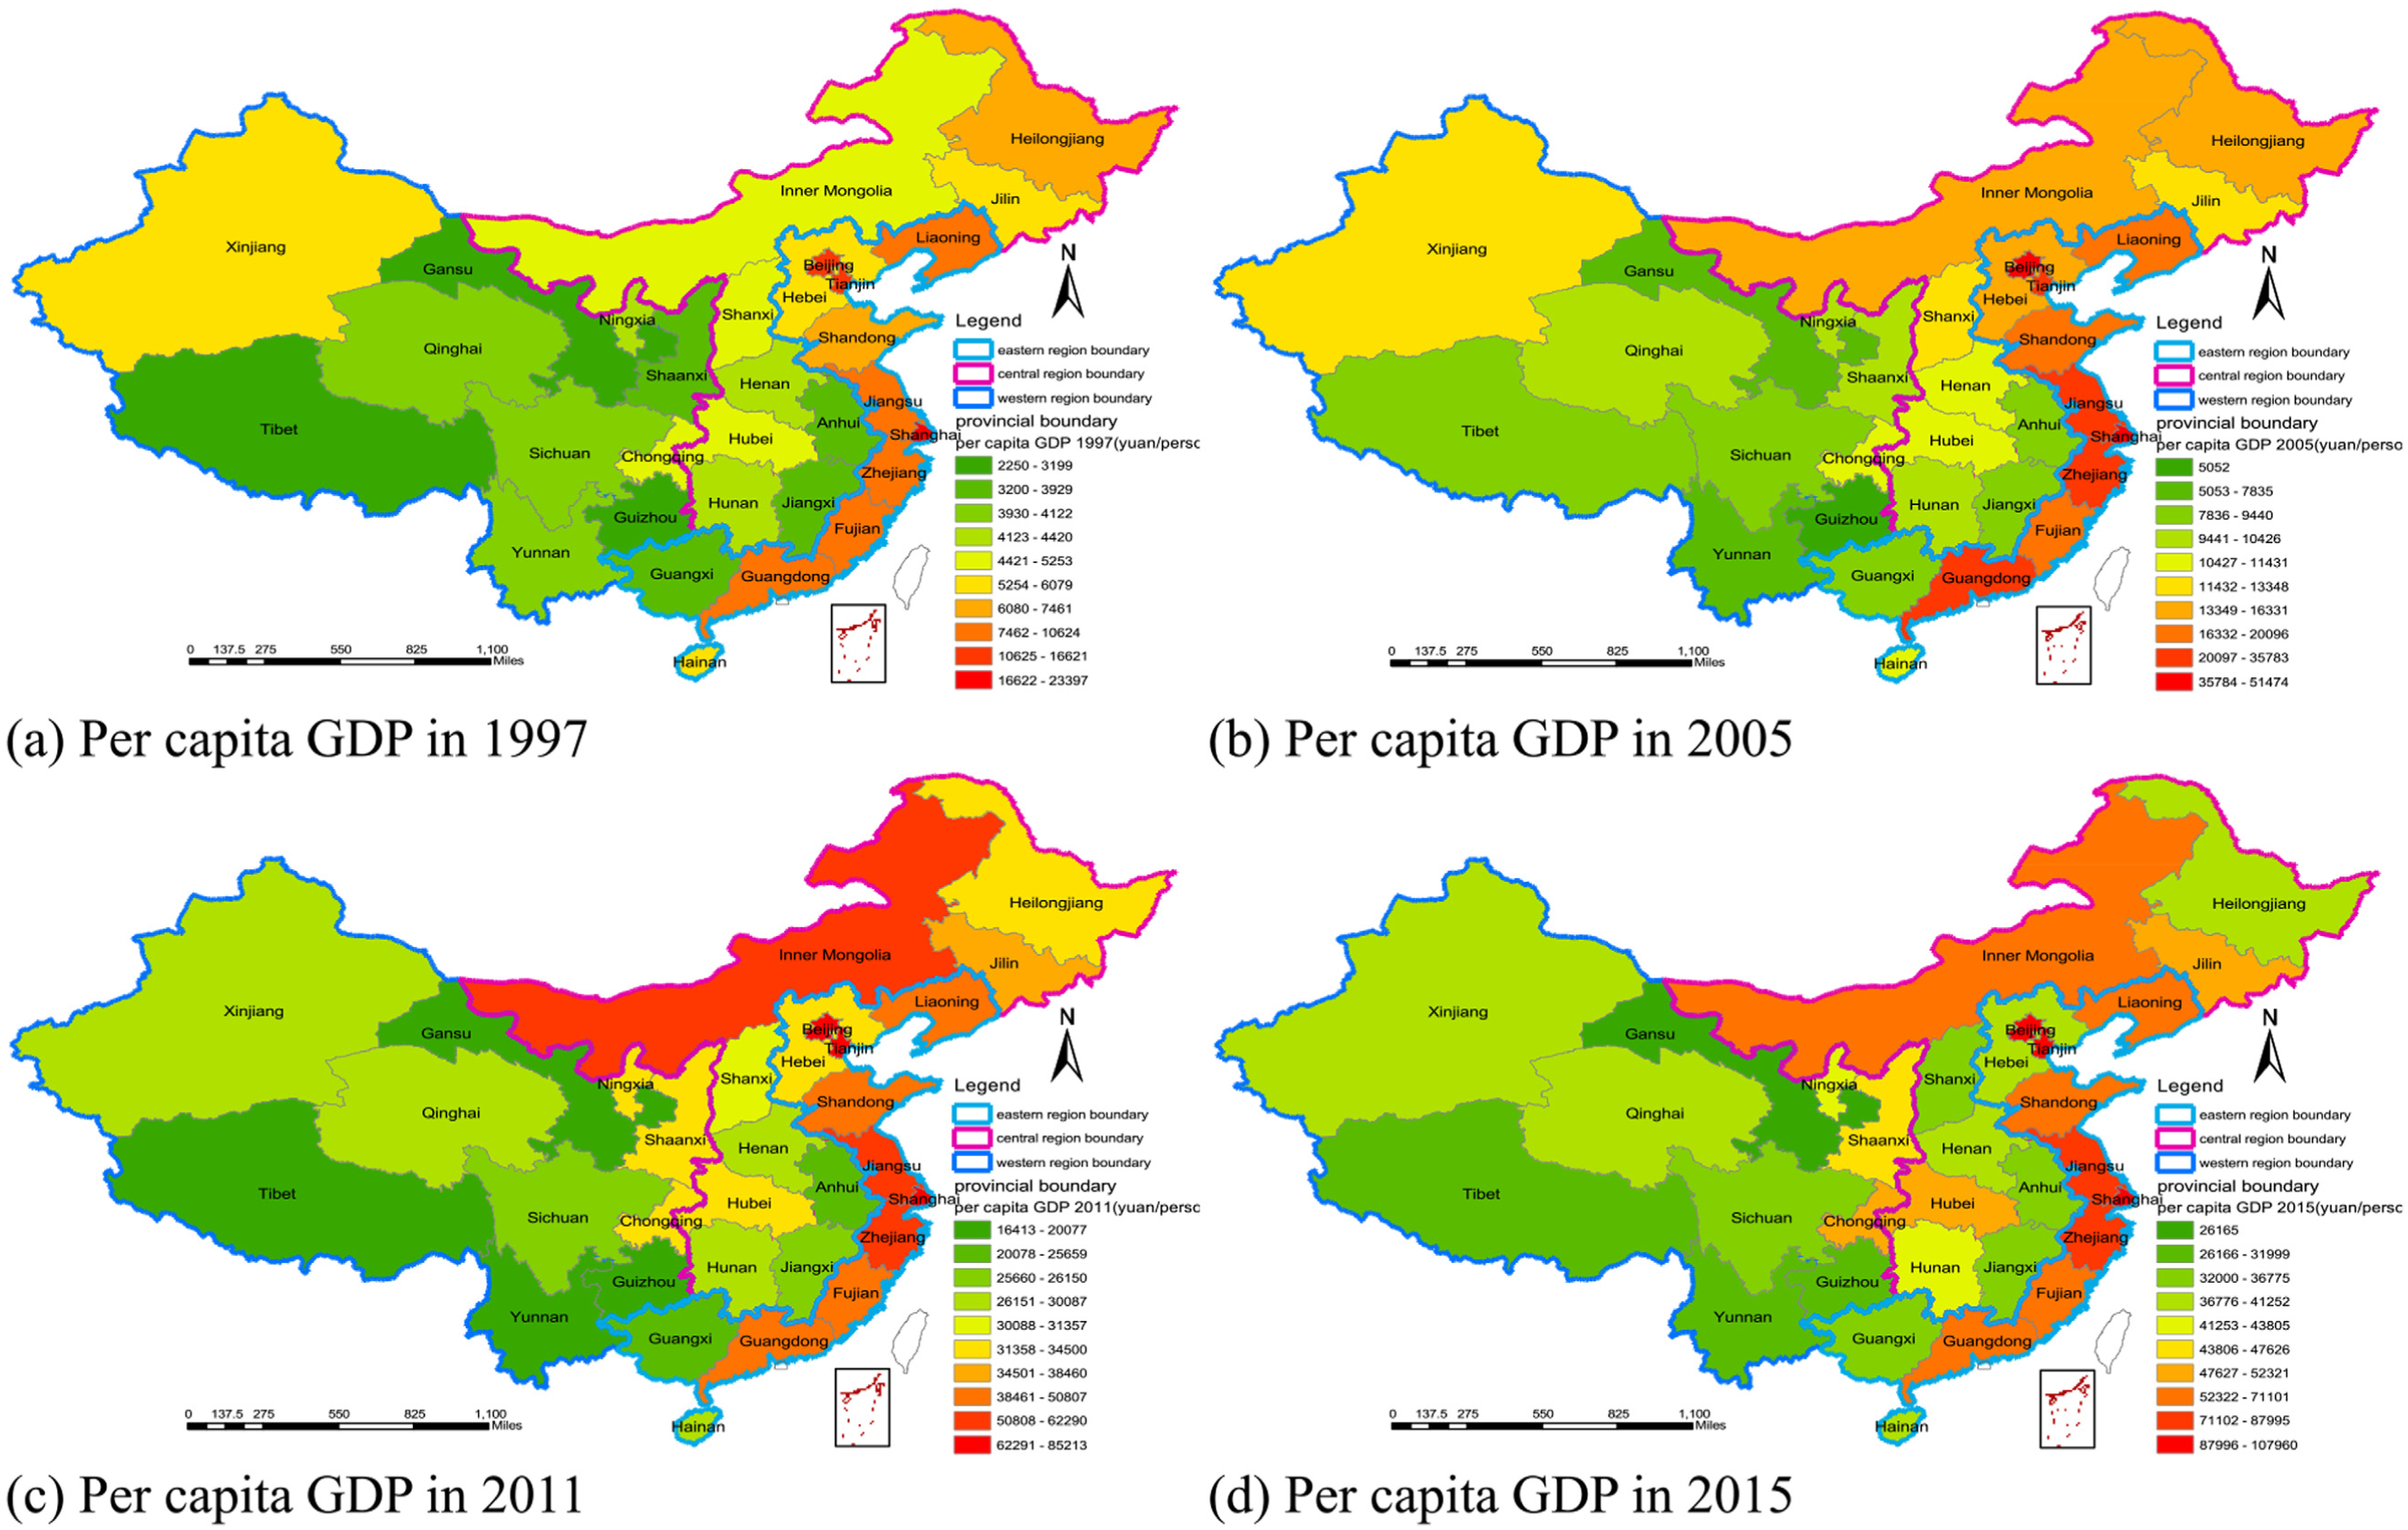
Map of the per capita GDP distribution of provinces in (a) 1997, (b) 2005, (c) 2011, and (d) 2015.
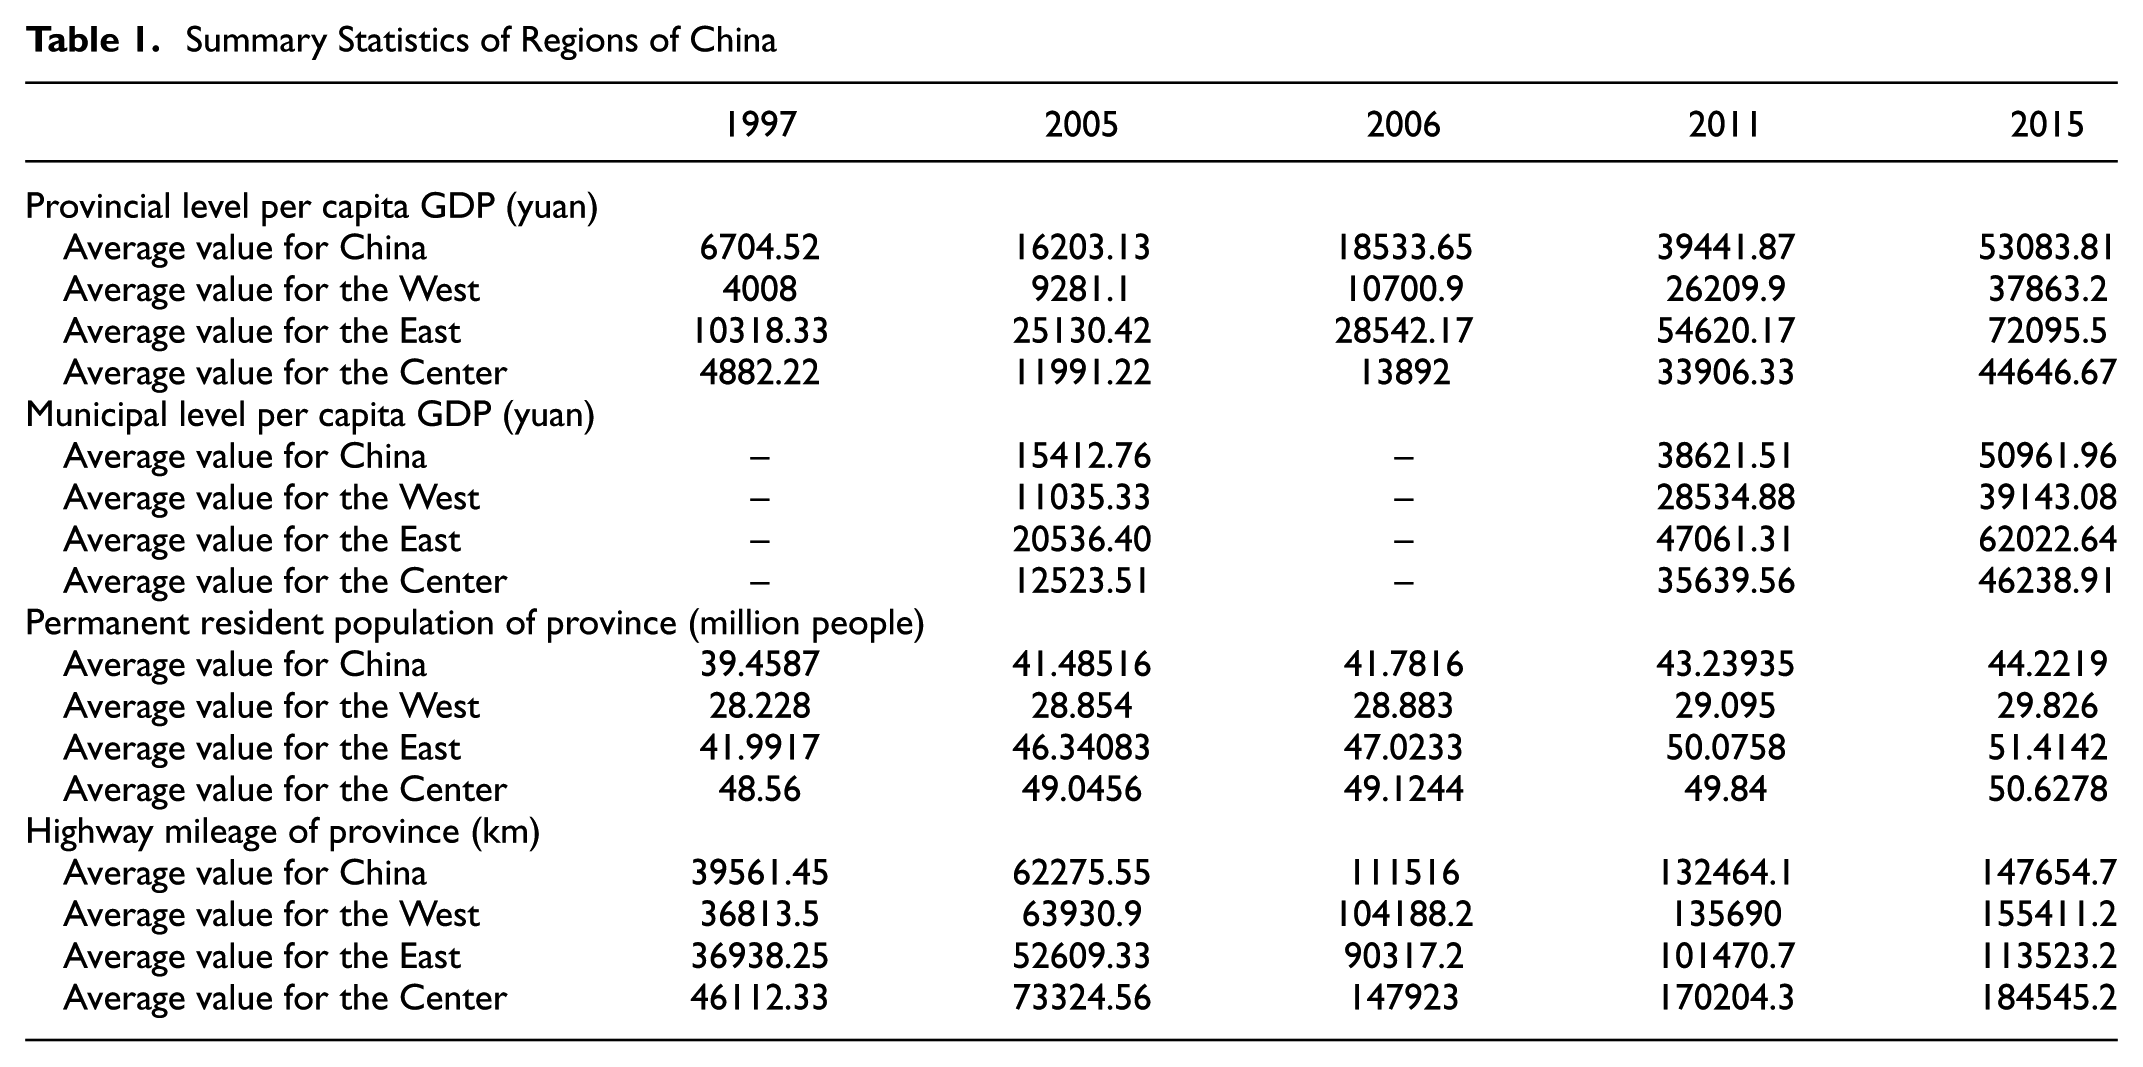
The data used for this study are the investments for the completion of highway construction at the provincial level between 1997 and 2016, and at the national level between 1980 and 2016. These data were obtained from the Compilation of National Statistical Data on Traffic and Transportation; the per capita GDP, the permanent resident population, and each grade highway mileage at the provincial level between 1997 and 2015 were supplied from the National Bureau of Statistics, Statistical Yearbook of China; the per capita GDP of prefecture-level cities was obtained from the China City Statistical Yearbooks of 2006, 2012, and 2016; the spatial distance between the main cities in each province was calculated via ArcGIS; and the traffic distance between main cities was obtained from China’s Highway and Urban and Rural Road Atlas published in 2012. The atlas provides trip distances on the basis of data measured by 1200 drivers, who prefer to travel higher-grade highways. It should be noted that according to decreasing quality level, highways in China are divided into freeway, Grade I, Grade II, Grade III, and Grade IV; therefore, freeways should be selected first, followed by Grade I highways and so on. The sources of the same category data were identical, and all of these are official publications. Table 1 presents statistical summaries of regions for per capita GDP, permanent resident population, and highway mileage.
Summary Statistics of Regions of China
Method
This study used a nation–region–province hierarchical structure for the country. Using the province as the underlying regional unit, both the CV and the Theil index were used to quantify national and regional differences, and the spatial correlation dimension was introduced to calculate the development of highway traffic for each province.
Coefficient of Variation
CV indicates the relative dispersion of data, which is calculated via dividing the sample standard deviation by the mean. According to the characteristics of CV, the per capita GDP, the density of the highway network, and the completion investment of the highway construction were selected for each province to measure spatial and temporal differences between China’s road traffic construction and its economic development at different scales. Difference indicators were calculated one by one between 1997 and 2015 and the equilibrium degree and the relationship between highway transportation development and economic development of China were dynamically investigated. A larger CV indicates increasing difference between provinces or regions.
CV is defined as a proportion

where
Theil Index
First order decomposition of the Theil index can be easily extended to an analysis of the between-region and within-region components of the national inequality. The overall national difference can be measured via the Theil index (

where
If we define

Then, the national Theil index
where
Later, the Theil index of highway mileage was calculated as
Space Relation Fractal Dimension
After analysis of CV and TP, we obtained both the spatial and temporal differences of highway traffic development and economic development in China as a whole, and as segmented into different economic regions. The geographical location, resource endowment, and the spatial distribution of the inner cities and towns differed for each province. Next, the spatial correlation dimension indicated spatial connectivity of urban systems, and the development and connectivity indices of highway traffic were calculated for provinces; then, correlations with the economic differences of provinces were investigated.
The areal inhomogeneity of cities can be sufficiently characterized via the fractal correlation dimension D of the network (
27
). To obtain D of each province, the spatial correlation function

where

The spatial distribution of the city unit has fractal characteristics, and should therefore be scale invariant; then,

where
The correlation dimension of the actual traffic distance (
The traffic connectivity index ρ is calculated via

Analysis and Result
General Analysis of Highway Development and Economic Development of China
The Chinese government invested massively into road construction to accelerate the expansion of the road network throughout counties and towns, to improve the overall quality of roads, and to increase the total mileage of expressways. Since 1984, the Chinese government has further increased its investment in roads infrustructure, particularly for high-quality roads such as highways that connect major industrial centers in coastal areas. During the 1990s, infrastructure investments became a national priority. During the early 2000s, road projects were an important part of China’s strategy for the development of the western and the central regions. In 2005, the Western Development Strategy and the Central Rise Policy were launched to improve transportation to the interior of China.
To contribute toward the building of a moderately prosperous society, the highway construction of China has currently entered a vital period. The aim of the “13th Five-Year Plan” was to connect all counties at least via secondary highways as well as to connect counties with freeways where topographical, technical, and economical conditions permit this, thus realizing an inter-village commuter bus in 2020. The completion of this highway construction investment from 1980 to 2016 in China is shown in Figure 2. This reflects that the policy investment effort of highway construction in China increased steadily and that the annual rate of investment growth levelled during recent years. The growth rates averaged 18.5%, 15.8%, and 7.2%, respectively, during 2002–2006, 2007–2011, and 2012–2016.
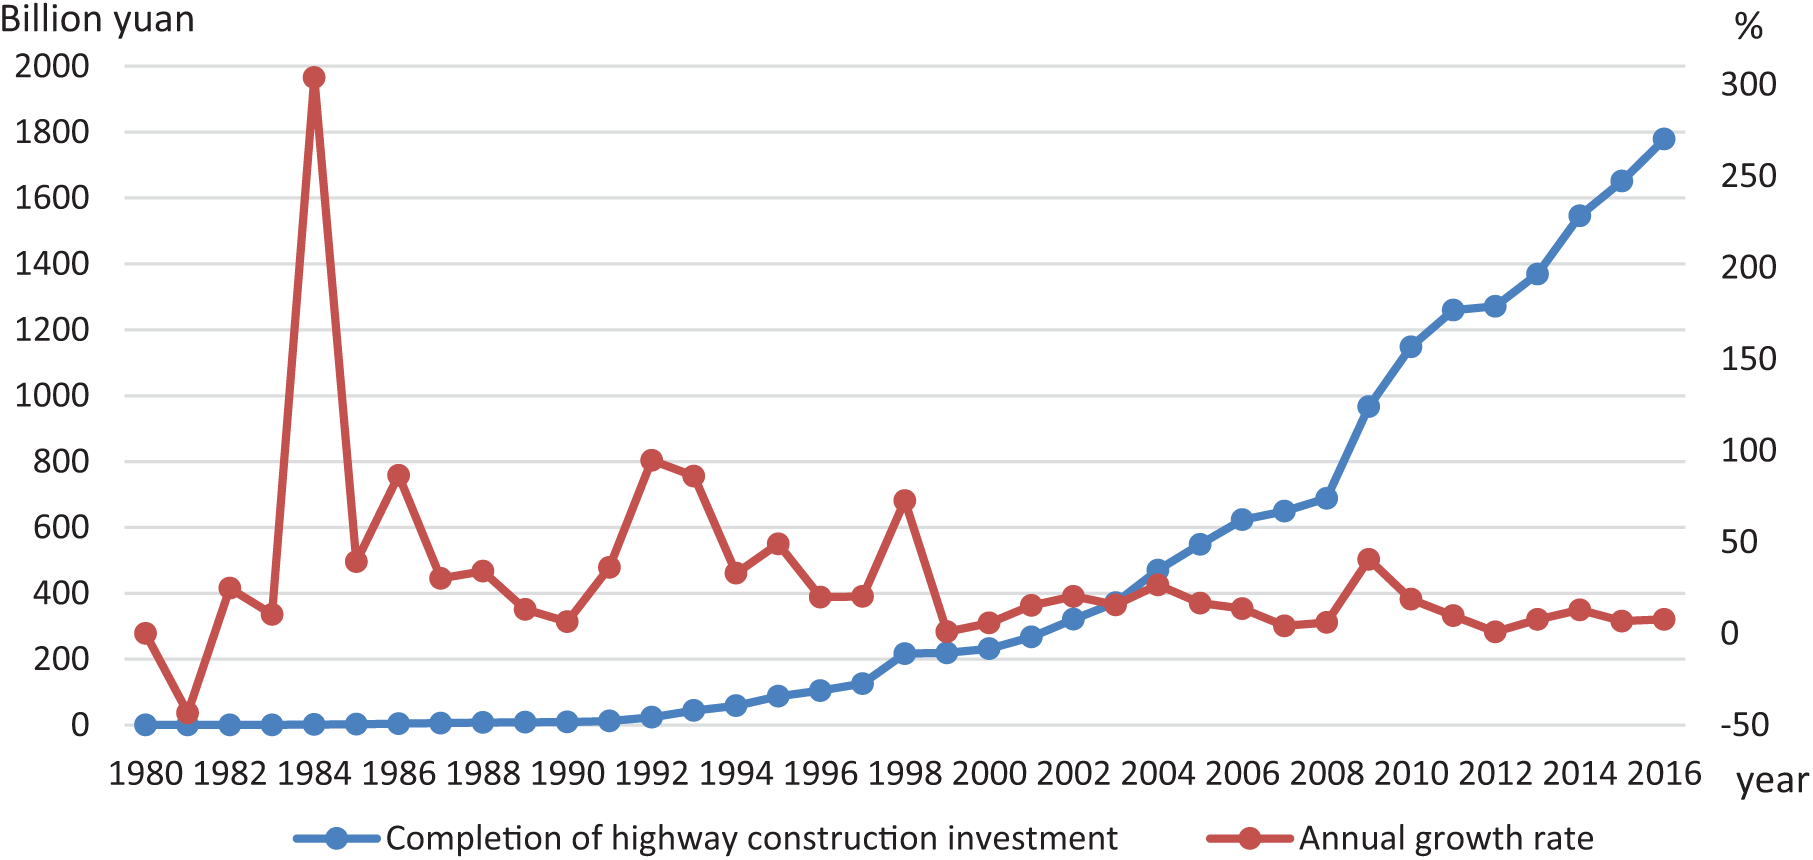
Completion of highway construction in China over time.
Both the reform and introduction of the long-term implementation of public investment was concentrated in the coastal regions and in urban areas. Therefore, large regional variations exist within the density and quality of the highway infrastructure in China (Table 2). The western region is poorly connected compared to the central and eastern regions. In 2002, only 19 km of roads existed for every 100 km2 of land in western China, compared to more than 58 km per 100 km2 of land in the eastern region. Among all provinces, Tibet and Qinghai are particularly poorly equipped with road infrastructure with a road density of only 6 km and 10 km per 100 km2 of land in 2015, respectively. Road quality is also worst in the western region and the construction of a freeway in Tibet began in 2014.
Comparison of the Highway Development of Different Regions
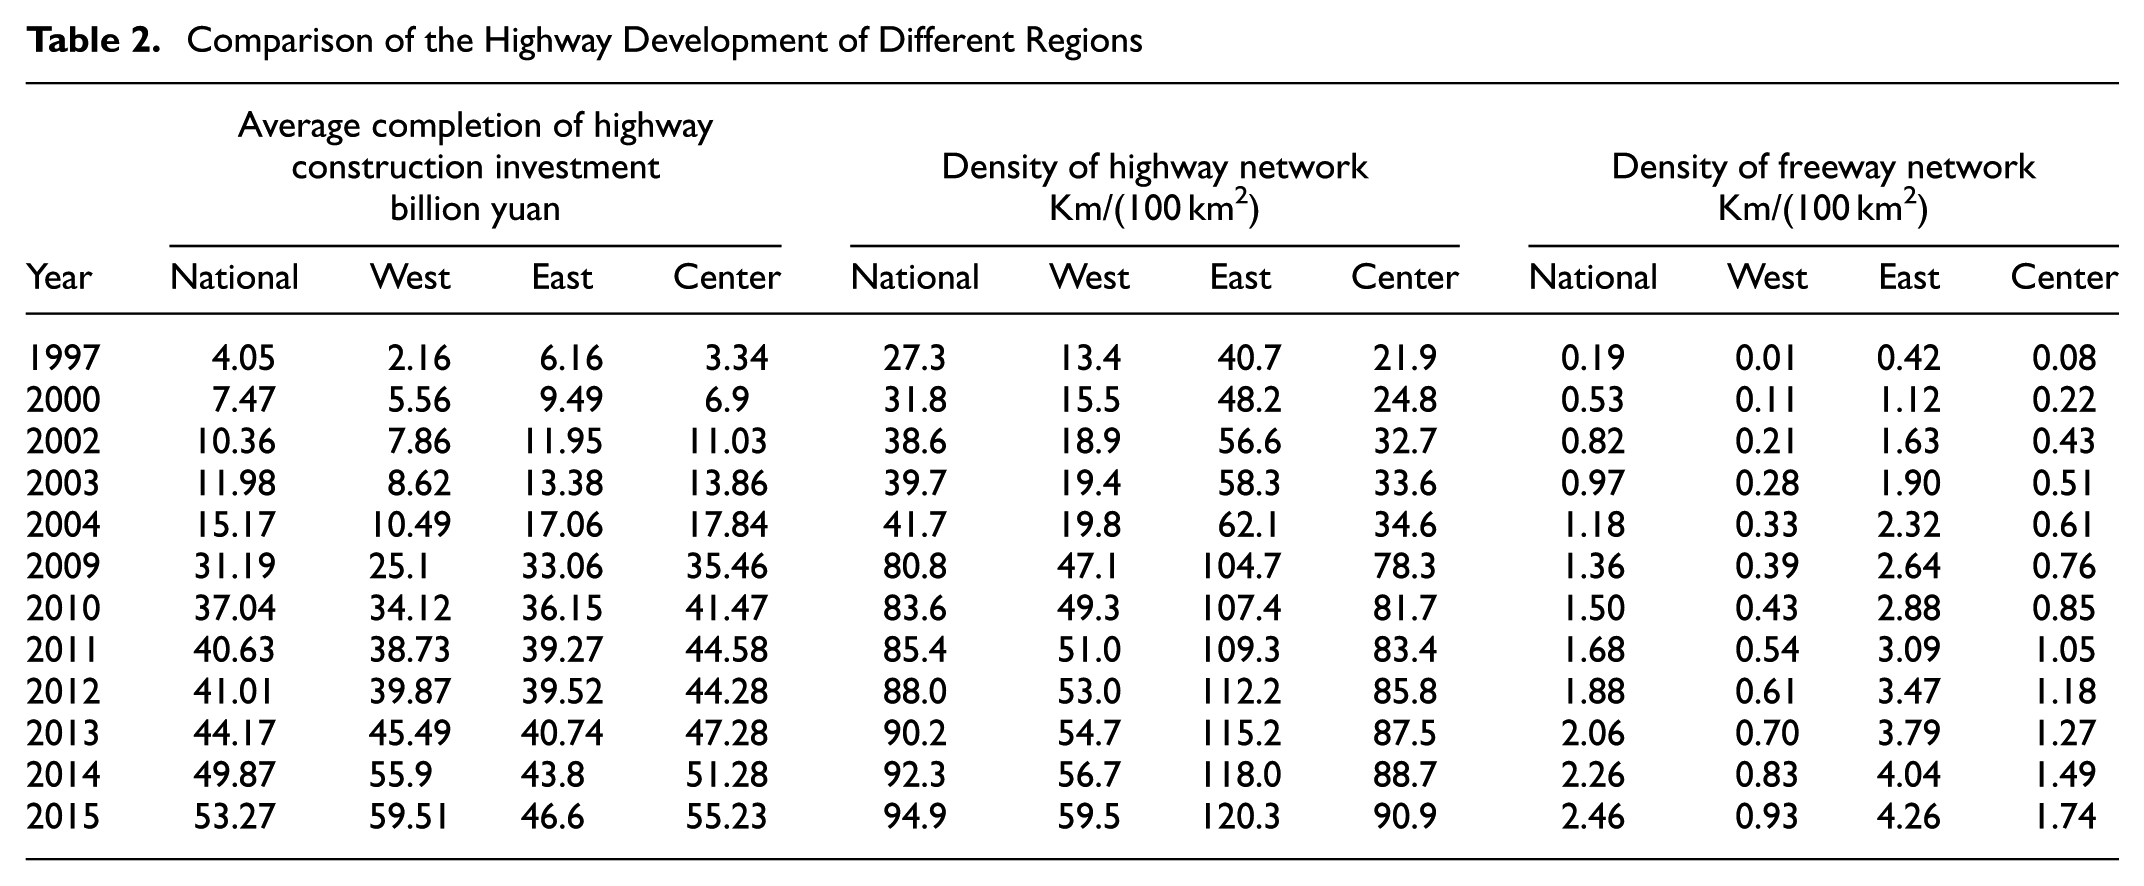
In 1997, the investment ratio of the west to the east and to the center was 2:6:3. Completed investments for the center exceeded those of the east in 2003. Furthermore, in 2012, the west exceeded the east. In 2010, completed investments of the east were below the national average. Currently, China is vigorously promoting infrastructure equalization.
In China, most coastal provinces in the eastern region are economically rich, while most of the provincial areas of the center and the west are among the poorer provinces. Furthermore, the state of economic disparity between regions has continued, which is shown in Figure 1. The lack of transportation infrastructure has caused a development bottleneck, restricting the economic development of the western region as well as that of remote mountainous areas ( 3 , 21 ).
Difference Analysis Based on the CV
Considering the provincial administrative unit as the basic analytic unit, the national and regional
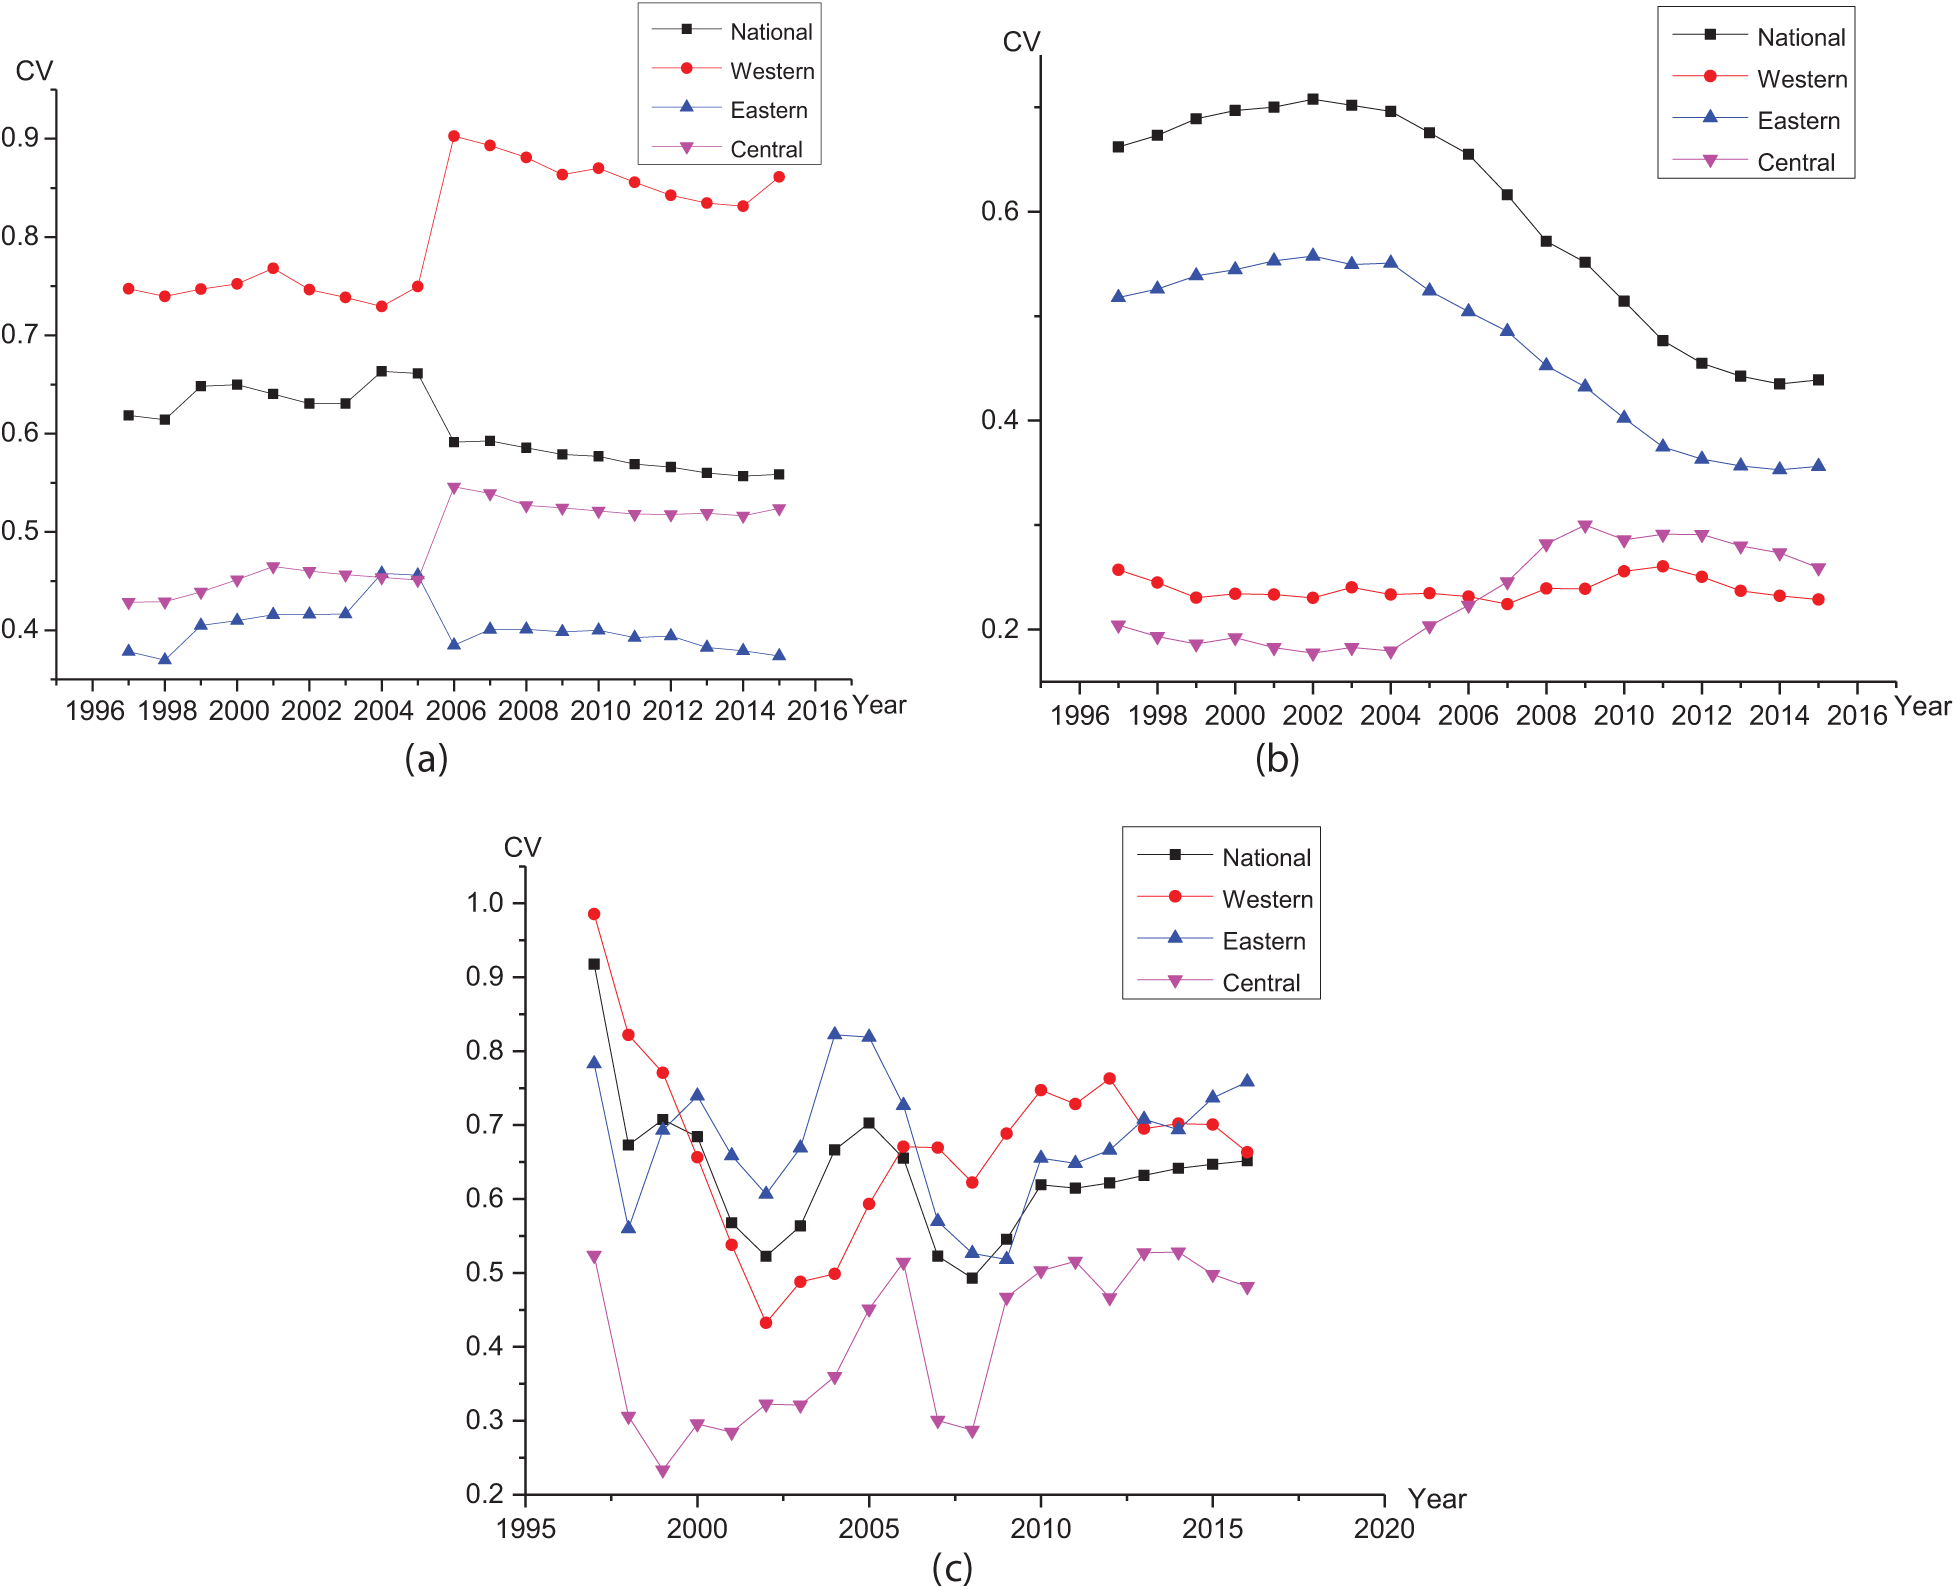
CV of highway traffic development and economic development for different regions for (a) density of highway, (b) per capita GDP, and (c) investment.
Between 1997 and 2015, the development of highways in the western region was quite different, and the national difference was considerable, while the development of the center was relatively balanced. Its development and evolution can be divided into two stages: a strong fluctuation in the difference of highway development existed during 1997–2005, and the difference of highway development decreased and stabilized during 2006–2015. In 2006, the first year of the 11th Five-Year Plan, a highway expansion project and other projects were conducted as a result of which, the national and eastern difference of the highway network was noticeably reduced; however, the difference of western and central regions increased.
The regional economic disparity of China is constantly decreasing, especially among the eastern provinces; however, it still remains at a high level. During 2005–2006, investments were concentrated in the Henan and Hubei provinces of the central region, and as a consequence, the economic difference of the central region first increased, while it recently follows a downward trend; the production levels of western provinces are generally low and economic differences are small and fluctuate slightly.
According to the national
The national
Difference Analysis Based on the Theil Index
Using the provincial administrative unit as the basic unit of analysis, the national and regional
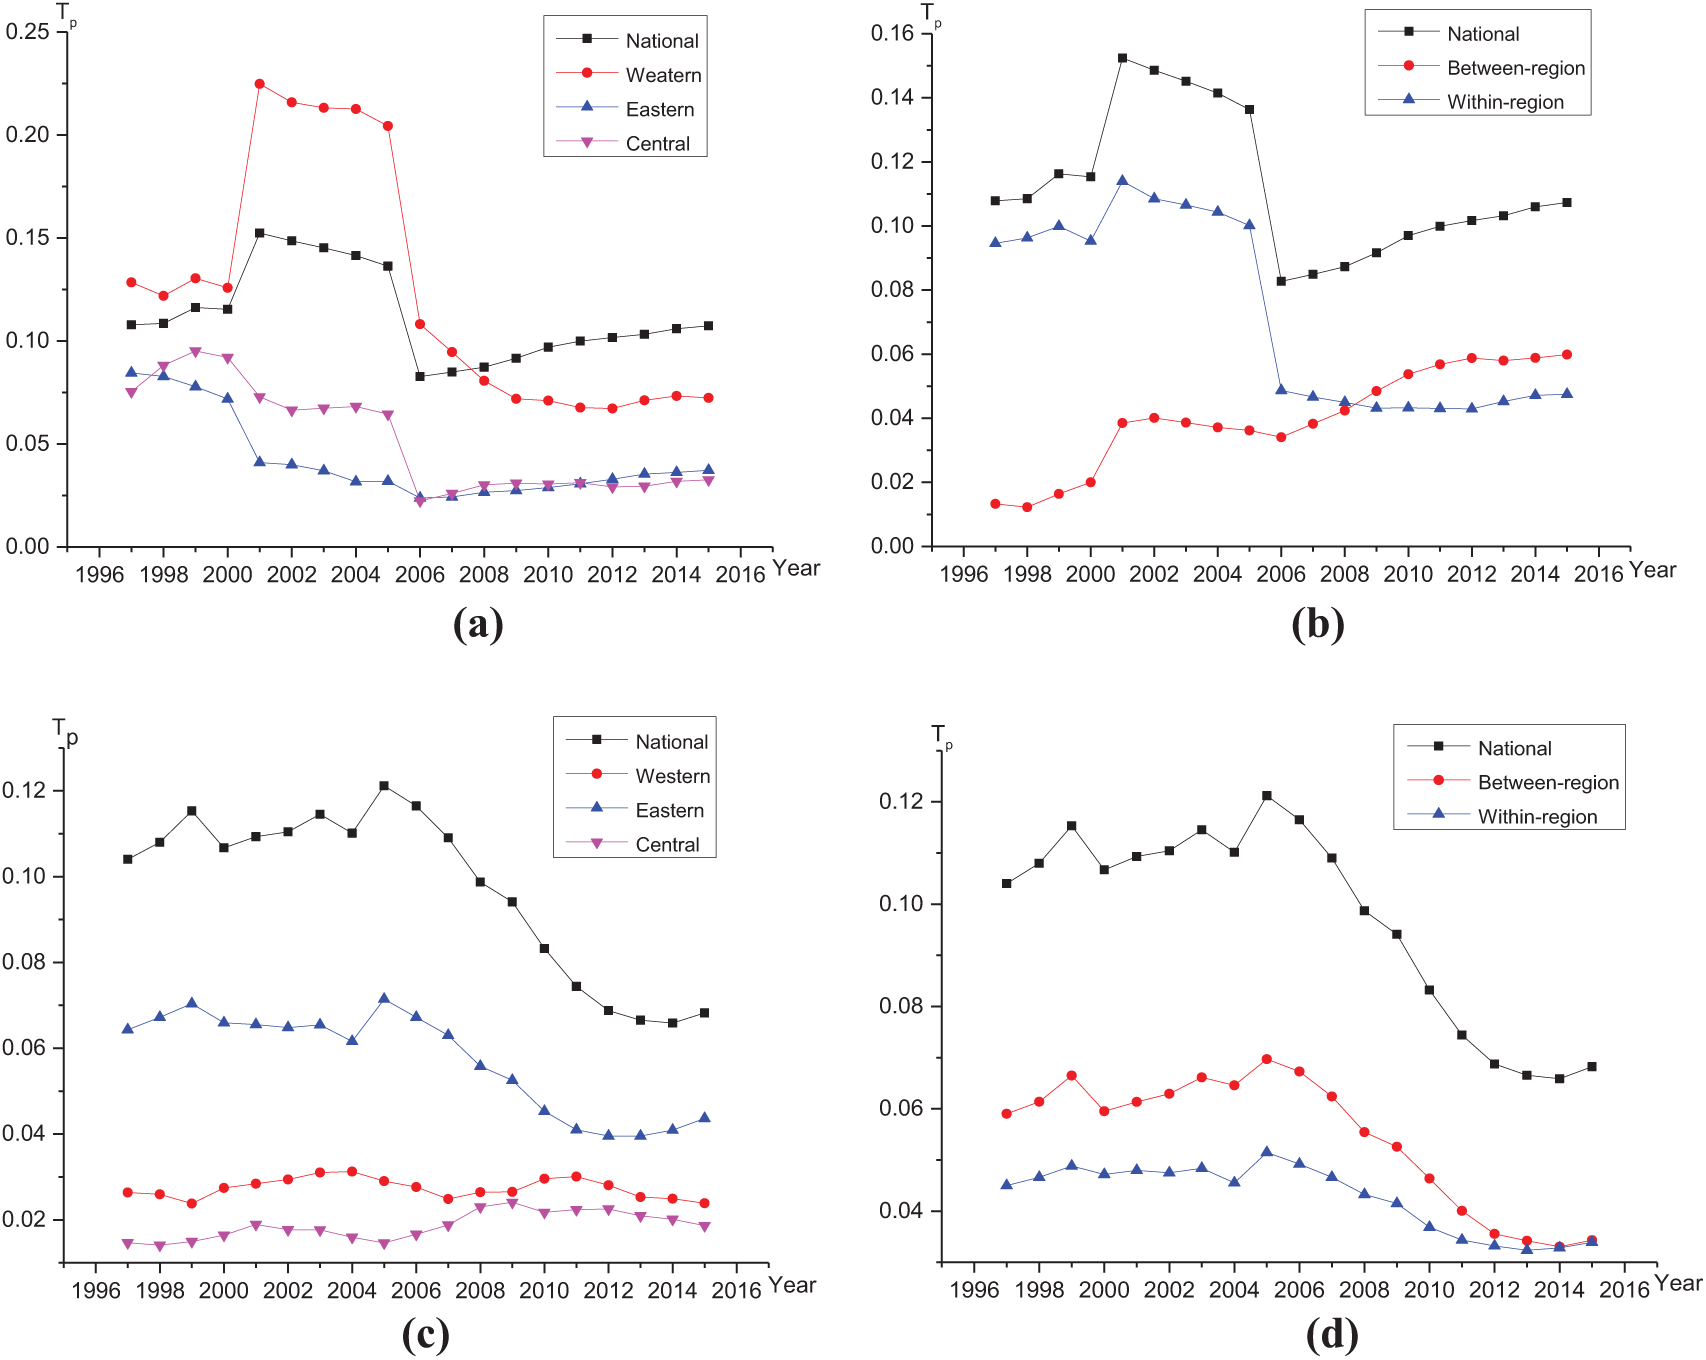
Tp of highway traffic development and economic development in different regions for (a) length of highway, (b) first order decomposition of national length of highway, (c) GDP, and (d) first order decomposition of national GDP.
Figure 4a provides the same conclusions as the analysis of variance coefficients. The difference of highway development and its evolution can be divided into two stages: 1997–2005 and 2006–2017. The difference of
Since 1997, the difference of highway development in China has mainly manifested as an inter-regional difference, which has been decreasing during recent years, while between-region differences have gradually increased. In 2008, the total length of highways in the western region exceeded that of the eastern region for the first time and between-region differences gradually developed into the main cause, increasing annually until these differences finally steadied. The difference of China’s economic development can mainly be ascribed to between-region differences. It decreased annually and is currently equal to within-region. Investments carried out in the western and the central regions have achieved a reduction of this difference.
In the process of equilibrium development of the highway construction, the difference between developed and underdeveloped provinces of regions should be predominantly reduced.
Analysis of Highway Traffic Connectivity and Provincial Economic Difference
The connectivity of highway traffic was calculated via spatial correlation dimension, and the relationship between highway traffic connectivity and economical difference was verified in the provinces. The lower triangular matrixes are known for each province (except for four province-level municipalities) in which nondiagonal elements are equal to the spatial distance and the actual traffic distance between the corresponding vertices provided by main cities, while the diagonal elements all equal zero. This study used a step Δr of 20 km, according to both maximum and minimum of the spatial distance between the main cities in the province. Furthermore, the range of the r value in each province was adjusted, obtaining the series r and C(r); then, the scatter diagrams of ln(r) and lnC(r) were drawn, and the spatial correlation dimension D of each province was obtained via least square fit. D’ was obtained with the same method, simply by changing the space distance into the actual traffic distance. The calculated results are shown in Table 3.
Highway Traffic Connectivity and Economic Differences of Provinces
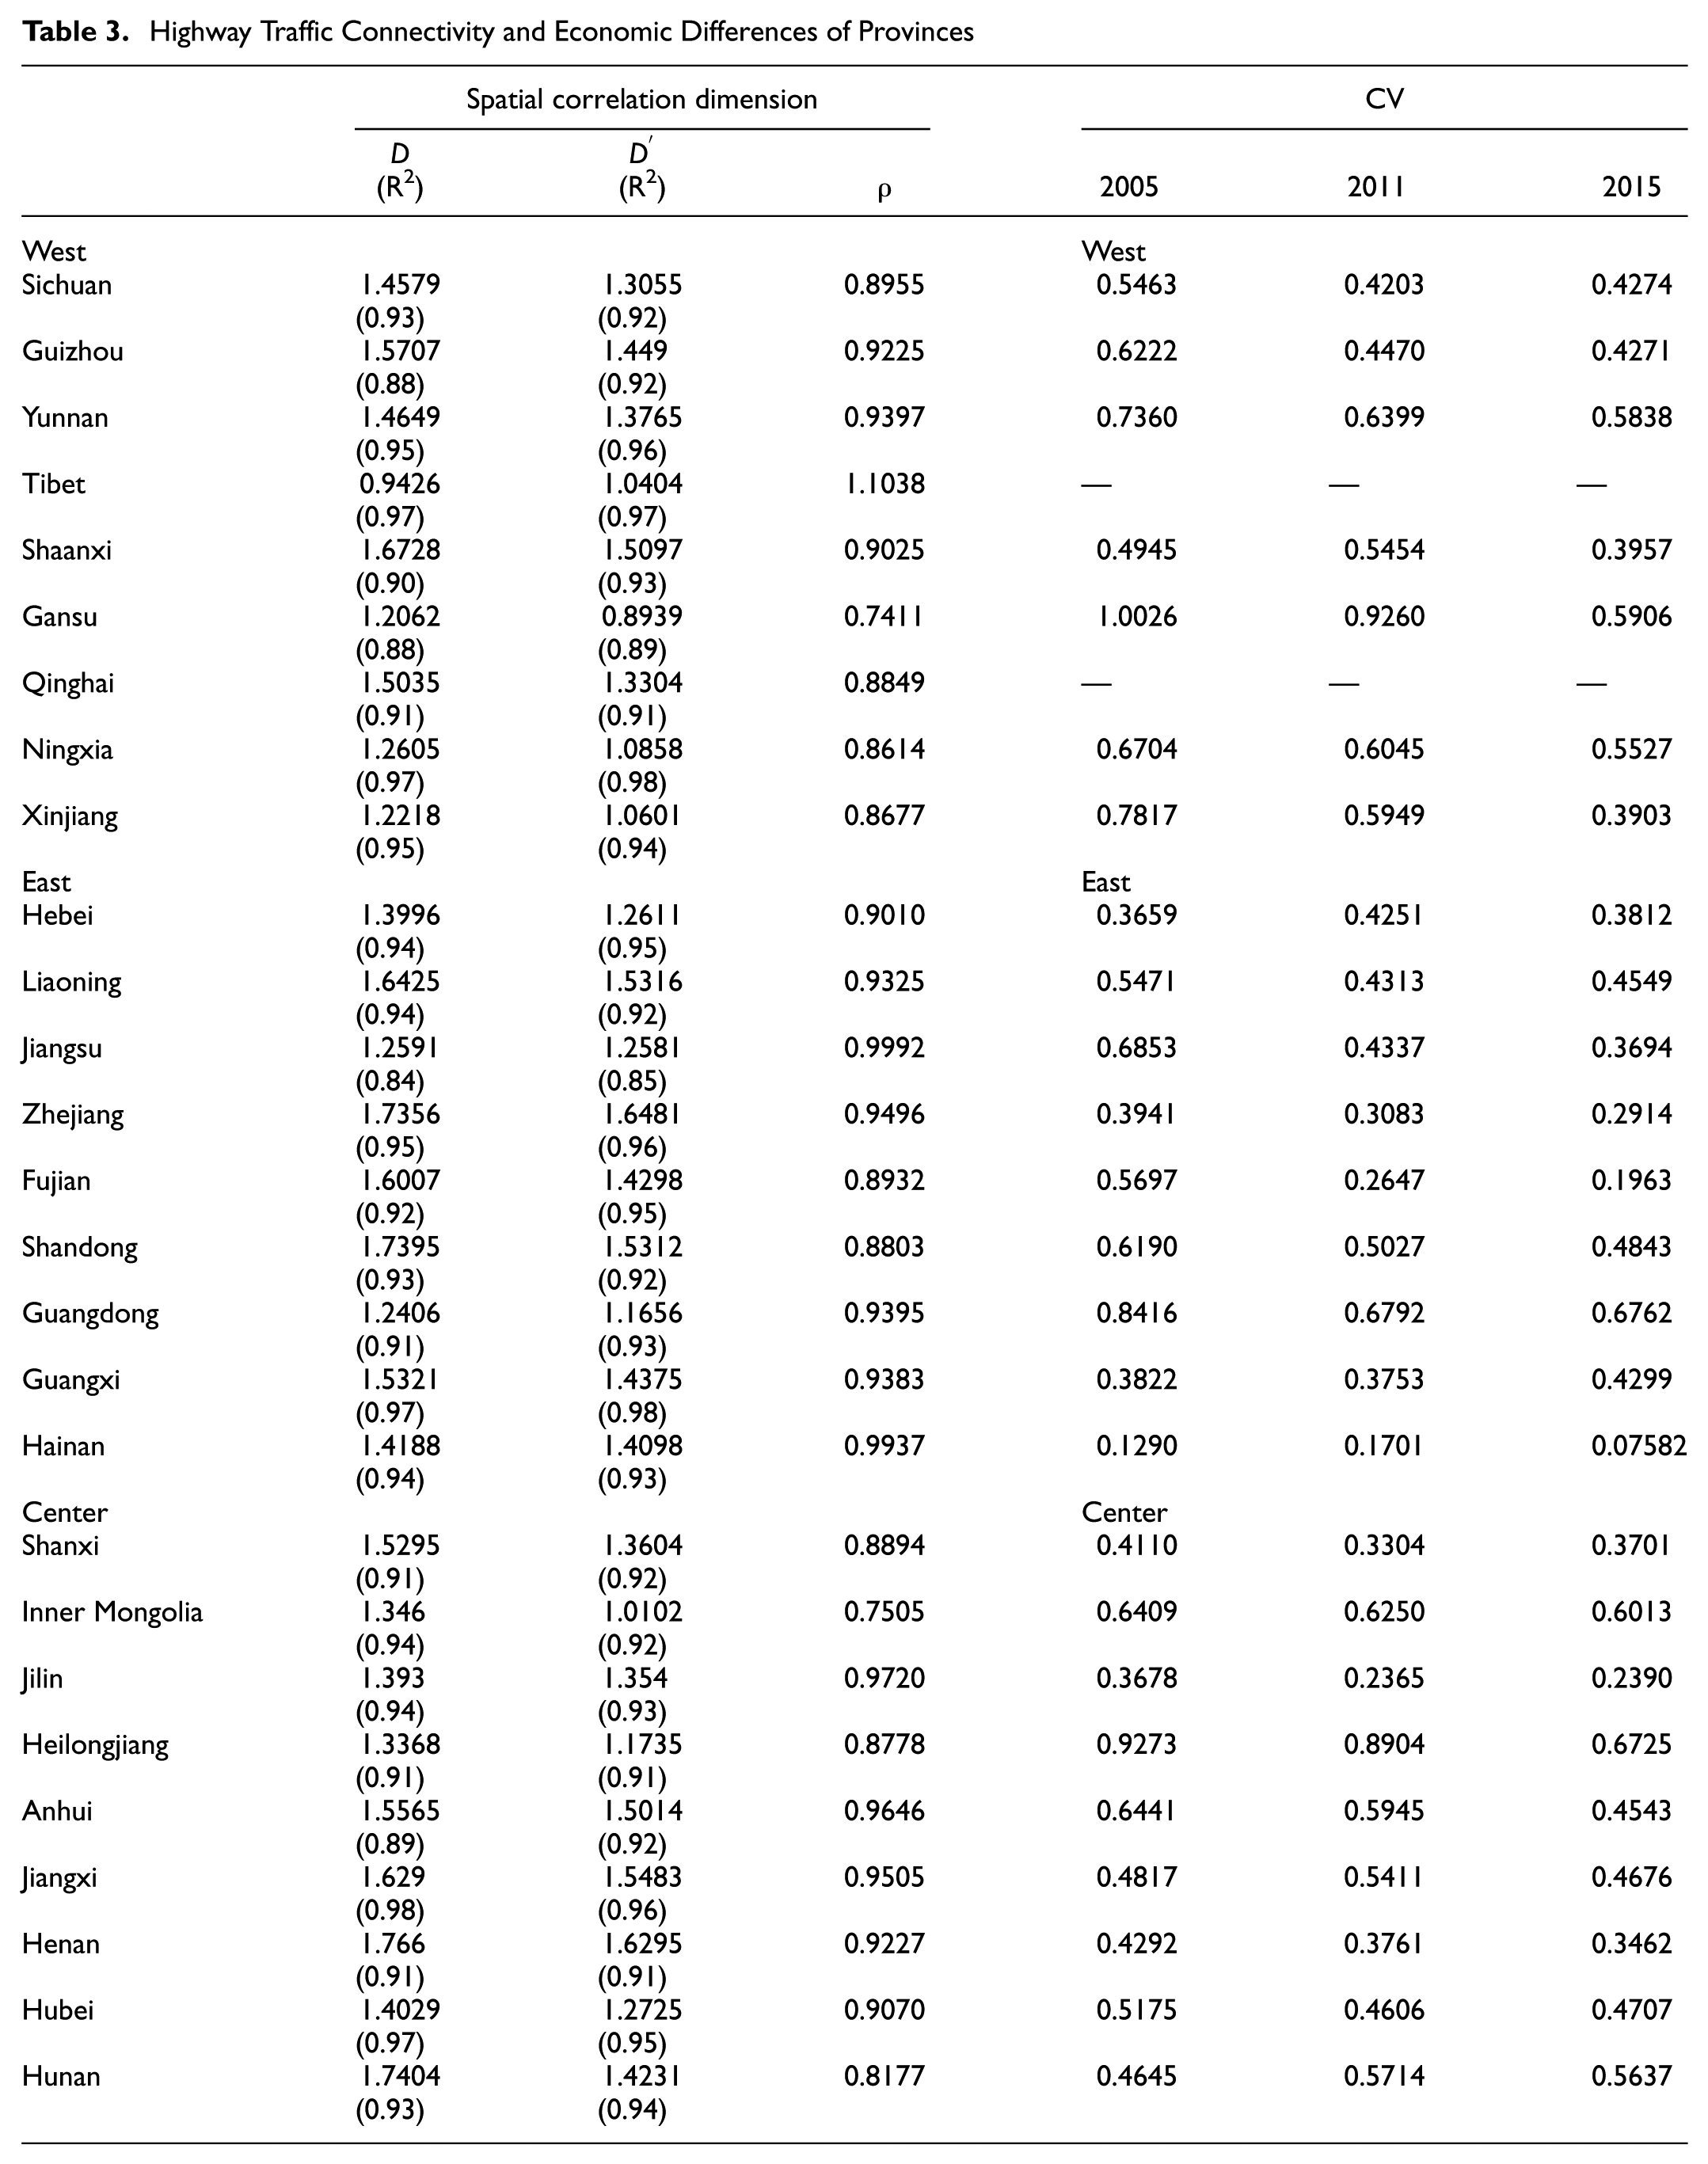
Economic differences within each province are represented by the CV of per capita GDP of prefecture-level cities. The calculated results are also shown in Table 3.
The D values indicate the distribution and evenness of the main cities in the province. The distribution characteristics of the main cities in Tibet are most apparent, and the main cities in this province are distributed along a curve. However, only Grade I and II roads are available for communication and exchange between cities in the province or between cities of other provinces that lack a freeway network. The D values of Gansu, Ningxia, Xinjiang, Jiangsu, Guangdong, Inner Mongolia, and Heilongjiang are all below 1.35. Due to their long and narrow geographical boundaries, their main cities are distributed along geographical lines. The main cities in the remainder of the province follow a uniform spatial distribution. The ρ values of Jiangsu and Hainan were close to 1, indicating superior highway traffic development. The ρ-value of Tibet was above 1, while for Gansu and Inner Mongolia the ρ-value was below 0.8, indicating poor highway traffic connectivity. Due to the limitation of geographical environment in the provinces of western and central China, the distances between main cities are large, and the connectivity resistance is high; consequently, several main cities are not covered, leading to an incomplete highway network. For example, the freeways of Sichuan are mainly concentrated in the east, near Chongqing, leading to a lack of high-grade road connections in the western region. Figure 5a shows that the freeway network of the study area features an apparent spatial agglomeration, which is concentrated in four province-level municipalities (Beijing, Tianjin, Shanghai, and Chongqing) and in Guangzhou City. However, the vast regions of Xinjiang, Gansu, Qinghai, Tibet, and Heilongjiang lack a developed highway network. The connectivity index ρ distribution of study area is shown in Figure 5b; here, the ρ-value of Tibet is equal to that of Gansu.
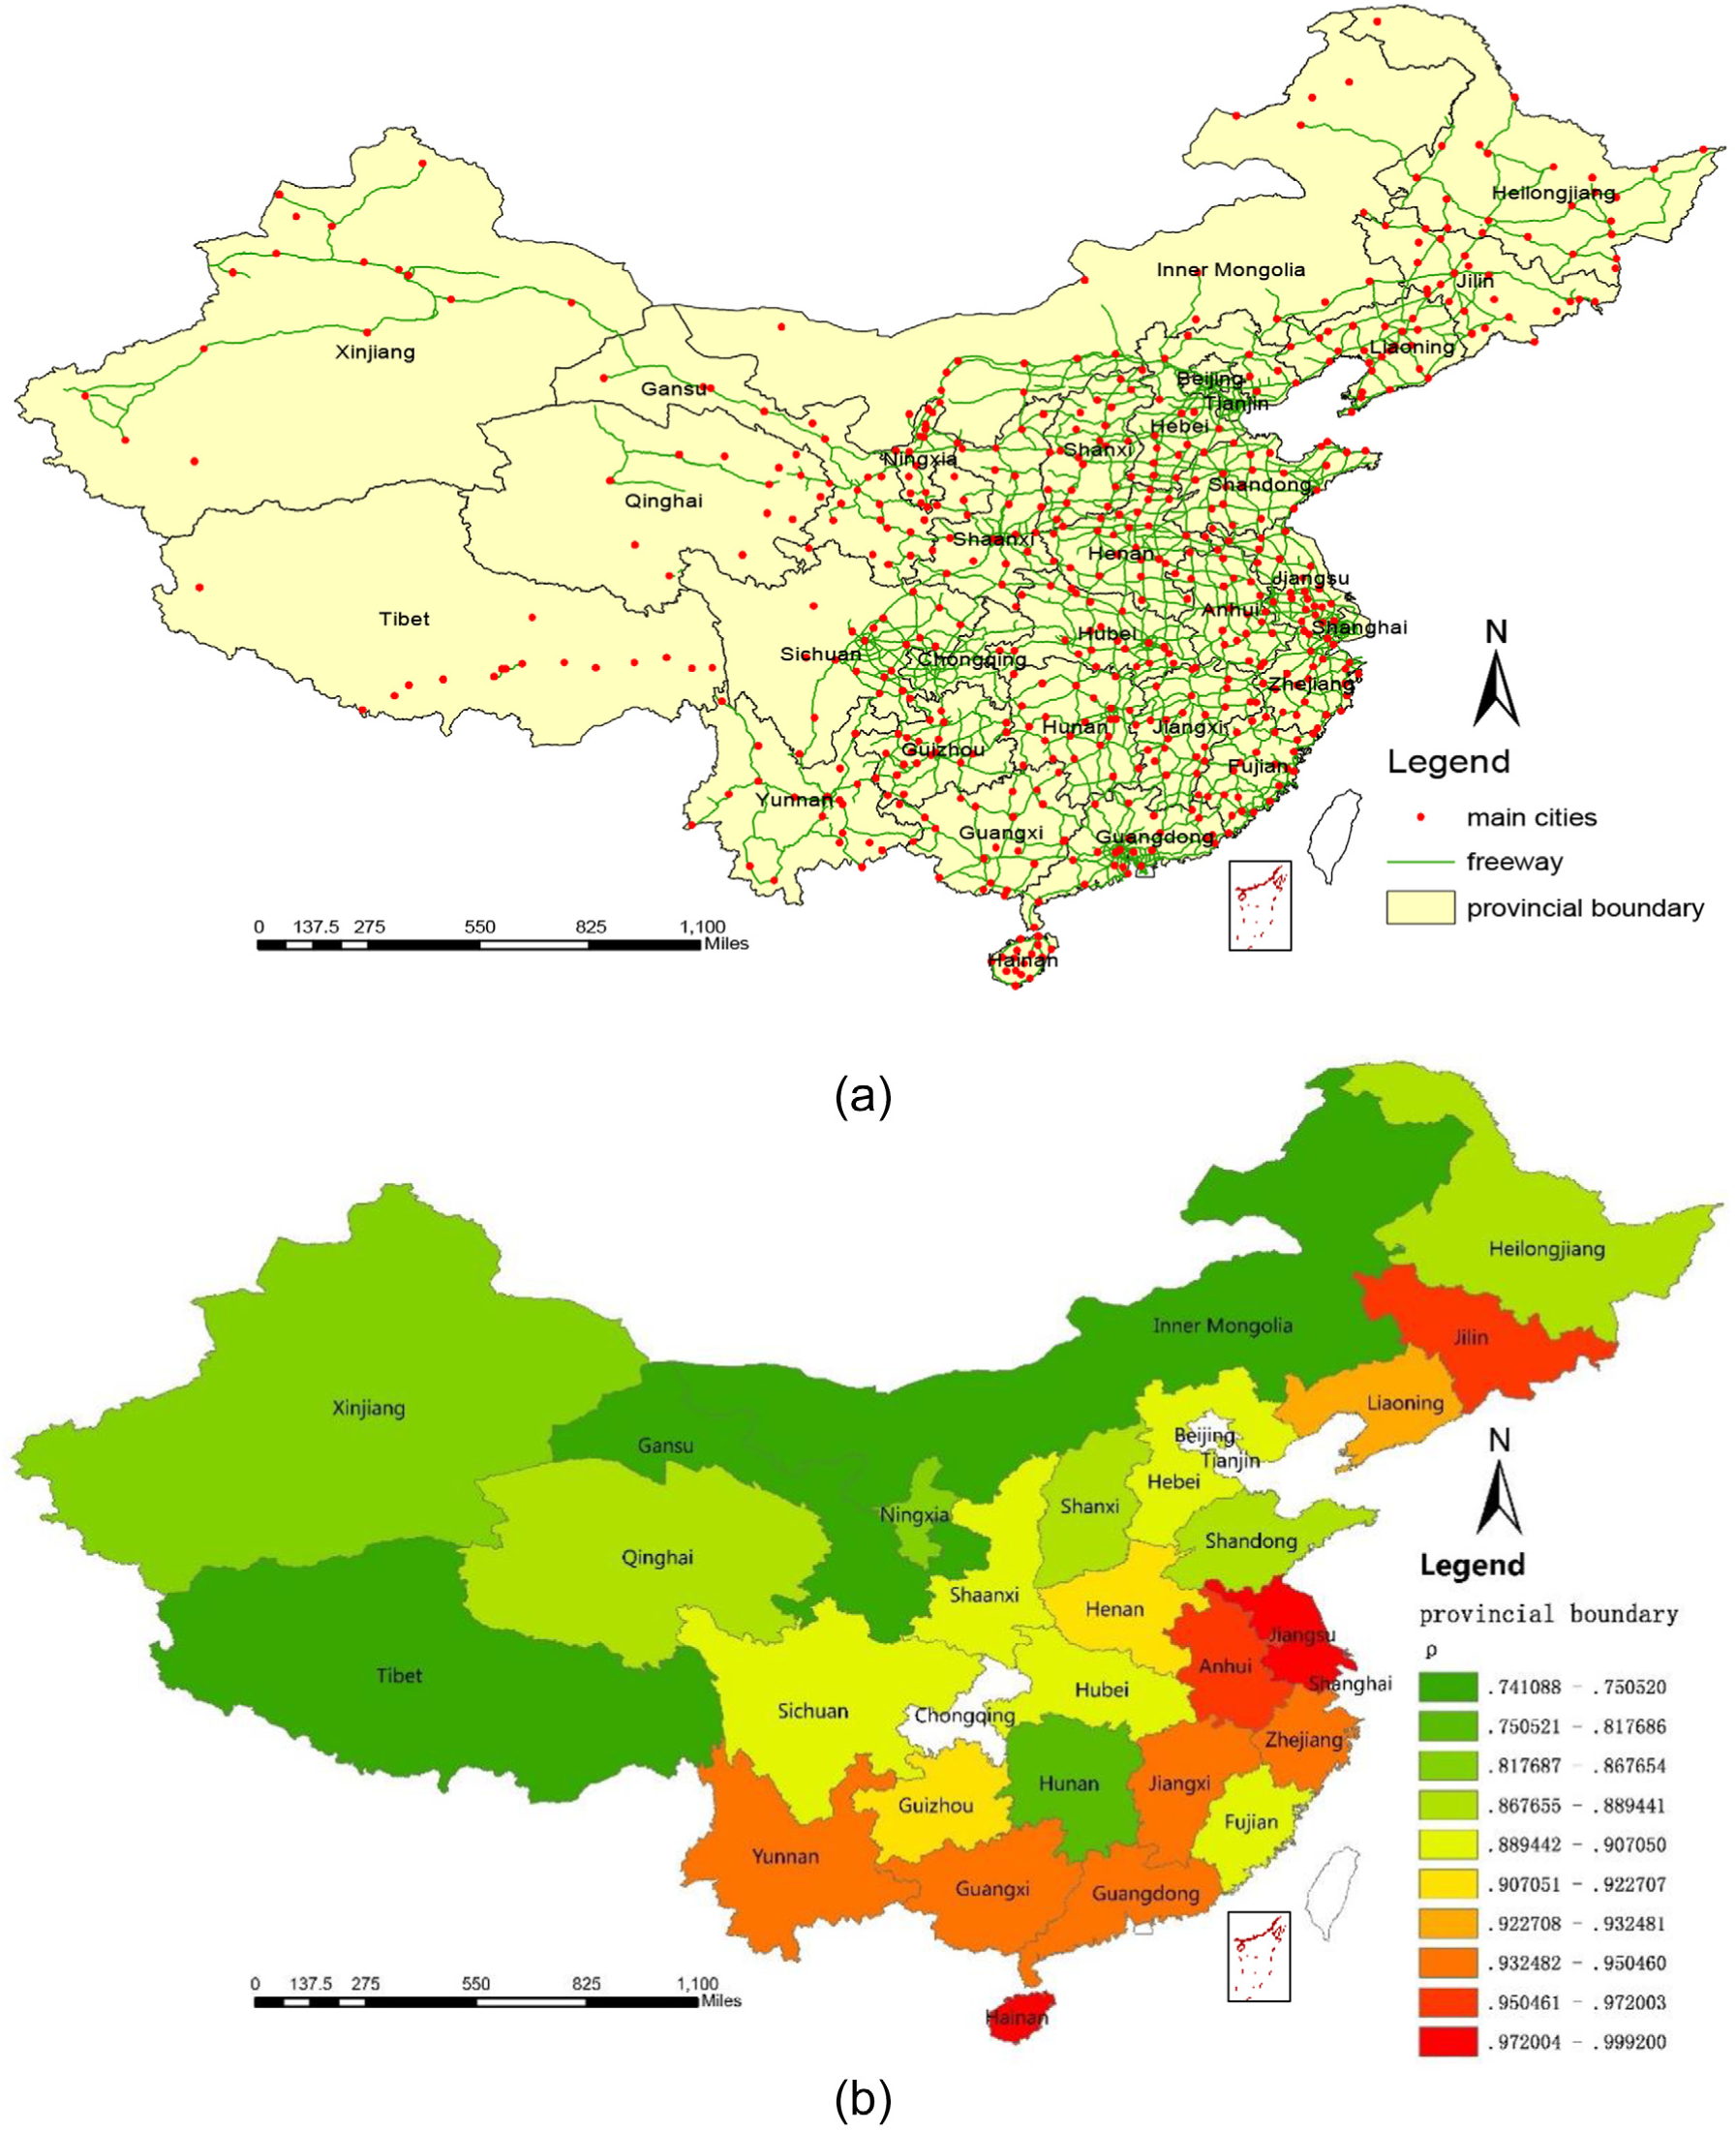
Development of highway traffic in provinces showing (a) freeway network and main cities, and (b) connectivity of provinces.
CV-values of GDP per capita decreased in most of the provinces; however, some first increased and then decreased, such as in Hunan, Jiangxi, Shaanxi, and Hebei. The CV of GDP per capita has retained a high level in Yunnan, Gansu, Ningxia, Guangdong, Inner Mongolia, and Heilongjiang, while economic differences were large. The highway traffic network in these 10 provinces shows poor connectivity and several remote main cities were not connected via high-grade highways. Traffic connectivity is the main reason for uneven economic development in the province.
Statistics of GDP per capita are incomplete for the prefecture level cities of Tibet and Qinghai, where the CV has not been calculated yet. However, judging from already existing data, Tibet and Qinghai are economically underdeveloped regions, and economic differences in the province are apparent. We conducted a correlation analysis between ρ-value and CV for 2011 (except for Tibet and Qinghai). The results show that they are significantly negatively correlated at the 0.01 level with a correlation coefficient of −0.581. Thus, the connectivity of highway traffic in the provinces is significantly related to the economic differences of the provinces.
Conclusion and Discussion
During the studied period, the differences between economic development and highway traffic development were strongly related. China is currently improving the disequilibrium of highway traffic development introduced by the previous biased policy. This study calculated and decomposed the difference of highway traffic development and economic development of China by using the CV and the Theil index. For future highway construction policies, the obtained findings offer clues regarding the suitability of implementing rebalancing policies in terms of national or regional design.
The investment difference can be divided into two stages: during 1997–2010, the government focused on investing into central or western provinces and consequently the variation of investment was large and unstable; during 2011–2016, the investment difference remained between 0.62–0.65. The difference of highway traffic development was also divided into two stages: 1997–2006 and 2007–2015. In approximately 2006, the national and eastern difference was significantly reduced, while the difference between western and central regions firstly increased and then decreased.
With the implementation of highway infrastructure construction projects, the national economic difference decreased and the resulting reaction of the three economic regions differed. The economic difference of the eastern region continued to decrease, while that of the central region first increased and then decreased (following an inverse U-shape), and that of the western region generally remained at a low level of productivity, where economic differences only fluctuated slightly.
For a long time, within-region differences contributed predominantly to the differences of highway traffic development. With the increasing highway mileage in the western region, the difference between-region has been increasing as well, which is an inevitable phenomenon and will eventually reach a steady state. The implementation of a novel investment policy has played a significant role in reducing the once dominant between-region economic differences.
The connectivity of highway traffic strongly correlates with the economic difference of a province, and improved connectivity leads to smaller economic difference in that province. However, traffic connectivity of provinces in the central and western regions remains poor. Due to many restrictions of the geographical environment, the distances between cities are large, and some main cities are not connected via high-grade highways.
Intercity railways are currently rapidly developing; however, highway transportation can provide a door-to-door service, which enables a more vigorous economic development for the region and has a significant potential to promote a balanced economic development. In future, the equalized development of highway traffic in China should first reduce the existing differences between developed and underdeveloped areas of each region. Then, high-grade highways should be built deep into remote areas.
The change of traffic mileage was less sensitive to the development of a highway network, which makes it more advantageous to study intercity connectivity or accessibility in response to travel time. With the recent development of map services (e.g. Baidu map and API interface), data support has been provided and as a consequence, studying the relationship between multimodal transportation development and economic or industrial development at different scales became convenient.
Footnotes
Acknowledgements
This study was supported by the projects of the National Natural Science Foundation of China (71774118, 91546115).
Author Contributions
The authors confirm contribution to the paper as follows: study conception and design: Ye Li, Jing Fan, Haopeng Deng; data collection: Jing Fan; analysis and interpretation of results: Jing Fan; draft manuscript preparation: Ye Li, Jing Fan, Haopeng Deng. All authors reviewed the results and approved the final version of the manuscript.
The Standing Committee on Transportation and Economic Development (ADD10) peer-reviewed this paper (18-02800).