
Abstract
Improving driver yielding to pedestrians at crosswalks may help prevent pedestrian fatalities, which have increased over the last decade in the United States. The level of assertiveness exhibited by pedestrians when they arrive at a crosswalk may have a significant impact on driver yielding behavior, but assertiveness is not defined clearly or studied thoroughly in the literature. This study defined three levels of pedestrian assertiveness and collected naturalistic video data at two uncontrolled crosswalks in Madison and Milwaukee, Wisconsin to explore the relationship between pedestrian assertiveness and driver yielding behavior. Driver yielding rates were 71% for pedestrians exhibiting Level 1 (high), 30% for Level 2 (moderate), and 3% for Level 3 (low) assertiveness. The pedestrian assertiveness definitions were also used to assess the potential impact of a high-visibility enforcement (HVE) program in the communities where the study took place. Observations taken after the HVE program showed a significantly higher rate of driver yielding to pedestrians exhibiting a moderate level of assertiveness. This result is promising, since a moderate level of assertiveness may be reasonable for pedestrians to adopt, especially if supported by educational messages for pedestrians to clearly indicate their intent to cross within a crosswalk. This exploratory study provides a framework for future analysis and highlights the need for additional research on the relationship between pedestrian assertiveness and driver yielding behavior.
According to the National Highway Traffic Safety Administration (NHTSA), there was a 12.1% increase in annual pedestrian fatalities between 2006 and 2016 ( 1 ). In 2016, the Governors Highway Safety Association estimated that nearly 6,000 pedestrians died while crossing the street in the United States ( 2 ). For such a seemingly simple task, this number is far too high. These recent increases in pedestrian fatalities underscore the need to protect pedestrians from crashes with motor vehicles and reduce their risk on roadways. Further, fatalities only represent the most harmful outcomes of these crashes – serious pedestrian injuries number more than 10 times the number of fatalities each year, which can have lifetime impacts on the people involved, in addition to their family, friends, and co-workers ( 1 ).
An improved understanding of how motorists and pedestrians interact at pedestrian crossings can lead to better engineering, education, and enforcement strategies to improve pedestrian safety. Most state traffic laws require drivers to yield the right-of-way to pedestrians crossing within a crosswalk provided the driver has sufficient time to do so. Yet, these laws are often violated throughout North America, resulting in pedestrians being struck ( 3 ). The failure of drivers to yield to pedestrians at crosswalks was the most common contributing circumstance cited in Wisconsin pedestrian crash reports between 2011 and 2015 ( 4 ). Similarly, between 2008 and 2012, 37% of pedestrian crashes reported in California involved motorists violating the “pedestrian right-of-way” law ( 5 ). Therefore, it is important to observe driver yielding behavior and gather better information about driver and pedestrian interactions. Note that Wisconsin State Statute 346.24 requires drivers to yield the right-of-way to pedestrians rather than stop for pedestrians ( 4 ), which is required in several other states.
This study explores the relationship between pedestrian assertiveness and driver yielding behavior. Previous studies have explored pedestrian characteristics such as age, gender, and race, but pedestrian assertiveness has only been examined by a few researchers. The video data collected in this study made it possible to define different categories of pedestrian assertiveness. Pedestrian assertiveness data were also compared with vehicle speed and vehicle distance to crosswalk when the pedestrian arrived, to provide a complete understanding of the complex interactions between drivers and pedestrians at uncontrolled crosswalks. As one component of a larger Wisconsin Department of Transportation (Wisconsin DOT) project, the definitions of assertiveness developed for this study were also applied to assess the impact of a high-visibility enforcement (HVE) program on pedestrian and driver interactions ( 4 ).
Factors Affecting Driver Yielding Behavior
Although roadway geometric design features and treatments – such as the number of roadway lanes and crossing distance, posted and actual speeds, and signs, markings, and beacons – have been found to have a significant relationship with driver yielding ( 3 , 6–17), only a small number of studies have examined how pedestrians and drivers interact and whether or not this interaction might also influence driver yielding behavior (18–21). Several studies identify relationships between pedestrian characteristics and driver yielding, hinting at the value of examining the role of pedestrian behavior directly. For example, Stapleton et al. found that driver yielding rates increase with higher pedestrian volume ( 10 ). This suggests that drivers tend to yield more when the intensity of pedestrians crossing a roadway increases or when pedestrians cross in groups. Personal pedestrian characteristics such as race ( 22 , 23 ), clothing color ( 20 ), and holding a cane ( 24 ) have also been associated with driver yielding behavior. Results of these studies suggest that drivers yield more often to white pedestrians, pedestrians wearing brighter clothing, and those holding a cane while crossing. Neighborhood socioeconomic characteristics may also be related to driver yielding behavior. Coughenour et al. noted that black pedestrians needed to wait for twice the number of cars to pass the crosswalk before being able to cross in high-income areas compared to lower-income neighborhoods ( 23 ).
Further, relatively few driver factors related to yielding behavior have been identified in the literature. Piff et al. noted that drivers of more expensive automobiles may yield less often to pedestrians than drivers of less expensive automobiles ( 25 ). A study conducted in Alberta, Canada found that more than twice as many men stopped for pedestrians as women ( 19 ). However, the authors noted that this conclusion may not apply in all contexts. Driver factors that could influence yielding behavior but which have not been explored in the literature include, but are not limited to: speed preferences, their perceived value of their time, vehicle constraints, social attitudes, economic considerations, and awareness of law enforcement. Traffic characteristics may also contribute to the decision to yield to pedestrians. Schroeder and Rouphail noted that when vehicles are in a platoon, they are less likely to yield ( 20 ).
Pedestrian–vehicle interaction is a topic that has gained traction in recent years following advancements in computer-aided modeling techniques. Chen et al. discussed the importance of using vehicle and pedestrian characteristics along with genetic-based modeling parameters to attain an accurate representation of pedestrian–vehicle interactions ( 26 ). A novel contribution was made when the sociological attribute of herd mentality was applied to computer-based pedestrian–vehicle modeling. This refers to the tendency of pedestrians to follow a more aggressive pedestrian when crossing. Understanding what role factors such as these play in pedestrian–vehicle interactions is key to developing more accurate modeling, allowing for increased efficiency and safety for both drivers and pedestrians. Jin et al. proposed guidelines to model pedestrian–vehicle interactions and developed a modified visual angle car-following model with consideration of the lateral effect of waiting pedestrians ( 27 ). The authors noted that considering pedestrian crossing behavior in a car-following model may help to make better-informed decisions about traffic flow efficiency and safety.
Concept of Assertiveness
Pedestrian assertiveness has been suggested as an important factor in a theoretical framework representing driver yielding ( 3 ), but relatively few studies have examined this behavior (Table 1) (18–21). Assertiveness is a characteristic that the pedestrian shows before or during the crossing activity ( 3 , 20 ). Pedestrian assertiveness may impact driver yielding behavior by increasing visibility, making the driver more aware of the presence of a pedestrian at the crosswalk, or by clearly indicating an intention to cross (as opposed to other actions, such as waiting for a bus or waiting to meet friends on the sidewalk).
Summary of Literature on Assertiveness
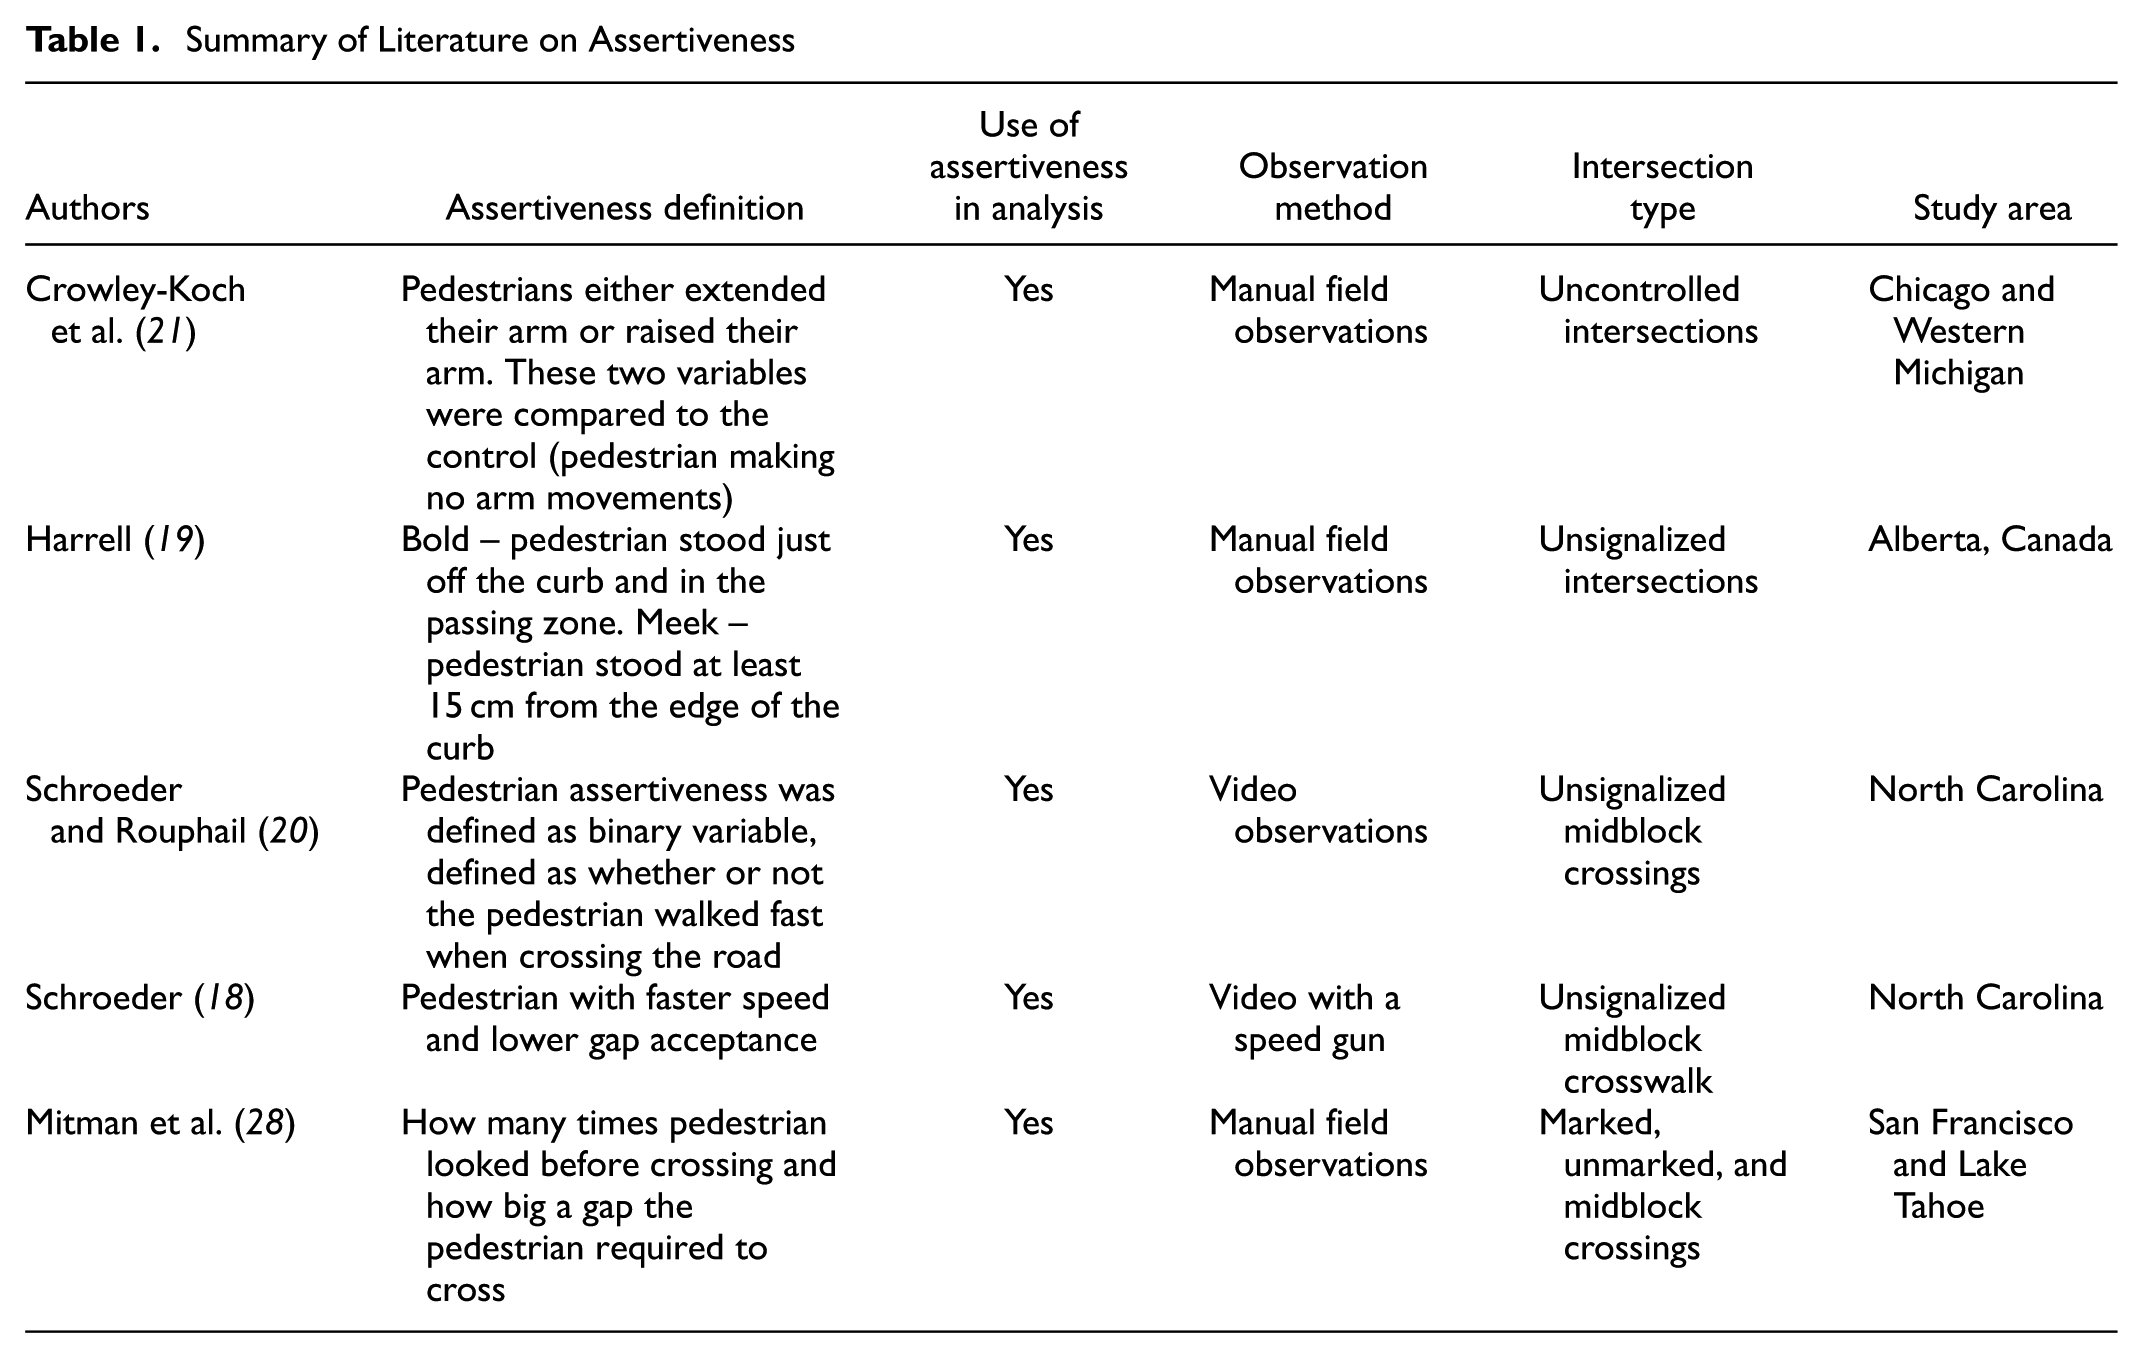
The small number of studies that have examined pedestrian assertiveness do not use a common definition of this behavior (18–21, 28 ). For example, Harrell sought to understand the impact of pedestrian assertiveness (or pedestrian boldness) on the yielding rates in pedestrian–vehicle interactions ( 19 ). Harrell’s study proposed a method to classify assertive pedestrians as a function of where they stood before crossing. Assertive (bold) pedestrians were those who waited in the street before attempting to cross (stood “just off the curb”). Passive (meek) pedestrians were those who waited on the curb before crossing (“stood 15 cm from the edge of the curb”). Their findings showed that pedestrians who were assertive and wore brightly colored clothing received the highest driver yielding rate (75%), while pedestrians who were meek and wore muted (drab) clothing received the lowest driver yielding rate (39%).
Body or arm gestures have also been used as an indication of pedestrian assertiveness. Crowley-Koch et al. found that pedestrians who used assertive arm motions (i.e., extended arm or raised hand) experienced higher yielding rates than pedestrians who made non-assertive motions ( 21 ). Pedestrian pace has also been used to define assertiveness. Pedestrians who approach crosswalks quickly may generate a more alarming visual cue and are yielded to more often than pedestrians approaching in a slow manner ( 18 , 20 ).
Pedestrian assertiveness may also vary significantly between individuals and communities ( 3 ). A public survey conducted for a separate part of the Wisconsin DOT study suggested that many pedestrians are cautious or afraid to assert their legal right to cross because they do not trust drivers to yield ( 4 ). Of approximately 390 online survey respondents, 39% perceived that pedestrians in their local community would not cross the street in an uncontrolled, marked crosswalk on a residential two-lane road with a motor vehicle approaching (assuming that the driver had time to stop), and 70% said that local pedestrians would not cross the street in a similar situation on a major four-lane road ( 4 ).
Video Data Processing
To explore the relationship between pedestrian assertiveness and driver yielding behavior, video data were collected at one uncontrolled intersection in Milwaukee (Kenwood Boulevard and Farwell Avenue) and one uncontrolled intersection in Madison (Dayton Street and Charter Street) near the University of Wisconsin-Milwaukee and the University of Wisconsin-Madison, respectively. The study sites in Milwaukee and Madison have traffic volumes of 5,000 and 6,000 vehicles per day and speed limits of 30 mph and 25 mph, respectively. Both parking and bike lanes are present upstream and downstream of the crossing location at the Milwaukee study site. In Madison, a bike lane is present, but there is no on-street parking near the study location. The crosswalk lengths at the Milwaukee and Madison sites are 71 feet and 40 feet, respectively. The Milwaukee crossing is longer because it includes a raised median. At each site, pedestrians cross one travel lane in each direction. Both intersections have high pedestrian volumes during the day because they are close to university campuses. Video data were collected during midday periods at both sites (approximately 9:30 a.m. to 2:30 p.m.) before and after HVE efforts were conducted in Milwaukee and Madison. Figure 1 shows the study intersections and video camera locations at (a) Milwaukee and (b) Madison.
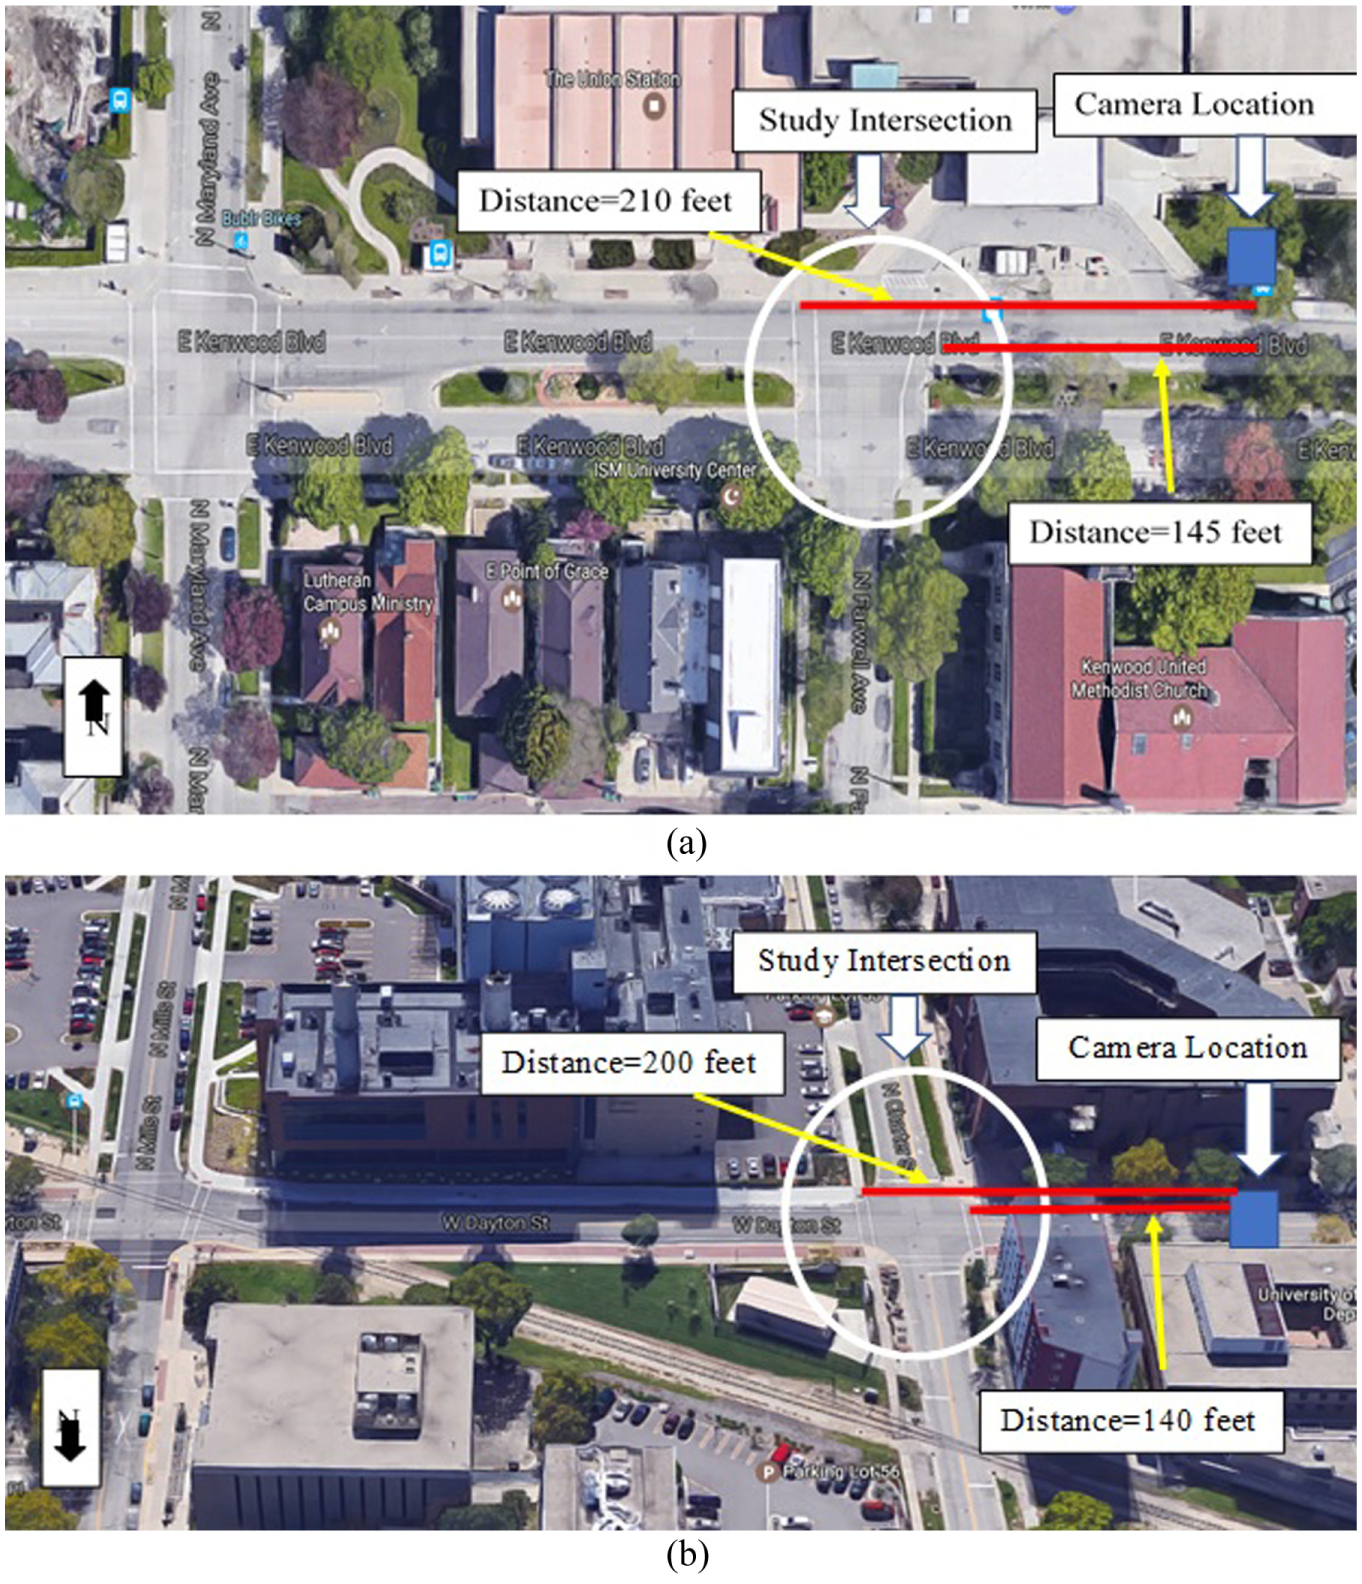
(a) Milwaukee video observation intersection (E. Kenwood Boulevard and N. Farwell Avenue); (b) Madison video observation intersection (W. Dayton Street and N. Charter Street).
The research team analyzed the recorded video to collect detailed pedestrian assertiveness and driver yielding observations for both study sites. Importantly, the video observations were naturalistic (i.e., they did not use a staged pedestrian). This allowed the research team to document naturally occurring interactions between drivers and pedestrians in both communities.
Several other pedestrian variables were also collected, including demographic characteristics (age, gender, ethnicity), waiting location (e.g., curb versus street), and pedestrian crossing group size. Characteristics of the first automobile with an opportunity to yield to the pedestrian were observed, including vehicle type, vehicle distance from crosswalk when the pedestrian arrived, estimated vehicle speed, and whether or not the driver yielded. Driver yielding behavior was classified as:
Hard yield (HY) – the driver yielding scenario in which the pedestrian is assertive, and the driver is located closer to the intersection forcing the driver to yield. In this case, the driver decelerated quickly to allow the pedestrian to cross, demonstrated by the vehicle hood going down visibly;
Soft yield (SY) – the driver decelerated comfortably to allow the pedestrian to cross;
No yield (NY) – the driver did not yield to the pedestrian who was waiting to cross.
The research team was not able to collect driver demographic characteristics because drivers were not clearly visible in the video. To reduce errors of subjectivity, two individuals each made observations separately and then cross-validated their data. Adjustments were made where disagreements were found. Overall, there were disagreements on only 10 observations (less than 6%) out of the 179 records, indicating the video observation protocol generally worked well.
Data Analysis
Before analyzing the association between pedestrian assertiveness and driver yielding behavior, a preliminary analysis was conducted to explore the relationship between several pedestrian- and driver-related characteristics and driver yielding behavior (Table 2).
Descriptive Statistics of Variables Collected from Video Data
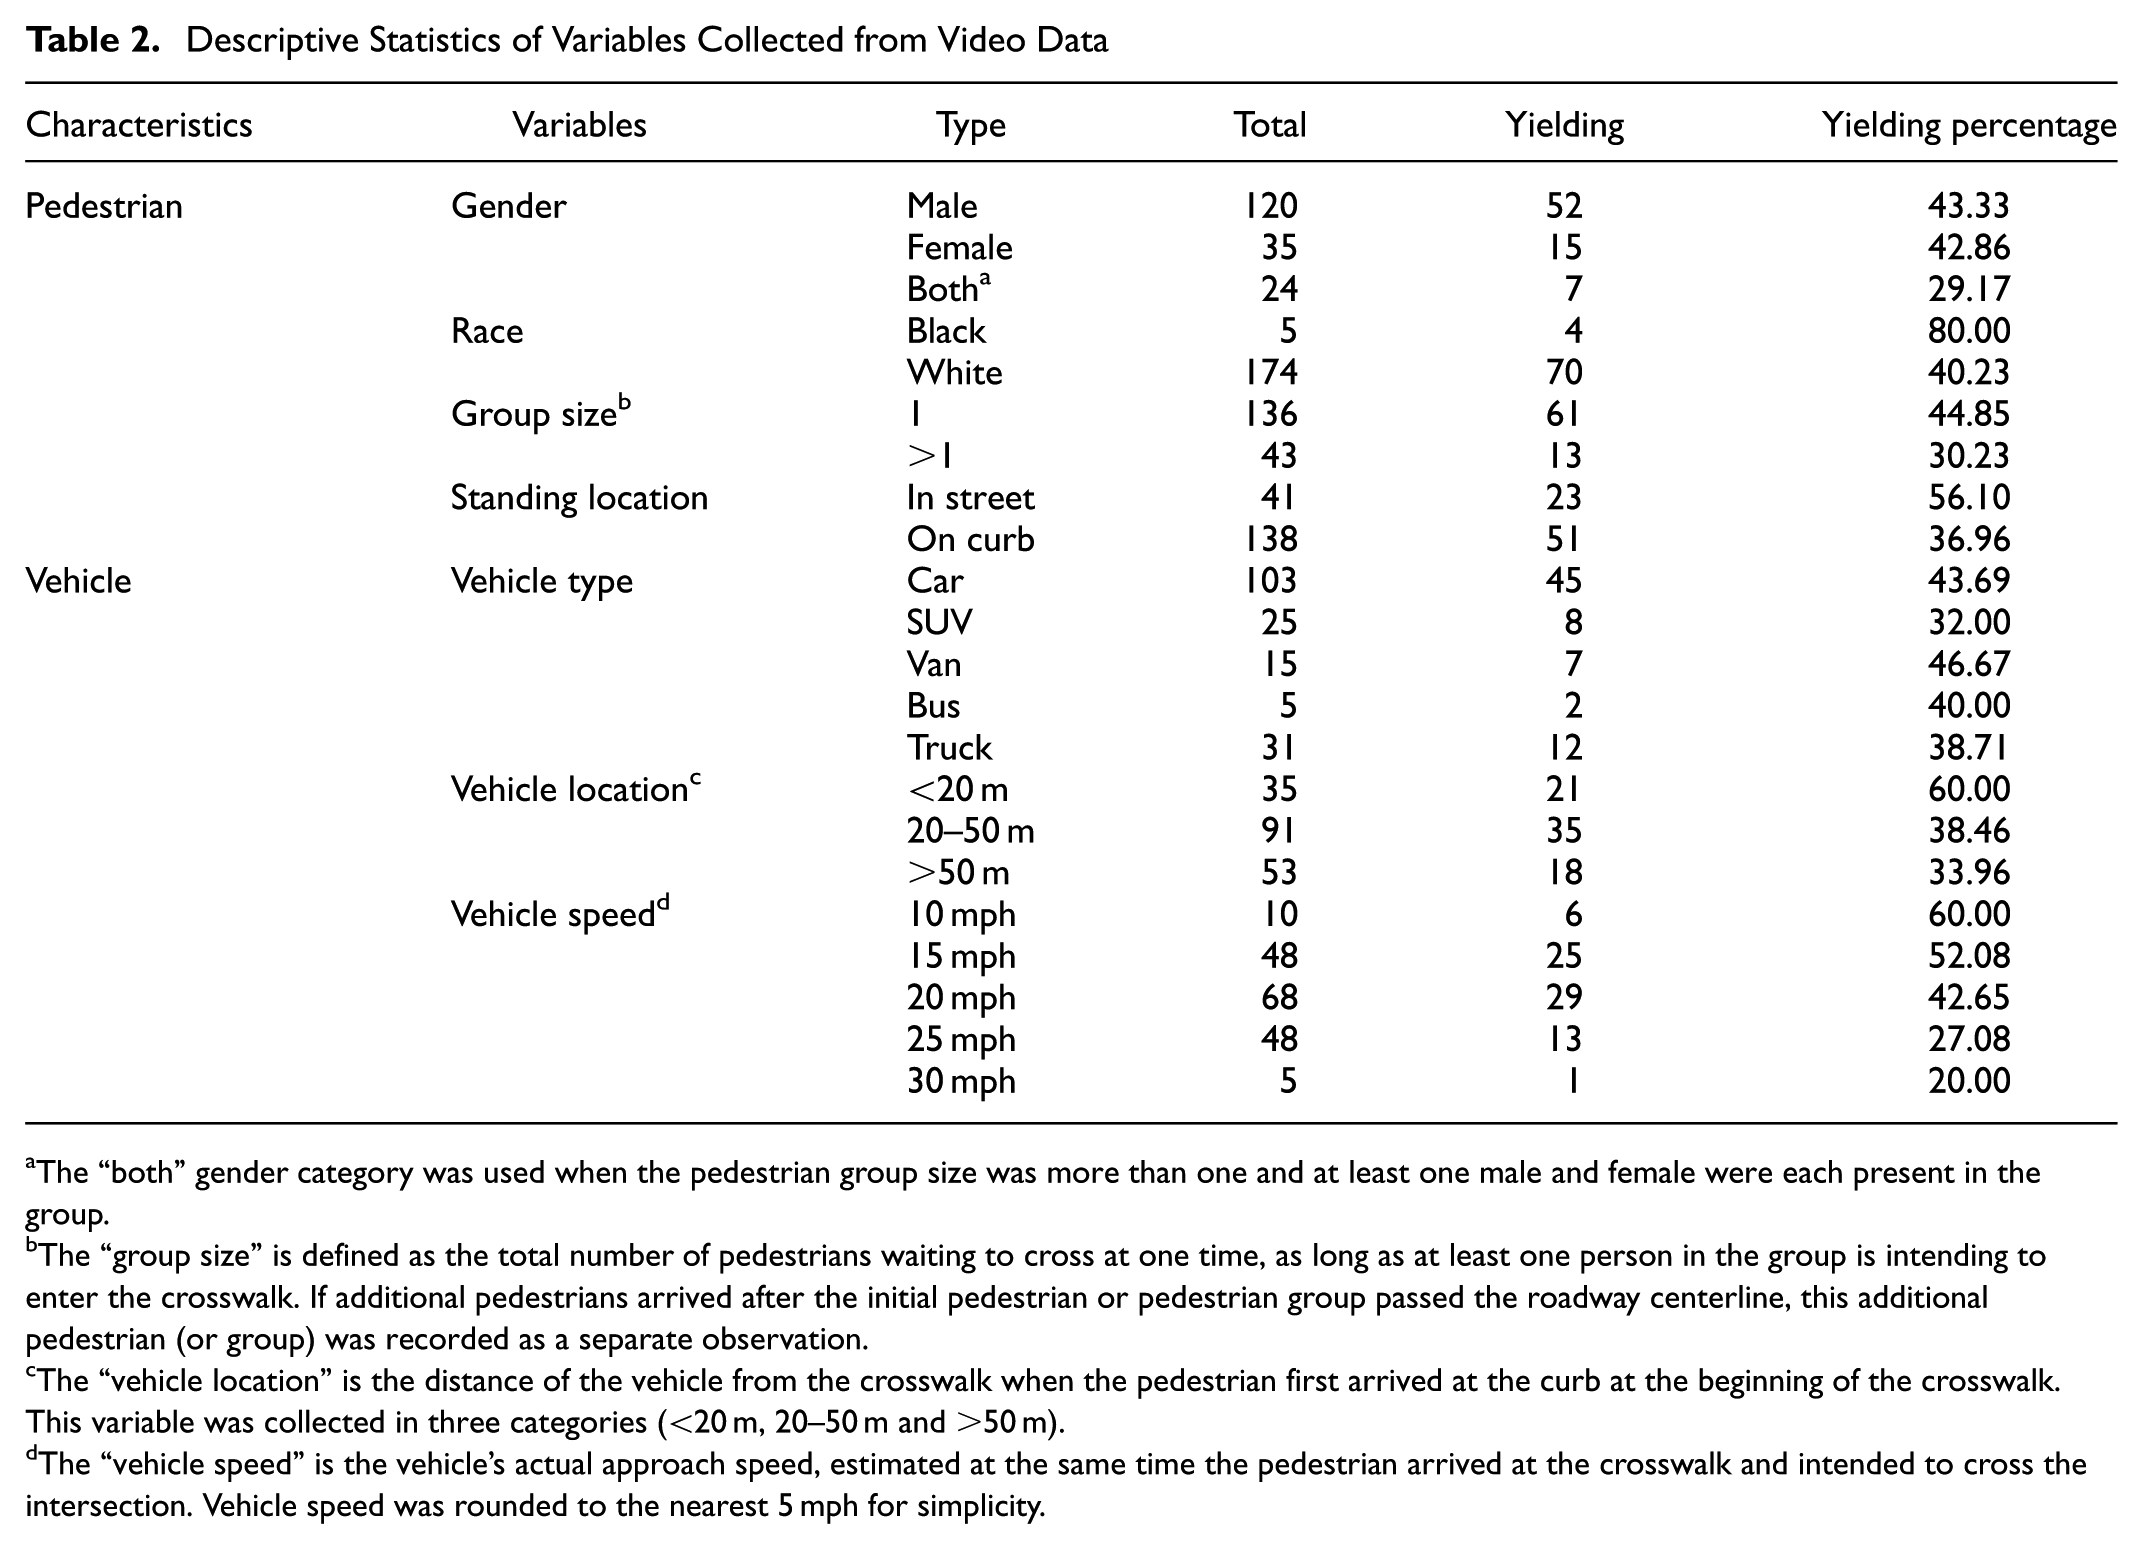
The “both” gender category was used when the pedestrian group size was more than one and at least one male and female were each present in the group.
The “group size” is defined as the total number of pedestrians waiting to cross at one time, as long as at least one person in the group is intending to enter the crosswalk. If additional pedestrians arrived after the initial pedestrian or pedestrian group passed the roadway centerline, this additional pedestrian (or group) was recorded as a separate observation.
The “vehicle location” is the distance of the vehicle from the crosswalk when the pedestrian first arrived at the curb at the beginning of the crosswalk. This variable was collected in three categories (<20 m, 20–50 m and >50 m).
The “vehicle speed” is the vehicle’s actual approach speed, estimated at the same time the pedestrian arrived at the crosswalk and intended to cross the intersection. Vehicle speed was rounded to the nearest 5 mph for simplicity.
The descriptive statistics provided in Table 2 show that the driver yielding rate is almost the same for both male and female pedestrians. There were not enough observations to draw conclusions about yielding rates for pedestrians with different racial backgrounds. Interestingly, the yielding rate was lower for pedestrians who waited in groups rather than as individuals. The result is statistically significant at the 95% confidence level (p = 0.044). One possible reason could be pedestrians crossing in larger groups are less likely to be assertive while crossing. Pedestrians could also be more cautious because they are concerned about the safety of other members of the group while crossing. It is also possible that when a larger group is waiting to cross, pedestrians do not want to start crossing on their own and stand out from the group. For example, several groups of children attempted to cross the study intersection. The video showed the group waiting until they find the largest safe gap to cross together. Pedestrians standing in the street had a higher yielding rate (56%) than pedestrians standing on the curb (37%). A Z-test between the two yielding rates for pedestrians’ standing location shows that the difference is statistically significant at the 95% confidence level (p = 0.014). Different vehicle types had different yielding rates: SUVs and trucks were less likely to yield to pedestrians (yielding rate = 32% and 39%, respectively). However, the yielding rate for SUVs (p = 0.144) and trucks (p = 0.312) is not statistically different than for passenger car at the 95% confidence level. As seen in other studies, yielding rates tended to be higher when vehicle speeds were lower: Only 20% of vehicles traveling 30 mph yielded, but 60% of vehicles traveling 10 mph yielded ( 7 , 29 ). A Z-test shows that vehicles traveling 25 mph have a statistically significant lower yielding rate than vehicles traveling at 20 mph at the 95% confidence interval (p = 0.043).
Defining Assertiveness
The main analysis focused on pedestrian assertiveness. This variable may have a significant impact on driver behavior, but it is not clearly defined or thoroughly studied in the literature.
For the purposes of this study, pedestrian assertiveness was generally defined as an additional hand or body gesture shown by a pedestrian to improve his or her detection by the driver at the crosswalk. Further, whether or not pedestrians looked at drivers and how closely to the edge of the roadway pedestrians waited were also important indicators of assertiveness. To capture these nuanced behaviors, eight specific pedestrian actions were identified from video data:
A1: pedestrian uses body gesture to cross;
A2: pedestrian uses hand gesture to cross;
A3: pedestrian does not stop before crossing (his or her waiting time was less than 1 s);
A4: pedestrian stands on street and observes oncoming traffic for an opportunity to cross;
A5: pedestrian stands on curb (<50 cm from edge of pavement) and observes oncoming traffic for a minimum of 3 s for an opportunity to cross;
A6: pedestrian stands in street but is inattentive (does not observe oncoming traffic);
A7: pedestrian stands on curb (<50 cm from edge of pavement) but is inattentive (does not observe oncoming traffic);
A8: pedestrian stands behind curb (>50 cm from edge of pavement) waiting to cross.
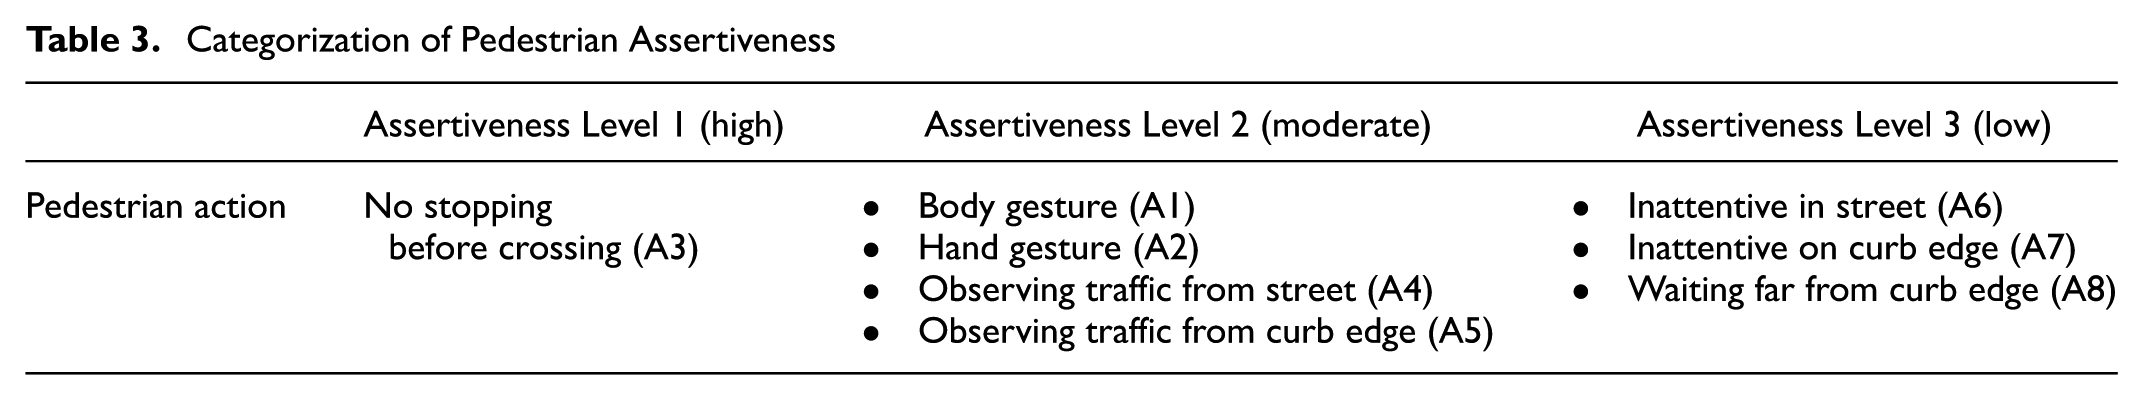
Initially, pedestrian assertiveness was categorized into these eight actions. However, some assertiveness categories had similar data, so they likely represented similar concepts. Therefore, the pedestrian assertiveness categories were combined into three levels of assertiveness. This three-level categorization is provided in Table 3:
Assertiveness Level 1 (high) – crossing without stopping;
Assertiveness Level 2 (moderate) – stopping but includes making a body gesture or hand gesture to indicate a desire to cross the street, standing in the street and observing (looking at) the traffic, and standing on curb (<50 cm) and observing the traffic. Among the observations, body gesture (A1) or hand gesture (A2) were always associated with pedestrians who stood on the curb (<50 cm) and observed the traffic (A5), thus the count of A1 or A2 actions was not counted when summarizing the number of pedestrians in Level 2.
Assertiveness Level 3 (low) – standing in the street or curb but being inattentive (not looking at the traffic) as well as standing further than 50 cm from the curb.
Categorization of Pedestrian Assertiveness
Relationship between Pedestrian Assertiveness and Driver Yielding Behavior
The pedestrian assertiveness and driver yielding video observations are organized into matrices (Table 4). The top third of the table shows all observations in Madison and Milwaukee; the middle third shows observations made before the HVE program was implemented in each community; the bottom third shows observations made after the HVE program in each community. Several general patterns can be found from all observations (top third of the table):
Regardless of their vehicle distance from the crosswalk when the pedestrian arrived, drivers tended to yield more often to more assertive pedestrians than less assertive pedestrians: 71% (48 of 68) of drivers yielded to pedestrians exhibiting Assertiveness Level 1; 30% (25 of 82) yielded to pedestrians exhibiting Assertiveness Level 2; and 3% (1 of 29) yielded to pedestrians exhibiting Assertiveness Level 3.
Drivers only made a HY when the pedestrian arrived when they were close to the crosswalk (within 10 m). This suggests that some drivers were braking quickly, just in case the pedestrian continued across the street without stopping. Drivers likely did not make HYs when the pedestrian arrived when they were farther away from the crosswalk because they had more time to choose between yielding or not.
Driver yielding rates ((HY+SY)/yielding opportunities) were highest (60%) when the pedestrian arrived and the driver was close to the crosswalk (within 10 m). This may seem counterintuitive, but the difference between yielding from a closer distance and further distances is almost entirely accounted for by HYs (likely caused by drivers reacting quickly and cautiously, as described in the previous bullet). The proportion of SYs was similar for all distance categories (31–38%).
Average vehicle speeds were slightly slower when pedestrians arrived when they were closer to the crosswalk. While these speeds are only slightly different, it is possible that the faster speeds could lead to more focus toward the center of the roadway (a narrower “vision cone”) and less recognition of pedestrians waiting at the end of a crosswalk.
Relationship between Pedestrian Assertiveness and Driver Yielding Behavior
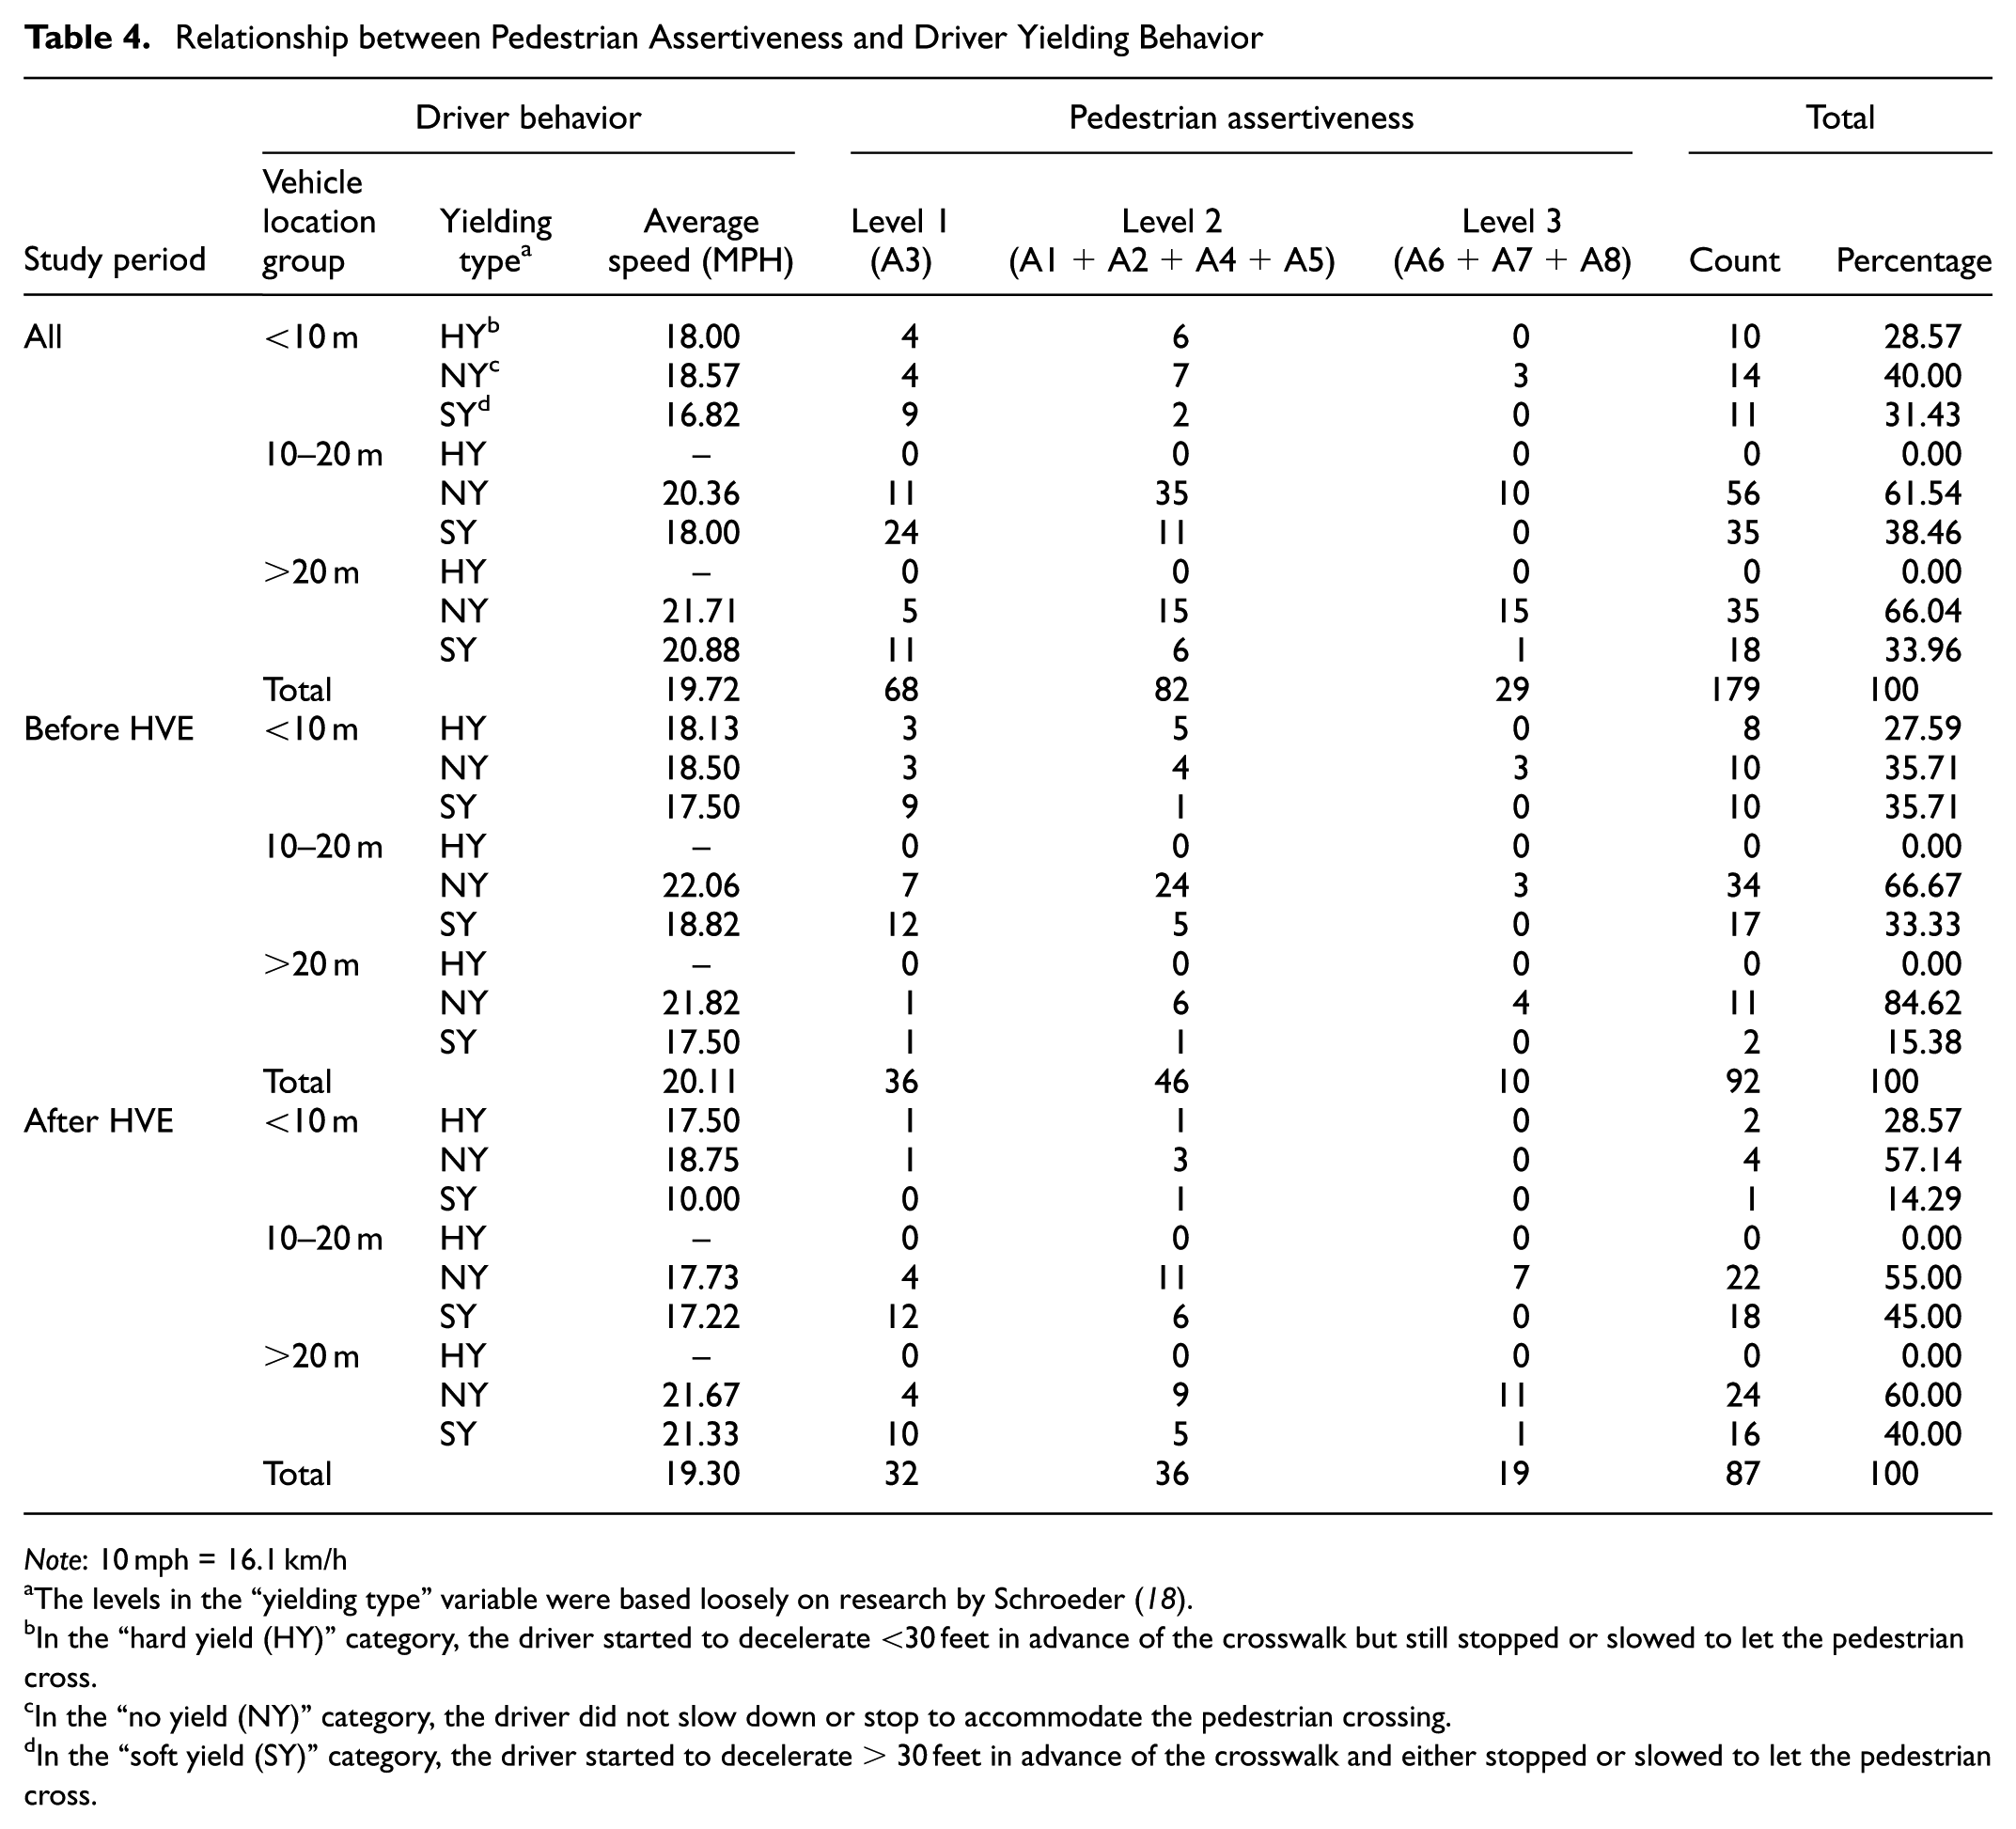
Note: 10 mph = 16.1 km/h
The levels in the “yielding type” variable were based loosely on research by Schroeder ( 18 ).
In the “hard yield (HY)” category, the driver started to decelerate <30 feet in advance of the crosswalk but still stopped or slowed to let the pedestrian cross.
In the “no yield (NY)” category, the driver did not slow down or stop to accommodate the pedestrian crossing.
In the “soft yield (SY)” category, the driver started to decelerate > 30 feet in advance of the crosswalk and either stopped or slowed to let the pedestrian cross.
Application: Driver Yielding Before and After HVE
Previous studies showed that HVE programs can change driver yielding behaviors and increase pedestrian safety over time ( 30 ). HVE programs combine enforcement of driver yielding and other laws along with media outreach to increase awareness of pedestrian safety. Wisconsin DOT supported an HVE program near three major university campuses in Milwaukee and Madison, Wisconsin in fall 2016. The program involved police issuing warnings and tickets to drivers and pedestrians for 2–3 weeks in each location. Efforts at each of these three sites were also covered by local media ( 4 ). These programs were generally viewed as successful by local law enforcement agencies, though the enforcement and media outreach time frames were shorter than the year-long HVE program that resulted in significant increases in driver yielding in Gainesville, Florida ( 29 , 31 ). This case study applies the pedestrian assertiveness framework from this study to evaluate the potential impact of the HVE program. One possible outcome of HVE is that pedestrians become more confident and more likely to trust drivers to stop when attempting to cross the street, which could be reflected in a higher level of assertiveness. Ultimately, this could help increase driver yielding rates, creating a positive feedback loop.
The assertiveness matrix (Table 4) compares data collected before HVE program implementation (middle third of the table) and after HVE program implementation (bottom third of the table). The overall driver yielding rate (including both HY and SY) increased slightly from 40.2% (37 of 92) before to 42.5% (37 of 87) after the HVE program. To conduct a more detailed statistical test of whether drivers were deciding to yield or not, SY behavior was examined in isolation. This is because HY was likely a reaction to a potentially hazardous situation rather than a more conscious choice to yield or not to yield. Overall, the SY rate increased from 31.5% (29 of 92) to 40.2% (35 of 87) after the HVE program activities. However, according to a one-tailed Z-test of the difference between these two proportions, this increase was not statistically significant at a 90% confidence level (p = 0.11). This means that the HVE program activities may have improved the yielding rate, but this improvement could also result from expected random fluctuations in driver yielding rates.
Importantly, the assertiveness framework made it possible to explore how the HVE program may have influenced driver yielding behavior in response to different levels of pedestrian assertiveness. A t-test was conducted on the proportion of drivers who yielded to pedestrians exhibiting Assertiveness Levels 1 and 2 (data were not sufficient to analyze Level 3). For Level 1, 61.1% (22 of 36) drivers did an SY before and 68.8% (22 of 32) drivers did an SY after the HVE program. As expected (caused by pedestrians being so assertive that they “force” drivers to yield), there was no significant difference in driver yielding at this level (p = 0.26). For Level 2, 15.2% (7 of 46) drivers did an SY before and 33.3% (12 of 36) drivers did an SY after the HVE program. This increase was significant at the 95% confidence level (p = 0.027). While further research is needed, HVE was associated with a higher rate of driver yielding for pedestrians exhibiting a moderate level of assertiveness. This is a promising result. A moderate level of assertiveness may be reasonable for pedestrians to adopt, especially if supported by educational messages to clearly indicate an intent to cross within a crosswalk.
Conclusions and Future Research
Understanding how motorists and pedestrians interact at pedestrian crossings can lead to better engineering, education, and enforcement strategies to improve pedestrian safety. This exploratory study defined three levels of pedestrian assertiveness at uncontrolled crosswalks and classified pedestrians into these categories using video data. These levels of pedestrian assertiveness were then linked to different driver yielding behaviors. Drivers were more likely to yield to pedestrians exhibiting more assertive behaviors. A case study comparing pedestrian assertiveness before and after an HVE program showed that the program may have helped increase driver yielding rates to pedestrians exhibiting moderate levels of assertiveness.
In this study, video data were collected at two intersections: one in Milwaukee and the other in Madison, both near university campuses. More sites should be included in the future to generate more statistically rigorous results. Furthermore, there were some challenges with the video data collection procedures. A tree blocked the view of pedestrians and vehicles on one side of the intersection in Milwaukee, limiting the number of observations at this site. Future studies should carefully scout camera locations before field data collection.
In addition, video data collection equipment should be adjusted carefully to capture images of vehicles and vehicle speeds and images of pedestrians and pedestrian speeds at greater distances from the crosswalk. The vehicle speed data collected for this study were only estimates because of the limitations of the video camera perspective. Since vehicle and pedestrian acceleration and deceleration are important for evaluating yielding behavior, specific measures of these characteristics should be developed in the future to create more representative classifications of pedestrian and driver assertiveness.
This study was exploratory, so further research should be conducted on the relationship between pedestrian assertiveness on driver yielding. Larger samples of video observations should be collected to increase the overall number of pedestrian and driver interactions available for analysis, represent a wider range of uncontrolled crosswalks (e.g., multi-lane crossings, crossings with facilities such as flashing beacons and curb extensions), cover more time periods (e.g., nighttime), and include data from multiple communities with different urban contexts and different pedestrian and driver behavioral norms. Specifically, it would be useful to conduct this study in a state where drivers are required to stop for pedestrians at crosswalks (rather than just yield to pedestrians) and in communities with high levels of police enforcement of pedestrian rights of way. In addition, future studies should also explore how driver yielding behavior may adjust over time as pedestrians behave more or less assertively.
Footnotes
Acknowledgements
The authors would like to acknowledge and thank the Wisconsin Department of Transportation for providing grant funding and guidance for this study.
Author Contributions
The authors confirm contribution to the paper as follows: study conception and design: RRS, RJS, XQ; data collection: RRS, AS, ZH; literature review: MDF, ZH, AS; analysis and interpretation of results: RRS, RJS, ZH; draft manuscript preparation: RRS, RJS, XQ. All authors reviewed the results and approved the final version of the manuscript.
The Pedestrians and Cycles Section (ANF00) peer-reviewed this paper (18-05396).