
Abstract
Bus lanes have the potential to significantly improve bus speeds and reliability. These benefits are typically not solely achieved through the design and installation of a bus lane, however. A successful bus lane must also have sufficient public support for regulating bus lane use, as well as enforcing those regulations. Effective design, enforcement, legislation, and education strategies are critical during both the planning and post-implementation phases to limit bus lane violations and increase compliance, thereby improving bus lane efficiency. Despite the importance of developing a robust management plan to limit violations and maintain bus lane efficiency, there is little documented guidance for bus lane implementation and management in the literature, particularly related to enforcement and education strategies. This paper develops a best practices review to respond to that gap in guidance by conducting a comprehensive literature review of best practice in bus lane management along with interviews with agency staff. The objective of this paper is to research, identify, and develop strategies to improve bus lane observance and enforcement, and to create an implementation plan for agencies with specific recommendations and strategies to ensure the success of bus lane initiatives.
Urban areas of all sizes in the U.S. are experiencing increased vehicle congestion; in 95 of America’s 100 largest metro areas congestion increased from 2013 to 2014 ( 1 , 2 ). While all road users experience the negative impacts of congested conditions, the effects on public transit users riding buses operating in mixed traffic tend to be more significant as transit routes are typically fixed, not allowing buses to change course to avoid congestion. Furthermore, due to frequent stops, buses generally travel in the right-hand lane, which tends to have the most “friction” with parking and loading activities, taxis, and right-turning vehicles. A study conducted by the Washington Metropolitan Area Transit Authority (WMATA) in 2010 showed average bus operating speeds of less than 10 miles per hour (mph) on most corridors in the Washington, D.C. region and less than 5 mph in downtown D.C. ( 3 ). Two recent mobility studies conducted by the New York City Department of Transportation (NYCDOT) and the District Department of Transportation (DDOT) confirmed this finding and indicated that bus speeds are often less than 5 mph in central business districts ( 4 , 5 ). As bus speeds continue to drop and bus performance suffers from congestion, jurisdictions have recognized and responded to the need for preferential treatments for public transit, including bus lanes. As a result, new bus lanes are operating in several U.S. cities, and many more are being planned.
Bus lanes have the potential to significantly improve bus speed and reliability by limiting the negative impacts of traffic congestion ( 6 ). For transit agencies, bus lanes can result in shorter running times, as well as decreased schedule recovery times, due to improved reliability. For passengers, bus lanes can shorten in-vehicle travel time, reduce average waiting time at stops, and decrease vehicle crowding as a result of improved reliability. This increases the relative attractiveness of transit and potentially increases ridership. However, these benefits cannot be achieved solely through bus lane design and installation. A successful bus lane must also have sufficient public support for regulating bus lane use, as well as enforcing those regulations. Effective design, enforcement, and education strategies are critical during both the planning and post-implementation phases to limit bus lane violations and increase compliance, thereby improving bus lane efficiency (Figure 1). A study from San Francisco showed that over 60% of vehicles along a transit lane in a busy corridor violated bus lane regulations in the peak direction during the evening peak hour, limiting the lanes’ benefits ( 7 ). Similar findings were reported from New York City’s Select Bus Service (SBS), where 30% to 50% of buses face some sort of obstruction in bus lanes, with the obstruction rate increasing in sections with more pedestrians and taxis ( 8 ).
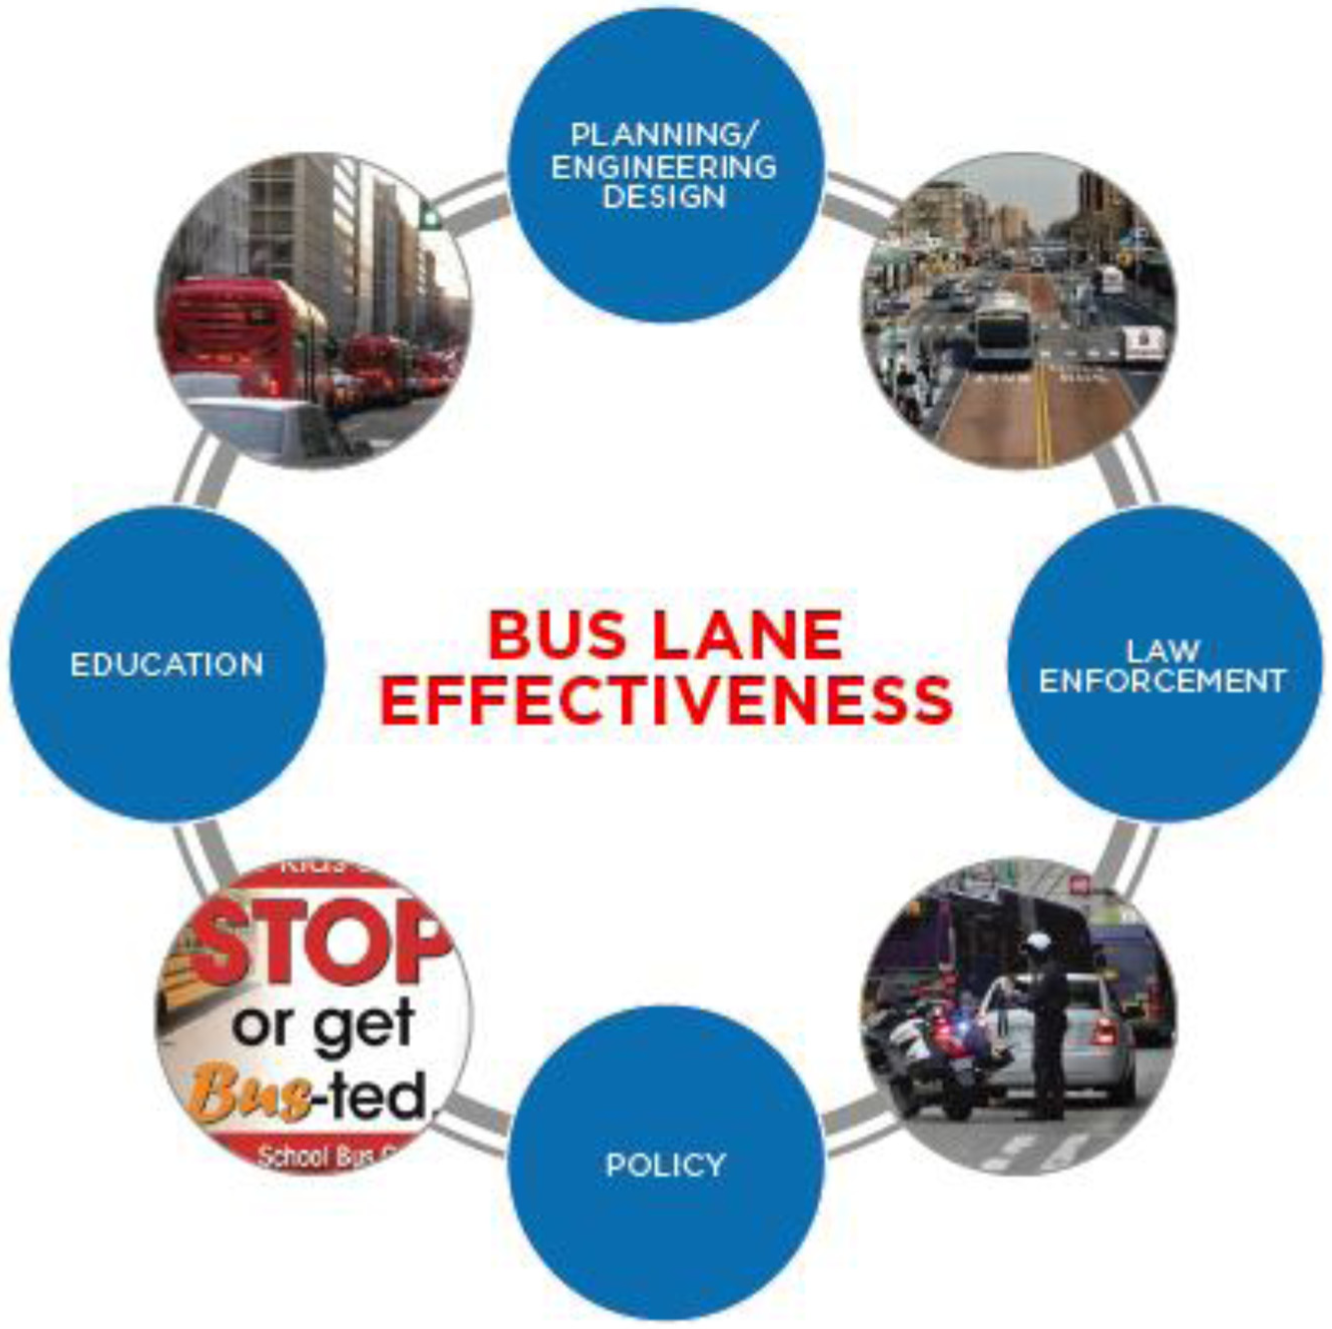
Key elements of effective bus lane implementation.
Despite the importance of developing a robust management plan to limit violations and maintain bus lane efficiency, there is little documented bus lane implementation and management guidance in the literature, particularly related to enforcement and education strategies. This best practices review responds to that gap in guidance by conducting a comprehensive literature review of bus lane management best practices and interviews with agency staff to research, identify, and develop strategies to improve bus lane observance and enforcement, which are critical to the success of bus lane initiatives. This best practices review focuses primarily on bus lane implementation and management. The assessment and feasibility of bus lanes, which generally occurs earlier on in the planning process, was beyond the scope of this review.
Effective Bus Lane Management
A comprehensive bus lane management literature review, along with interviews with local and national transportation agencies, was conducted to identify successful enforcement, legislative, and educational techniques in the U.S. and abroad ( 9 ). This section discusses key findings, identifies barriers to implementation, and presents strategies for agencies to manage bus lanes effectively, with a focus on:
Stakeholder coordination
Enforcement
Legislation
Education
Monitoring
Stakeholder Coordination
Interagency coordination plays a critical role in the overall success of any bus lane implementation project. Transit operating agencies are rarely exclusively responsible for maintaining lane markings, setting traffic signal timings, and performing other essential activities of a bus lane. Case studies from across the U.S. reiterated the need for cooperation at all phases of implementation among state, regional, and local agencies, as well as between traffic engineering and transit service planning officials. Interagency coordination is essential not just in the planning, design, and construction of bus lanes, but also in their operation.
As an example, transit-only lane implementation in New York City is a “joint venture” of two different agencies, NYCDOT and Metropolitan Transportation Authority (MTA) New York City Transit (an entity of the State of New York). Throughout New York City’s ongoing transit-only lane implementation process, there has been a high level of interagency cooperation to implement both the initial pilot transit-only lanes and subsequent transit-only lane projects ( 9 ).
Given that projects of this nature often require collaboration from multiple agencies and community stakeholders, getting these groups on the same page can greatly improve the project’s chance of success. Reviewing past projects and identifying best practices can also help future projects succeed, but agencies must be willing to reevaluate their own past practices—and those of others—to manage effective bus lanes successfully.
Enforcement
Several studies from the literature indicated that the perception of limited bus lane enforcement increases violation rates, diminishing the effectiveness of bus lanes and resulting in reduced bus speeds ( 8 , 10 ). Although practices vary, police enforcement and automated enforcement (such as on-board cameras) are the two most common enforcement tools used to reduce violations. Figure 2 summarizes the enforcement strategies used by the agencies surveyed for this study, including fines for bus lane violation. Detailed information and further findings from the locations surveyed can be found in the final report of the project ( 9 ).
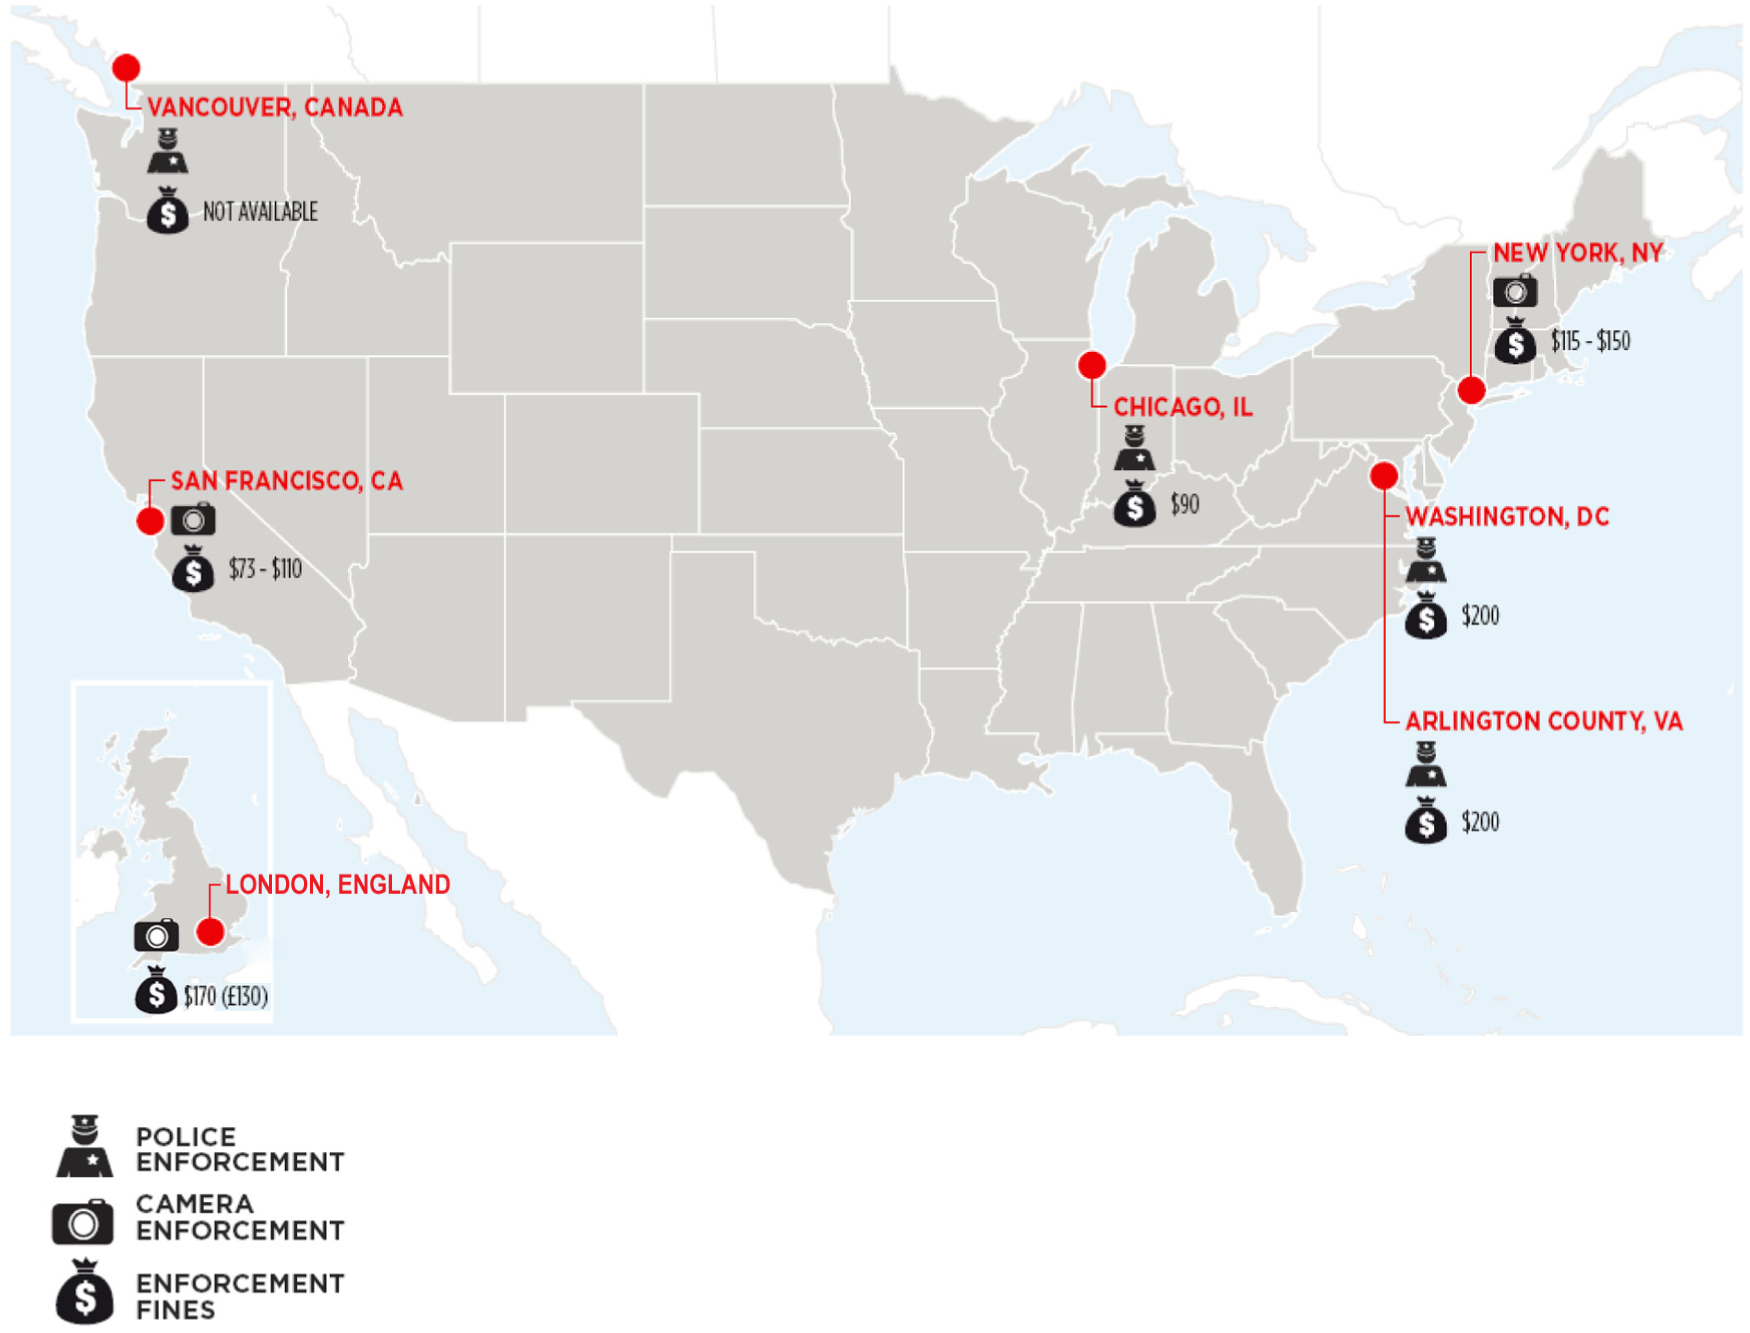
Enforcement strategies used and associated fines for bus lane violation in the jurisdictions studied.
Police Enforcement
When automated camera enforcement is not practical, some level of police presence is needed to discourage potential violators from entering the bus lanes. Agency interviews indicated that typically jurisdictions place more emphasis on police enforcement when bus lanes first open (e.g., the first month after opening). However, targeted enforcement tends to diminish afterwards due to several challenges associated with police enforcement:
Automated Enforcement
Generally, transit and law enforcement agencies use two types of camera enforcement to automate the enforcement process: stationary cameras installed at selected locations/corridors, and cameras on buses. Both types can generate citations for both moving and parking violations. Compared with active police enforcement, which is resource-intensive, automated enforcement can have significant fiscal and enforcement benefits.
However, transit agencies are rarely authorized to enforce restrictions in the bus lanes in which they operate, presenting challenges in bus lane enforcement ( 11 ). Automated camera enforcement in bus lanes usually requires new enabling legislation, as most states do not currently have laws permitting it (see below for legislation details and recommendations). New York and California are the only states in the U.S. which have specifically enabled bus lane camera enforcement. Targeted legislation in each state enabled specific cities to begin camera-based bus lane enforcement as pilot or demonstration programs. Each state then used an iterative legislative process to extend and expand the pilot or demonstration programs to new corridors.
Lessons Learned from New York and California
New York’s initial automated camera enforcement legislation (2010) granted NYCDOT and MTA New York City Transit the authority to install bus lane enforcement cameras on five specified SBS routes. In 2015, the New York State Legislature and Governor extended the law for ten years, allowing the city to use bus lane cameras on up to 15 additional routes. New York’s enabling legislation includes a maximum fine amount, requirements for camera-related signage along corridors, and a time span for enforcement (bus lane cameras may only be operated on designated bus lanes during weekdays from 7:00 a.m. to 7:00 p.m.) ( 12 ).
Two types of camera enforcement have been used in New York City to date: stationary cameras and on-bus cameras. On-bus cameras record standing violations, such as parking, while stationary cameras primarily record driving violations in the bus lane. Stationary cameras, installed along SBS corridors, are operated by NYCDOT; a pilot program with on-bus cameras was administered by MTA New York City Transit. Each enforcement method was designed to capture multiple photos to ensure that a violation was being committed, and to allow MTA New York City Transit staff (on-bus cameras) or NYCDOT staff (stationary cameras) to determine if there was a legitimate reason for a private vehicle to enter the bus lane. An adjudication process, managed by the New York City Department of Finance, was also established to allow drivers who felt they were wrongly cited to appeal the fine. As of 2012, only 2% of all citations were overturned ( 13 ).
San Francisco uses forward-facing cameras on buses for its Transit-Only Lane Enforcement (TOLE) program. If a camera detects a vehicle using the lane illegally, the camera photographs the vehicle’s license plate and a citation is issued to the vehicle’s owner. The process does not require a bus driver to initiate it ( 14 ). San Francisco’s legal ability to install cameras on city-owned public transit vehicles is enabled by changes made to the California Vehicles Code, as well as municipal regulations ( 15 ). The City and County of San Francisco can issue citations (civil penalties) for violations captured by cameras in bus lanes during the posted hours of operation for a transit-only traffic lane; the video image is confidential, and destroyed after six months, or 60 days after the final disposition of the citation.
Legislation
Although states and municipalities have varying regulations, there are typically two ways in which bus lane violations are processed:
Infractions, in which a police officer files charges directly against a vehicle operator, resulting in a court hearing, fines, driver’s license penalties, or possibly jail time; and
Administrative or civil violations (such as parking tickets), which are issued to the registered owner of a vehicle (not necessarily the person who was operating the vehicle), resulting in fines, but not necessarily a court hearing. Administrative violations can be issued by government agents other than police officers, and typically require less evidence (and result in less paperwork) than infractions.
In New York City, bus lane moving violations issued by police officers are infractions, and may result in both fines and points against a driver’s license. In contrast, a bus lane violation captured on camera may result in a fine, but will not be included in a driver’s operating record, or used for insurance purposes ( 16 ). It can be difficult for camera-based systems to meet evidence standards required for infractions, such as proof of the driver’s identity ( 11 ).
There are various types of camera-based enforcement of parking or moving violations, but New York City and San Francisco have the most robust, most explicit, on-board camera enforcement of violations in bus lanes in the U.S. Each city required enabling legislation from its respective state to develop its bus lane camera enforcement program, and each city used an iterative policy and legislation development process that began with pilot or demonstration projects and developed into broader programs. Key elements of their respective enabling legislation are summarized in Figure 3. The four main branches under state enabling legislation illustrate the primary factors and sub factors to consider for legislation. Likewise, the branches under Municipal Code illustrate three primary areas where adjustments/additions to the municipal code may be required. It should be noted that Figure 3 provides a general overview of the process and reflects bus lane camera enforcement elements found in New York and California. Other states and municipalities may have different circumstances and requirements.
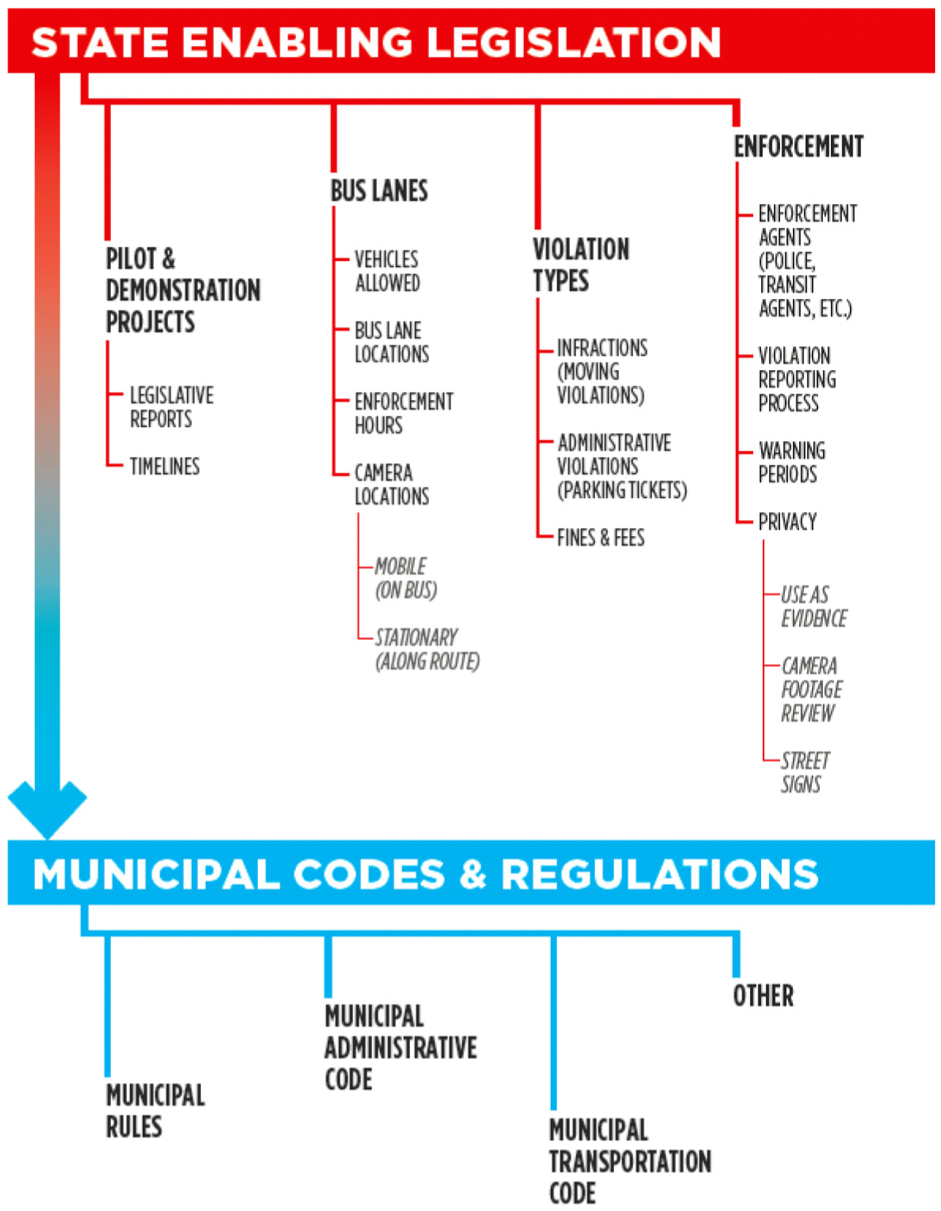
Bus lane camera enforcement: general legislative factors to consider.
Education
As noted in the section on Stakeholder Coordination, above, effective bus lane management often requires collaboration from multiple agencies and community stakeholders, and getting these groups on the same page can greatly improve the project’s chance of success. Best practices for bus lane public outreach—which helps communicate the intent and use of the bus lane to community stakeholders and the general public—include bus lane infrastructure markings and targeted outreach tailored and scaled to the needs of the project.
Signal the Exclusivity of a Bus Lane
As demonstrated in San Francisco and many other locations, installing lane markings, colored lanes (e.g., red paint), and signs to indicate the existence of a bus lane is the simplest, most practical, and perhaps the most necessary form of public education during bus lane projects. This intervention effectively educates all road users simultaneously, including pedestrians, cyclists, taxi drivers, private vehicle drivers, and transit operators.
Provide Clear and Information Project Details through Website/Social Media
When promoting a bus lane project, the presence of easy-to-read, sufficiently detailed information on project details, frequently asked questions, upcoming meetings, and discussion forums on websites, blogs, and social media is crucial to the processes of educating the public, thereby improving compliance and bus lane efficiency. The use of digital information allows for real-time updates on information that may shift as a plan progresses.
Earned, Paid, and Produced Media All Have a Role
Media coverage can increase exposure, expanding ways to reach a larger audience and amplify key messages. Agencies can attract extra attention to a project by purchasing advertisements or working with reporters to spread information. Press releases can also be an effective tool in garnering media and public attention. In short, transit agencies can use media as another tool to provide answers to the public on such questions as:
How will dedicated lanes change my commute?
Will travel times by car or bus be shorter or longer?
When are the lanes scheduled to open?
Print Materials Are Important, Too
Not everyone has access to a computer. Sometimes the best way to reach potentially affected travelers in the corridor is via print materials, which can be distributed in person, to vehicles entering parking garages, on a transit vehicle, or via direct mail. Figure 4 provides two examples of brochures from the Chicago Transit Authority (CTA) and the Jacksonville Transportation Authority that help increase public awareness of bus lane rules and locations.
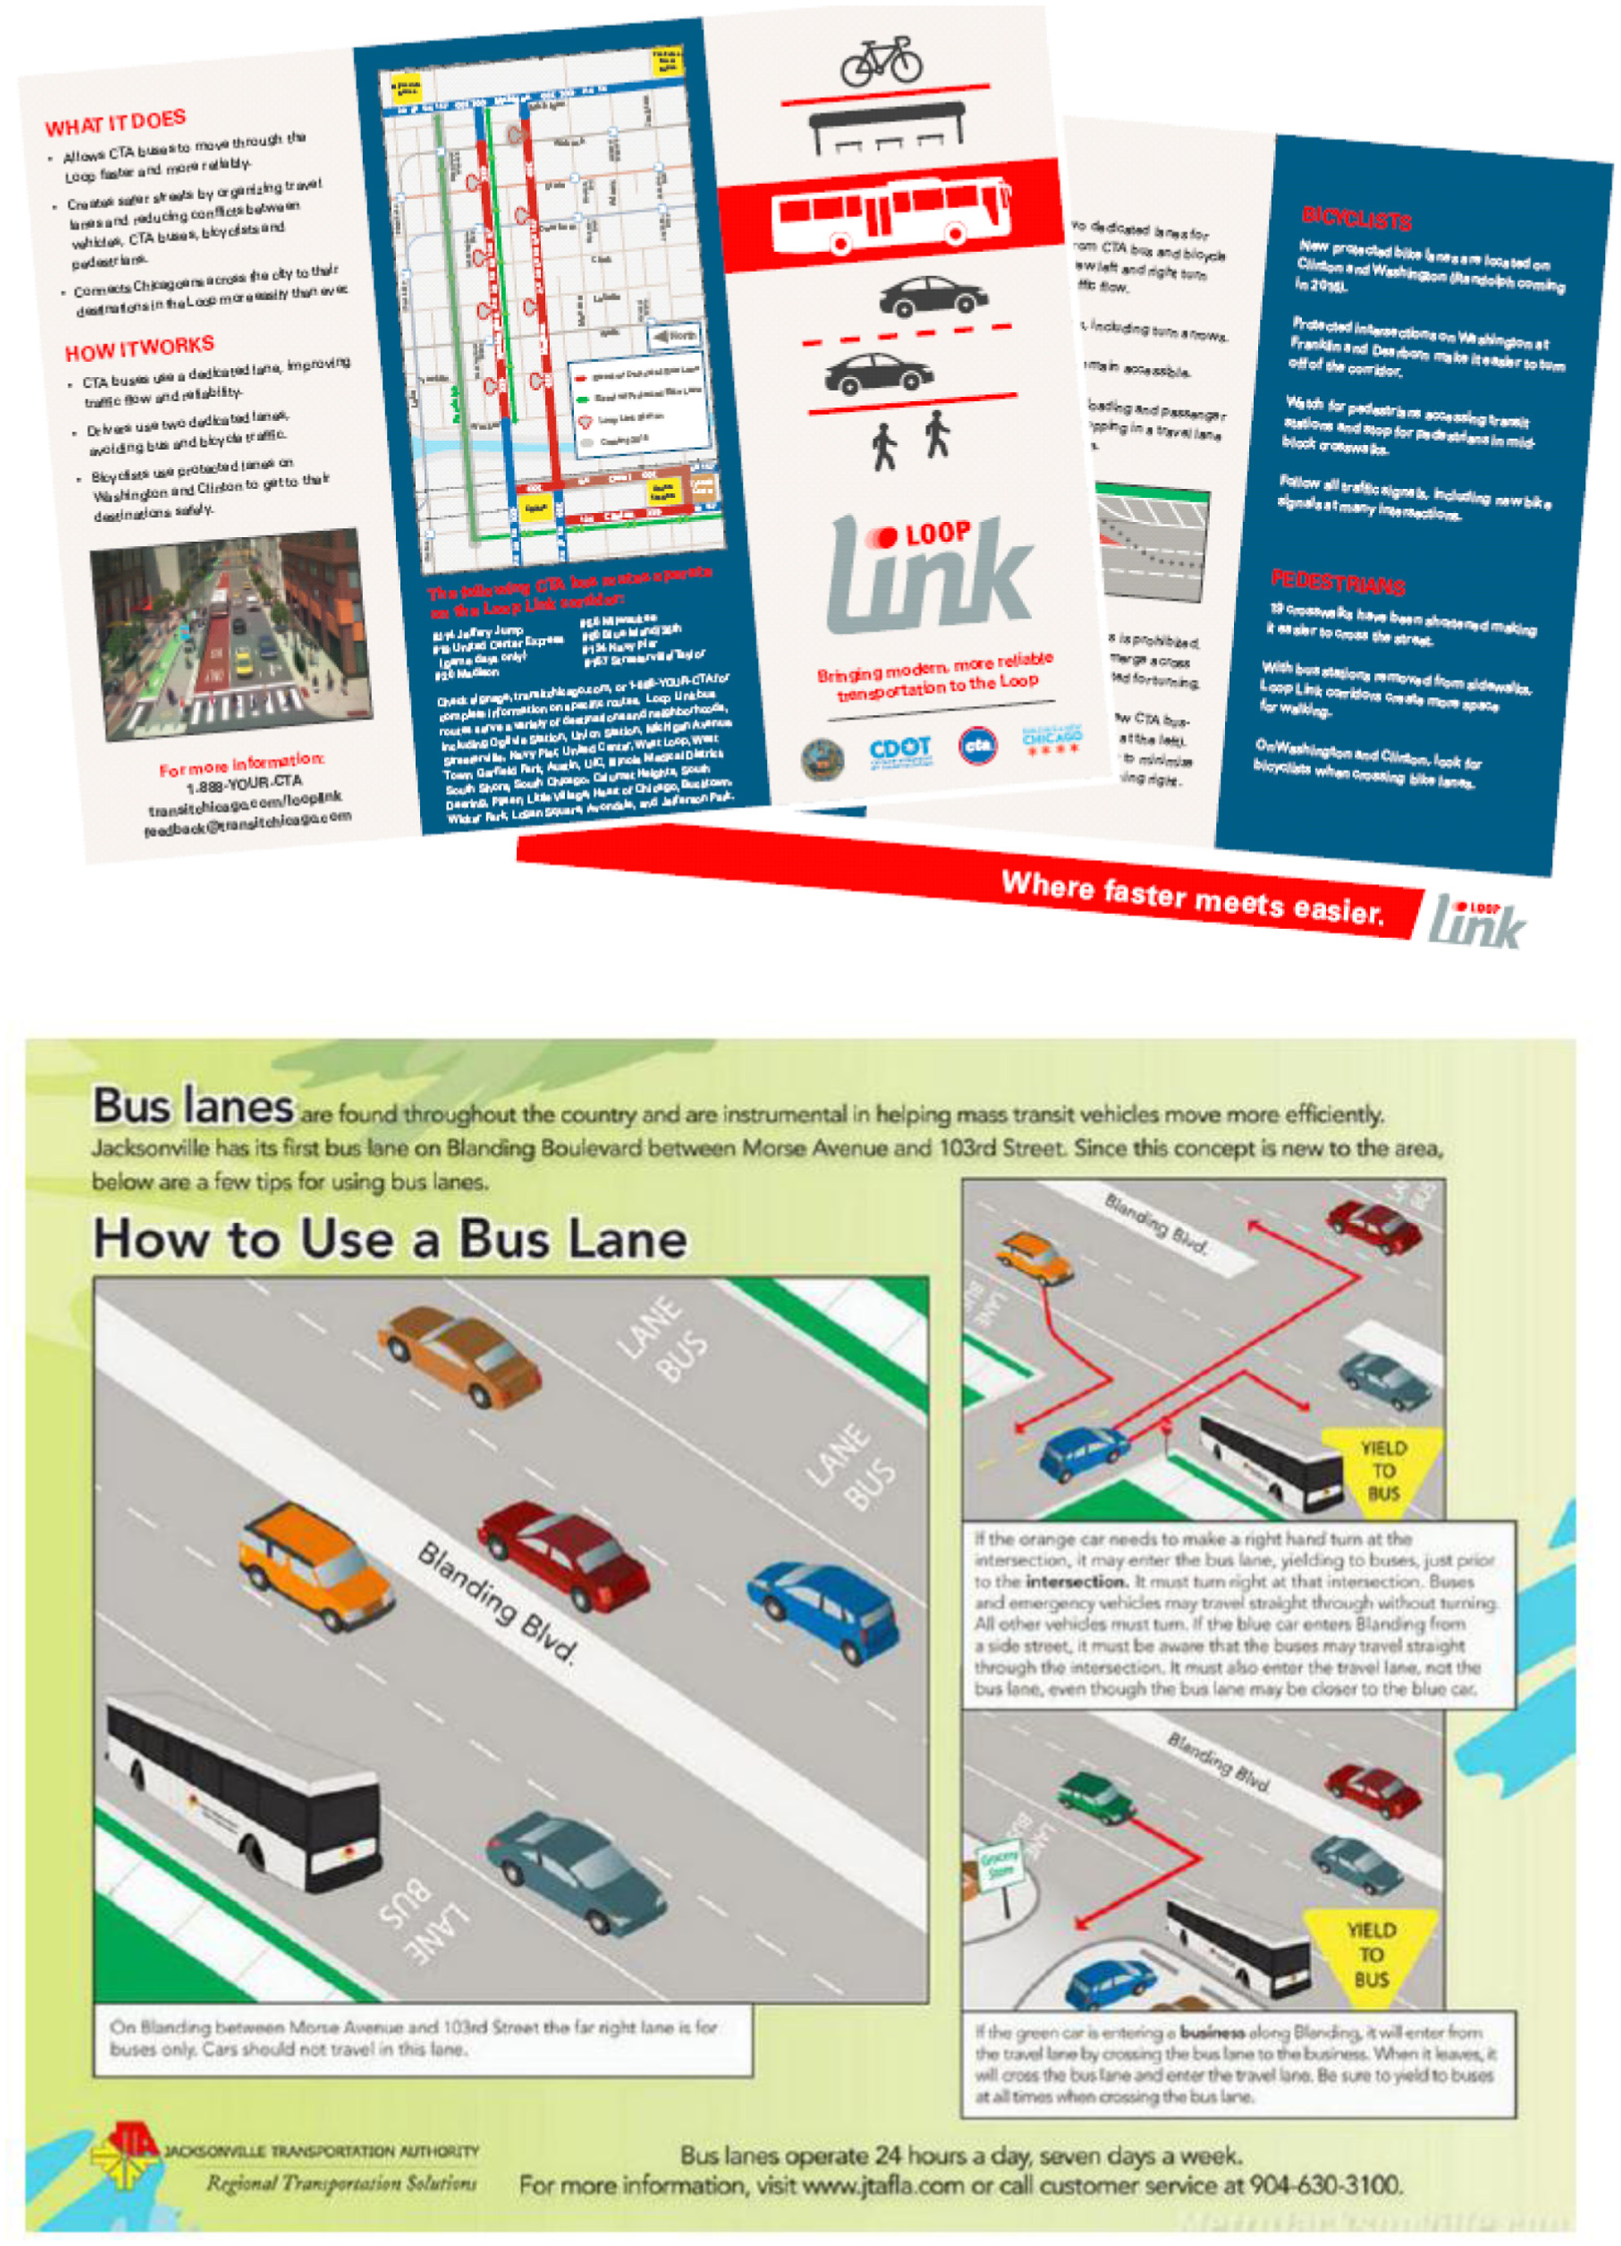
Examples of brochures to educate public and raise awareness about bus lanes.
Tailor Engagement Methods to Fit the Project
Outreach efforts should be tailored and scaled to the needs of the project. With a dedicated bus lane, all road users—including pedestrians, cyclists, drivers, and transit operators—will be affected. Agencies should target outreach toward residents, homeowner associations, community centers, major community organizations, educational or religious institutions, store owners, and jurisdictional leaders within close proximity of the proposed or in-place right of way and bus stop station areas.
Prior to implementing public outreach, agencies should perform an identification assessment of populations likely to be affected using geographic information system (GIS) and other research methods. As noted in the Transit Cooperative Research Program’s Public Participation Strategies for Transit, agencies can use a variety of data sources and consultation methods to accomplish this goal ( 17 ).
Depending on the project, agencies may wish to perform targeted outreach toward certain demographic groups, including seniors, persons with disabilities, transit-dependent populations, low-income residents, minorities, students, choice riders, and non-English speakers.
Educate Transit Vehicle Operators
Wherever bus lanes are implemented, transit vehicle operators will also require education. When implementing bus lane projects, agencies should update operator manuals and offer training prior to and during implementation to help transit vehicle operators avoid conflicts with other road users, take advantage of time-saving techniques such as off-board fare collection or all-door boarding (if applicable), and generally know what to expect when a new project opens.
Monitoring
Stakeholder coordination, enforcement, legislation, and outreach activities are all critical elements of implementing effective bus lanes. However, a successful bus lane also requires continuous monitoring after bus lanes are installed. Monitoring should include performance measures that are meaningful and measurable for evaluating the effectiveness of bus lanes, as well as compliance and violation rates. Key measures to assess the efficacy of enforcement tactics on bus lanes include:
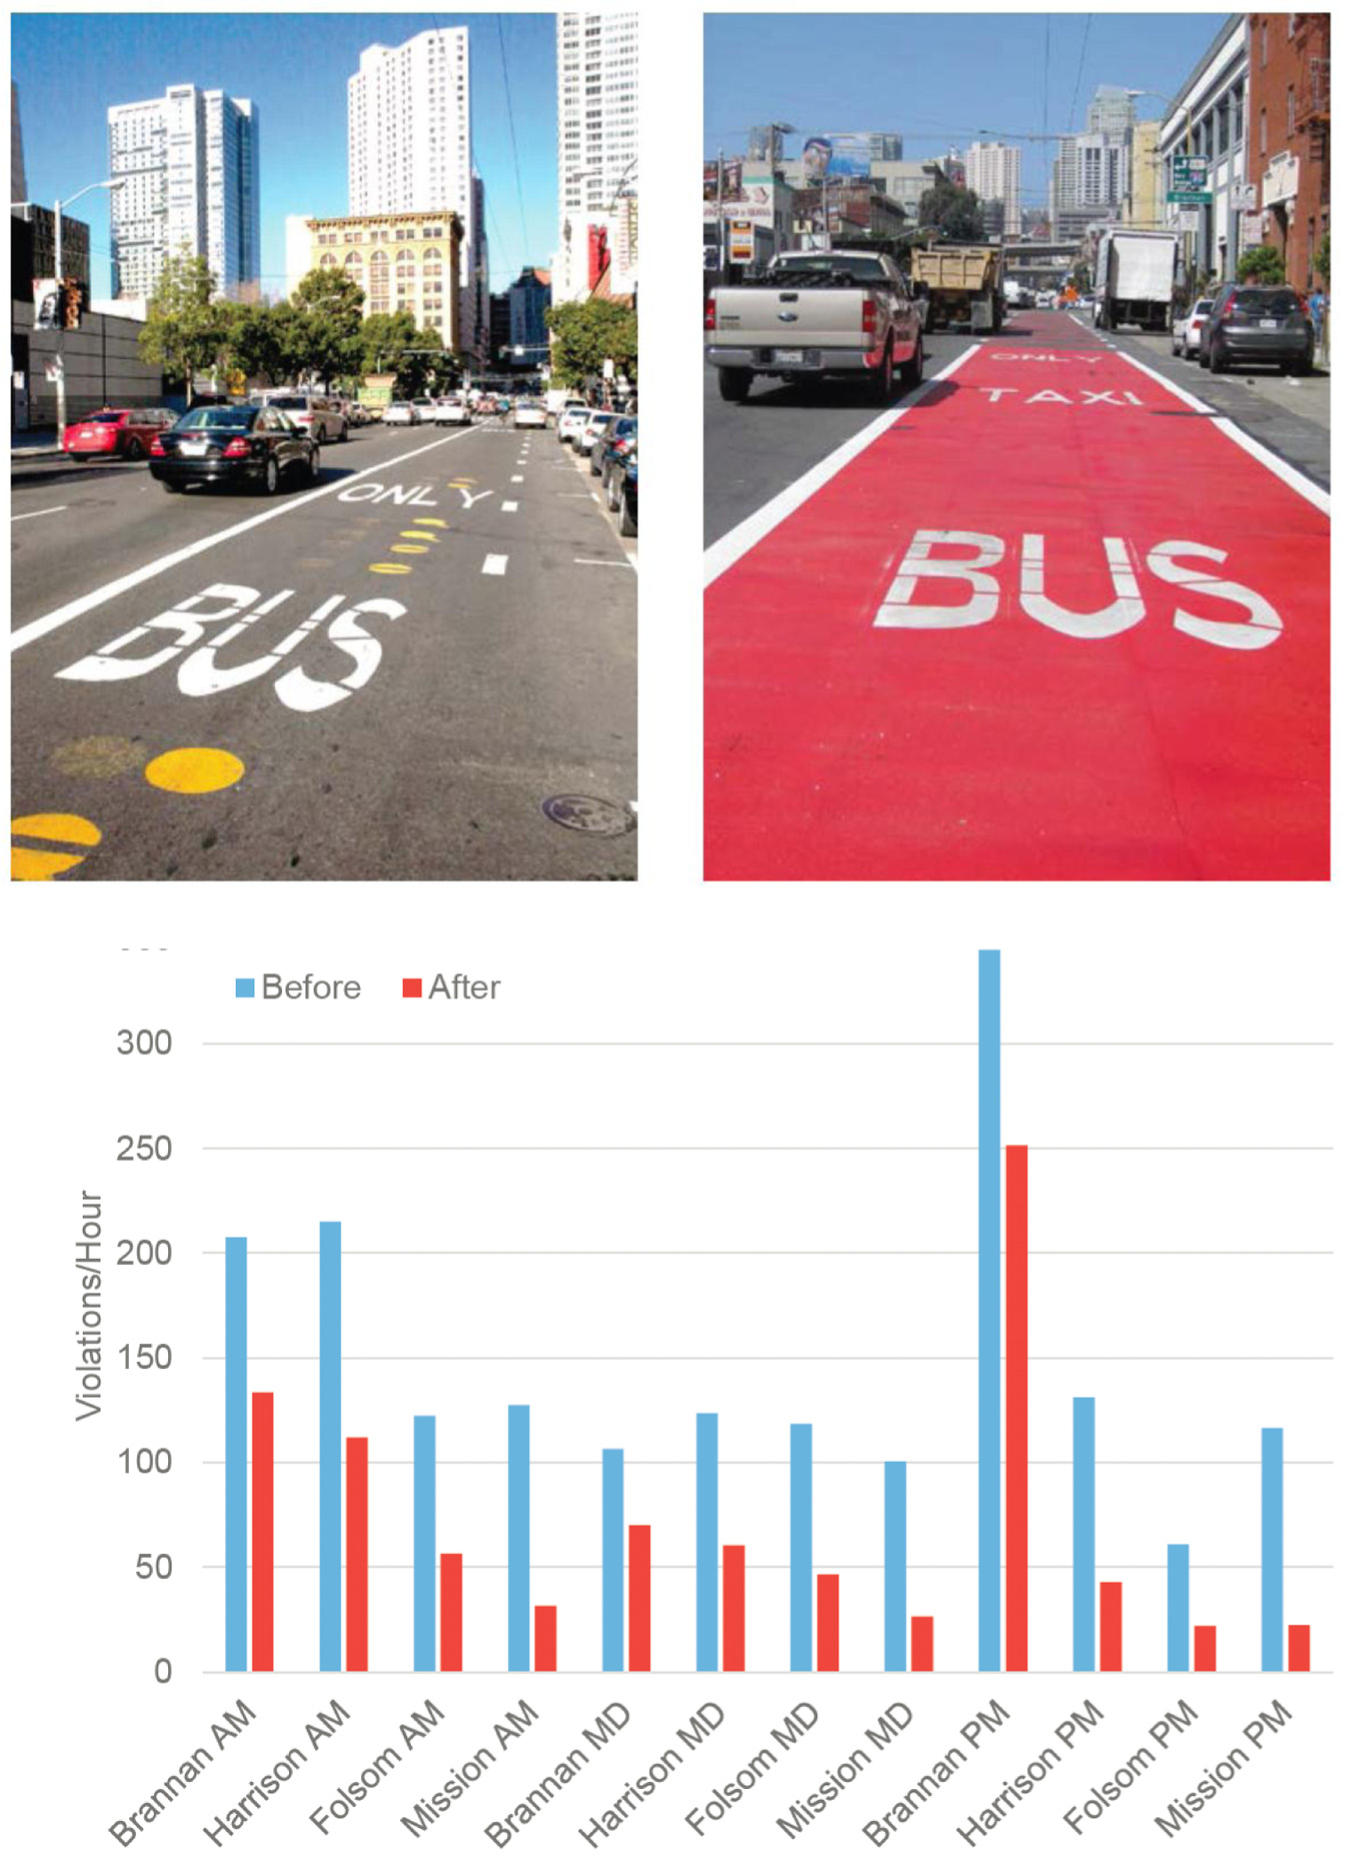
San Francisco 3rd Street bus lane before and after red treatment and corresponding violations per hour along the corridor ( 18 ).
Implementation Plan
As noted previously, this best practices review focuses primarily on bus lane implementation and management. While the assessment and feasibility of bus lanes, which occurs earlier on in the planning process, is beyond the scope of this review, a general framework for the planning process is prescribed in this section. Agencies looking for detailed guidance in earlier stages of bus priority treatment planning should review the following documents:
Shared-Use Bus Priority Lanes on City Streets: Case Studies in Design and Management ( 11 )
TCRP Report 183: A Guidebook on Transit-Supportive Roadway Strategies ( 19 )
The phases and associated recommendations for successful implementation of bus lane projects are summarized in Figure 6.
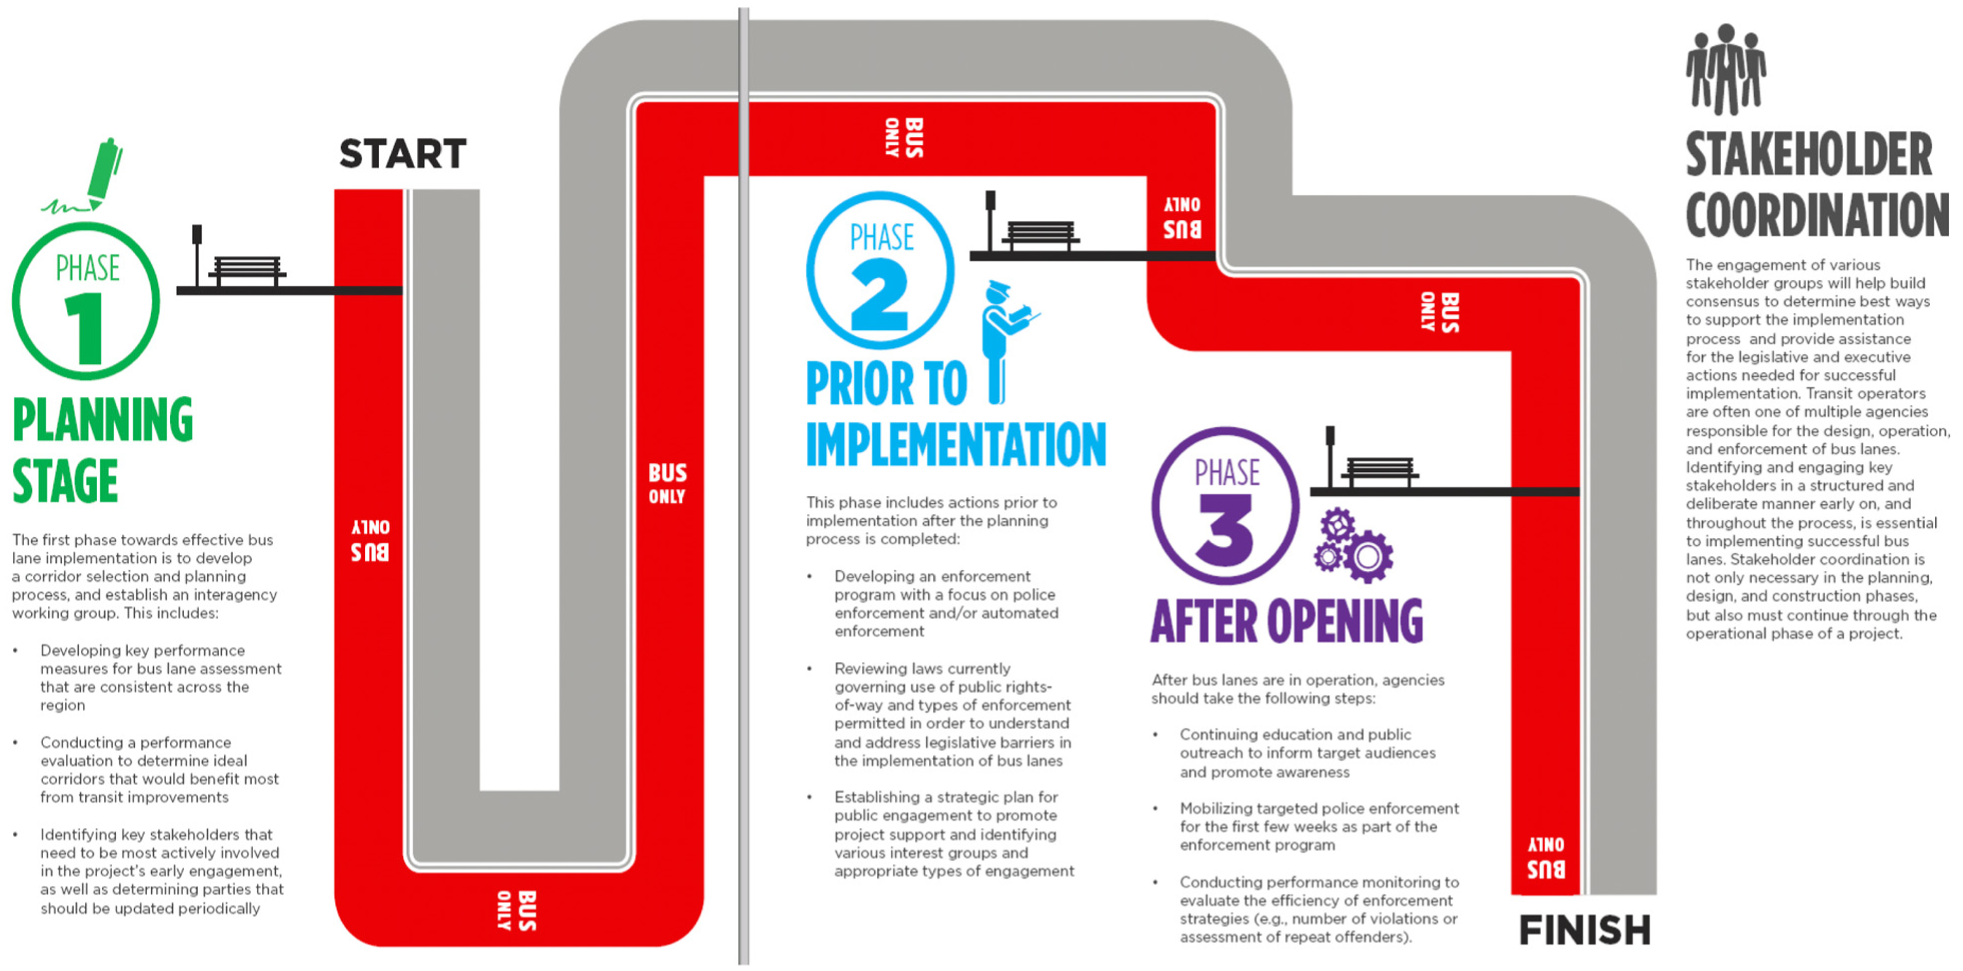
Implementation plan for effective installation and management of bus lane.
Benefit-Cost Analysis
Agencies may use a benefit-cost analysis (BCA) to help identify efficient bus lane enforcement strategies for their particular regions. BCAs look at the net present value of the benefits, and divide them by the net present value of costs. A benefit-cost ratio (BCR) greater than one indicates that benefits exceed costs and that the investment is promising. A BCR below one indicates that costs outweigh benefits, and that the project will need further study or innovative strategies to identify benefits that may not have been adequately quantified to justify the project.
Cost Elements
Table 1 summarizes the cost elements included in the BCA; detailed information on BCA methodology is provided in a separate document ( 9 ). Within this section, “manual enforcement” refers to police enforcement of bus lanes.
Benefit-Cost Analysis (BCA): Cost Elements and Units
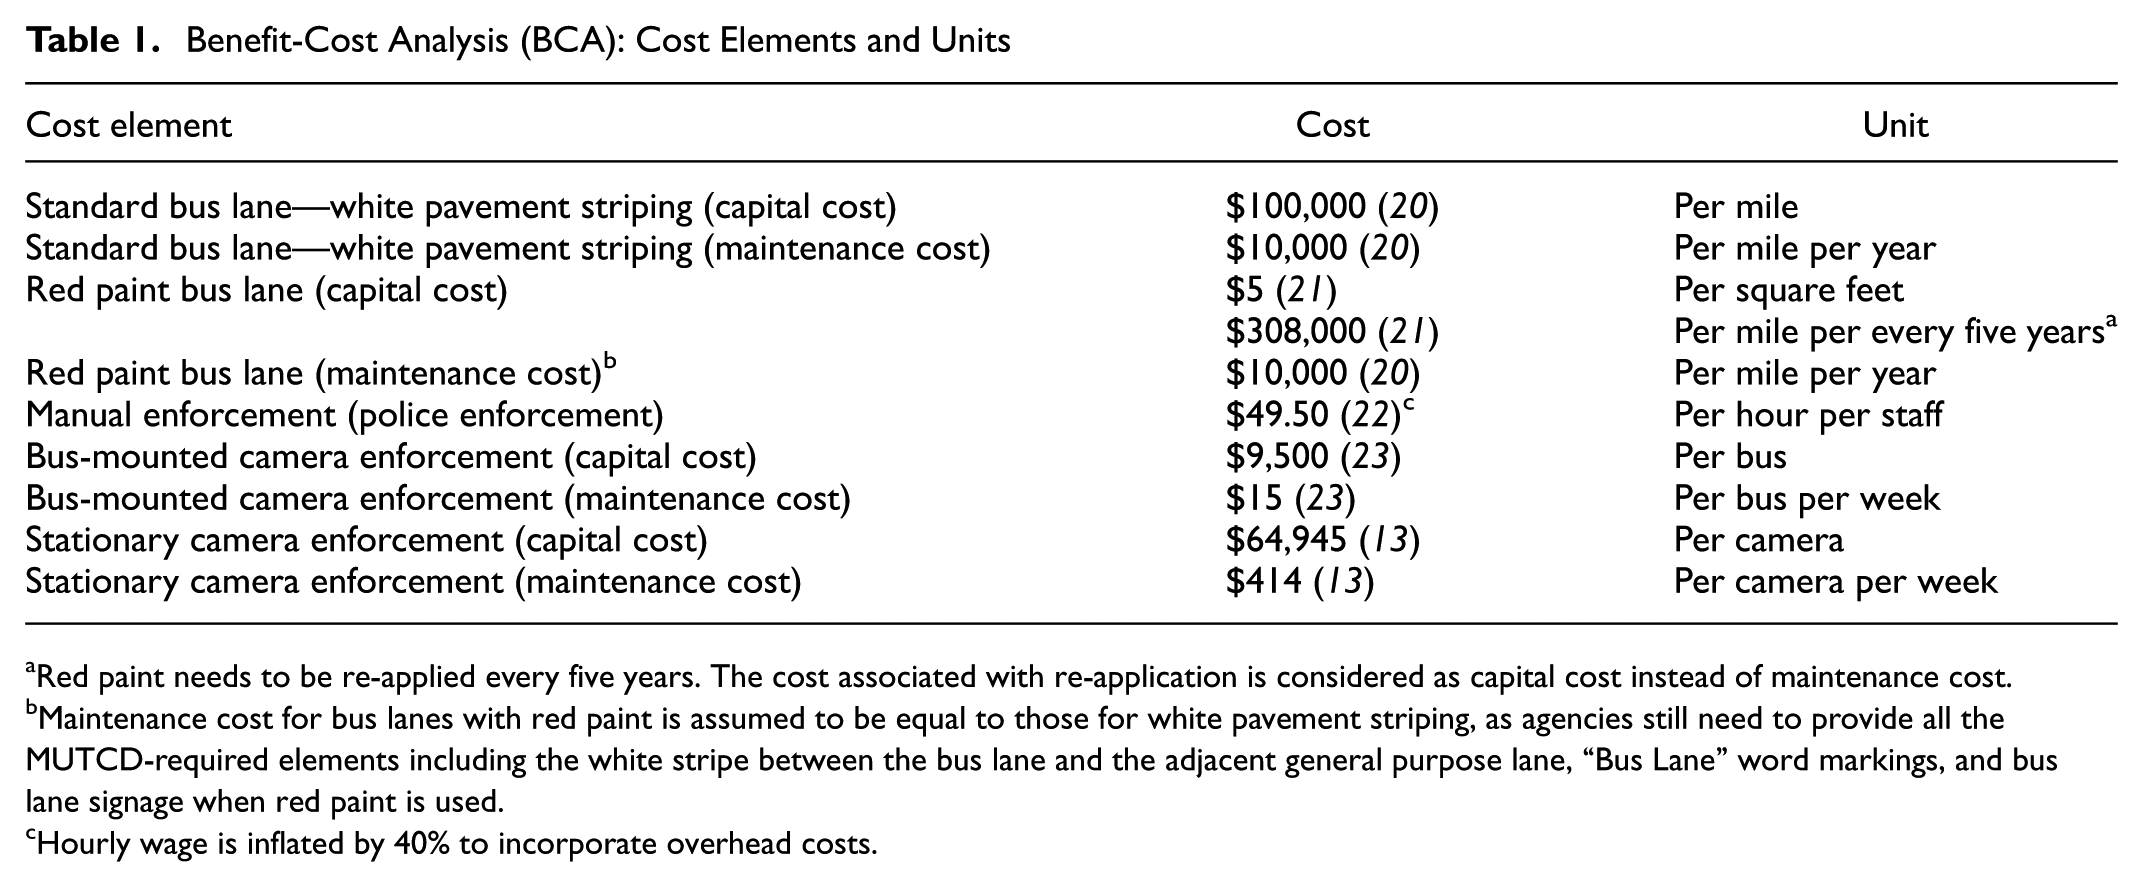
Red paint needs to be re-applied every five years. The cost associated with re-application is considered as capital cost instead of maintenance cost.
Maintenance cost for bus lanes with red paint is assumed to be equal to those for white pavement striping, as agencies still need to provide all the MUTCD-required elements including the white stripe between the bus lane and the adjacent general purpose lane, “Bus Lane” word markings, and bus lane signage when red paint is used.
Hourly wage is inflated by 40% to incorporate overhead costs.
The capital and maintenance costs associated with standard bus lane white pavement striping were obtained from TCRP Synthesis 83 ( 20 ). The synthesis indicates that, where existing lanes are converted to bus lanes, capital costs may range from $50,000 to $100,000 per mile. Since the report was published in 2010, the higher end of the range, that is $100,000, was assumed to account roughly for inflation.
Benefit Elements
For the benefit calculation, the analysis considers passenger travel time savings and fleet savings. Due to limitations in the data held by agencies about the effects of enforcement, the travel time savings and fleet saving benefits associated with 12 potential implementation strategies identified in Figure 7 were quantified using methods outlined in the Transit Capacity and Quality of Service Manual (TCQSM) ( 24 ). The methodology here estimates bus running time rates (i.e., minutes per mile) under various enforcement levels to calculate passenger travel time savings. Table 2 summarizes the methodology and shows travel time savings under each enforcement scenario. In addition to the travel time savings in Table 2, it is assumed that red paint treatment provides additional 0.25 minutes per mile travel time savings with no, low, or moderate enforcement and 0.10 minutes per mile savings under strong enforcement. This is because it is anticipated that additional benefits resulting from red paint would be lower in high enforcement scenarios, compared with no, low, or moderate enforcement scenarios. It should be noted that 0.10 and 0.25 minutes per mile values were assumed based on the authors’ judgment. Finally, while there is limited data based on agencies’ experience, the percent saving results in Table 2 were compared with the results from San Francisco and New York as a “reality check”.
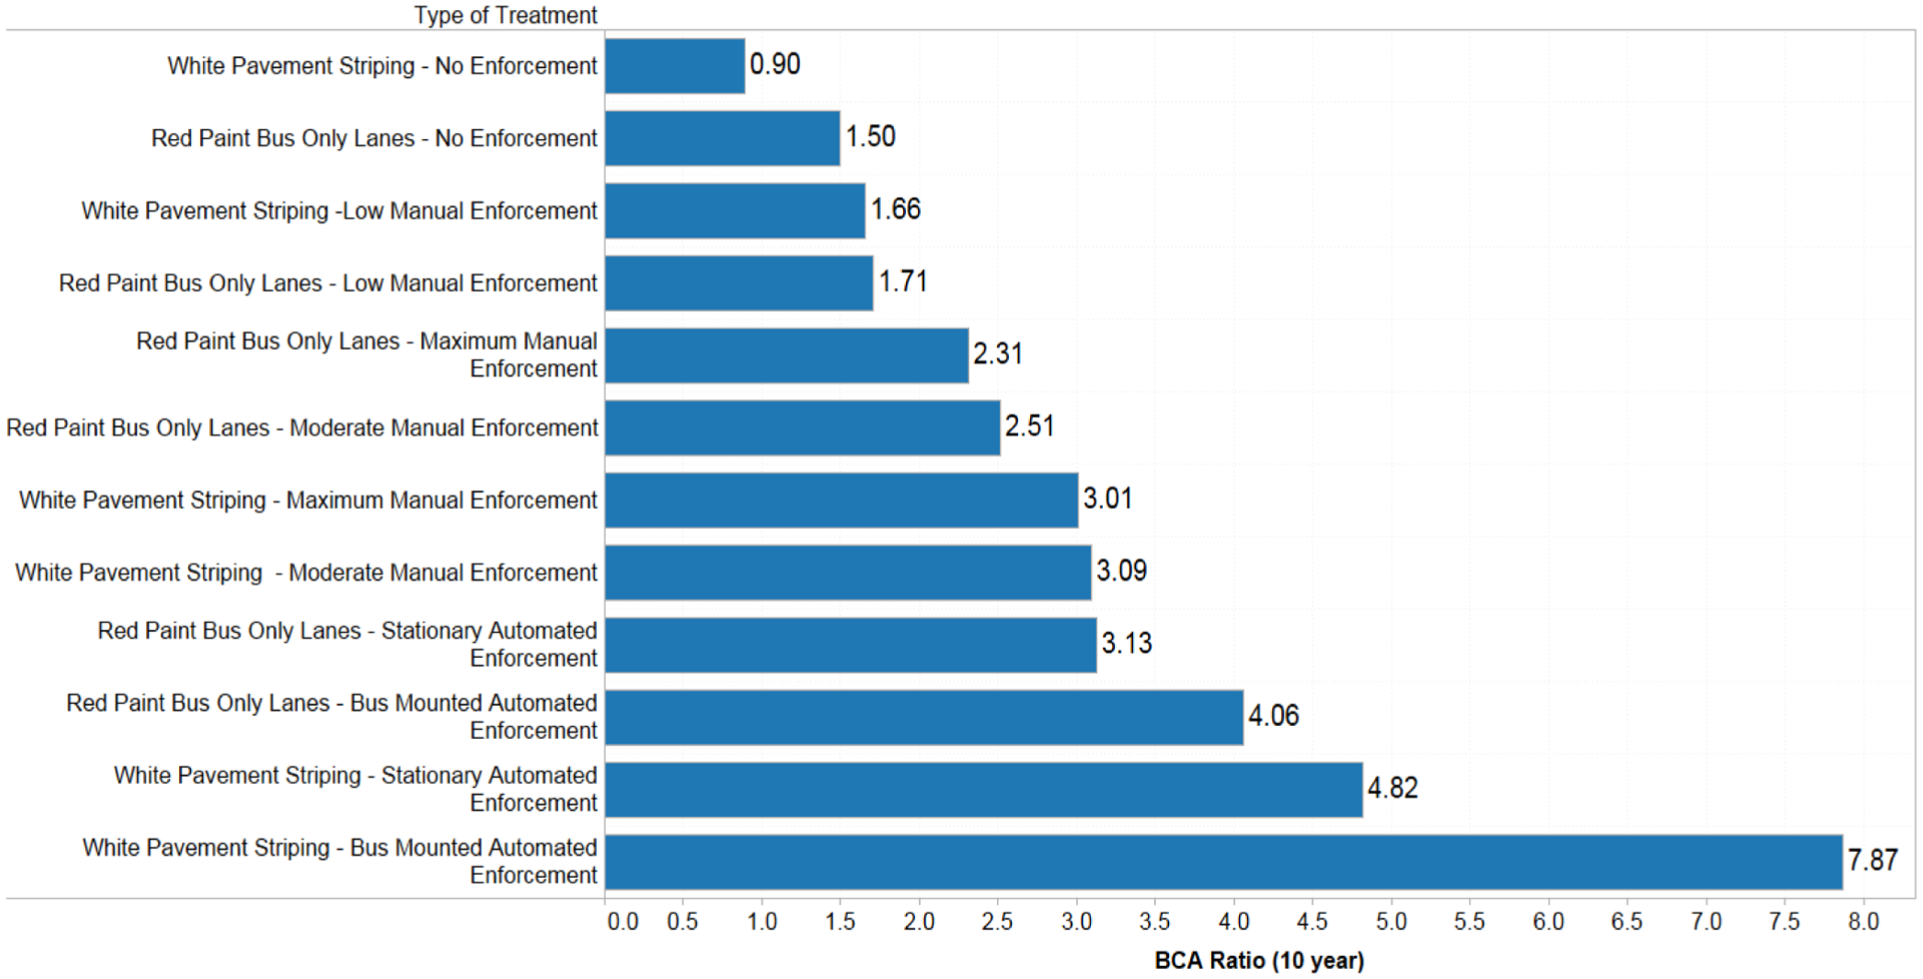
Benefit-cost ratios of bus lane enforcement strategies.
Estimated Travel Time Savings Under Various Enforcement Scenarios
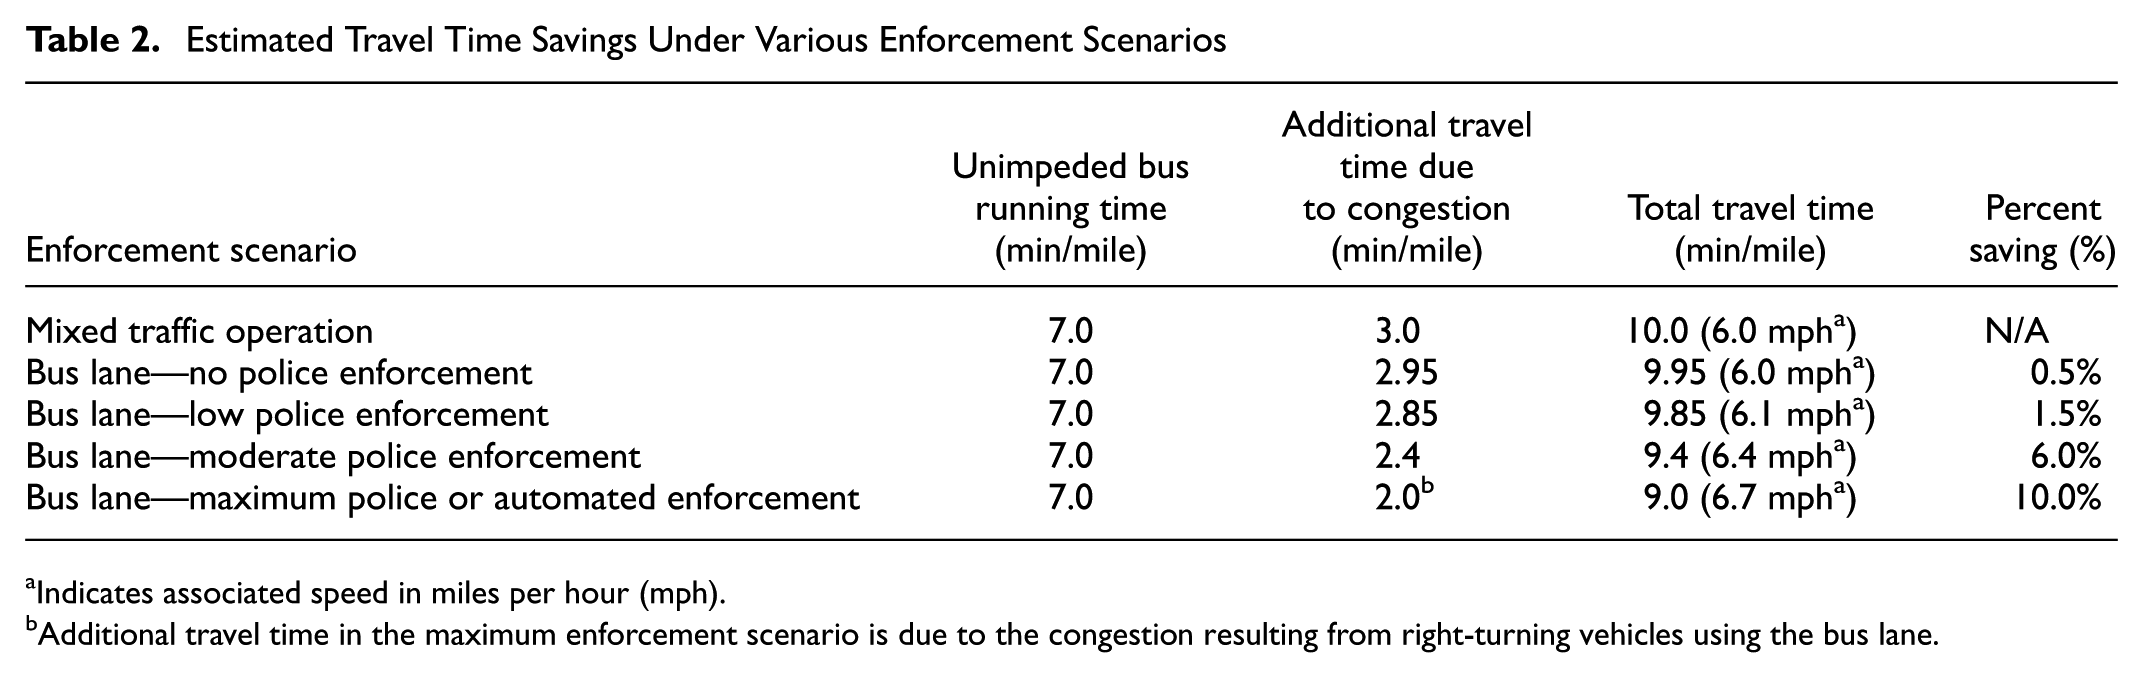
Indicates associated speed in miles per hour (mph).
Additional travel time in the maximum enforcement scenario is due to the congestion resulting from right-turning vehicles using the bus lane.
For fleet savings calculation, the analysis is based on average travel time savings and an assumed fleet saving threshold (fleet savings are achieved when total travel time savings are greater than bus headway). As noted above, detailed information on fleet savings assumptions and findings is provided in a separate document ( 9 ).
Benefit-Cost Ratio Results
To capture the effects of multi-year costs and benefits, including the cost of re-applying red paint to bus lanes, a ten-year benefit-cost ratio (BCR) was calculated.
Figure 7 summarizes the BCR calculated for each enforcement scenario. The results are calculated based on the assumptions that each bus lane would operate for five days a week during peak periods (6 hours per day) at a frequency of 15 buses per hour. Each one mile bus lane is assumed to operate for 50 weeks (approximately one year, excluding major holidays).
Results indicate that the strategies with no enforcement scenarios have the lowest benefit-cost ratios (with a BCR of 0.90), while the strategies with standard lane treatments and automated enforcement scenarios have the highest benefit-cost ratios (BCR of 7.87 and 4.82). Red paint bus lanes fall in the middle range due to the high cost of installing and maintaining red paint bus lanes. However, it is important to note that the BCA assumes agencies have adequate resources to provide a moderate to maximum level of manual enforcement. For agencies with limited resources, red paint treatment yields a higher BCR compared with the standard lane treatment under the no enforcement (1.50 versus 0.90) and low manual enforcement scenarios (1.71 versus 1.66) as red paint serves as both an educational and enforcement tool. In addition, the authors acknowledge that some of the results presented here are order-of-magnitude estimates and further sensitivity analysis needs to be conducted to make conclusions.
Another interesting finding is that white pavement striping with moderate manual (police) enforcement yields a slightly higher benefit-cost ratio than the white pavement striping with a maximum manual enforcement due to the high cost of manual enforcement (3.09 versus 3.01). Finally, eight of the 12 strategies evaluated have benefit-cost ratios that exceed 2.0. These promising ratios indicate that a moderate to strong enforcement program can ensure the success of bus lanes with a return on investment in terms of travel time and fleet savings. However, as noted previously, future research is needed with more field data to have a better understanding of benefit-cost effects associated with various bus lane enforcement strategies and to draw strong conclusions from the analyses.
Summary and Future Research
The initial objective of this research was to identify best practices in bus lane management strategies related to enforcement, legislation, and education. However, agency interviews highlighted the importance of stakeholder coordination at all phases of bus lane implementation. The interviews also revealed that agencies need to establish effective and lasting stakeholder engagement processes, as the management of bus lanes requires coordination and input from many constituents.
The state of the practice indicated that some level of enforcement, either through police or automated enforcement, is required to limit bus lane violations and improve the effectiveness of bus lanes. While police enforcement of bus lanes may be generally effective and feasible for small corridors, the expansion of bus lanes can make continuous police enforcement of lanes impractical due to limitations of budget and human resources. Financial barriers associated with enforcement can be overcome by automating the enforcement process through use of cameras. However, examples from California and New York show that automated enforcement requires new enabling legislation and administrative processes, and that final authorization may take several years. Therefore, agencies interested in developing camera-based enforcement should begin the legislative process early, and conduct a robust education and outreach program to address potential public concerns over privacy issues.
Furthermore, education is a crucial piece of an effective bus lane management process. Identifying project partners early and targeting constituents with relevant messages, both during and after implementation, are found to be the most effective educational strategies. Furthermore, installing strong visual cues (e.g., lane striping, red paint, and/or signs) is recommended as both a form of education and enforcement.
Finally, this paper provides a comprehensive review of current best practices for bus lanes with a focus on enforcement, legislation, and education. The findings presented here lay a general groundwork for future research for establishing nationwide strategies for effective bus lane management and major barriers to implementation.
Footnotes
Acknowledgements
This paper builds on an earlier work performed by the National Capital Region Transportation Planning Board (TPB), in coordination with WMATA. The authors would like to thank TPB and WMATA for funding this study and for their valuable suggestions and comments.
Author Contributions
The authors confirm contribution to the paper as follows: study conception and design Ramona Burns, Richard Roisman, Burak Cesme, Kevin Lee, and David Miller; data collection: Jesus Cuellar, Katie List, Meredyth Sander; analysis and interpretation of results: Meredyth Sanders, Jesus Cuellar, Burak Cesme and Katie List; draft manuscript preparation: Burak Cesme, Katie List, David Miller, Kevin Lee, and Arianna Koudounas. All authors reviewed the results and approved the final version of the manuscript.
The Standing Committee on Bus Transit Systems (AP050) peer-reviewed this paper (18-03098).