
Abstract
Parking violation citations, often used to identify factors contributing to parking violation behavior, offer one of the most valuable datasets for traffic operation research. However, little has been done to examine their spatial dependence caused by location-specific differences in features such as traffic, land use, etc., and potential selection biases resulting from different effects of traffic enforcement. This study leveraged extensive data on double parking citations in Manhattan, New York City, in 2015, along with other relevant datasets including land use, transportation, and sociodemographic features. Moran’s I statistics confirmed that double parking tickets were spatially correlated so that spatial lag and spatial error models were proposed to account for the spatial dependence of parking tickets to avoid biased estimates. To investigate whether selection bias exists in issuing tickets, we estimated the effects of parking ticket density and police precinct distance, when controlling for variables such as commercial area, truck activity, taxi demand, population, hotels, and restaurants. Parking ticket density and police precinct distance were used as indicators of the enforcement levels and coverage and were found to be statistically significant. This indicated the existence of selection bias due to heterogeneity in enforcement levels or coverage across different regions. Moreover, patrol patterns of traffic enforcement officers revealed that the majority had less than three daily patterns. These findings can assist with proper usage of the citation data by recommending that researchers and agencies consider spatial dependence as well as selection bias, and provide insights for parking violation management strategies.
For urban areas, parking can be extremely costly, imposing a substantial burden on drivers. In 2016, Americans spent an average of 17 hours searching for parking at an estimated cost of 72 billion dollars in wasted time, fuel, and emissions ( 1 ). Other indirect parking challenges for drivers include the risk of parking fines, which add up to 2.6 billion dollars annually ( 1 ). Parking violation management is increasingly a concern for many megacities, such as New York City (NYC), due to the conflict between limited on-street parking supply and rigid parking demand. This high demand and competition for parking space often leads to illegal parking behaviors, such as double parking, which contribute significantly to traffic congestion and accidents. Several recent studies have also identified the effects of parking in the context of commercial vehicles and proposed innovative yet practical approaches to alleviate these negative effects ( 2 – 7 ).
Every year, over 10 million parking violation tickets are issued in NYC, and these citations offer a valuable dataset for researchers to develop parking models that can help to explore hotspots and to investigate the impacts of contributing factors. Conventional statistical analysis relies on the assumption that each parking citation is independent ( 8 ). However, this assumption could be violated if spatial autocorrelation exists in the data, and thus spatial models are desired. Additionally, the increase in volume and variety of emerging data sources, such as GPS-equipped vehicles, enables more precise estimation of the effects of potential contributing factors by providing richer data for modeling ( 9 ).
This also provides great opportunities for a deeper investigation of parking citation data, particularly on the potential underlying bias. Many studies in other disciplines have shown that record-based data, such as crime data, is not a complete population of all occurrences, nor does it yield a representative random sample ( 10 ). Although this point has not been fully proven in parking citations, parking citations may underestimate the true occurrences of parking violations as most of such activities may not be ticketed. Correlation between total numbers of tickets may be proportional to different vehicle types (i.e., commercial versus passenger vehicle) or the number of enforcement officers that monitor a certain area. In many cases, the data on the incidence of parking violations may be skewed to areas with high-intensity enforcement, when in fact there may be a higher incidence in other areas. The fact that parking ticket data might not represent the actual population of parking violations accurately may be due to the selection bias resulting from heterogeneous enforcement intensity. Selection bias in this case means certain areas are more likely to be ticketed by the enforcement officers than others. Because selection bias can be a problem when using ticket data, its existence and impact need to be explored.
As an extension of two previous studies ( 11 , 12 ), this study leverages one year of geocoded parking tickets issued in 2015 in Manhattan, NYC, with a focus on double parking, which is a phenomenon typical of urban areas. The objectives of this study are two-fold. The first goal is to find out whether spatial dependence exists in the double parking citation data. If so, models that do not address spatial dependence would lead to biased estimation. Second, this study investigates whether selection bias exists in issuing parking tickets. We estimated the effects of two indicators of police enforcement intensity, parking ticket density and police precinct distance, when controlling for other variables such as land use, transportation, or sociodemographic features.
Literature Review
Various studies have been conducted for different cities using parking citation data. Wang and Gogineni ( 13 ) performed an empirical investigation of commercial vehicle parking violations in NYC during May 2014 to identify the factors that may influence parking violation behaviors. Three models: Poisson regression, negative binominal, and zero-inflated negative binominal model, were used to analyze violation frequency. Their results indicated that land use and value, road type, on-street parking price, population, and employment densities are related to commercial parking tickets. However, although the study considered spatial distribution patterns of the violations, it did not account for potential spatial dependence structure and possible bias while conducting regression analysis.
Wenneman et al. ( 14 ) established an ordinary least squares (OLS) regression model to examine the relationship between density of commercial vehicle parking citations issued in Toronto, freight trip generation, and built environment factors. Though the model claimed to achieve an adjusted R-squared value of 0.68, it did not consider the possible spatial dependence of the parking ticket data.
Kawamura et al. ( 15 ) conducted hot spots analysis using parking citations issued over 12 months in Chicago. The results from the regression model with trial-and-error and the backward elimination process showed that concentrations of food businesses and wealthy neighborhoods with a high percentage of residents with tenure over 5 years can present problems for truck parking. One important contribution of this model is that it assumed the log of the density of tickets issued to passenger vehicles reflects the number of parking enforcement and police officers in the area. The authors believed that, in the areas that were patrolled heavily, truck parking violations had a higher probability of being ticketed compared with areas with a low level of enforcement.
Gao and Ozbay ( 11 ) studied the spatial distribution of NYC double parking violation records in 2014 for all vehicle types including commercial vehicles. The study showed there were more violation records for double parking in commercial districts and mixed commercial/residential districts. Furthermore, field data collected in another study by Gao and Ozbay ( 12 ) confirmed that violation ticket data highly underestimated the real occurence of double parking violations. For example, a street block with a record of 208 double parking tickets per year had about 40 unticketed violations on a single day during the morning peak hour ( 12 ).
Smith and Steif ( 16 ) used more than 1.4 million parking violation tickets in Philadelphia in 2013 to calculate the probability of at least one ticket being issued by hour and by street. They claimed that a more general probability cannot be estimated due to unobserved factors, including the patrol patterns of traffic enforcement officers.
Although all of the above studies claimed that citation data is very valuable, most studies have mainly focused on its relationship with land use, parking supply, and sociodemographic features ( 13 – 15 ). There has been little discussion of its spatial dependence caused by location-specific differences and potential selection biases resulting from different traffic enforcement levels or coverage. Only a few studies ( 12 , 15 , 16 ) have discussed the potential bias in citation data, and only one study ( 15 ) has attempted to analyze and quantify the bias due to parking enforcement. The results of the latter model found a strong association between “enforcement level” and parking violations tickets by trucks. Thus, there is a need to investigate spatial dependence and bias in the parking data, especially selection bias due to police precinct locations or patrolling patterns of traffic enforcement officers.
Data Preparation
Parking Violation Tickets
Parking violation ticket data is released by NYC Department of Finance monthly and shared via the NYC open data portal ( 17 ). A batch geocoding program was developed based on U.S. Census Bureau Geocoding Services Web Application Programming Interface (API) ( 18 ) and Google Geocoding API ( 19 ) to convert the original address information in citation data into geographic coordinates. The geocoding rate can reach 95.3% after reformatting the address and correcting special cases with direction abbreviation or distance information (i.e. “200 feet W/O an intersection”).
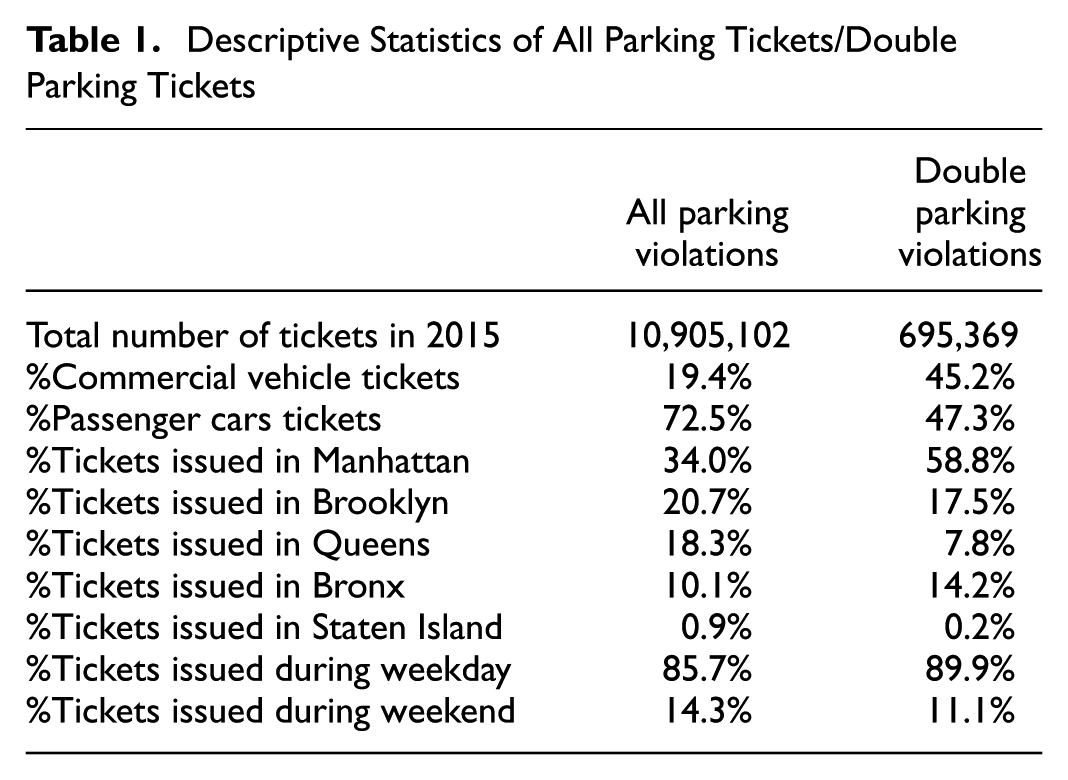
In total, 10,905,102 violation tickets were issued in NYC in the year 2015. The lowest daily parking ticket totals occurred on January 27th (North American Blizzard), July 5th (the day after Independence Day), and December 27th (weekend after Christmas day). Among the total of nearly 11 million tickets issued, 633,050 (6.3%) were for double parking. Table 1 lists descriptive statistics for all parking violations and double parking violations. The result lends support to the claim that, unlike the general trend for all parking violations, commercial vehicles account for a significant portion of the double parking violation tickets (45.2%). This may be because of inadequate parking spaces for commercial vehicles in a high-density urban network and the desire of the commercial vehicles to park as close as possible to their delivery spot. The result also highlights that more than half of the double parking tickets were issued in Manhattan (58.8%). About 85% to 90% of the tickets were issued during weekdays, and the hourly distribution pattern is consistent with work hours (Figure 1).
Descriptive Statistics of All Parking Tickets/Double Parking Tickets
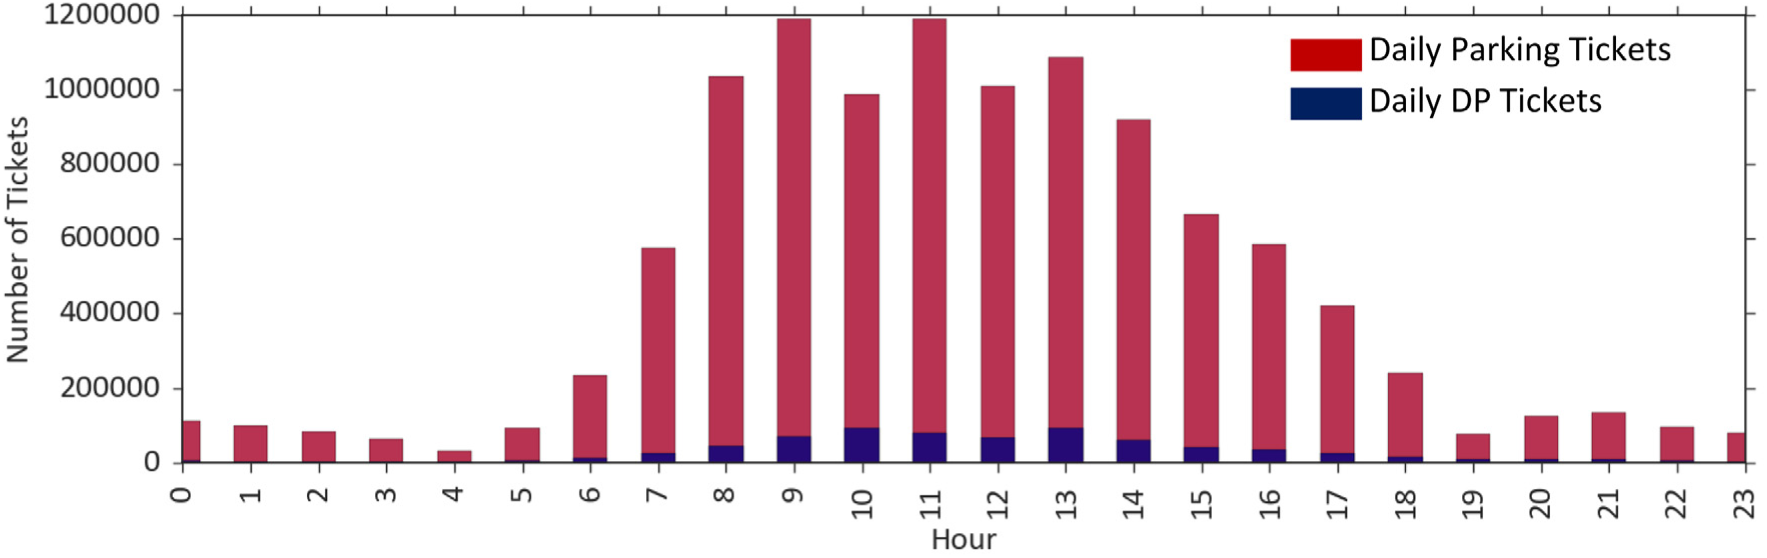
Hourly distribution of all parking/double parking tickets.
Geographical Analysis Units
The map of Manhattan is uniformly split into 6,204 equal-sized grid cells (300 feet × 300 feet). The approximate width of a street block in Manhattan is close to 300 feet and the length of it (800~900 feet) can be integer multiples of 300 feet. Advantages of using equal-sized grid cells as the basic geographical units include: (a) providing street-to-street resolution, (b) easing the bias from different analysis unit sizes, and (c) incorporating easily with data such as land use features ( 9 ). Recent studies ( 9 , 20 ) show the implementation of a cell-structured modeling framework in transportation research. Parking tickets, along with sociodemographic, land use, transportation, and enforcement data, were aggregated for each cell using spatial analysis tools in ArcGIS ( 21 ). Figure 2 demonstrates the density of double parking tickets at the grid-cell level in Manhattan in 2015.
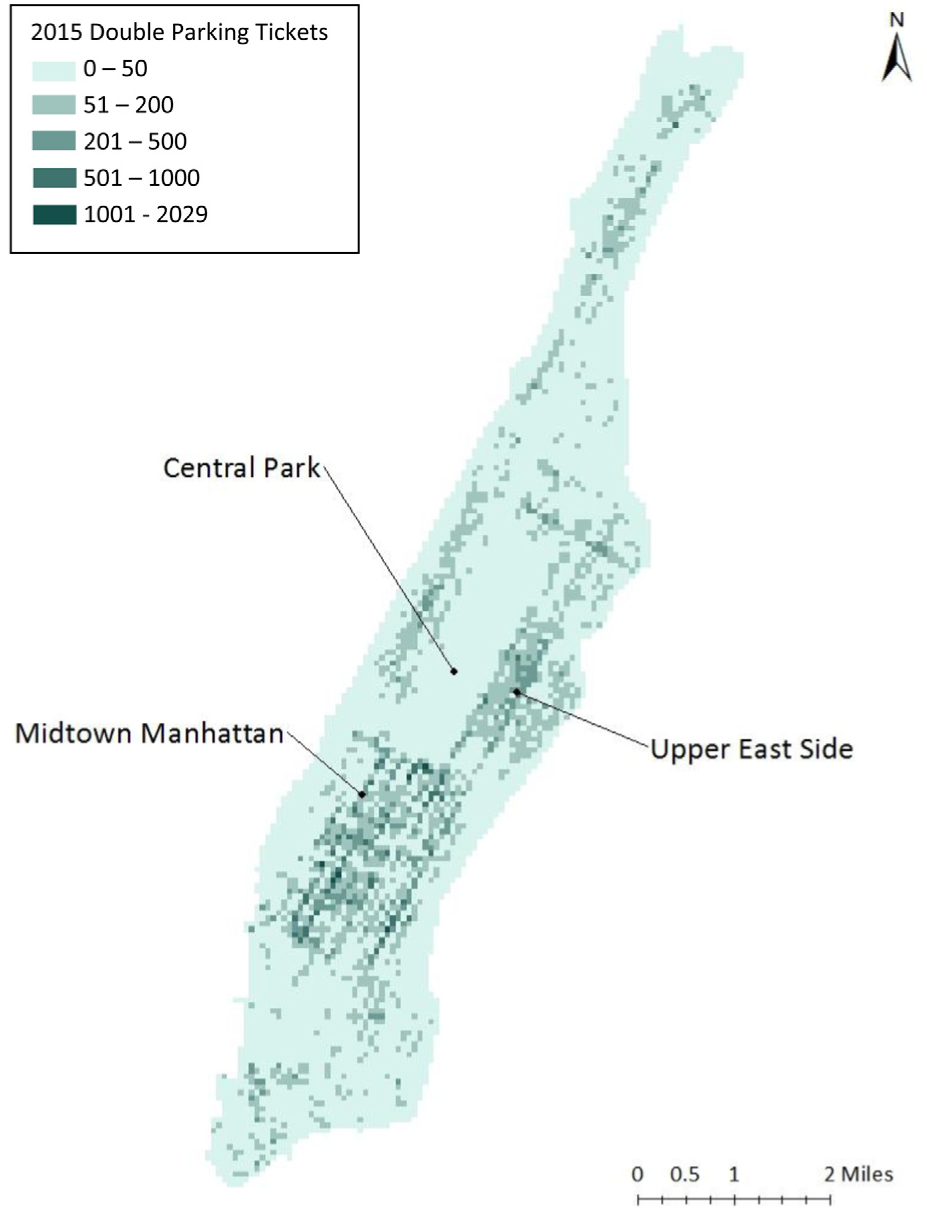
Double parking ticket density at grid-cell level in Manhattan in 2015.
Land Use, Sociodemographic, Transportation, and Enforcement Data
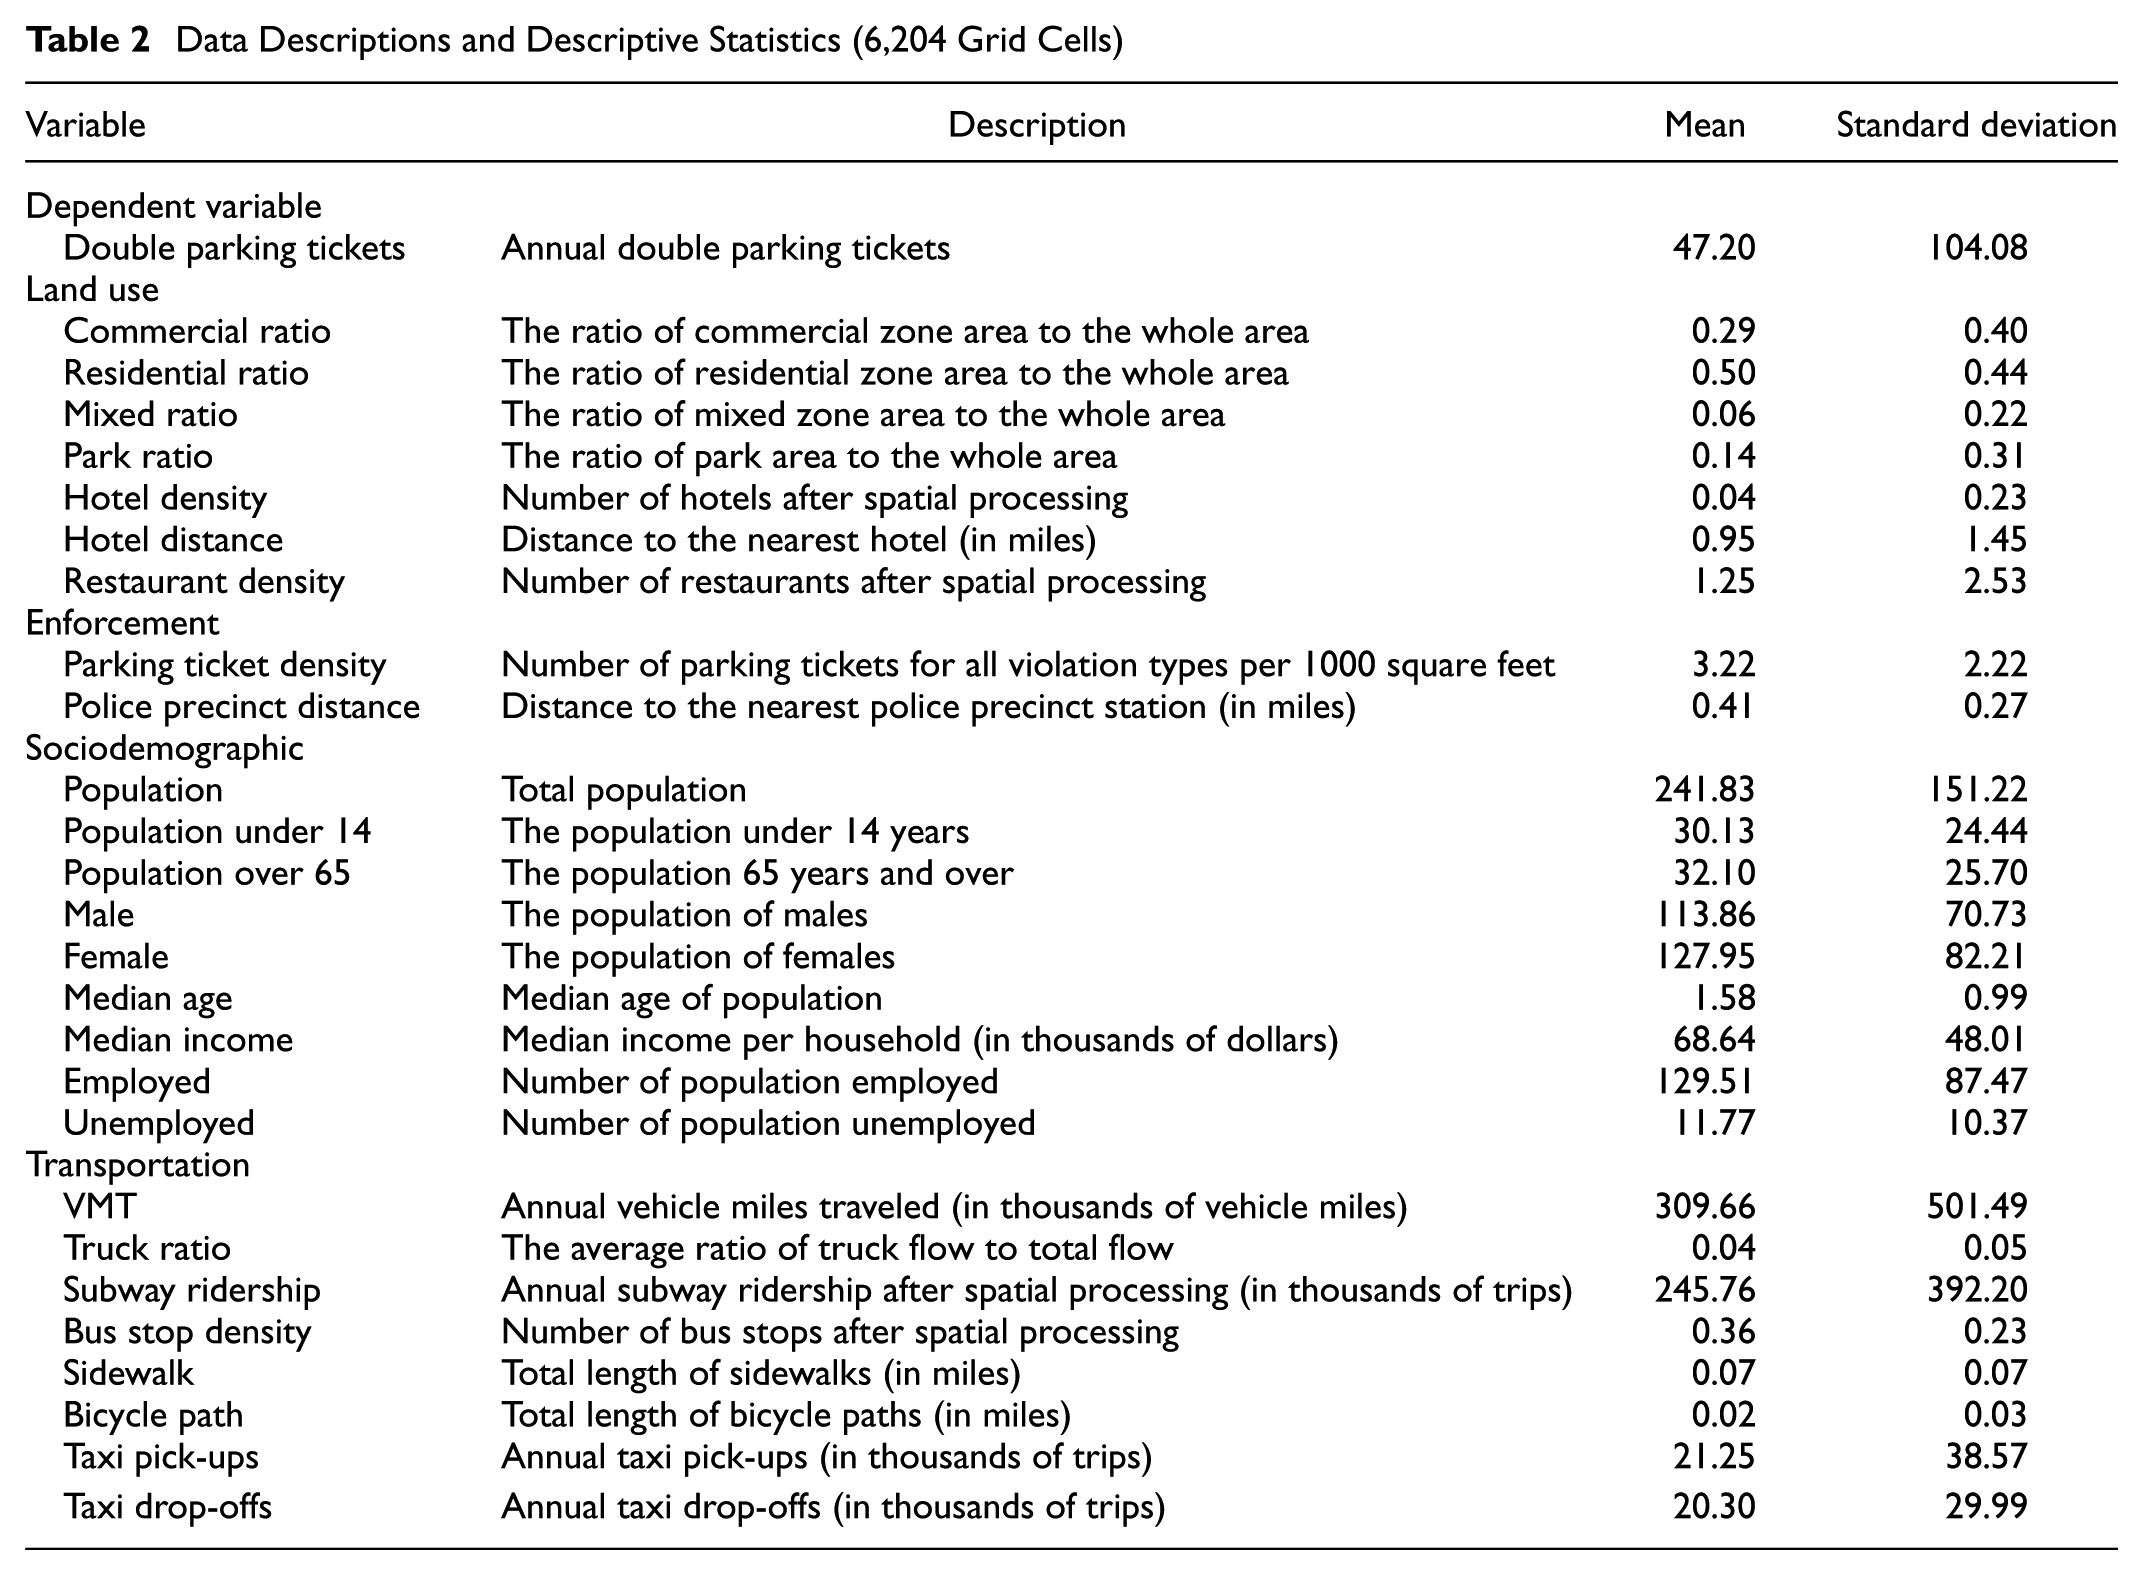
Various factors contributing to parking violations have already been identified by previous studies. The most commonly used factors are land use and sociodemographic features like land use type and population ( 13 – 15 ). This study obtained detailed and categorized information on land use zoning for commercial, residential, mixed, and park usage from NYC Department of Planning (NYCDCP) ( 22 ). A Visual Basic for Applications (VBA) program was developed to compute the ratio for each zoning category in every grid cell ( 9 ). Sociodemographic information based on the 2011 census survey was retrieved from U.S. Census Bureau ( 23 ) and disaggregated into each grid cell.
Additionally, Gao and Ozbay ( 12 ) and Kawamura et al. ( 15 ) pointed out that places of interest such as hotels or food sale locations could be potential contributing factors for double parking. Therefore, hotel information from New York State Department of Transportation (NYSDOT) open data portal ( 24 ) and geo-processed restaurant information ( 25 ) was also utilized.
Road network features and traffic information ( 13 , 15 ) are commonly used as well. In this study, taxi pick-ups and drop-offs obtained from NYC Taxi and Limousine Commission ( 26 ) were used as estimates of traffic demand. Road network information like sidewalks, bicycle paths, and vehicle miles traveled (VMT) were obtained from NYCDCP ( 22 ), NYC Department of Transportation ( 27 ), and NYSDOT ( 28 ), respectively. It should also be noted that the VMT for each grid cell was estimated from the length and the average daily traffic of the road segments in the cell ( 9 ). A MapReduce program for expressing distributed and parallel computations was developed to process the massive taxi trip records in 2015 (>20 Gigabytes) ( 9 ). Public transit information, such as bus and subway station geographic information system (GIS) data and the ridership for each subway station, was generated using open data from the Metropolitan Transportation Authority ( 29 ).
There has been an inconclusive debate about whether traffic enforcement and patrol patterns have an impact on parking tickets. The number of tickets issued to a street block or an area may be biased by the level of enforcement and coverage. To investigate these factors, this study also collected the following data for each grid cell: (a) the density of tickets for all parking violations, and (b) the distance to the nearest police precinct station. The former is assumed to reflect the level of enforcement in the area. This variable was computed by counting the total number of parking tickets (all violation types) in each police precinct and then dividing this number by the precinct area, and then these values were assigned to each grid cell in the study region. The distance to the nearest police precinct station was computed for each grid cell. Police precinct station addresses retrieved from the New York Police Department website ( 30 ) were geocoded onto the map of our study area. Table 2 summarizes the data descriptions and descriptive statistics.
Data Descriptions and Descriptive Statistics (6,204 Grid Cells)
Methodology
Spatial Dependence Test
Spatial dependence tests, such as global Moran’s I and local Moran’s I ( 31 , 32 ) statistic tests, are widely used for measuring spatial autocorrelation. If a spatial dependence exists in the data, then commonly used assumptions for statistical models such as independent observation of the data will no longer hold, and the estimates from these models will be biased and inefficient. This type of bias may be corrected by using spatial models.
Global Moran’s I statistic, proposed by Moran ( 31 ), illustrates an indication of “the degree of linear association between a vector of observed values and a weighted average of the neighboring values that underlie the specification of spatial autoregressive processes ( 33 ).” Local Moran’s I is developed based on the assumption that global Moran’s I is a summation of individual cross-products and computes a measure of spatial association for every observation ( 32 ). The purpose of local Moran’s I statistics is to capture local patterns that the global Moran’s I may not observe.
Global Moran’s I was used first to measure the spatial dependence of double parking tickets. The z-score of Moran’s I (

where
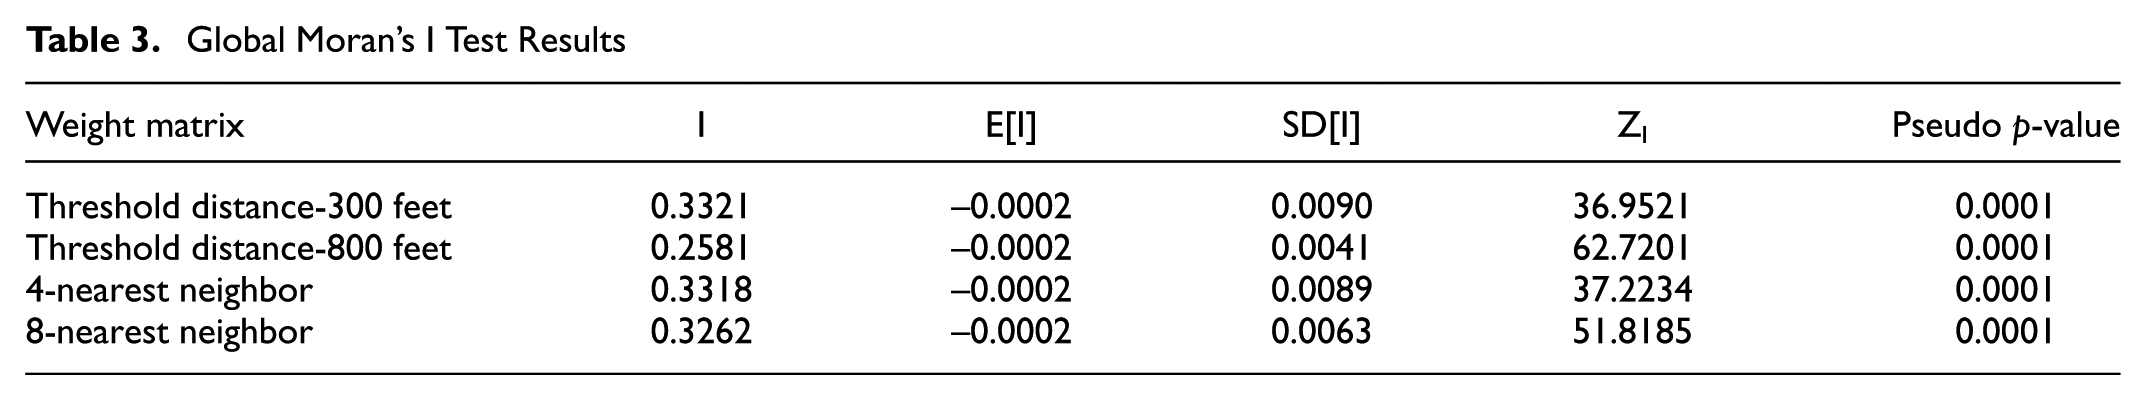
GeoDa ( 34 ), an open-source spatial analysis software, was used to test whether double parking tickets were spatially correlated. The global Moran’s I test was conducted using several weight matrices (threshold distances, k-nearest neighbor) and 9,999 permutations were performed to compute the pseudo p-value. The results of global Moran’s I test are presented in Table 3. All the z-scores are positive and the pseudo p-values are found to be less than 0.05 using different weight matrix. Since the result indicates a strong spatial autocorrelation on double parking tickets, it will lead to biased estimations and unreliable statistical inferences if such spatial dependence is ignored.
Global Moran’s I Test Results
This study also conducted a local spatial autocorrelation analysis based on the local Moran local indicators of spatial association (LISA) (
32
) statistics. While the global Moran’s I measures spatial autocorrelation globally, LISA investigates individual locations and identifies hot spots and cold spots (
34
). Local Moran’s I for the observation

The high–high and low–low locations in the LISA cluster map (Figure 3a) suggest clustering of similar high or low values, whereas high–low and low–high clusters indicate spatial outliers ( 37 ). In this study, low–low spatial clusters, such as Central Park, are cold spots, while high–high clusters, such as the Upper East Side, can be regarded as hotspots for double parking. On the other hand, the LISA significance map is also a good indicator that shows the significance levels of the clusters ( 37 ). Figure 3b shows the significance map using k-nearest neighbor (8 neighbors).
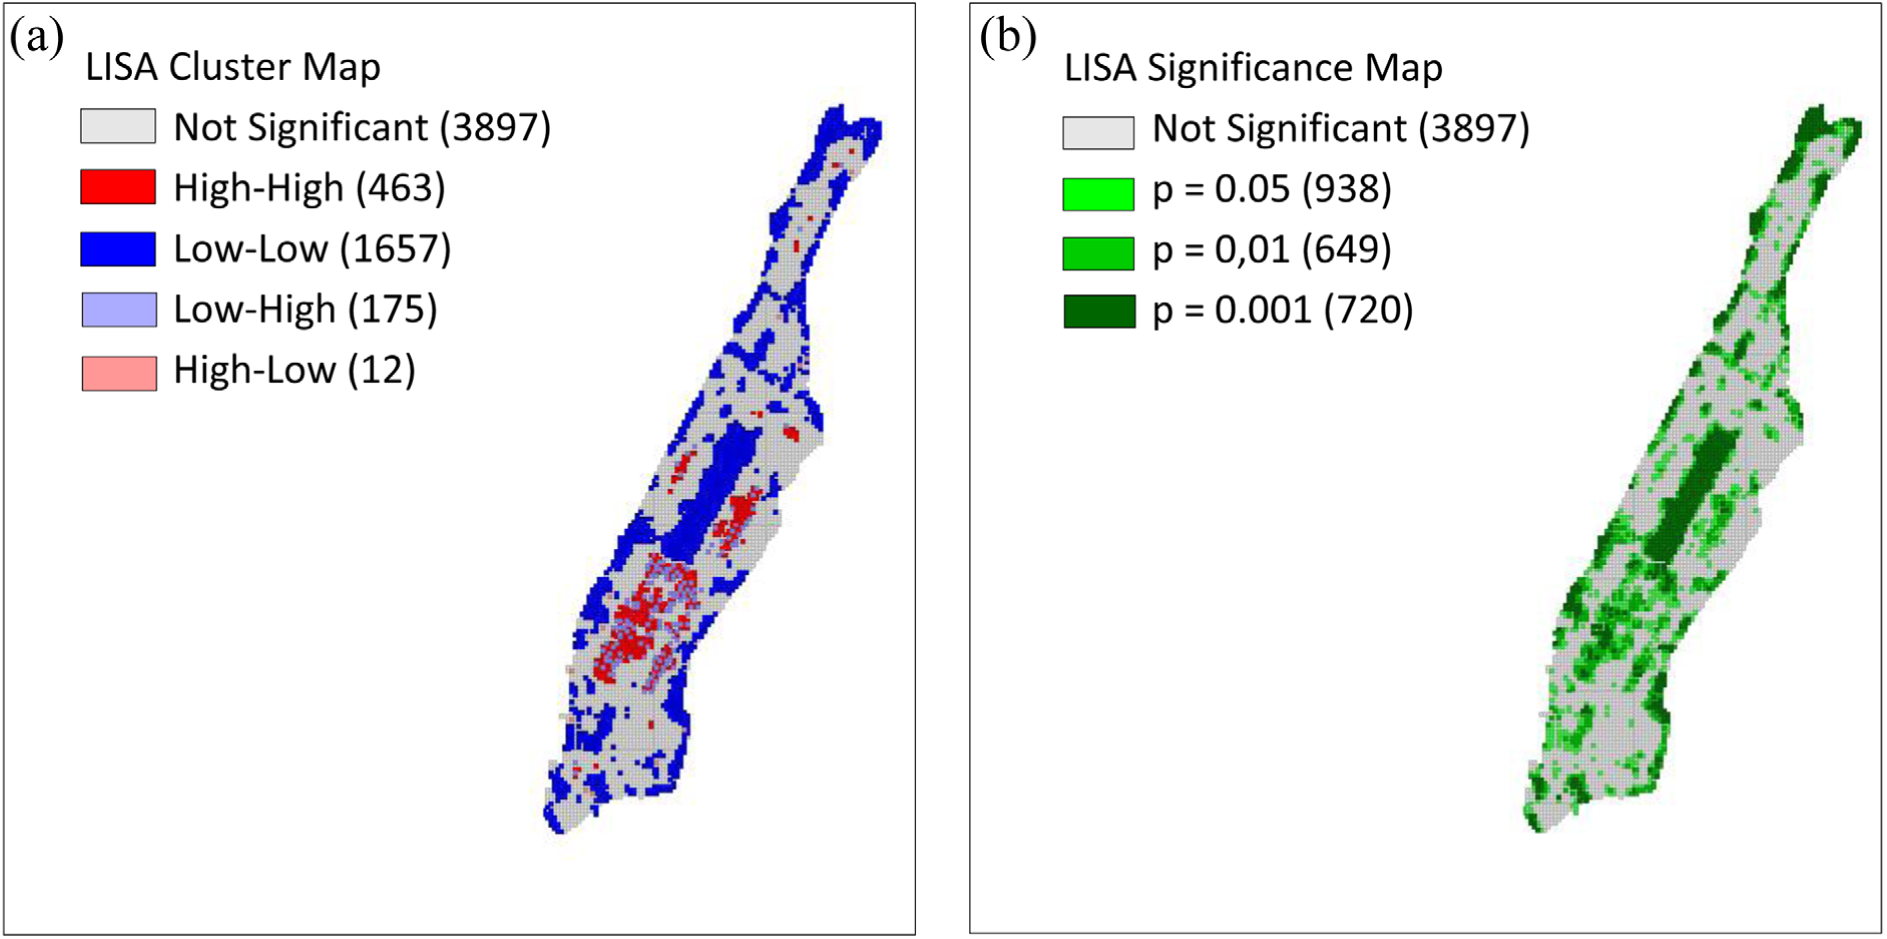
Local indicators of spatial association (LISA) cluster and significance map.
Global and local Moran’s I statistics confirmed that double parking tickets were spatially correlated so that spatial lag and spatial error models in the next section were proposed to account for the spatial dependence of parking tickets to avoid biased estimates.
Model Specification
We assume the spatial dependence identified from the previous section results from two aspects: (i) location-specific differences in features such as traffic, land use type, or population density, and (ii) selection bias due to enforcement activities. The second aspect—selection bias due to enforcement activities—is tested by introducing two new variables that were described in the data preparation section, namely, parking ticket density and police precinct distance. Parking ticket density is assumed to be an indicator of level of enforcement, and police precinct distance is assumed to be an indicator of enforcement coverage. To observe the effect of the selection bias, we keep the variables in the first aspect as control variables, and variables in the second aspect as experimental variables. The number of double parking tickets in each grid cell is used as the dependent variable. Besides a standard linear regression model using OLS estimation by minimizing the sum of squared prediction errors, a spatial error and a spatial lag model are examined since they can account for spatial dependence and unobserved spatial factors. The idea is that if traffic, land use, sociodemographic features, and unobserved spatial factors are controlled, but the two experimental variables still show a strong association with the number of tickets issued, then a selection bias exists in the ticket data.
After diagnosing multicollinearity for the variables using variance inflation factors (VIF) ( 38 ), the same set of control variables were selected for all three models so that valid model comparison can be made. The selected control variables include commercial ratio, hotel distance, restaurant density, total populations, truck ratio, and taxi drop-offs.
In spatial analysis, there are two primary types of spatial dependence: spatial error and spatial lag ( 39 ). The former states that the spatial error terms across different spatial units are correlated. In other words, omitted variables at one location can affect the dependent variable of itself and its neighboring locations ( 8 , 36 ). The latter, spatial lag specification, allows spatial dependence through both spatial error correlation effects and spatial spillover effects ( 8 , 36 ). The spatial error model can be expressed as follows:


where
The spatial lag model accounts for the spatial autocorrelation first, so that classic assumptions in Equation 5 can still be kept for each error in error matrix

where
It should be noted that
Modeling Results, Discussions, and Limitations
Coefficient estimates and statistical indicators, as well as model assessment measures, are reported in Table 4. Considering street resolution and convergence time, the weight matrix with 300-feet distances was used in spatial lag and spatial error models.
Model Results and Assessment
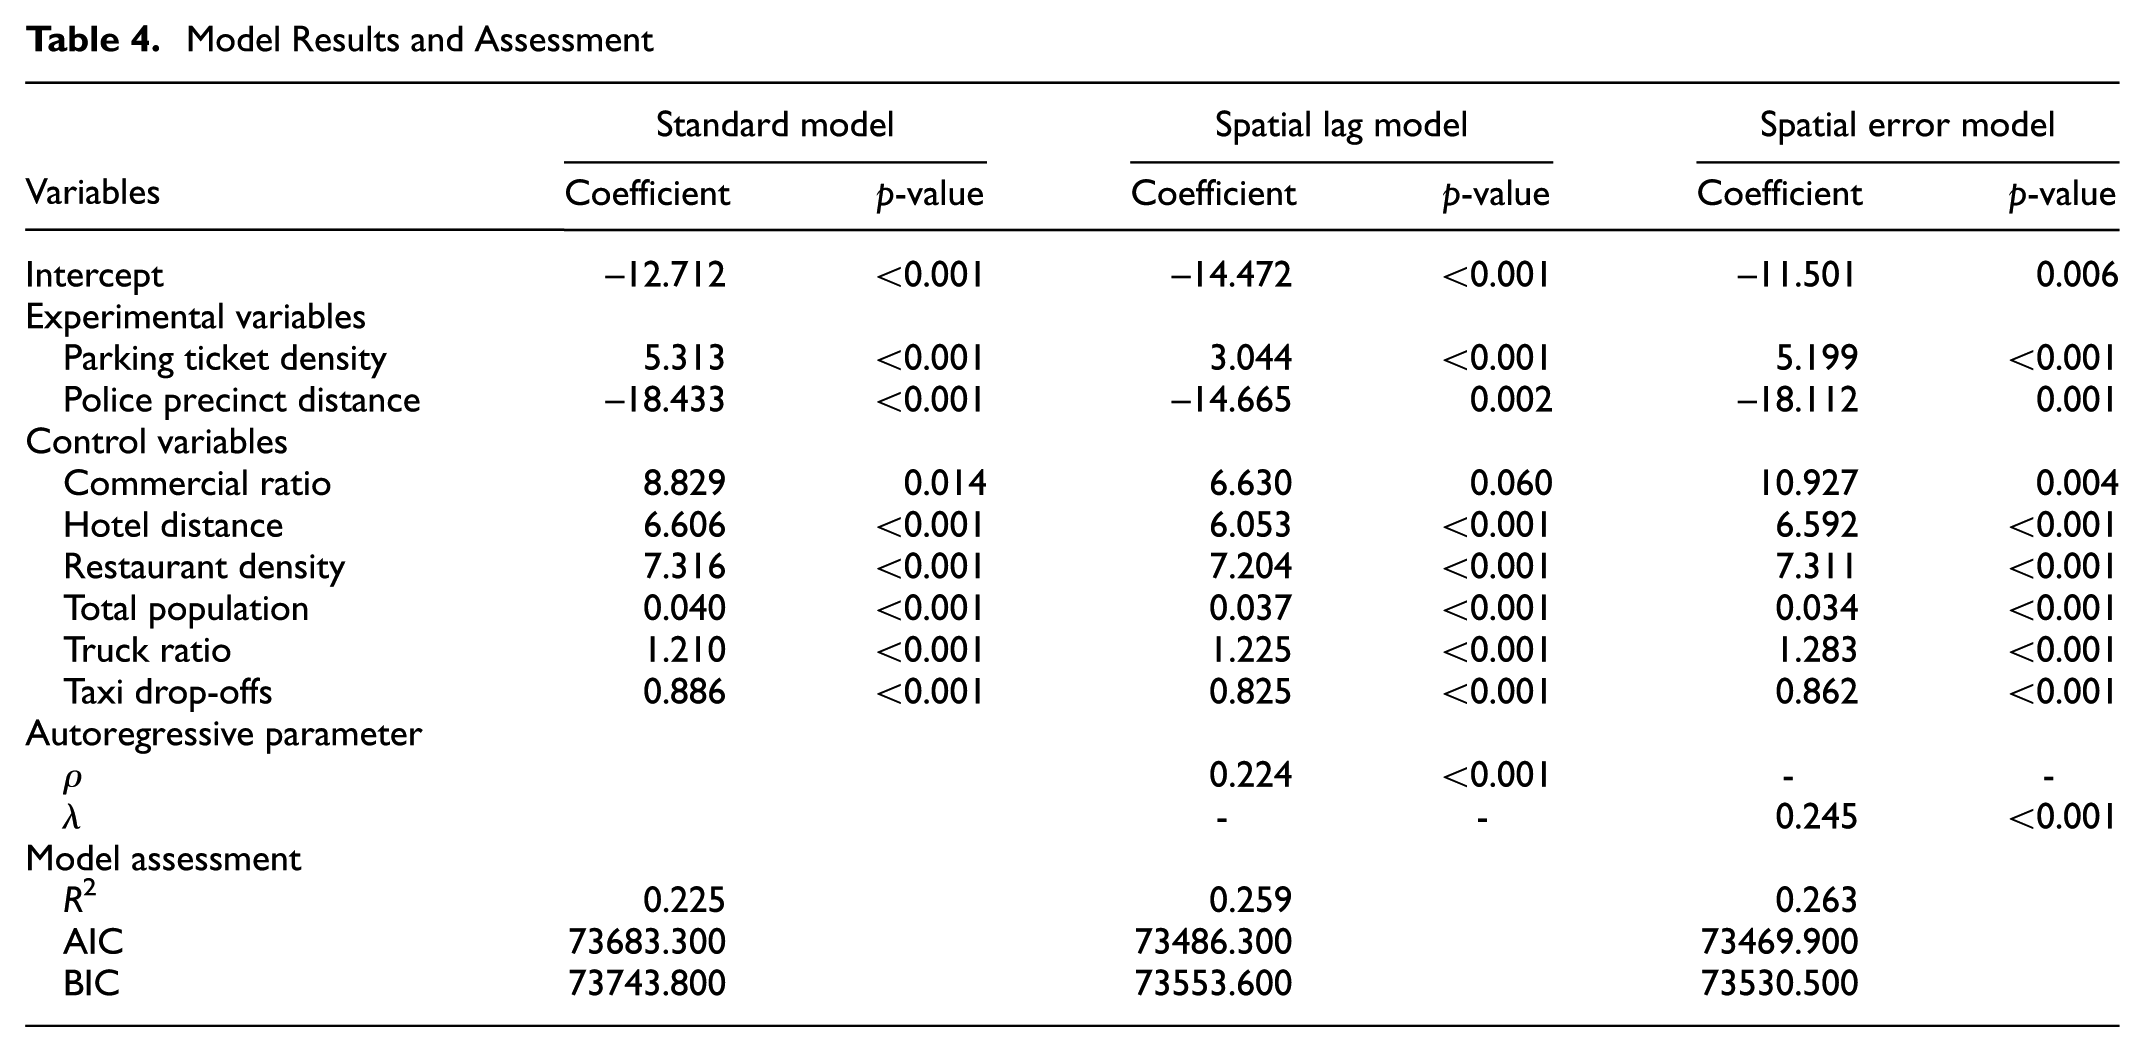
Both spatial models have lower AIC and BIC values, which means they are substantially improved by considering spatial dependence. The autoregressive parameters ρ in the spatial lag model and λ in the spatial error model are highly significant, which provides confirmatory proofs that the double parking citations are spatially correlated. This finding suggests that spatial dependence should always be considered when conducting traffic operation research using parking ticket data. Ignorance of spatial dependence may lead to biased estimates.
Statistic indicator p-value was used to test the significance of experimental variables. Both experimental variables—parking ticket density and police precinct distance—were found to be statistically significant at 95% level (p-values <0.05) in all three models. Parking ticket density, an indicator of level of enforcement, was found to have a positive impact on the number of double parking citations. The distance to the nearest police precinct was confirmed to be negatively associated with number of double parking tickets. In other words, the further away from the police station, the less likely a parking ticket would be issued. It is worth pointing out that the spatial heterogeneity resulting from unobserved factors can be handled by the error term in our spatial models. As land use, transportation, and sociodemographic features are controlled, and unobserved spatial factors are also taken into account in spatial models, both the experimental variables still show a strong correlation with the dependent variable. This indicates that parking tickets are closely related to enforcement intensity, and further confirms the existence of selection bias in parking data.
To further investigate potential characteristics of traffic enforcement, one month of geocoded parking tickets for all types of parking violations (not only limited to double parking tickets) in September 2015 were analyzed. “Issuer code”, which represents a unique code identifying the issuing officer, was used. For the same issuer code, the time sequence and location of issued parking tickets are used as a proxy for the individual officer’s patrol route. In September 2015, 4,589 issuers issued parking tickets, and 68% of issuers issued more than one ticket. Their daily patrol routes covered one (43% of issuers), two (24%), three (18%), and four (10%) police precincts, respectively. Just 5% of the daily patrol routes covered five or more precincts. In this study, 50 issuers were randomly selected and their daily patrol routes were analyzed using GIS tools. The result shows that 80% of the issuers had less than three patrol patterns during the whole month, and 25% of the issuers preferred patrolling on avenues (major streets) to minor streets. Figure 4 demonstrates the patrol pattern of a particular issuer by day in the study month. Three different patterns were found according to the number of police precincts covered. In this study, we did not attempt to correct such bias by quantifying individual behaviors—a quite difficult endeavor. However, on the basis of the currently available data, considerable care must be taken when utilizing citation data due to the selection bias identified in this study.
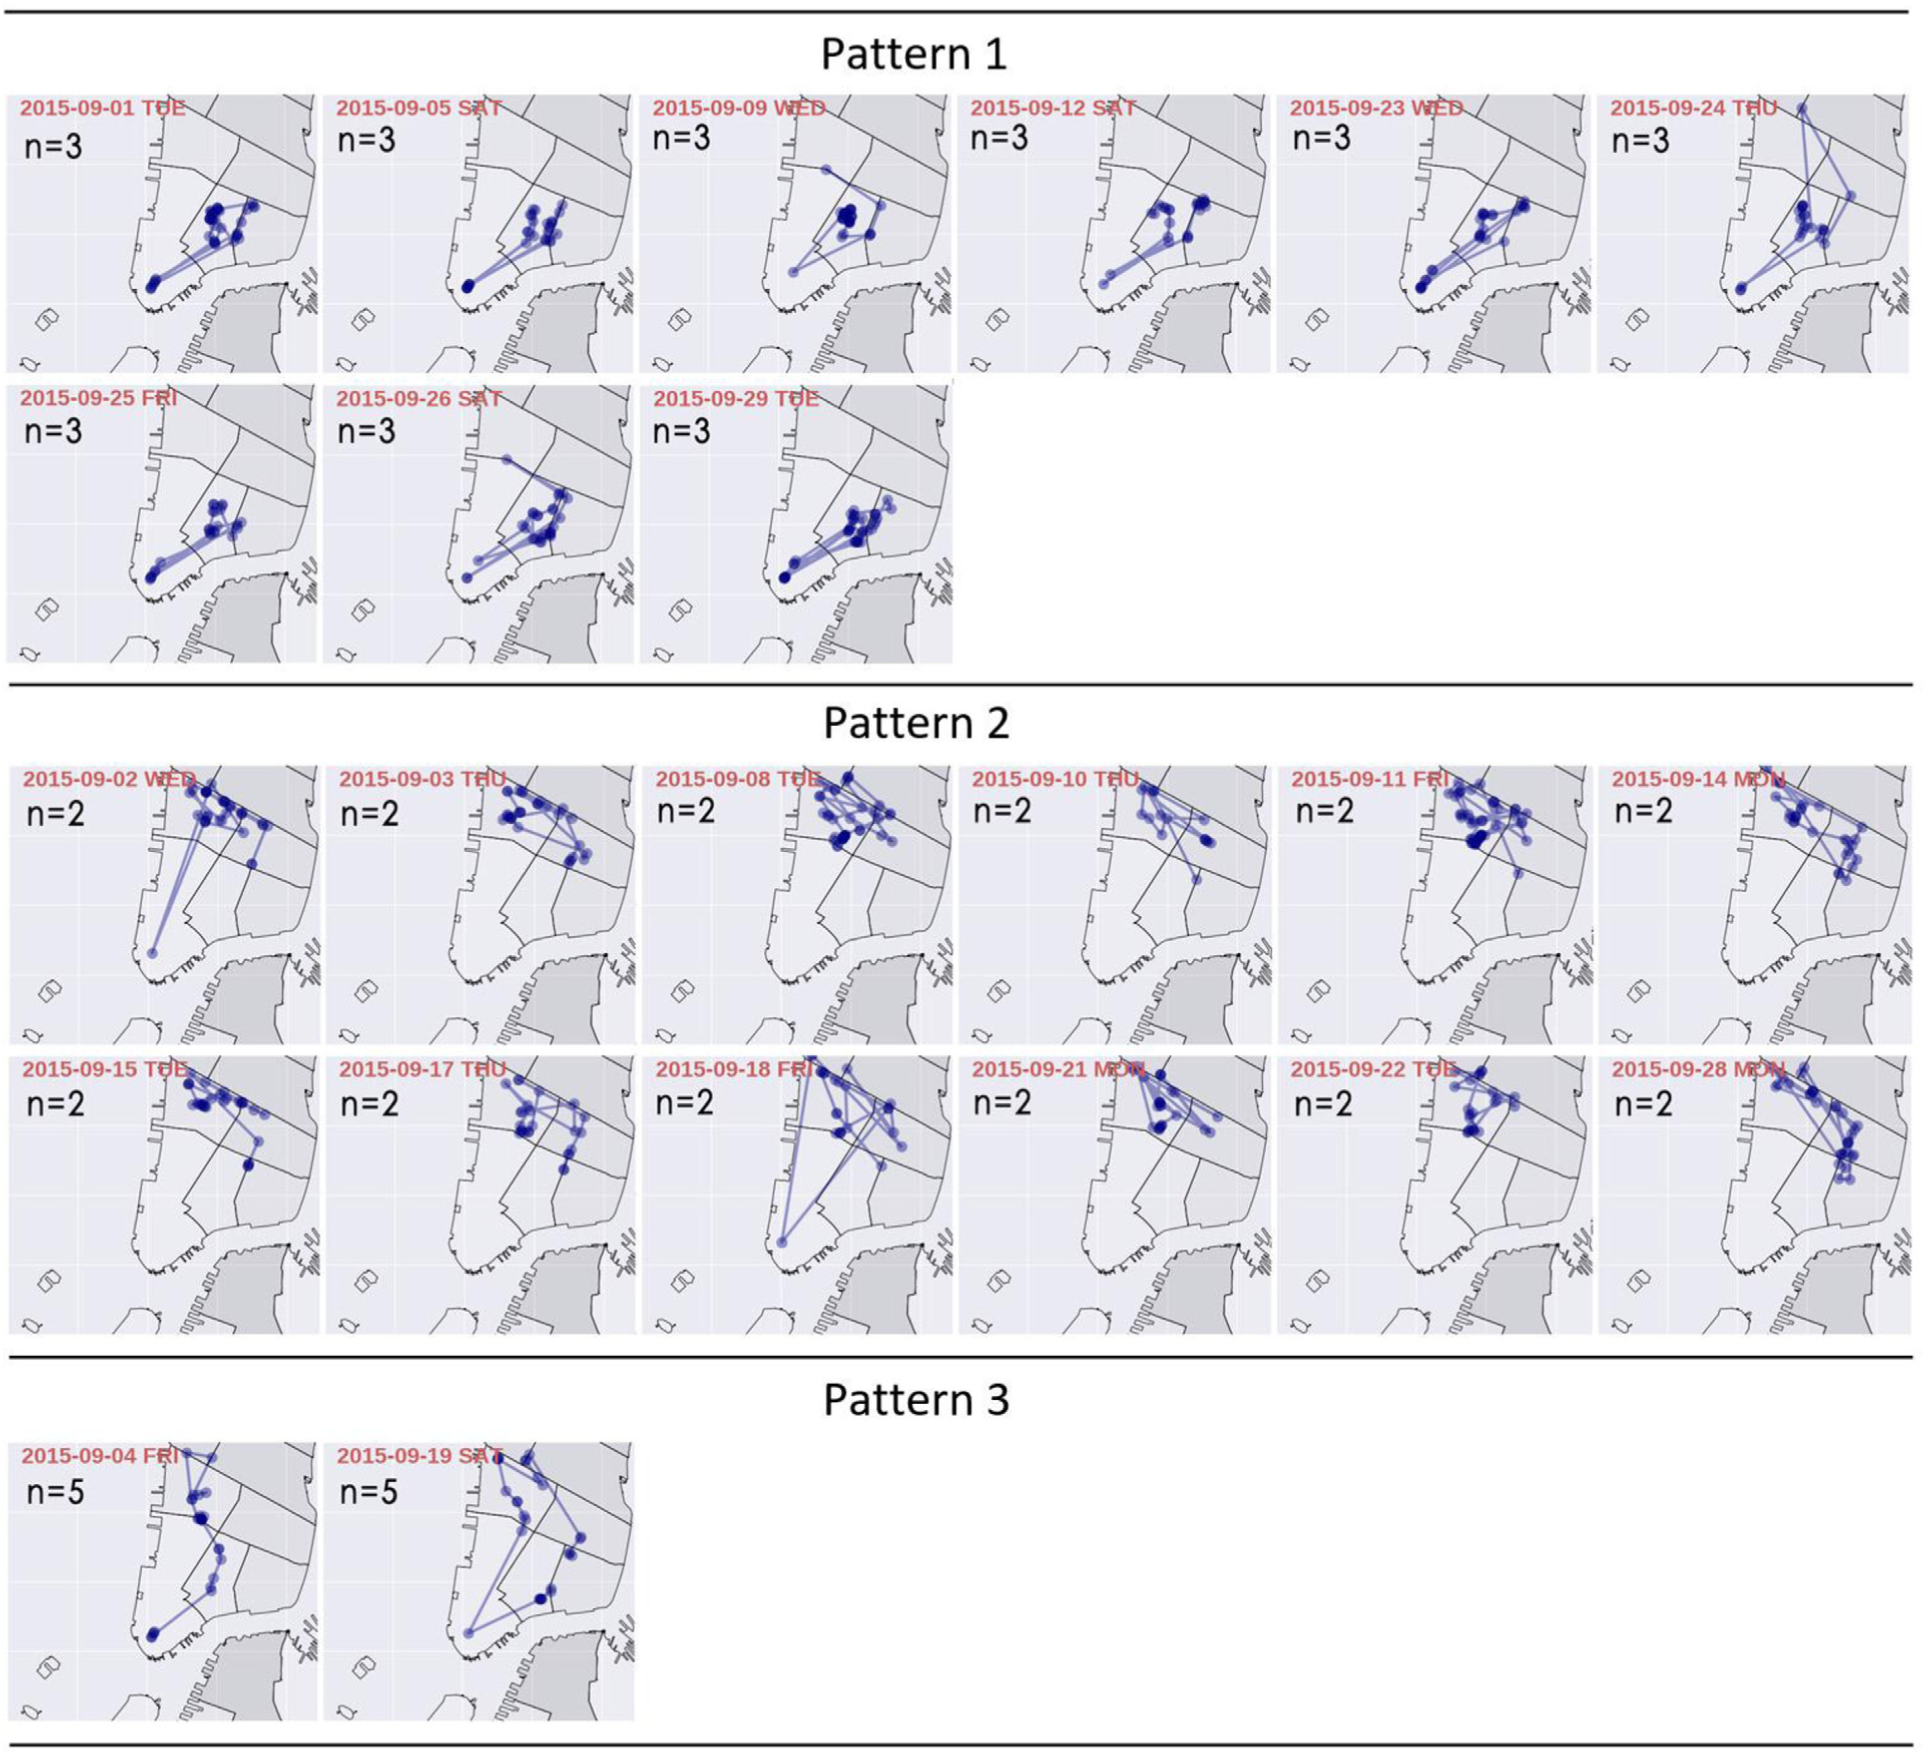
Demonstration of patrol patterns of traffic enforcement officers.
While the goal of the study is achieved, the current approach has limitations. Firstly, the variable “total ticket density” may not be completely true as a proxy of level of enforcement, especially if the study area is extended to other boroughs that have low parking citations in general. Secondly, the spatial models are not capable of accounting for unobserved, non-spatial factors. Unfortunately, unlike the long-studied crime or medical data model, parking models are limited to the available quantitative data. Future research efforts are needed in both data collection and methodology. Once more “unreported” parking data (i.e. identified from traffic cameras) becomes available, methods such as synthetic population-based approach ( 10 ) can be used to acquire a “ground truth” that contains representative samples of parking violations.
Conclusions and Future Work
This paper leveraged extensive data to investigate the spatial dependence of double parking citations via a grid-cell-structured geographic framework and analyzed the existence of selection bias resulting from different levels or coverage of traffic enforcement. Large quantities of real-world data from multiple sources, including parking tickets, land use, place of interest, sociodemographic, enforcement, and transportation were collected and geo-processed. The descriptive analyses of the parking citations show that, although the majority of parking tickets are issued to passenger vehicles, double parking tickets do not follow this general trend. In fact, half of the double parking citations were issued to commercial vehicles. The possible reasons for this finding can be: (a) the lack of parking spaces in a highly congested urban network, (b) the desire of commercial vehicle drivers to park close to the delivery spot, even if no parking space is available, to satisfy their delivery schedule, and (c) a combination of these two and other operational factors.
The global and local Moran’s I statistics were in complete agreement that double parking citations were spatially dependent and such spatial dependence should not be neglected when using citation data. As a result, spatial lag and spatial error models were proposed to account for the spatial dependence of parking tickets to avoid biased estimates.
To investigate whether selection bias exists in issuing parking tickets, the effects of parking ticket density and police precinct distance were estimated while controlling for variables such as commercial area, truck activity, taxi demand, population, hotels, and restaurants. When parking ticket density was used as an indicator of the level of enforcement it was found to have a positive impact on the number of double parking tickets. When police precinct distance is used as an indicator of the enforcement coverage, it was found to be negatively correlated with the number of double parking tickets. Both of the experimental variables were found to be statistically significant, confirming the assumption that a certain selection bias caused by enforcement intensity exists in the parking ticket data. Thus, it is recommended that researchers and policy makers be aware of this bias when using double parking ticket data to develop operational and tactical strategies to address the problem of double parking.
In addition, this study further contributed to the literature by investigating the spatial bias potentially caused by patrol patterns of traffic enforcement. This result highlighted that the majority of issuers have less than three daily patrol patterns in the studied month, and some of them have personal preferences, such as patrolling more on major streets than minor streets. This further underlines the fact that considerable care must be taken when utilizing the citation data. Unfortunately, this kind of bias is challenging to quantify and correct. Machine learning techniques such as unsupervised path clustering and more accurate GPS data collection may be applied as part of future research efforts to quantify the effectiveness of selection bias due to patrolling activities. Investigating passenger vehicle and commercial vehicle citations separately, and examining all types of parking violations, can also be part of the future work.
Footnotes
Acknowledgements
The research work presented in this paper was partially supported by C2SMART Tier 1 University Transportation Center (c2smart.engineering.nyu.edu), and UrbanMITS Lab (![]() ) at New York University.
) at New York University.
Author Contributions
The authors confirm contribution to the paper as follows: study conception and design: Jingqin Gao, Kaan Ozbay, Kun Xie; data collection: Jingqin Gao, Kun Xie; analysis and interpretation of results: Jingqin Gao, Kaan Ozbay, Kun Xie; draft manuscript preparation: Jingqin Gao, Kaan Ozbay, Kun Xie. All authors reviewed the results and approved the final version of the manuscript.
The Standing Committee on Urban Transportation Data and Information Systems (ABJ30) peer-reviewed this paper (18-03899).
The opinions expressed in this paper are those of the authors, who are responsible for the facts set out in the paper. The findings presented in the paper do not represent any official views or policies of any sponsoring agencies.