
Abstract
Resilience is an important characteristic of the transportation system. It reflects the network’s ability to mitigate shocks, provide alternatives, and rapidly recover to a target performance level. Earthquakes can cause the transportation network to experience severe disruptions that significantly reduce network resilience. To prevent long-term closures after earthquakes, the development of innovative approaches for their rapid restoration is necessary. This paper uses the recent developments in accelerated bridge construction (ABC) techniques as a means to enhance the rapid recovery of the system. ABC techniques often come with increased initial construction costs. In most cases, the additional cost is offset by the improvement of the network performance. To examine the efficiency of ABC techniques on the rapid recovery and on the network performance after earthquakes, the direct and indirect costs during the entire recovery period were analyzed and the relationship between network recovery time and network performance was estimated under different construction techniques. Additionally, the effect of using the incentive method to reduce the repair time was studied. The results show that the use of ABC techniques and the incentive method have great potential to minimize the transportation network’s indirect losses, improve network performance, increase the network’s resilience by decreasing recovery time, and justify the additional initial costs associated with these techniques.
For society to function properly, it is essential to maintain the transportation infrastructure at high performance levels. Major disruption to the functionality of the network can lead to detrimental effects to the surrounding community. Seismic events can severely damage different components of the network, result in closures, and hamper access for emergency vehicles and the distribution of goods, and affect everyday community activities. For these reasons, it is paramount for transportation networks to remain functional or rapidly return to acceptable levels of functionality after a seismic event.
To date, there is neither a common agreement within the research community about the definition of resilience nor an agreed-upon measurement system for resilience ( 1 – 4 ). Brunaeu et al. defined resilience as the reduction in (1) probability of failure, (2) consequences from failures, and (3) recovery time ( 5 ). Based on this, four dimensions of resilience were defined: robustness, redundancy, resourcefulness, and rapidity (R4). Robustness is the ability of the structure or network to endure stresses and ensure minimal loss; redundancy is the ability to provide alternative routes to compensate for the decrease in a network’s capacity; resourcefulness is the ability prioritize restoration actions and to identify an action depending on the resources available; rapidity is the speed at which recovery can reach a target value.
Although resilience is a multi-dimensional property, most of the studies to date have focused primarily on robustness. This includes multitudes of approaches to bolster bridges against earthquakes. However, it is impractical to strengthen every part of a network due to the wide array of possible events (both intensity and frequency) and limited budgetary resources ( 6 , 7 ). Couple that with the sheer size of the transportation network and it becomes evident that transportation agencies must tolerate some failure in the system and plan for faster recovery to achieve enhanced resiliency. With continued recognition of the value of recovery, methods are required that allow for the rapid recovery of the transportation system. Considering that bridges are thought to be the most vulnerable components of the transportation system in seismic events, one aspect of recovery could be focused on the development of techniques that would result in the faster restoration of damaged bridges.
Accelerated bridge construction (ABC) is a construction technique that reduces onsite construction time when building new or replacing old bridges ( 8 ). ABC techniques can be categorized as foundation and wall elements, rapid embankment constructions, prefabricated bridge element and systems (PBES), self-propelled modular transporters, slide-in constructions, longitudinal launching, horizontal sliding or skidding, and fast-tracked contracting. ABC techniques combined with the “A” + “B” (bid items + critical duration) bidding method ( 9 ) may contribute to shorter duration of restoration activities. “A” means to minimize bridge repair costs, and “B” aims to reduce and control bridge closure time. Though effective, ABC techniques and the incentive method are costly and ABC techniques cannot universally be applied to every bridge type because of the technical limitations on prefabrication and onsite construction. Therefore, a holistic network-level analysis is required to implement ABC techniques properly throughout the network to decrease the recovery time. To measure the efficiency of the aforementioned accelerated recovery techniques, the time to reach a target threshold was defined as a measure of resilience. At the same time, a series of techniques (i.e., ABC, Incentives, ABC+Incentives) that could potentially speed up the restoration processes was simulated, and performance measures such as travel delay and opportunity loss were used to evaluate the effectiveness of the proposed techniques in enhancing resilience of the system.
Focusing on earthquakes as the extreme events to be considered, there are different aspects that need to be contemplated for the risk and consequence analysis: earthquakes vary spatially in intensity and frequency, the effects they have on different infrastructure components are different, and there are dependencies between the loads that adjacent components experience. For large infrastructure systems that are regionally distributed, the loading intensity needs to be characterized at a great number of locations. Researchers have used seismic risk analysis to describe the degree of damage that could occur after an earthquake ( 10 – 13 ). For example, Werner et al. developed REDARS software for seismic risk analysis ( 14 ). In addition to seismic risk analysis, several research efforts have focused on designing efficient retrofit strategies before disasters to enhance network resilience through enhancing robustness ( 15 – 17 ). A few studies have focused on measuring network resilience using topology-based approaches and assessing post-event losses during the recovery time ( 18 – 22 ).
In each of the listed research areas, appropriate performance measures must be employed to evaluate the post-event functionality of the network and identify the required recovery strategies. Three commonly used measures are flow capacity, travel time, and network connectivity. Flow capacity is independent of origin–destination (O-D) data or the behavior of drivers, and can be used to directly quantify the extent of damage to the network after an earthquake. This measure represents the largest possible flow between the origin and destination nodes without exceeding the capacity of corresponding links. Travel time is another functionality measure that has been widely employed to estimate the performance level of a damaged network. The calculation of this measure requires O-D data, which can be accessed from surveys or mathematical models. The third functionality measure is network connectivity, which can be defined as the ability to get from one node to another. The connectivity measure is mostly suitable for immediate post-earthquake emergency response and disregards network capacity, travel time, and trip length.
Any disruption in the functionality of the network may hinder economic activities in the region and result in socio-economic losses. Indirect losses, such as those related to excessive traffic delay and opportunity loss ( 19 ), are more difficult to estimate compared with direct losses due to bridge damage. Furthermore, the state of the system after an earthquake changes over time as the restoration strategies are implemented. Although losses caused by delays are relatively simple to calculate based on the value of time assigned to each of the constituents, losses due to the constraints that affect traffic flow are more complicated to quantify. For instance, loss of accessibility could create problems for employees and may result in loss of productivity and increased overheads. Such impacts are more noticeable when an earthquake occurs in industrial or urban areas.
In the current study, the bridge/road network of the San Francisco Bay Area was developed: the bridges were assigned to different categories, and their vulnerability was measured through fragility functions. A specific scenario earthquake event was considered, and the distribution of seismic intensity was measured at the bridge locations. Damage to the bridges was translated into loss of functionality of the links. A traffic analysis model was established to quantify the direct and indirect costs including drivers’ delay and opportunity loss. Considering the direct impact of the closure durations on the indirect costs of the project, application of accelerated construction techniques such as ABC and innovative contracting methods (such as incentives) were used to enhance the speed of recovery. Network performance and costs with and without ABC techniques or the innovative contracting method were compared.
Fragility Analysis of the Components of the Test Bed Network
To demonstrate the capabilities of the developed approach, the San Francisco Bay Area network was tested. This area has high seismicity, a large population, and high dependency on the transportation network. The San Andreas Fault and the Hayward Fault are located in the region and have been the source of historical earthquakes that have resulted in damage to the transportation network. In the current study, an earthquake on Hayward Fault was simulated. Figure 1 shows the locations of the faults with respect to the highways and bridges in the test bed. This earthquake scenario was chosen to present the methodology framework. For a satisfactory decision-making process, a suite of earthquakes in the target region should be considered. The earthquake in the current case spread through the Hayward Fault and resulted in different levels of seismic intensities at the bridges’ locations. The peak ground acceleration (PGA) is the intensity measure at the location of the bridges (Equation 1):
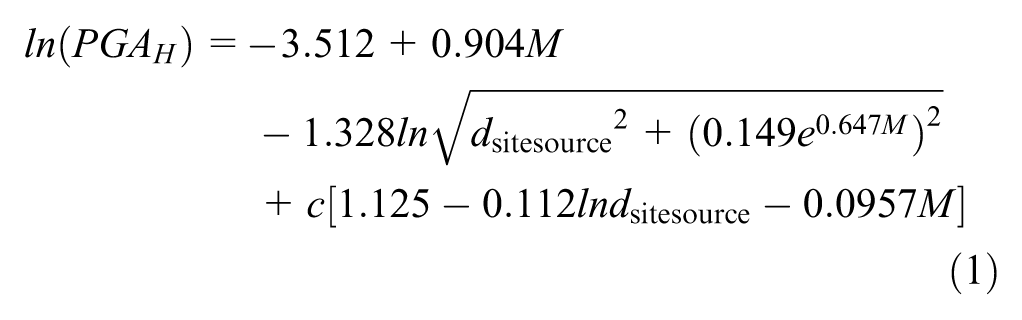
where PGAH is the peak ground acceleration on horizontal direction; the

where
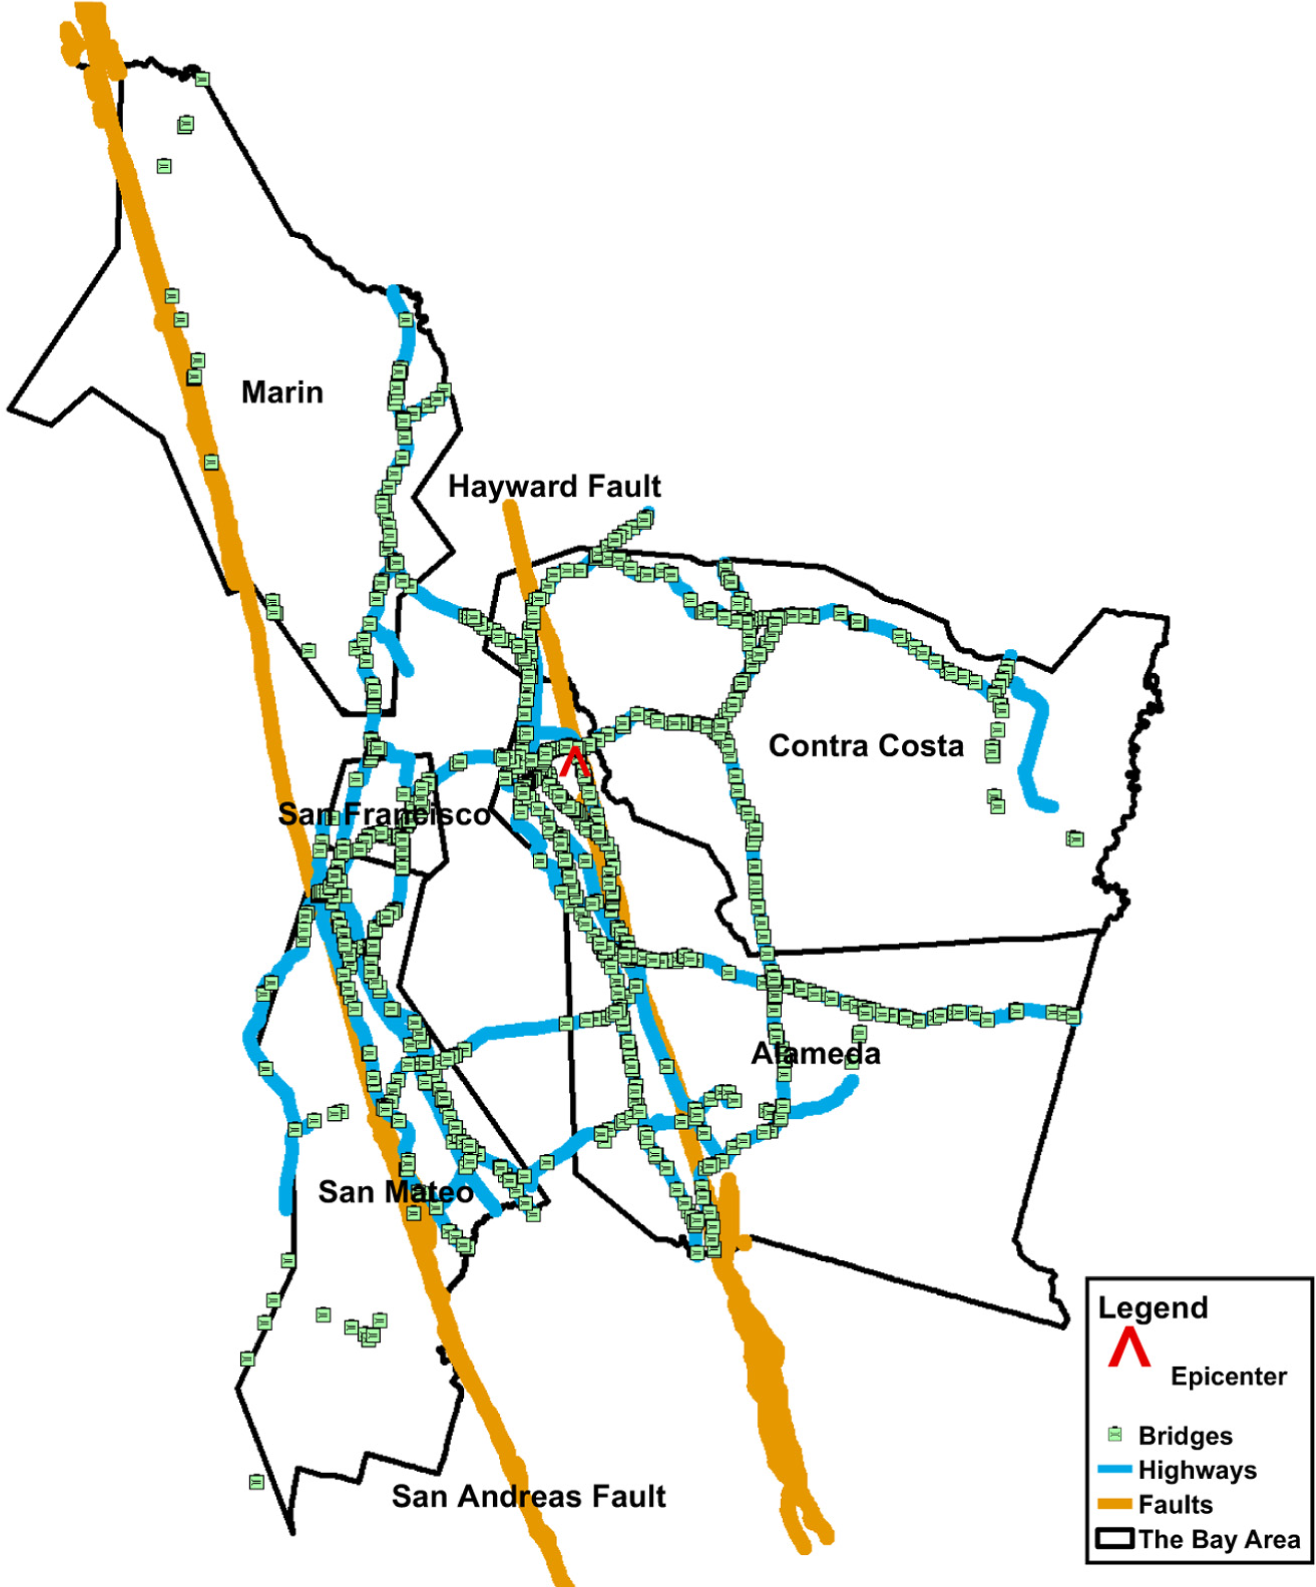
Map of San Francisco Bay Area with the two major faults and location of bridges and highways.
Using Equation 1, the seismic intensity measures were estimated at each bridge’s location. The fragility estimates were then used to evaluate the extent of the damage to the bridges. Fragility curves present the cumulative probabilities of failures as a function of the ground motion intensity (PGA) (Equation 3) ( 23 – 25 ):
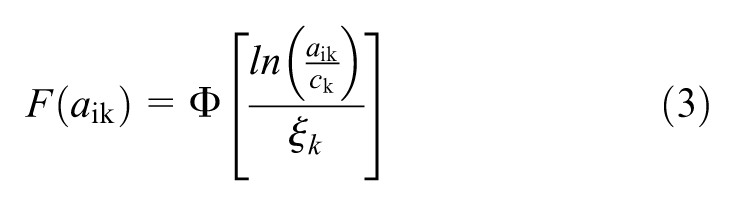
where F(aik) is the cumulative probability of bridge i under damage state k; Φ is the standardized log-normal cumulative distribution function;
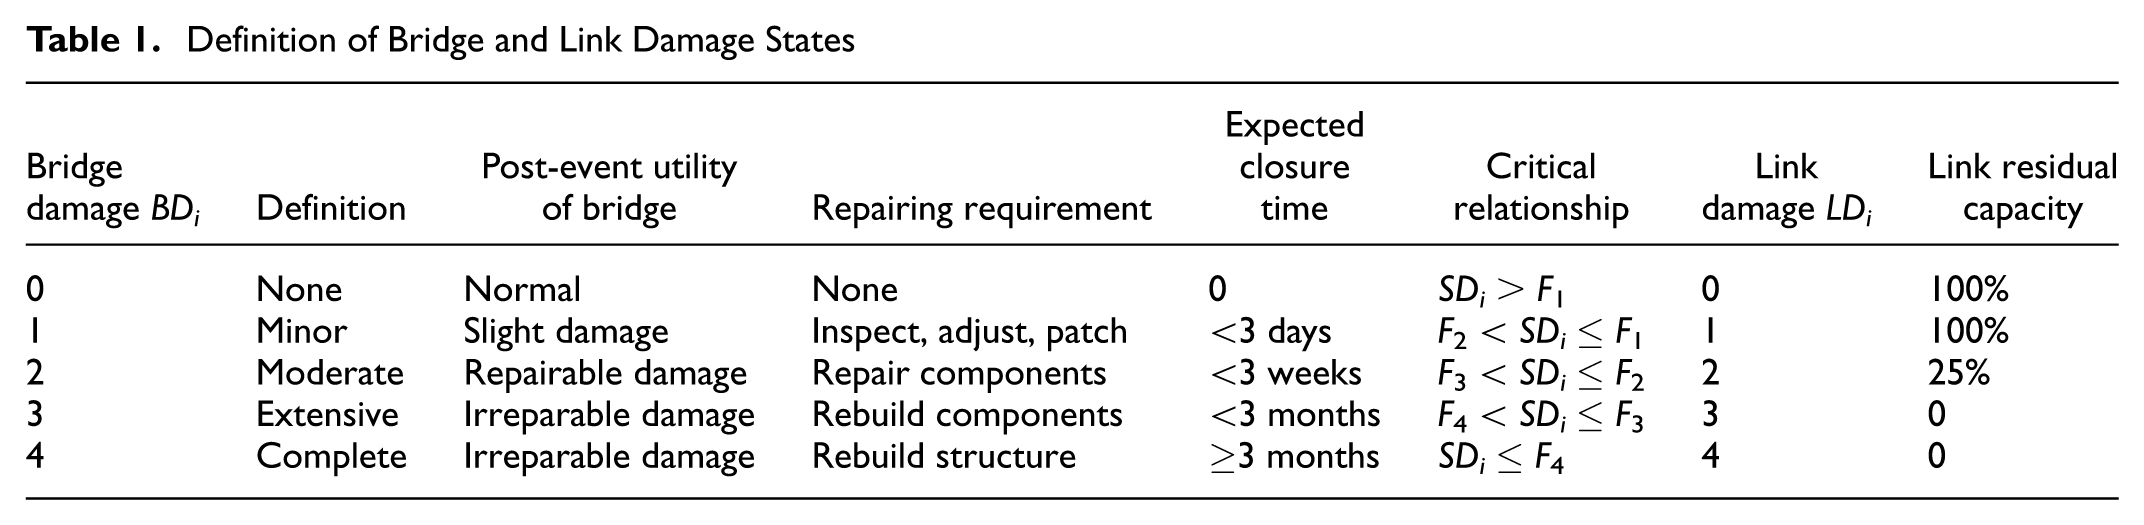
The definition of the damage states was extracted from the HAZUS-MH (2012) ( 26 ) and is categorized as no damage, minor, moderate, extensive, and complete damage. When a bridge can potentially be damaged (SDi) with a specific PGAH value, the bridge damage state BDi can be predicted based on the relationships in Table 1. Here F1, F2, F3, and F4 are values from the fragility curve at the PGAH value point, representing the lower and upper bounds of the variable damage states. Bridges are sensitive to ground motion and are usually the most seriously disrupted elements of the transportation networks. The link damage state, LDi, is defined as being equal to the damage state of the worst damaged bridge on the link.
Definition of Bridge and Link Damage States
Network-Level Assessment
The network analysis method used in the current study is based on the four step model ( 27 ). It provides an algorithm to determine the equilibrium of traffic flows in the network, and consists of four steps: trip generation, trip distribution, mode choice, and trip assignment. To calculate the trip rate for a specific trip purpose, the gravity model and the reduction model were considered ( 27 , 28 ). The developed model in this paper is dynamic as it considers the travel fluctuations in the post-event travel demand. This is because after a major earthquake some travelers forgo their trips, due to a multitude of reasons such as extensive damage to the transportation network and buildings that house different activities. To make the travel demands more representative after an earthquake, Shinozuka et al. generated a relationship between the intensity of the seismic event and a reduction rate that could be applied on trip distribution to estimate the O-D data after earthquakes ( 28 ). Equations 4 and 5 are introduced to provide for reduced traffic demands:
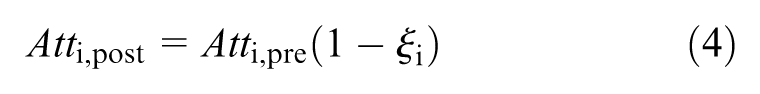

where Atti,post, and Proi,post are the post-event reduced trip attraction and production from node i; Atti,pre and Proi,pre are the original trip attraction and production from node i; and ξi and ξi′ are the reduction rates based on the intensity of the earthquake experienced at each node.
Figure 2 presents the procedure used for the network analysis.
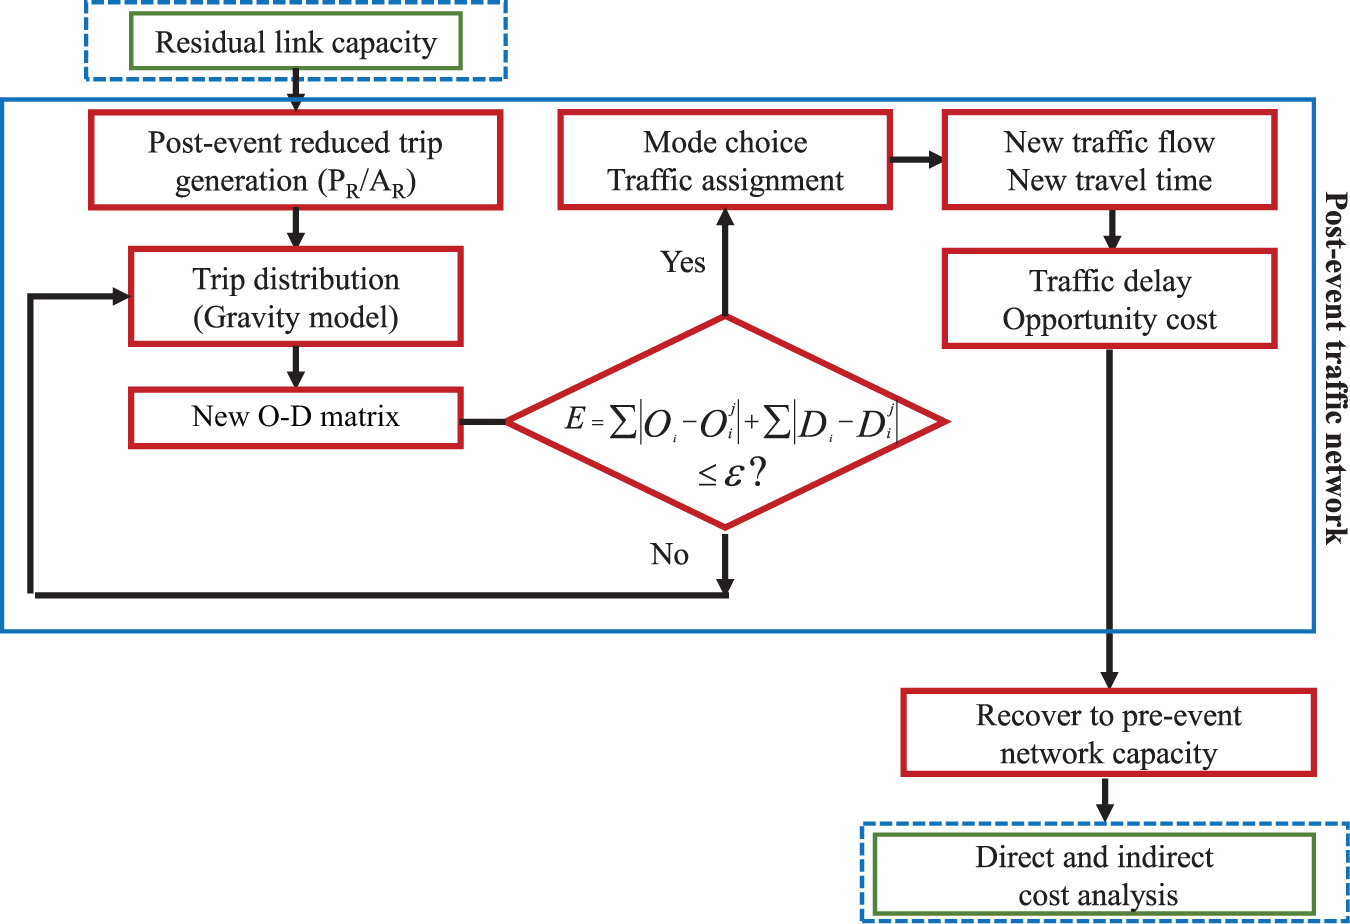
Post-event traffic network model.
It is assumed that network repairs start right after the occurrence of earthquakes. As the bridges are restored, the link capacities and traffic demands increase. Because of these dynamic traffic characteristics, the transportation analysis model needs to be run repeatedly in set time-frames until the whole network is restored to a target functionality level. The target functionality in this study is considered as 100% restoration of service in the network.
Network Performance Measures
The consequences of network disruption can be (a) the direct costs associated with the replacement of an asset (assuming that the downtime is negligible), (b) the indirect costs to the users of the affected asset (such as increased travel time or longer detours in medium-range downtime), or even (c) the economic costs to society given a longer duration of disruption in a transportation system serving a community (for cases in which downtime is extended). The direct costs consist of conventional construction costs, the additional cost of ABC techniques, and the cost of the incentive method (Equation 6). The indirect cost consists of the traffic delay and the opportunity cost (equations 7 to 9):

where
If any ABC technique is adopted, Z1 = 1, otherwise Z1 = 0. If the incentive method is applied, Z2 = 1, otherwise Z2 = 0:

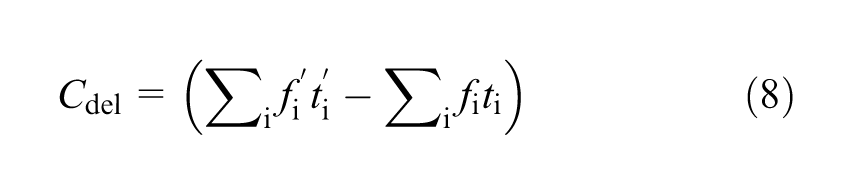
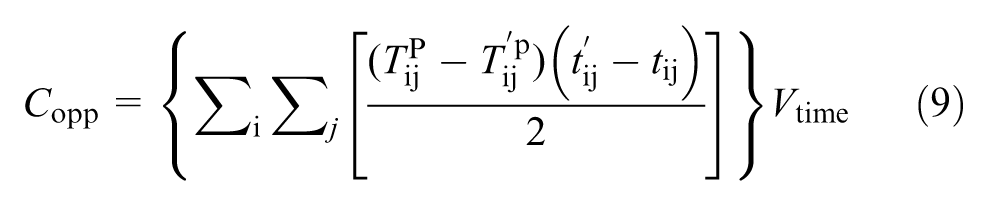
where
The use of ABC techniques for recovery is limited to the critical bridges that experience high levels of damage and cause the worst traffic cost after earthquakes. There are many network characteristics in graph theory such as node degree, average shortest path, and clustering coefficient that could be used to prioritize nodes or subgraphs. In this study betweenness centrality was used to rank the most important elements in a network system ( 29 ):
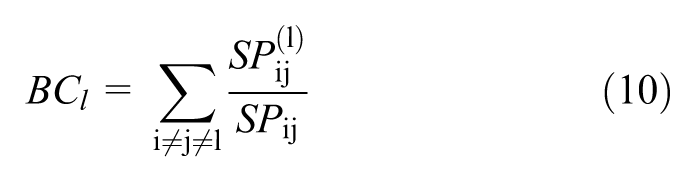
where
Network performance during the recovery time is evaluated by the residual percentage of the network performance. Loss is defined as the ratio of the total traffic cost to the initial total vehicle hours traveled (VHT) of the network system (Equation 11):
where
To present the post-event network performance and the recovery condition through using ABC techniques and the incentive method, the current paper simulated four bridge repair strategies: conventional construction (Conventional), using ABC techniques for the top 30% of the most critical bridges (0.3ABC), using incentives on the top 30% of the most critical bridges (0.3Incentive) and using both ABC techniques and the incentive method for the top 30% of the most critical bridges (0.3ABC+0.3Incentive). Additionally, the conventional scenario means the network is repaired using conventional construction techniques. Incentivization means the contractor is rewarded if projects are finished ahead of schedule and penalized if any delays take place.
Results and Discussion
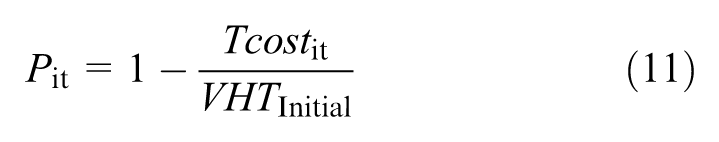
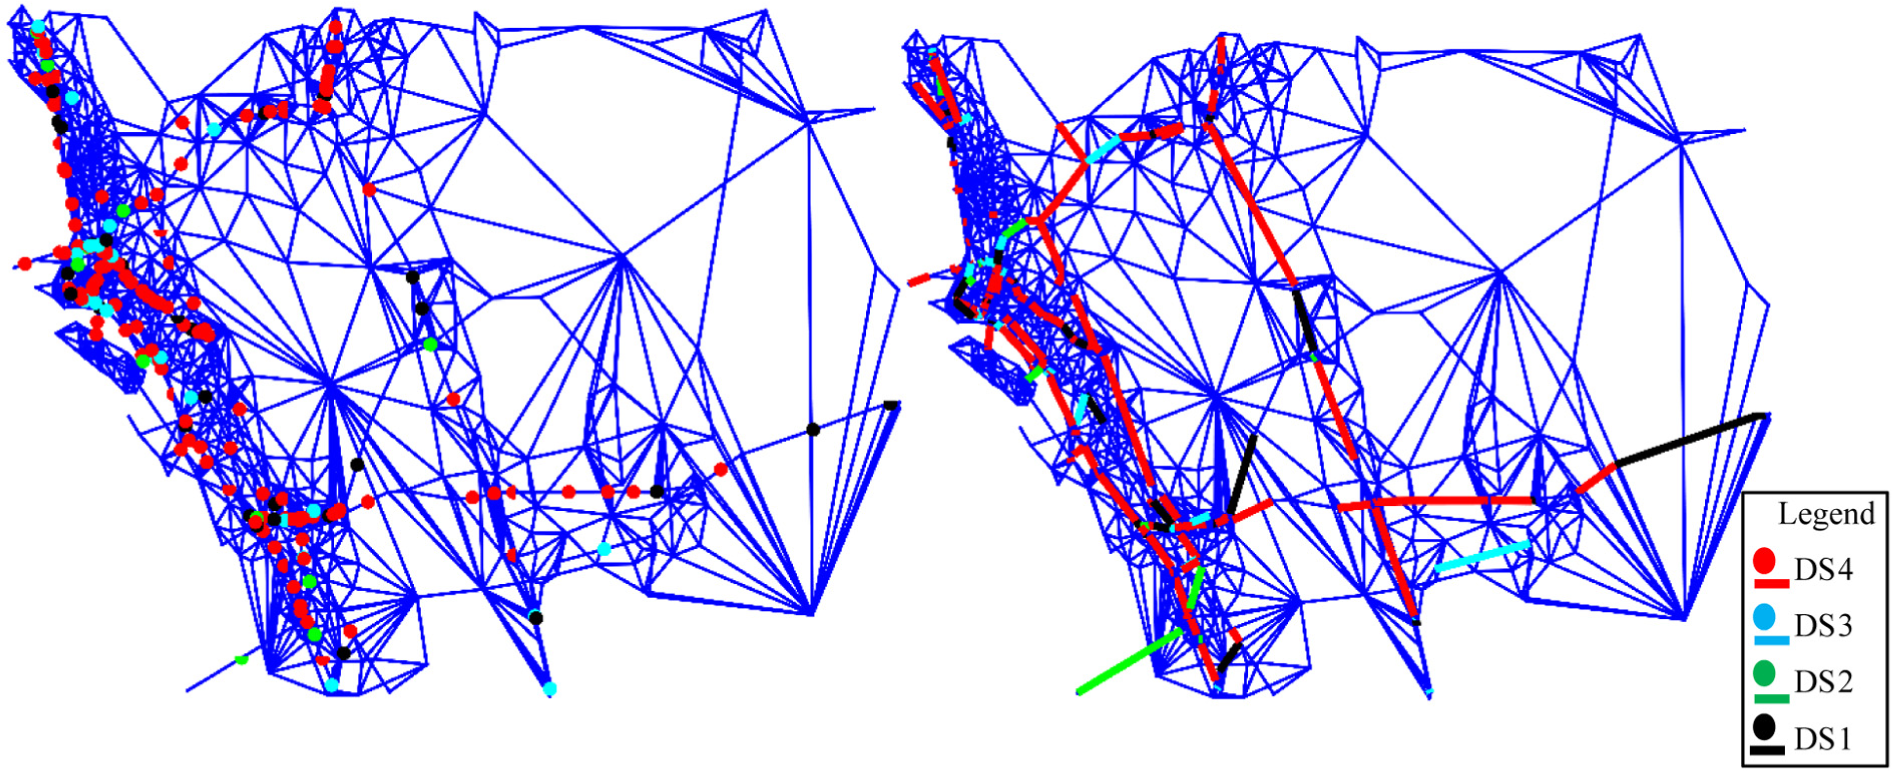
Under an earthquake with a moment magnitude of 7.5, the level of intensity measures were estimated at each bridge’s location. By comparing these values with the bridges’ fragility curves, the bridge and link damage states were calculated. Figure 3 shows the state of damage in the bridges and links under one of the simulations. After the earthquake and before the initiation of the restoration processes, the average number of bridges in damage state 4 (DS4) and 3 (DS3) was 575 and 89, respectively. As the restoration of bridges takes place, the number of damaged bridges decreases until the network is fully recovered. Figure 4 shows the recovery process for the bridges in different damage states and for the bridges in DS4 under different scenarios of recovery. With the implementation of ABC techniques and the incentive method, the number of damaged bridges in DS4 decreases at a faster rate.
Bridge (left) and link damage (right) states after earthquake.
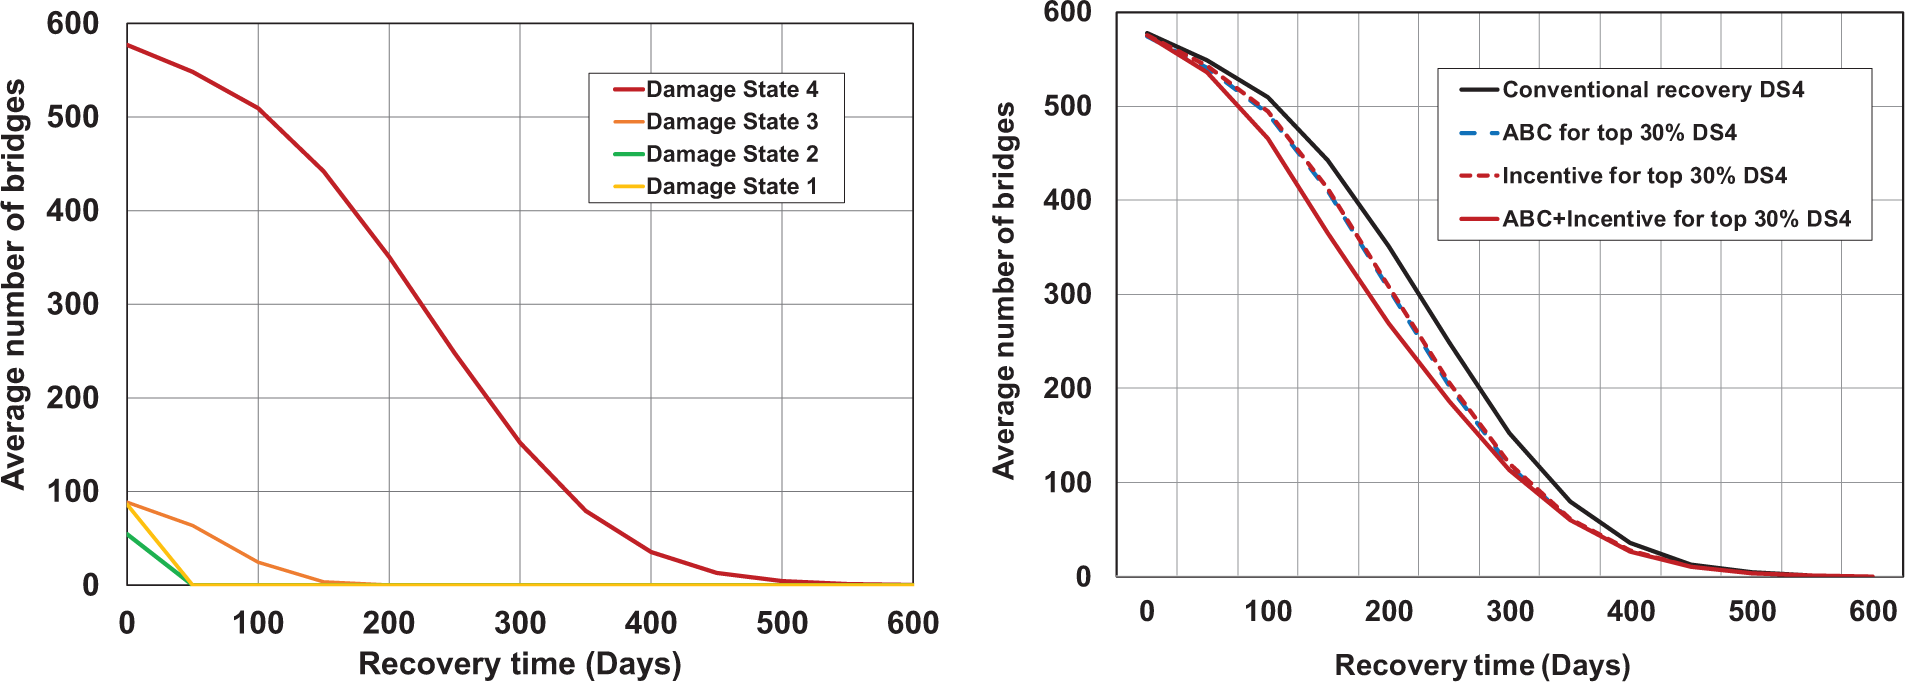
Number of bridges in each damage state (left) and under different recovery scenarios (right) as restoration takes place.
According to the California Department of Transportation ( 30 ), the additional construction cost of ABC techniques is approximately 30% of the initial construction cost. The incentive cost varies depending on the bridge types and the construction company. Therefore, the total direct cost of each scenario should be the sum of conventional construction costs, the additional cost of implementing ABC techniques, and the cost of incentives. The total direct cost for conventional construction and the scenario using ABC techniques and incentives on the top 30% of bridges ranges from $1,363.7 million to $1,614.5 million. Figure 5 shows the state of damage in bridges and links 200 days and 400 days after start of the recovery process.
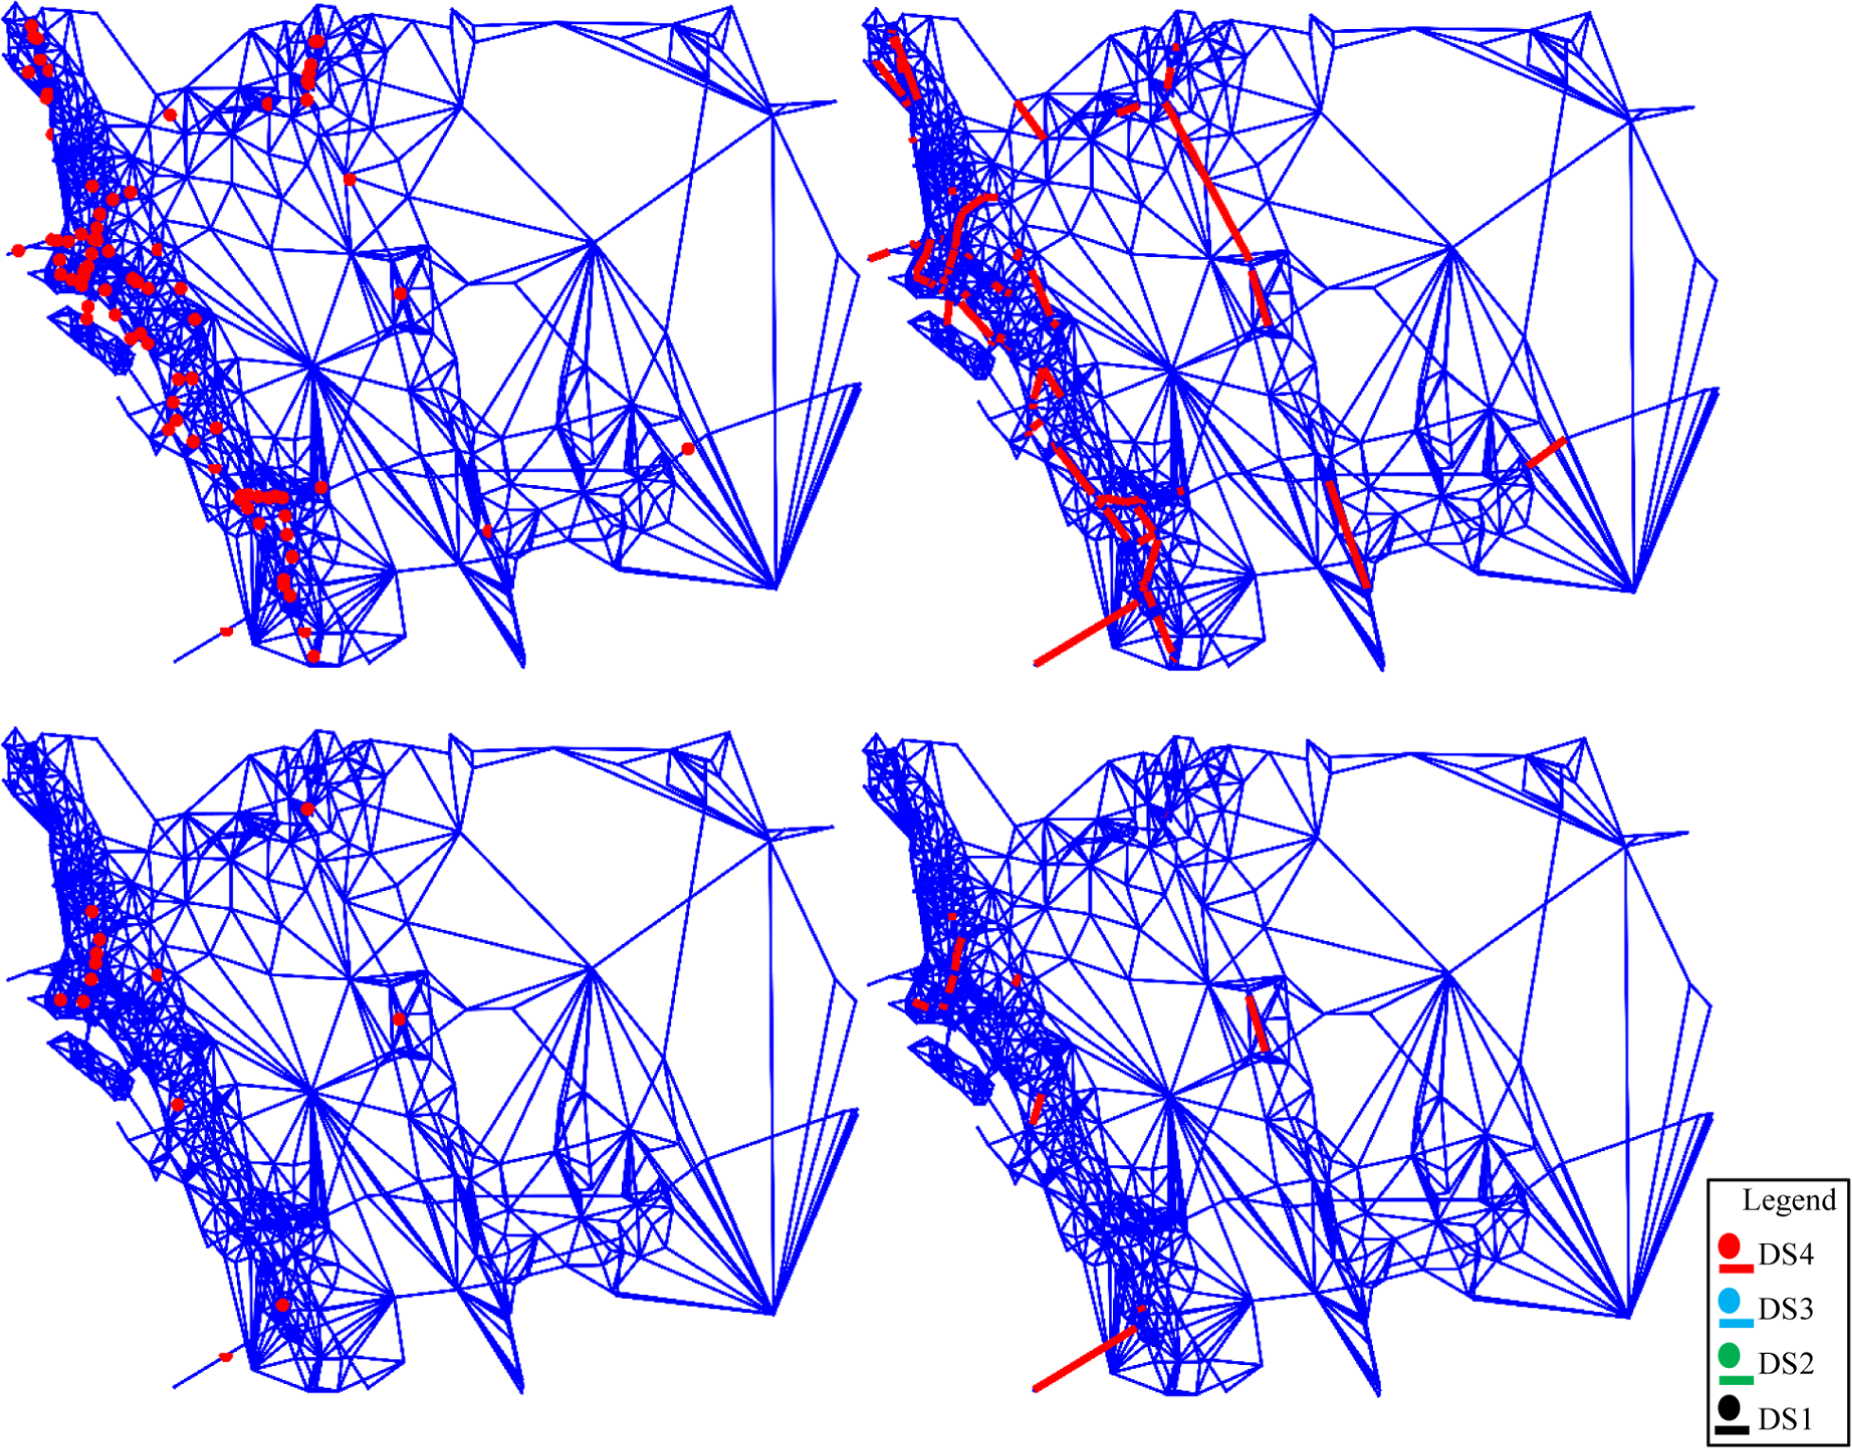
Bridge and link damage states at 200 days (top) and 400 days (bottom) after the start of recovery.
Figure 6 shows the continuous network performance improvement during the recovery time. Immediately after the earthquake, the network is heavily damaged and loses nearly 75% of its performance. Using the ABC techniques and the incentive method, the network performance recovers faster than the one with conventional techniques. Additionally, Figure 6 shows that conventional construction techniques require 375 days to achieve a 90% network performance. Though using both ABC and incentives for the top 30% of bridges takes less than 280 days. The time that is saved through the recovery process helps decrease the indirect costs associated with the network closures. Figure 7 presents the data for direct, indirect, and total costs for the different scenarios.
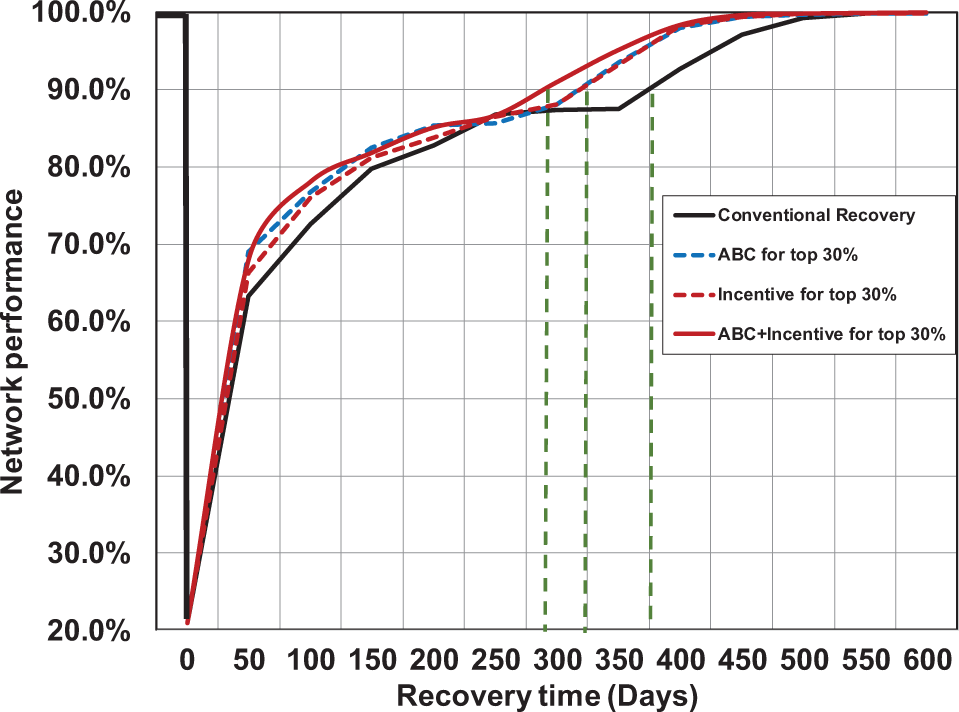
Network performance during recovery process with different repair strategies.
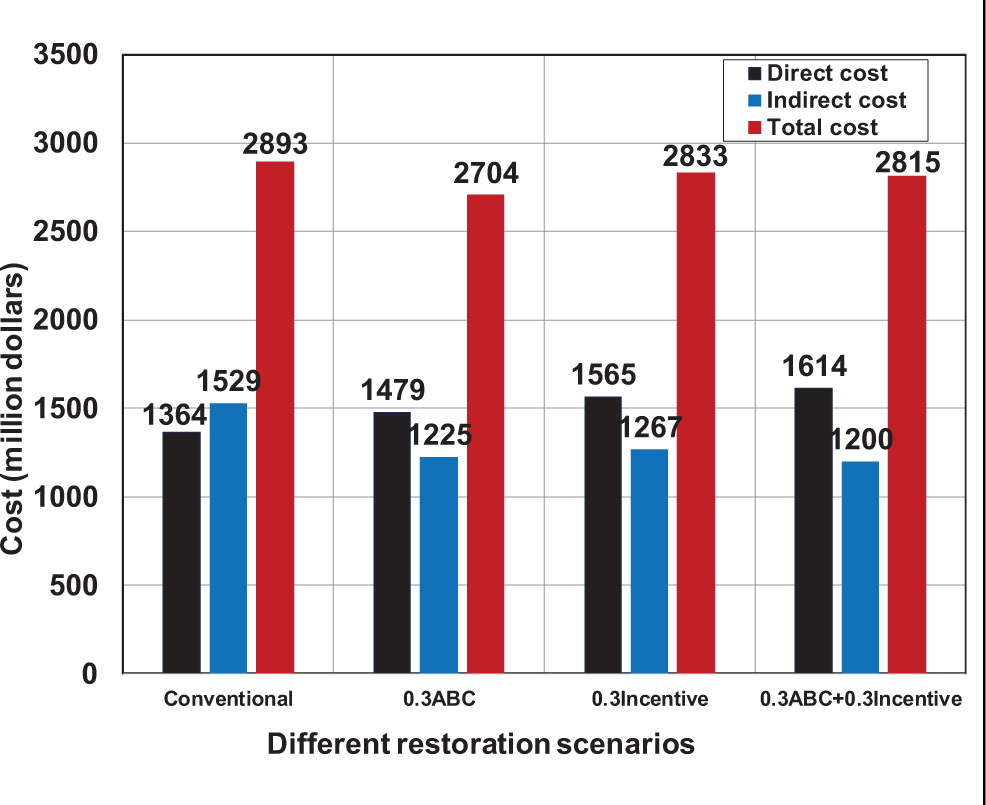
Direct, indirect, and total costs associated with different restoration scenarios.
Applicability of the Method to Other Regions
Application of the developed methodology could be extended to other regions exposed to dangers other than seismic hazards. The procedure would require identification of the hazard, the effect it has on the components of the system (e.g., bridges or roadways), and the intensity and frequency of the hazard. Then the selected assets should undergo a vulnerability analysis process. Similar to the procedure provided in this paper, vulnerability could be measured in terms of the fragility of the component as it is exposed to different hazard intensity levels. A similar set of information would be required to develop the transportation network model of the study area and conduct the traffic analysis pre- and post-event ( 7 ). For analysis of direct and indirect costs, the values specific to the study region need to be adopted. The ABC application should follow the standard practices relevant to the study region. An example extension of topography-based analysis (compared with flow-based analysis in this paper) was established by the second author for the New York City region under the effects of a hurricane-induced storm surge ( 18 ).
Conclusion
Resilience represents the capacity of the system to absorb shocks (robustness), provide alternatives (redundancy), and recover rapidly (resourcefulness and rapidity). However, the majority of efforts to bolster the resilience of transportation systems to extreme events have set off on a path that primarily emphasizes robustness. This paper aimed to approach the problem of enhancing the resilience of the transportation network from a different perspective, that is, to accept that not all vulnerabilities can be mitigated and that a true resilient system should be able to recover rapidly despite possible failures. To achieve this goal the use of ABC techniques as a means to speed up recovery processes was proposed in this paper. It has been shown that ABC techniques combined with incentivizing processes can decrease the total repair time by up to 60%, which greatly improves rapid network recovery.
Footnotes
Acknowledgements
The research study results reported in this paper were partially sponsored by the Accelerated Bridge Construction University Transportation Center at Florida International University with Iowa State University and University of Nevada-Reno as partner universities. The authors acknowledge and thank the sponsors for their support.
Author Contributions
The authors confirm contribution to the paper as follows: study conception and design: AA; data collection: NZ, AA; analysis and interpretation of results: NZ, AA; draft manuscript preparation: NZ; parts of literature review: LC. All authors reviewed the results and approved the final version of the manuscript.
The Transportation Systems Resilience Section (ABR00) peer-reviewed this paper (18-06760).