
Abstract
Pavement roughness is one of the key contributors to rolling resistance and thus vehicle fuel consumption. Roughness-induced fuel consumption is the result of energy dissipation in the suspension system of vehicles and therefore depends on both road surface characteristics and vehicle dynamic properties. In this paper, the sensitivity of roughness-induced excess fuel consumption to all involving factors, i.e., road roughness metrics, vehicle dynamic properties, and speed is investigated, and the dominant factors affecting fuel consumption are identified. This is achieved by using the Sobol’s method—a robust analysis of variance (ANOVA)-based technique for global sensitivity analysis. To this end, Monte-Carlo (MC) simulation is performed by generating realizations of all input parameters according to their probability distributions and estimating the energy consumption via a mechanistic roughness model. The results of the simulation are then used to obtain global Sobol sensitivity indices. Finally, the comparison between the Sobol sensitivity indices and the previously employed indices based on Spearman Rank Correlation Coefficient (SRCC) is illustrated. It is found that roughness metrics, i.e. the International Roughness Index (IRI) and the waviness number, account for 88–93% of the total variations in energy dissipation and are the most influential factors affecting the excess fuel consumption. It is also observed that among vehicle dynamic properties, the stiffness of tire is the most important parameter accounting for 2–7% of the total variance of the excess energy consumption.
With fast increase in the need for travel and mobility, the greenhouse gas (GHG) emission due to the transportation sector has increased significantly since 1990 ( 1 ). In the United States, for instance, the transportation sector generates the largest share of GHG emissions, accounting for more than 28% of the total emission in 2016 ( 1 ). Among different types of transportation, road transportation has been identified as the most significant contributor to the environmental impact ( 2 ). United States Environmental Protection Agency (EPA) has reported that the number of vehicle miles traveled (VMT) by passenger cars and trucks has increased by 45% since 1990 ( 1 ). In general, the total GHG emission from road transportation originates from the following phases: material production, construction, maintenance, and use phases of the pavement ( 3 – 7 ). Life Cycle Assessment (LCA) of pavements suggests that for heavily congested traffic roads, the impact of use phase manifests itself the most and surpasses the emission from the other phases ( 8 , 9 ).
Besides the fuel needed to propel the vehicle and overcome the air drag, extra energy must be added to the system to compensate rolling resistance forces and to maintain a constant speed ( 10 ). Deflection-, texture-, and roughness-induced pavement–vehicle interactions (PVI) are the most prominent mechanisms of rolling resistance that lead to excess fuel consumption ( 2 , 11 , 12 ). Deflection-induced PVI accounts for the dissipated energy within the viscoelastic material of the pavement ( 11 , 12 ). Texture-induced PVI is responsible for the dissipated energy in the viscoelastic tire due to the interaction between the texture of the road and tire treads ( 13 , 14 ). Finally, roughness-induced PVI takes into account the dissipated energy in vehicles’ suspension system due to road unevenness ( 2 , 15 ).
This paper focuses on roughness-induced PVI for which empirical and mechanistic-based models have been developed. The inherent uncertainty of the inputs to the roughness-induced PVI model raises the question of how the roughness-induced fuel consumption is influenced by the uncertainty of different input factors. To answer such question, global sensitivity analysis is used, which is a powerful tool to quantify the uncertainty of the model output and properly allocate that to different sources of uncertainty in inputs ( 16 ). This technique can be used to identify the parameters with the most and the least significant impact on the output. It thus allows the main focus to be on the individual or groups of input variables with higher impact on the output.
Recently, Giustozzi et al. performed a sensitivity analysis of deflection-induced PVI to account for the impact of resolution and accuracy of input data and investigated how sensitive the deflection-induced PVI model is to the use of average data versus recorded inputs ( 17 ). In another study, Louhghalam et al. used normalized Spearman Rank Correlation Coefficient (SRCC) as a measure of sensitivity to quantify the effect of roughness variables as well as speed on roughness-induced PVI model ( 2 , 15 ). In the research described in this paper, sensitivity analysis is performed on the mechanistic model for roughness-induced PVI. The impact of both road characteristics and vehicle dynamic properties is investigated, unlike in the previous studies ( 2 ). This is achieved by employing a special technique for global sensitivity analysis, Sobol’s method, to investigate the global sensitivity of roughness-induced excess fuel consumption (EFC) to different individual as wells as groups of input factors ( 18 ).
Roughness-Induced PVI
In the following, the fundamental definitions of roughness indices and the equations for the roughness-induced PVI model are briefly reviewed. For the complete derivations of the roughness-induced model see Reference ( 15 ).
International Roughness Index (IRI)
The IRI is defined as accumulated suspension motion of the Golden Car, a standard quarter car model, traveling at a constant speed of

In the above equation
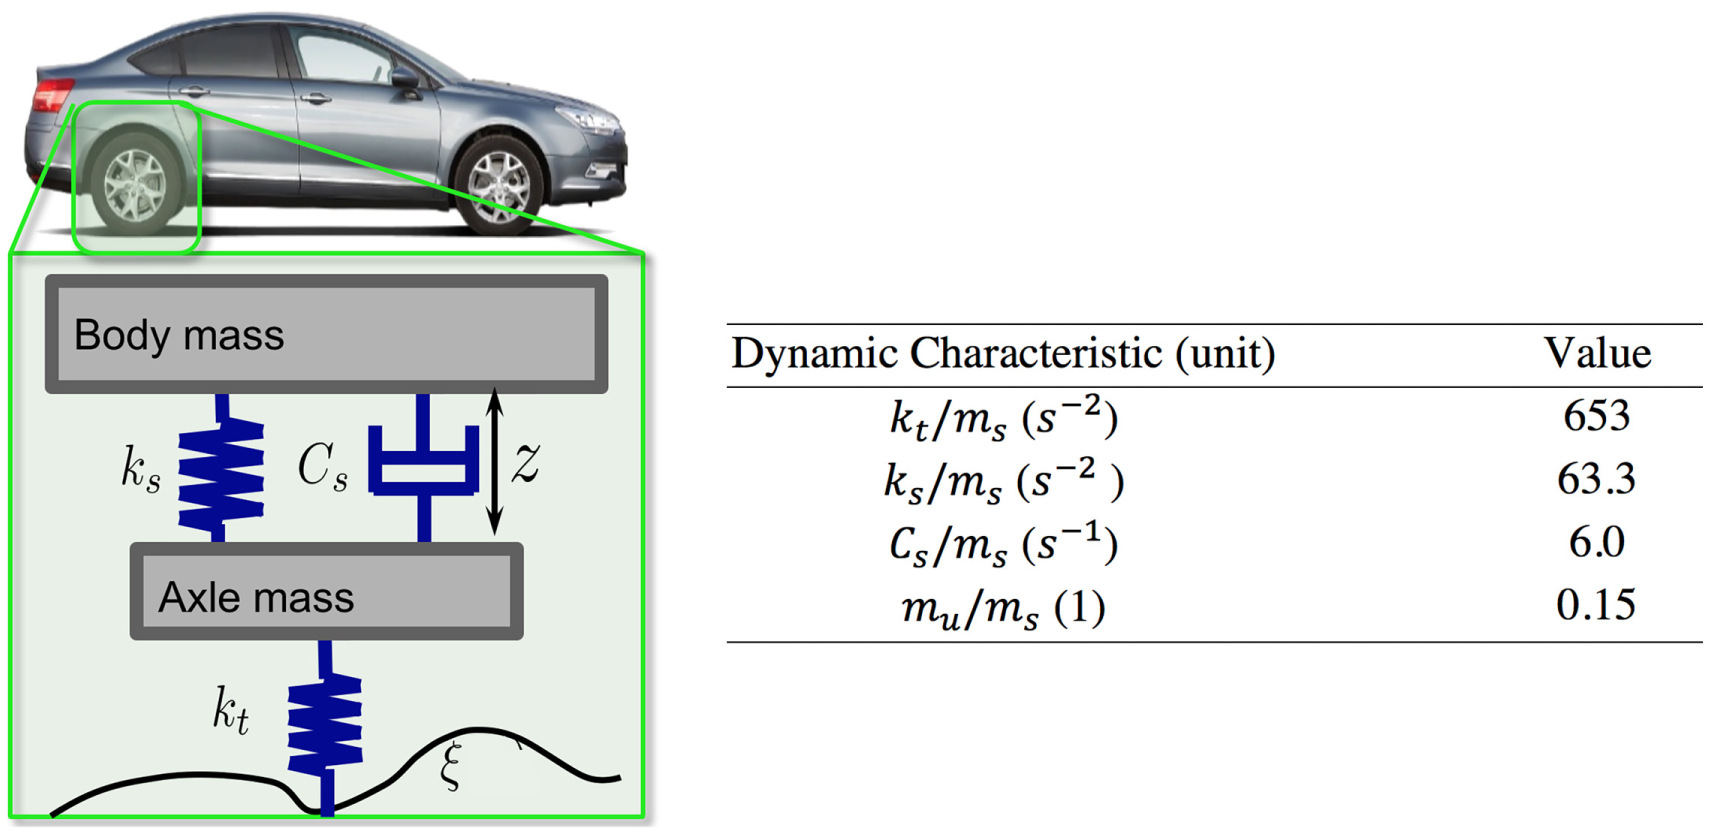
Two-degree-of-freedom quarter car model and the dynamic properties of the Golden Car.
Roughness Power Spectral Density (PSD)
The PSD of roughness is the Fourier transformation of autocorrelation function of the road profile and describes the distribution of different wavelengths within the profile. For most roads, roughness PSD can be expressed in the form of a power function as:
Mechanistic Model for Roughness-Induced PVI
For a vehicle traveling on an uneven road with speed

where
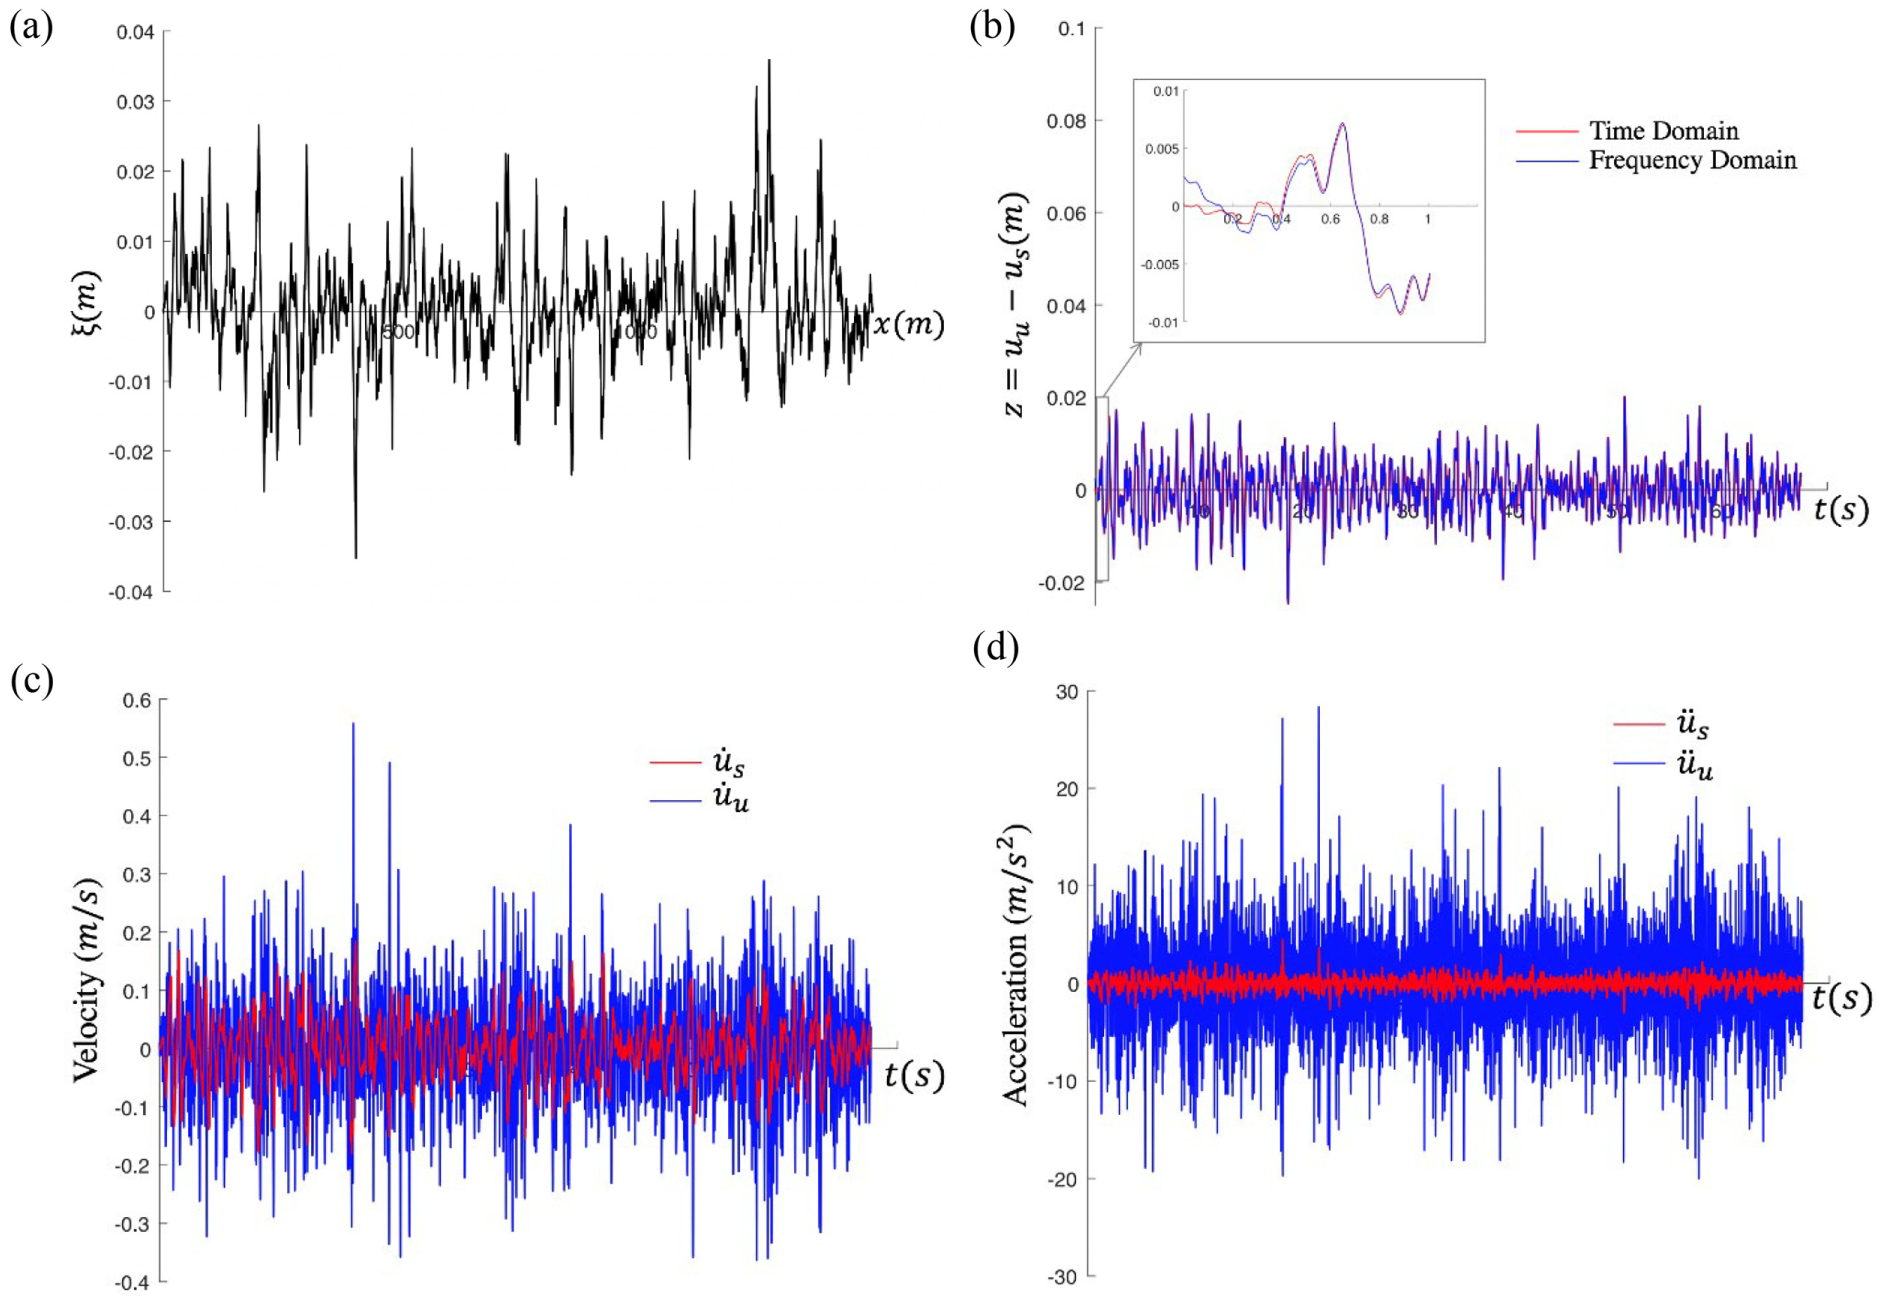
Dynamic response of the Golden Car: (a) road profile, (b) relative displacement of the masses, (c) absolute velocity, and (d) absolute acceleration.
The dynamic response can be directly related to the input in the frequency domain via the frequency response function (FRF) as:
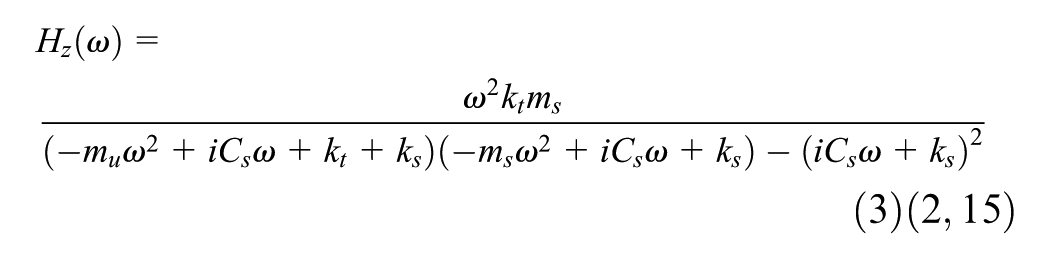
(2, 15)
It should be noted that the FRF solely depends on vehicle dynamic properties and is not related to the road surface characteristics.
Using the fundamentals of random vibrations, the PSD of relative velocity of the two masses is related to the PSD of the input, i.e., roughness PSD:
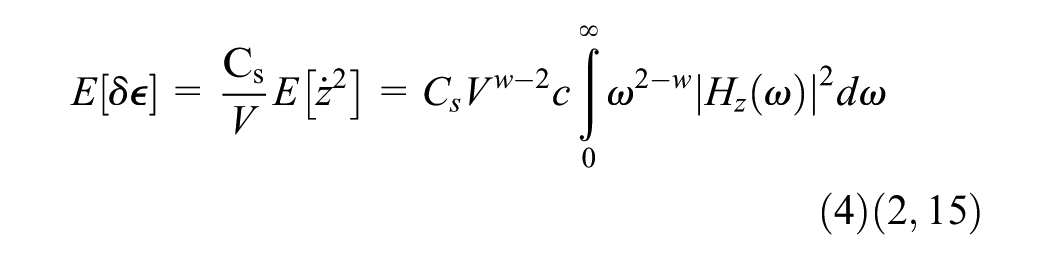
(2, 15)
The above relation is sufficient to estimate the average dissipated energy and fuel consumption for a vehicle traveling on a specific road. In the above fundamental relation, the properties of the vehicle are manifested in the FRF,
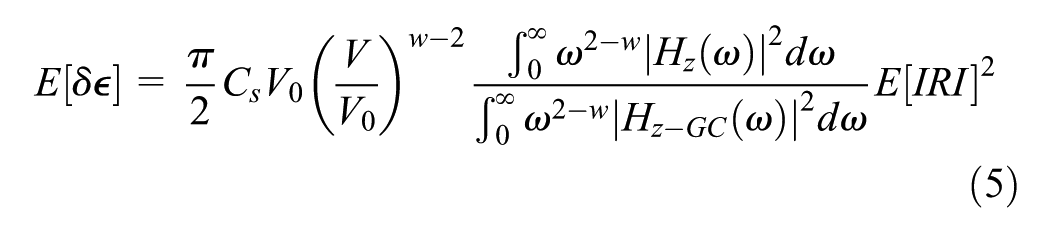
In the above equation
Sensitivity Analysis
The relative impact of different input parameters to the model output is investigated via sensitivity analysis. In a broad sense, sensitivity analysis is categorized into local and global approaches. Local approach calculates the sensitivity of the model output to input parameters at nominal points, especially when the variables are relatively certain. In such deterministic approaches, the sensitivity indices can be estimated by numerically evaluating the partial derivatives of model output with respect to input variables at a specific point ( 16 , 24 ). Unlike local approaches to sensitivity analysis, global approaches consider a practical range and a probability distribution for each input variable. These methods are particularly more effective when the input parameters (and subsequently the model output) are random. Different global approaches have been used recently for sensitivity analysis; among them Sobol’s method has gained a lot of attention because of its capability to estimate normalized sensitivity indices for individual and groups of input parameters. The Sobol’s method, which is an analysis of variance (ANOVA) technique, is significantly more powerful than correlation-based methods such as SRCC. One of the main drawbacks of SRCC as a means of calculating global sensitivity indices is that it measures correlation between variables assuming monotonic relation between input variables and the model output that can be violated in non-linear models such as PVI models. Furthermore, SRCC can only measure first-order indices and thus fails to calculate the sensitivity of the output to groups of variables. For the sake of comparison with previous studies, the results of sensitivity analysis using SRCC are also presented.
Sobol’s Method: A Brief Review
Let scalar value function
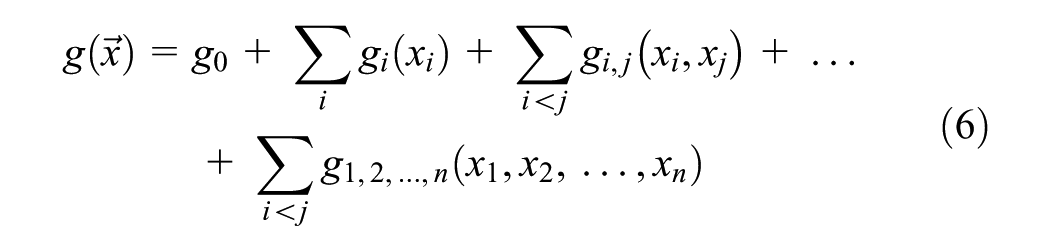
with the orthogonality condition:

Using the orthogonality condition, the total variance of the model

where
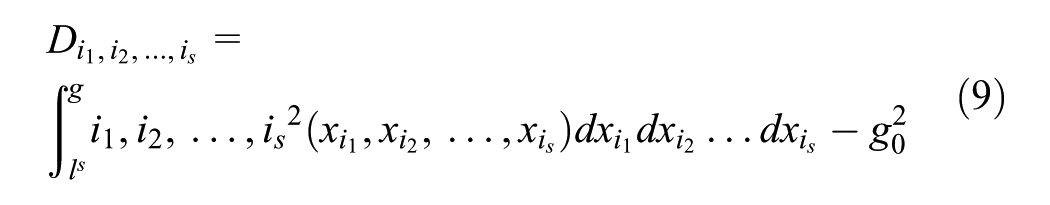
Finally, the
The Sobol indices vary between zero and one, and for a model with
Monte-Carlo Simulations
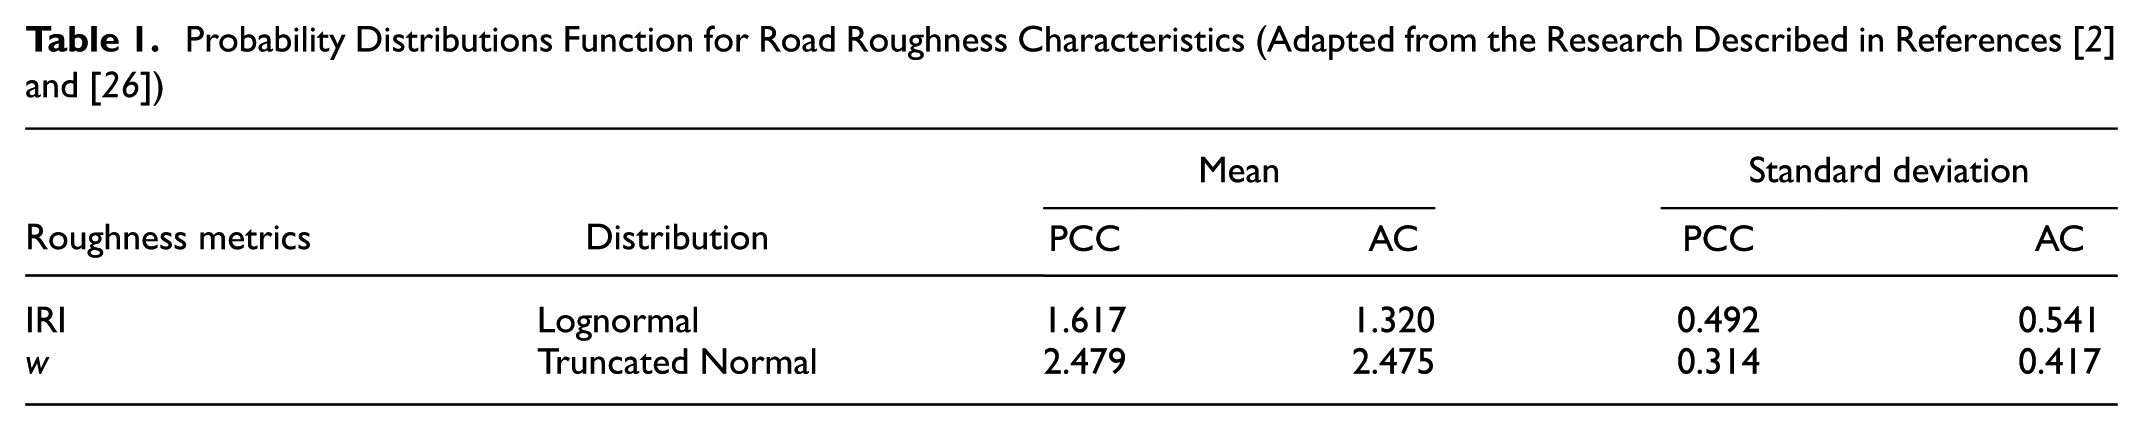
The MC simulation is performed by generating realizations of input parameters
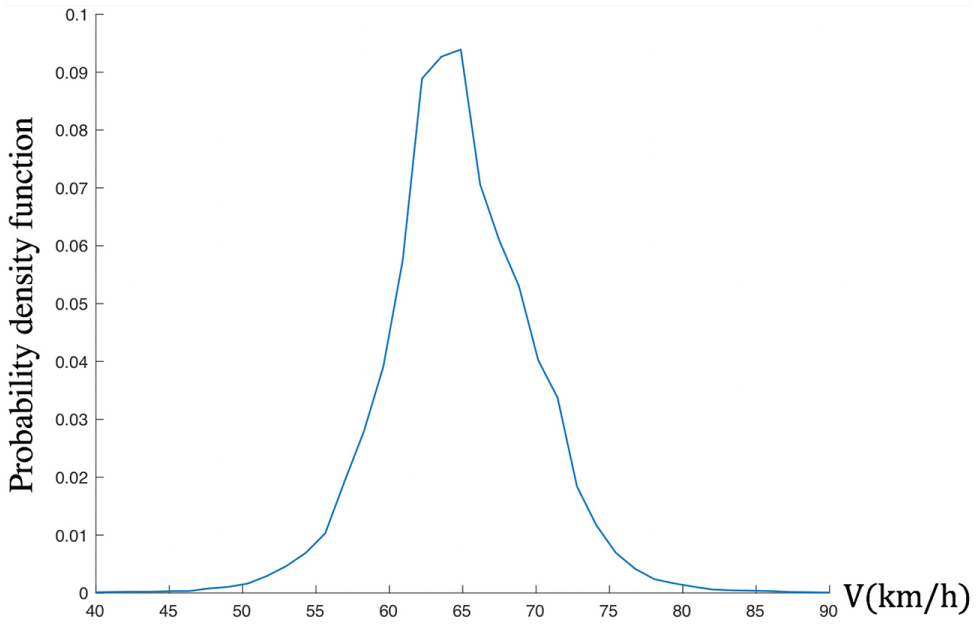
Empirical PDF for vehicle speed.
Probability Distribution for Dynamic Properties of Different Classes of Vehicles
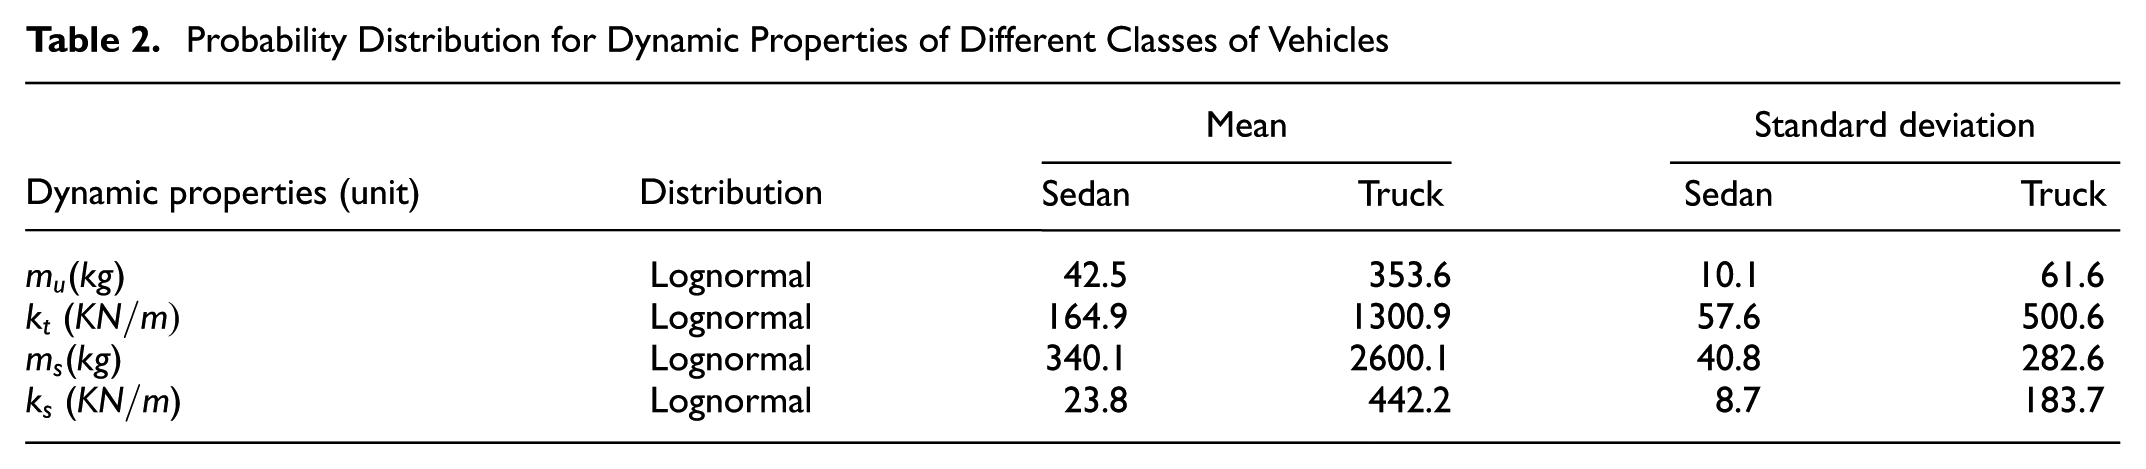
For each realization in the MC simulation, all random input variables must be generated according to their cumulative distribution function (CDF). To generate a random input sample
To minimize the error in the estimation of variances, MC simulation must be performed with sufficiently large number of realizations
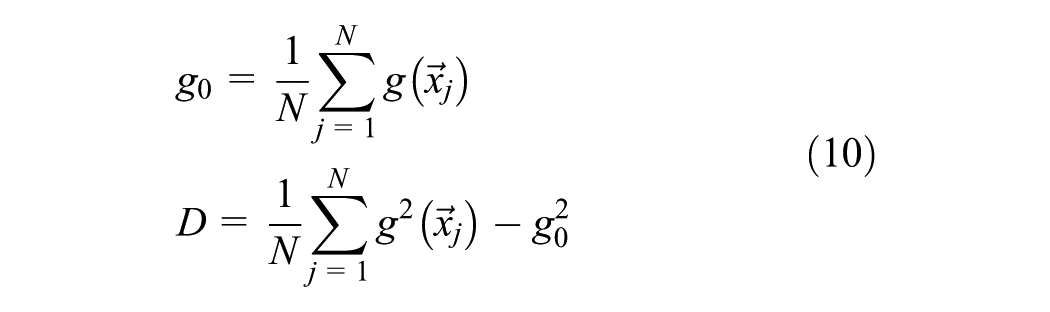
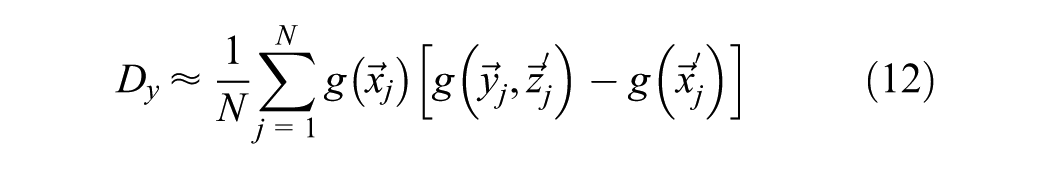
To evaluate the variance corresponding to the subset
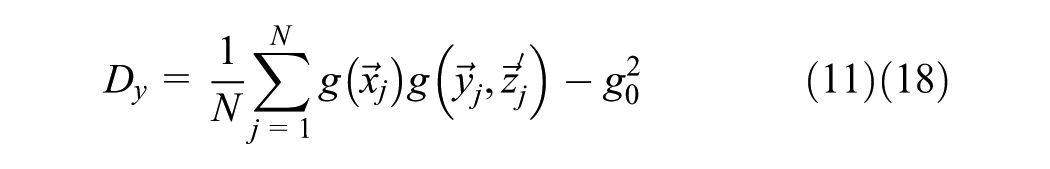
(18)
The partial variances obtained from Equation 11 are normalized by the total variance to determine the global sensitivity indices (GSI). Figure 4 shows the GSI for the individual input variables calculated using different number of realizations with convergence observed at
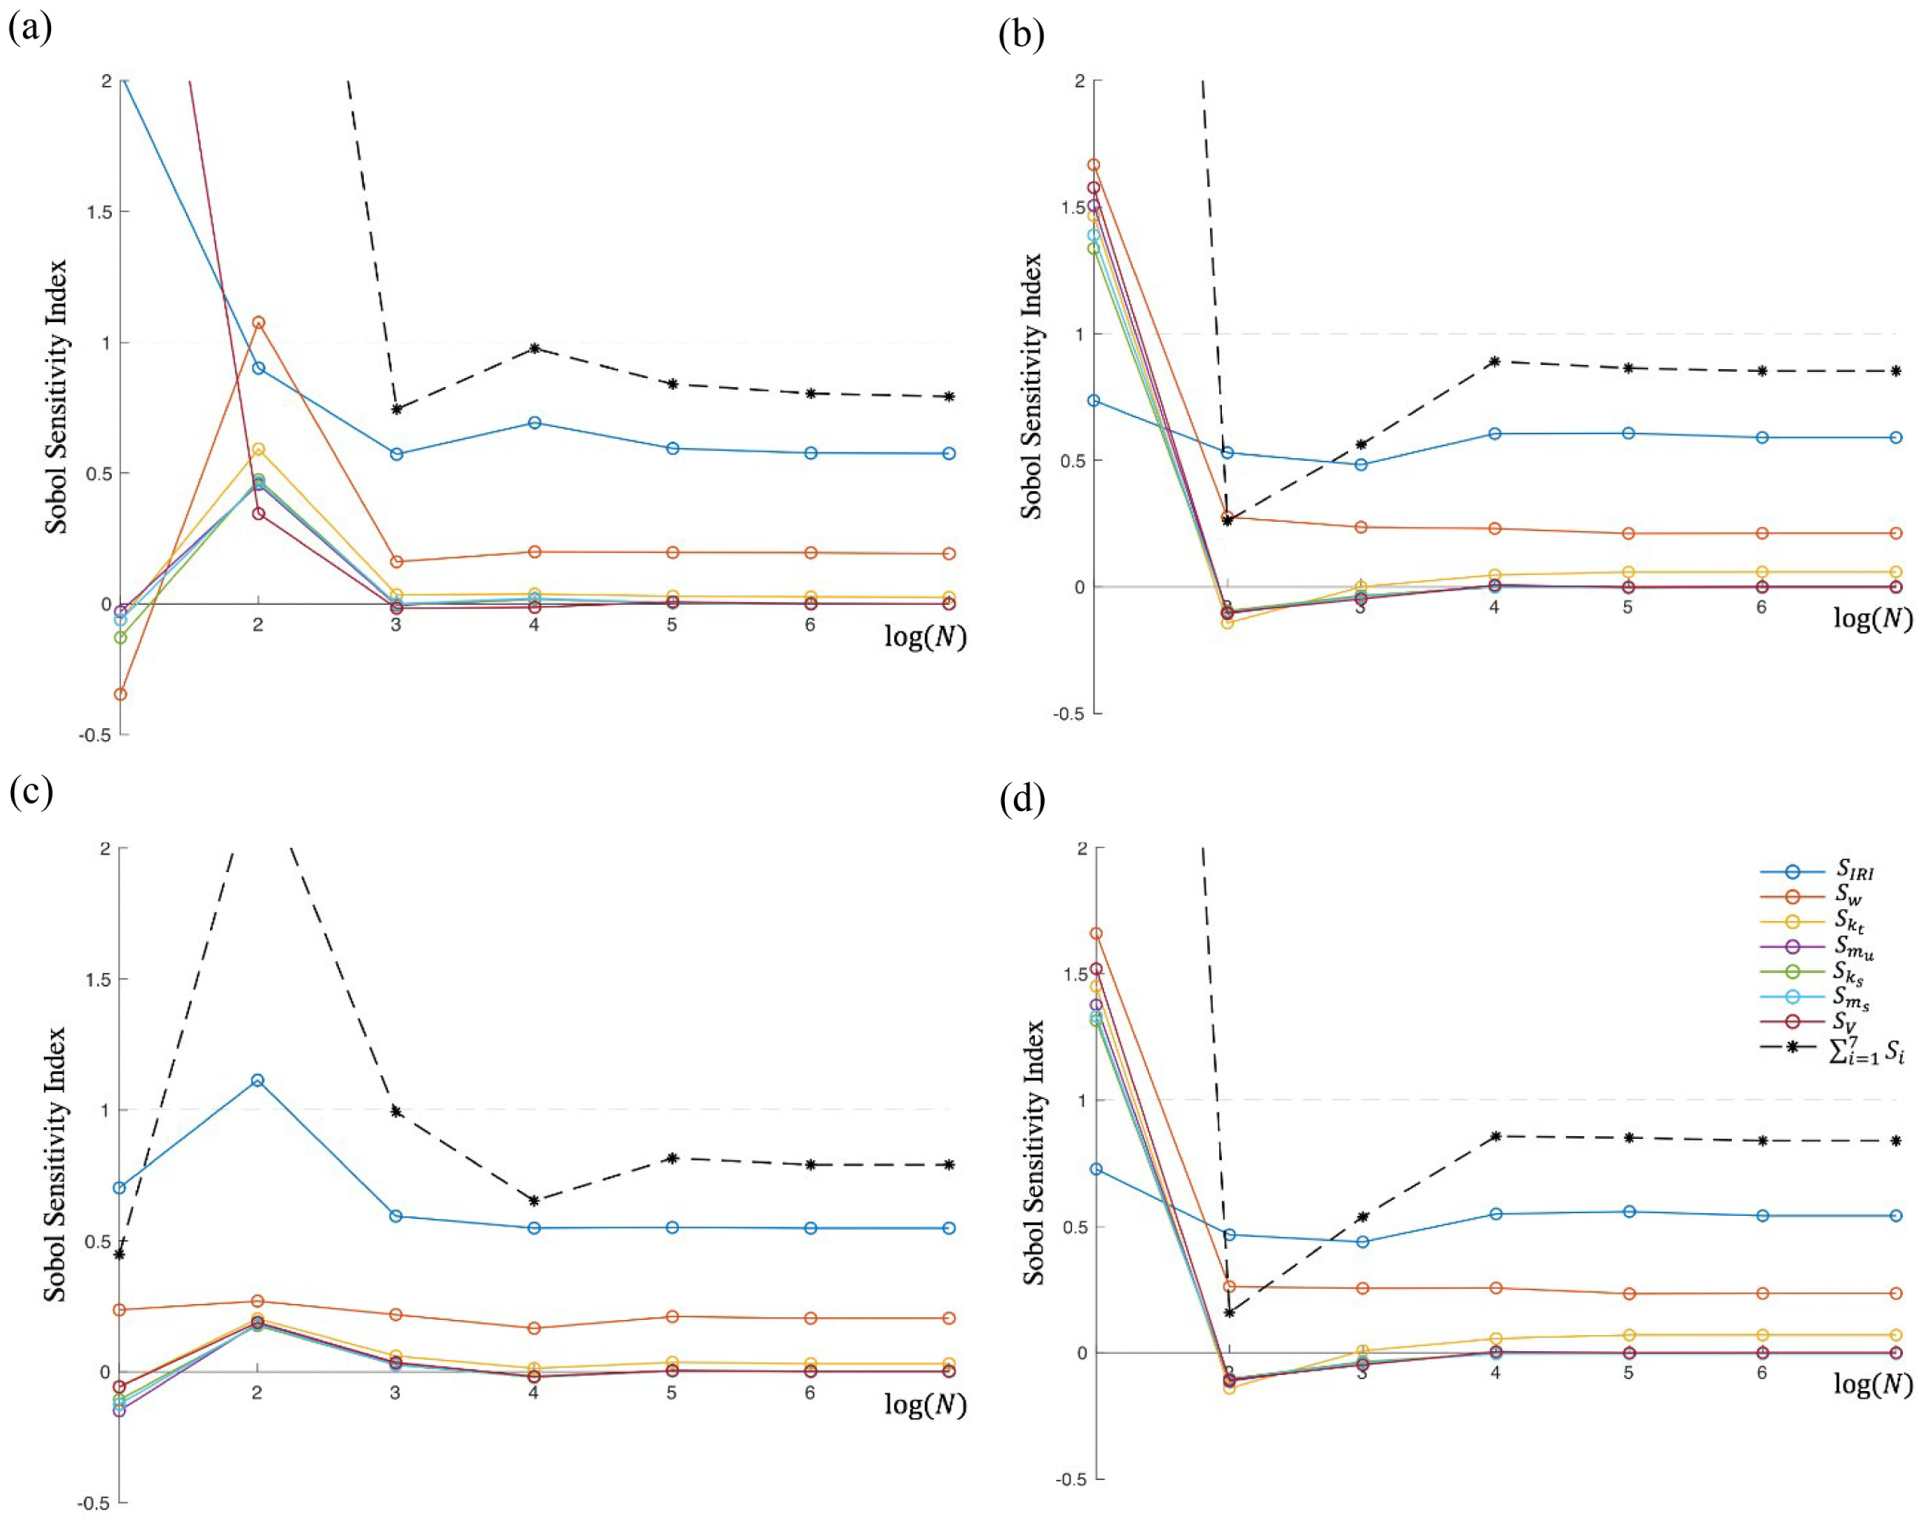
First-order global sensitivity indices.
For variables with very small sensitivity indices, e.g.,
Using the MMC approach, small sensitivity indices can be estimated with fewer realizations. As an illustration, Figure 5(a) and (
b
) compares the performance of classical MC with that of the MMC simulations for inputs with respectively small (
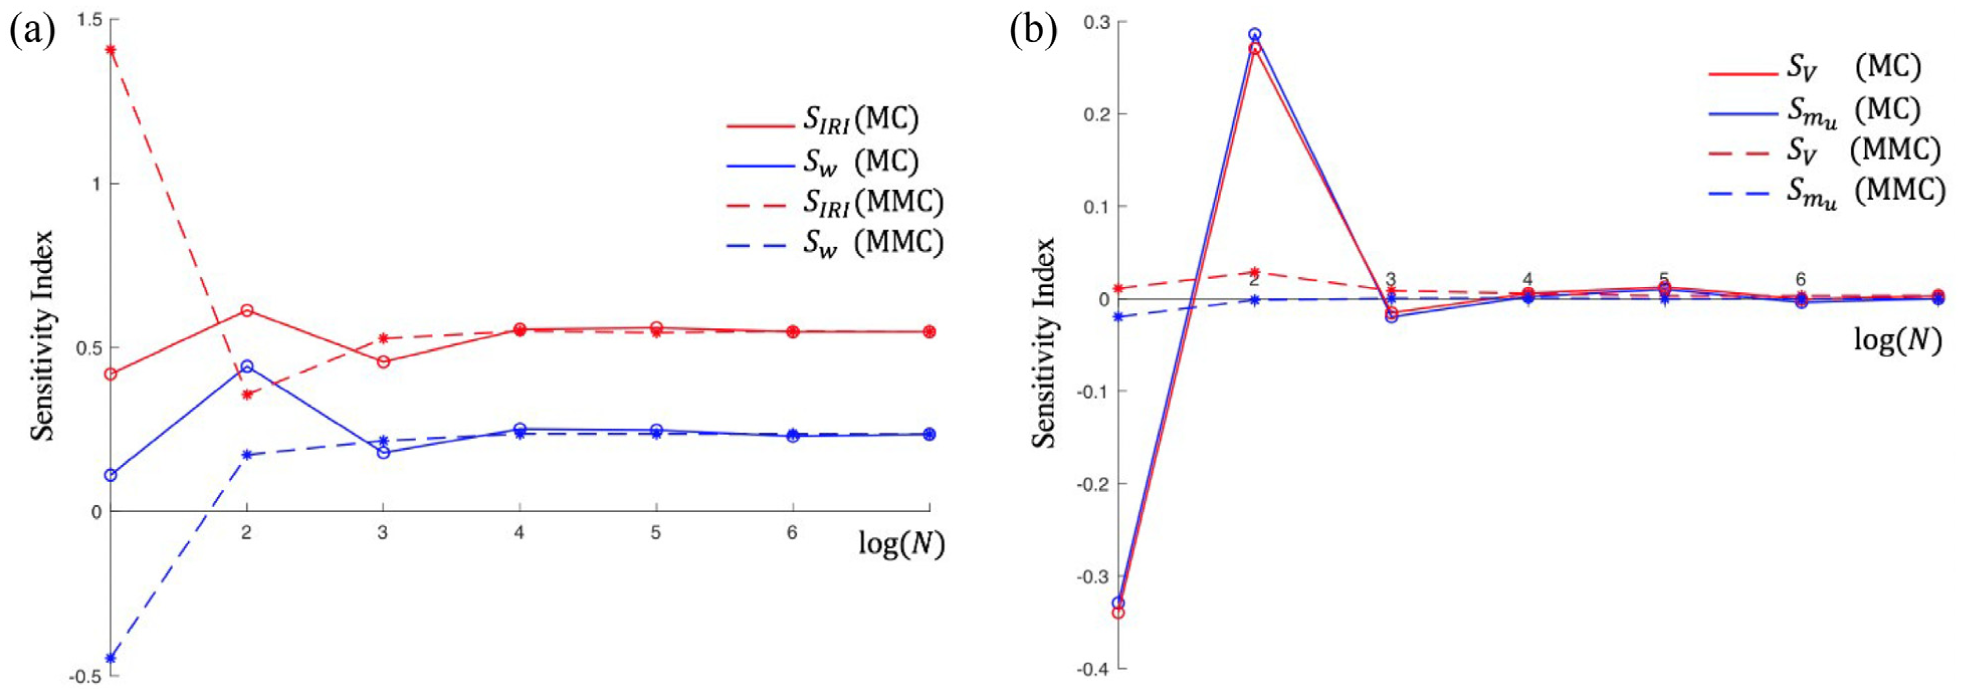
Comparison of MMC and MC for (a) large sensitivity indices and (b) small sensitivity indices.
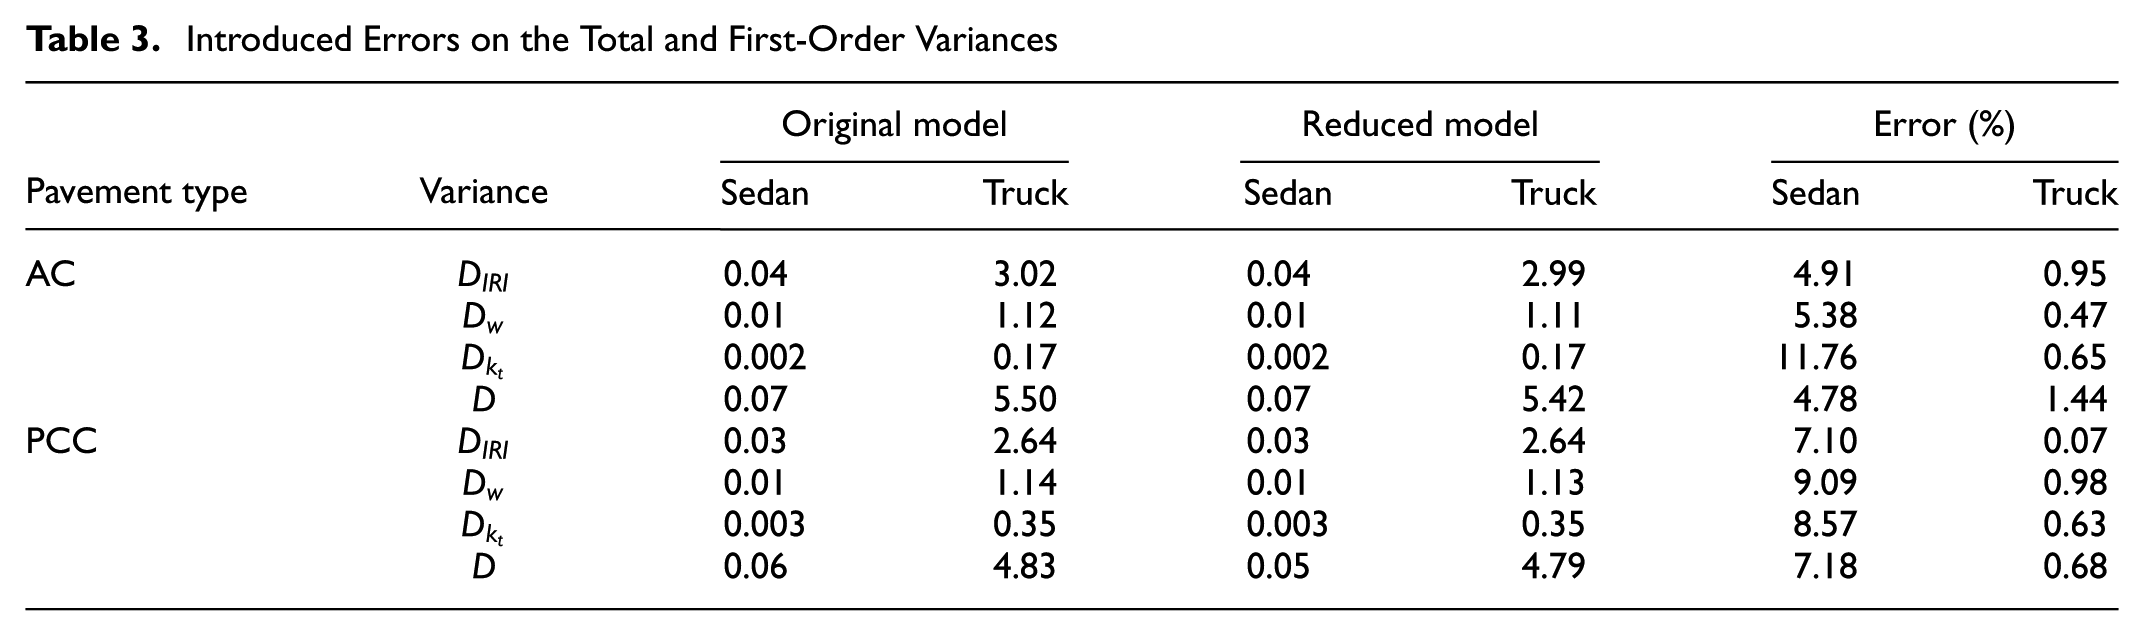
Results of the sensitivity analysis with
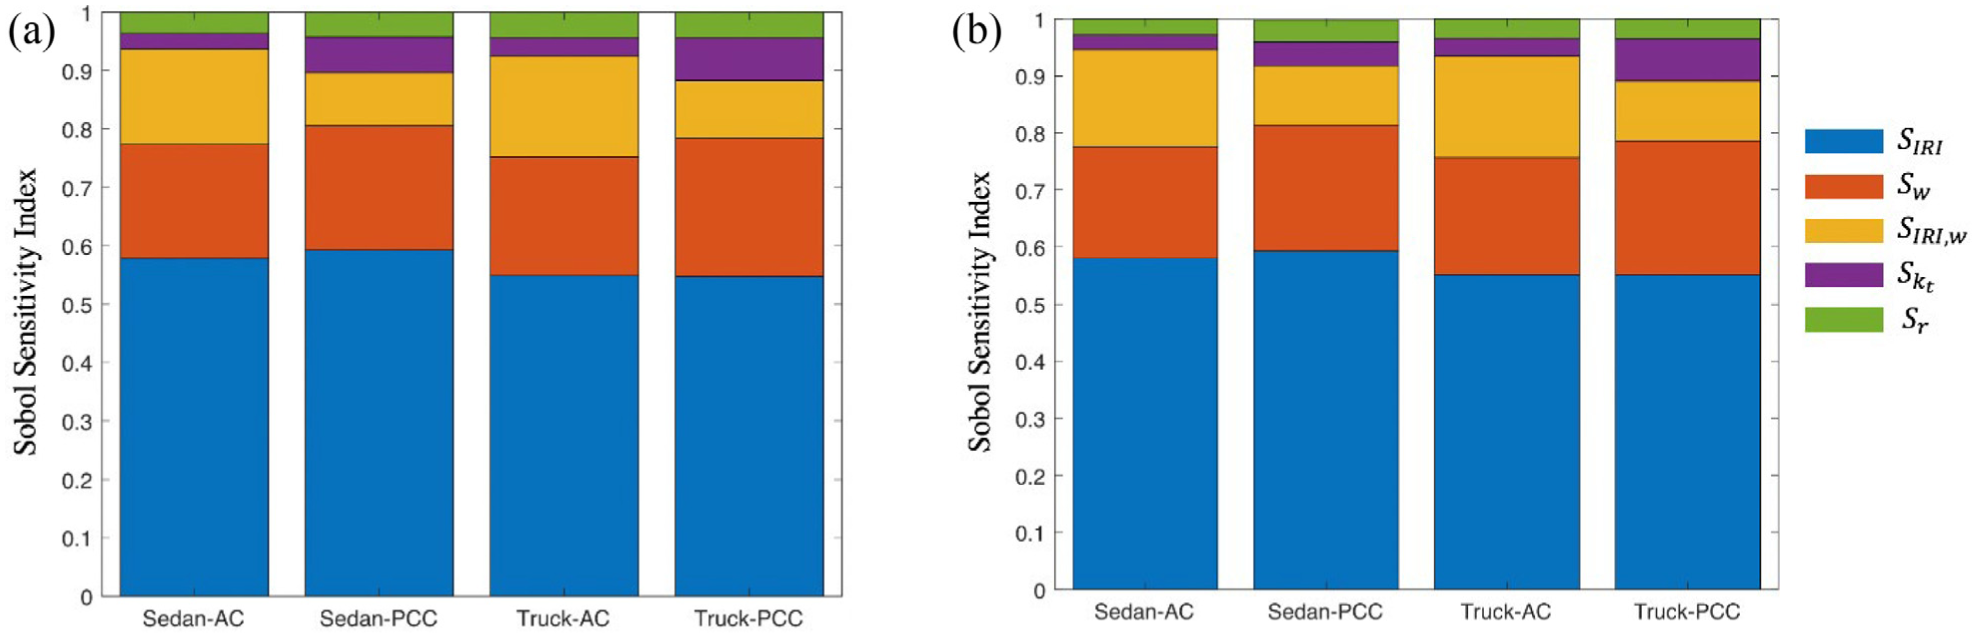
Global sensitivity indices using (a) original high-dimensional model and (b) reduced model.
It is found that for all classes of vehicles and road properties
Introduced Errors on the Total and First-Order Variances
Comparison with SRCC
SRCC shows the correlation between rank of dissipated energy
Comparison of Sensitivity Indices of Individual Input Variables using Sobol’s Method and SRCC
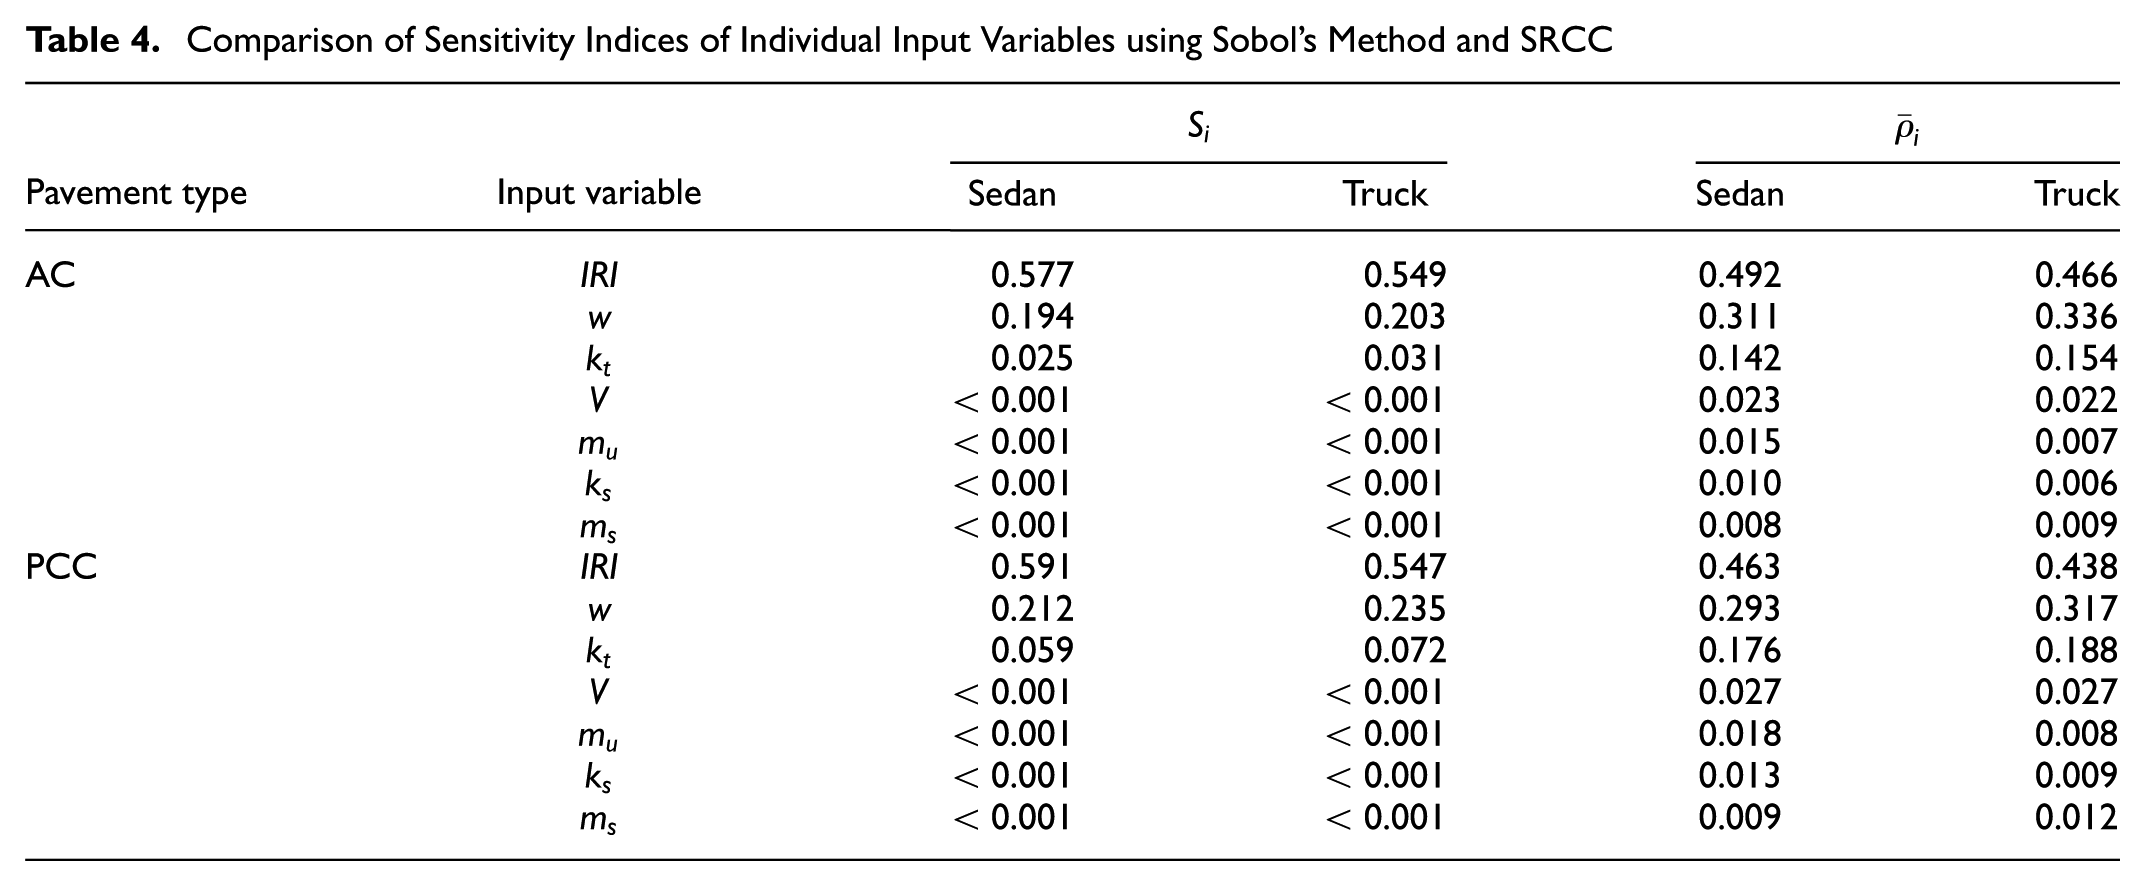
Once again, the results indicate that the excess dissipated energy is mostly influenced by IRI,
Conclusion
Sensitivity analysis is performed to investigate the sensitivity of the roughness-induced energy consumption to different input factors, namely road roughness parameters, vehicle speed and dynamic characteristics. The following results deserve attention:
The results of the global sensitivity analysis using the ANOVA-based Sobol’s method indicates that energy consumption is very sensitive to the road roughness parameters IRI and
Among different vehicle dynamic properties, stiffness of the tire is shown to be the variable with the highest impact on the energy consumption. Tire stiffness is responsible for respectively 2–3% and 5–7% of the total sensitivity of the excess fuel consumption in AC and PCC pavements. It is observed that energy consumption is slightly sensitive to the remaining vehicle properties such as sprung and unsprung masses and suspension stiffness. The accumulated sensitivity of these variables is less than 3%. The small sensitivity indices are obtained using MMC approach, which requires two orders of magnitude fewer realizations than for the MC simulations.
Fuel consumption in cars is more sensitive to the combined impact of IRI and
The comparison of the results of ANOVA-based Sobol’s method with that of correlation-based SRCC indicates that while the two approaches are very different in nature they predict the same trend for the sensitivity of the input variables, with SRCC overestimating the sensitivity of insignificant input variables.
The results of sensitivity analysis suggest that road surface characteristics have a significant impact on the roughness-induced dissipation and, while vehicle dynamic properties and travel speed can affect roughness-induced PVI, their impact is not significant.
Footnotes
Acknowledgements
The authors acknowledge the technology development award from the University of Massachusetts president’s office. The Weigh in Motion (WIM) data used for speed distribution is provided by Virginia Department of Transportation and Center for Transportation Innovation and Research.
Author Contributions
The authors confirm contributions to the paper as follows—study conception and design: A. Louhghalam, M. Tootkaboni; analysis and interpretation of results: M. Botshekan, A. Louhghalam, M. Tootkaboni; draft manuscript preparation: M. Botshekan, A. Louhghalam. All authors reviewed the results and approved the final version of the manuscript.
The Standing Committee on Pavement Surface Properties and Vehicle Interaction (AFD90) peer-reviewed this paper (19-00382).