
Abstract
Generally, the use of reclaimed asphalt pavement (RAP) has been limited to asphalt mixes. Recently, this trend has changed to include using RAP in unbound pavement layers. However, the cost-effectiveness of this application is not well studied. This paper presents a methodology to conduct cost–benefit analyses for using RAP–sand blend in subgrade and subbase layers considering a general process of RAP–sand blend from different sources until it is used in construction. Eight scenarios of RAP–sand blend applications were considered. Each scenario has two pavement sections (control and alternative) and was evaluated using the mechanistic-empirical approach. The benefit of using RAP–sand blend in the alternative section was assessed in terms of saving in asphalt thickness under various equivalent single axle load (ESALs) ranging between 1 and 12 million. Four mixing options were identified, and results for Option 1 (fresh RAP and mixing at site) indicated significant saving ranging between –$ 0.48 and $9.29/m2 depending on the scenario of RAP blend utilization. The highest benefit–cost ratios were also achieved with this option. Estimated benefit–cost ratios ranged between 0.58 and 18.64 depending on the scenario and option considered in the analysis, with uneconomic situations associated with Scenario 3. In this analysis, no significant impact was found for ESALs when their values are above 1 million. Generally, the RAP–sand blend is more effective in reducing required asphalt thickness, especially when used as a subgrade or subbase layer below thinner unbound aggregate layers. The significant saving achieved may encourage future implementation of this blend.
Reclaimed asphalt pavement (RAP) is typically produced through milling operations, which involve grinding and collection of the existing asphalt pavement. RAP can be stockpiled but is most frequently reused immediately after processing at the site. Mass quantities of RAP are produced worldwide from road rehabilitation activities. In the United States of America, more than 50 million tons of RAP are produced annually, and in Egypt more than 3 million tons of RAP are produced every year. Though huge amounts of RAP are recycled into new asphalt paving mixtures, larger quantities of RAP remain unused ( 1 ). Consequently, alternative RAP applications have emerged in highway construction.
The cost-effectiveness and environmental benefits of using RAP in asphalt mixes have been well researched and documented in previous studies ( 2 – 6 ). Therefore, nearly all the United States use RAP in their asphalt mixes ( 7 ). However, RAP is not widely accepted for base, subbase, or subgrade usage because there are limited laboratory testing and field performance data ( 8 – 10 ). In addition, the studies conducted to evaluate the benefits of RAP in such applications are limited in scope. For these reasons, there is a wide range in the allowed RAP contents and specifications for applications in road base, subbase, and/or subgrade. Therefore, factors that may affect the performance of RAP should be evaluated and quantified to ensure that this material is used only when benefits are expected.
Objectives
Large quantities of milled asphalt are produced annually in Egypt, but less than 10% is used in limited works such as temporary road diversions, parking lots, and so forth. As sand soil is also available in large quantities in Egypt, the need to use RAP–sand blend in road construction becomes inevitable. It is, therefore, the objective of this study to investigate the cost-effectiveness of using RAP–sand material in subgrade and subbase layers. The impact of using RAP–sand blend on the required asphalt layer is also assessed in this study for different scenarios, and the corresponding costs/benefits are evaluated accordingly. Options of various RAP sources, hauling distances, and mixing operations are also considered and evaluated in this study.
Background
Although various studies have been conducted to evaluate the applicability of using virgin material blended with RAP as a subgrade, subbase, or base material, limited studies have focused on the cost-effectiveness of this application. This literature review summarizes various studies that investigated the performance and economic benefits of RAP/virgin aggregate blends.
In 1999, Taha et al. reported that up to 60% RAP could be used as an alternative to virgin aggregates in subbase layer while maintaining the same function as conventional subbase materials ( 11 ). Furthermore, the study concluded that only 10% RAP could be used in the construction of road base. These conclusions were solely based on laboratory testing without conducting a cost–benefit analysis. Similarly, MacGregor et al. reported that increasing the RAP content in base or subbase material from 0 to 50% causes a slight increase in the resilient modulus (or layer coefficient) for similar layer thicknesses ( 12 ). Consequently, it was recommended to use RAP in base or subbase applications as no apparent detrimental effects were recognized. Based on laboratory and field tests, Aljassar et al. indicated that the maximum dry density and California bearing ratio (CBR) of subgrade soil were improved significantly when RAP was mixed with subgrade soil at a ratio of 1:3 by volume ( 13 ). The study compared the material costs of soil–RAP mix and conventional mix and reported a saving of 84.7% of conventional material cost, without considering any other costs or benefits associated with both alternatives.
New Jersey Department of Transportation (DOT) and Colorado DOT specified up to 100% RAP to be used as base material. However, this percentage was modified to 50% in both states based on results of a study by Bennert and Maher ( 14 ). In Illinois, RAP is not allowed to be used as base material. Instead, RAP is utilized in the subbase layer in some instances, but virgin aggregate must be placed overtop below the asphalt or concrete layers, and other states such as South Dakota do not adopt using RAP as base course material ( 15 ). A research effort carried out in Colorado showed that RAP has higher stiffness strength and permeability when compared with unbound aggregate base course ( 16 ). Therefore, it was concluded that RAP materials could be utilized as an alternative for virgin aggregate base or subbase materials. These findings were based on laboratory testing without comparing the costs and benefits of both alternatives.
A study carried out in Virginia concluded that the use of RAP as base or subbase material is economically feasible, and using RAP content of 50% in base or subbase layer would result in about 30% savings in material costs ( 17 ). In addition, this would reduce the current vast amount of RAP currently stockpiled in Virginia.
Mousa and Mousa investigated the engineering properties of different blends of RAP and sand materials with RAP contact ranging between 10% and 90% ( 18 ). Laboratory tests executed on blends included the sieve analysis, Atterberg limits, maximum dry density, optimum moisture content, and CBR. This study concluded that the RAP–sand having 50% RAP content was the best blend in terms of engineering properties, including a CBR value of 46.5%.
A case study was conducted in Wyoming to evaluate the cost-effectiveness of using RAP in several highway applications including gravel roads and road base. The study used a method developed by the National Asphalt Pavement Association to conduct the cost–benefit analysis. The results of this study indicated that using RAP in gravel roads may be more cost-effective than using it in bases because of the additional benefit of dust loss reduction ( 19 ). Life cycle assessments were conducted in Wisconsin to analyze the use of recycled materials in the reconstruction of an urban highway. The actual design including RAP was compared with a reference design using only virgin materials to evaluate the reduction in environmental impacts. Results indicated that the use of the recycled materials reduced impacts in most environmental aspects, including energy consumption (15–25% reduction) and CO2 emissions (17–24% reduction) ( 20 ). Similarly, Zaumanis et al. conducted an environmental effect and cost calculation for using 100% RAP mix and demonstrated reduction of emission by 35% while reducing the costs of materials by half ( 21 ).
Based on the reviewed literature, there is a general agreement that RAP could be used as an alternative to virgin aggregates in unbound pavement layers while maintaining the same function as conventional materials. Therefore, a comprehensive cost–benefit analysis was conducted in this study to consider all costs and benefits of both alternatives. This study is expected to address several shortcomings in the previous studies as follows:
Most conclusions were made solely based on laboratory testing, without considering the entire costs and benefits of both alternatives (with and without RAP). Although both alternatives could have the same physical properties as suggested by laboratory testing, hauling and mixing costs of RAP might make it more cost-effective to use virgin aggregates.
All the previous studies evaluated the applicability of using RAP in base and/or subbase courses only. Therefore, the scope of this study evaluated the cost-effectiveness of using the RAP material as road subgrade, as well as subbase course.
Main Properties of the Optimum RAP–Sand Blend
The optimum RAP–sand mix with 50% RAP content recommended in previous research by the same authors ( 18 ) was considered for further investigation in this study. This blend has a CBR of 46.5%, uniform gradation, non-plastic properties, maximum dry density of 2.04 gm/cm3, and optimum moisture of 7.7%. The review of the literature revealed different values for the minimum CBR value required for subbase layer used in pavement structure. Minimum values of CBR start from 30% ( 22 – 24 ) and go up to 60% ( 25 , 26 ). The Egyptian Code for Road ( 27 ) specifies a minimum CBR of 80% for main roads and 60% for local and secondary roads. The specified minimum values for subbase layers are 40% and 25% for main roads and local and secondary roads, respectively. According to this code, the maximum plasticity index for subbase material is 8%. Figure 1 shows the boundary limits of the gradation of a subbase layer specified by the Egyptian Code together with the gradation of the optimum RAP–sand mix. The code also specifies a minimum CBR of 10% for the subgrade layer. Accordingly, the engineering properties of the mix containing 50% RAP qualify it for potential use as a stabilized subgrade or unbound subbase layer in flexible pavements. The impact of using the RAP–sand mix in subgrade or subbase layer is highlighted in the following sections.
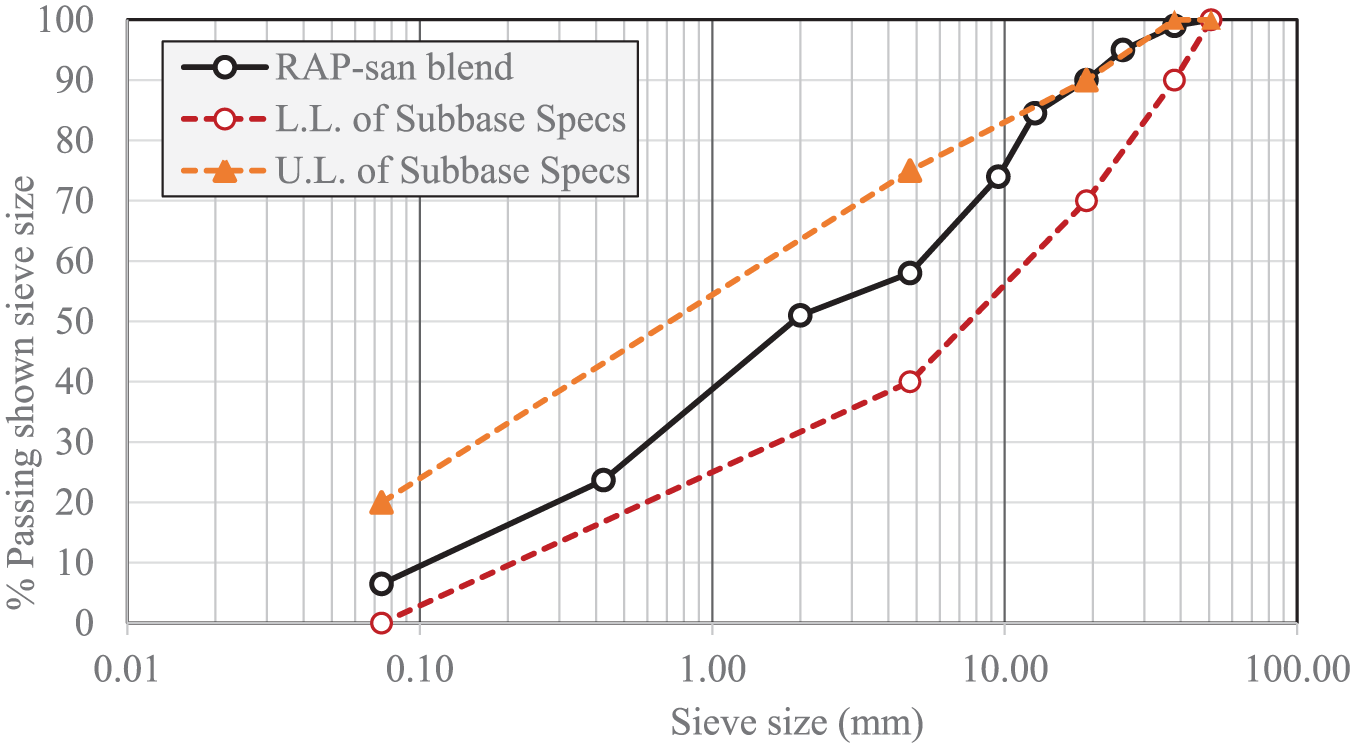
Comparison of gradation of optimum RAP–sand blend and limits for subbase.
Direct Comparison of Incurred Costs: Case Study
General Approach for Economic Analysis of RAP Blends
The analogy of achieved gain from the utilization of RAP–aggregate blend raises a question on the cost-effectiveness of this process. To answer this question, an economic evaluation is required considering all costs related to the production of construction aggregate from waste recycled material sources and comparing these with costs incurred in the production of virgin aggregate and in the disposing of the waste material. The main attributes affecting such economic evaluation include disposal costs, processing costs, transportation costs, location and quantity of RAP, resource value, and practicality of use as road base. Most of these factors vary from location to location for obvious reasons. While a benefit–cost analysis is a well-developed tool useful in highway planning, widespread use of this technique has not overcome the problem of assessing costs and benefits for intangible factors. For this reason, approximate costs for processing, transportation, and construction can be used to make a gross economic analysis only within broad terms ( 28 ).
The unit cost of RAP source depends on whether it is a fresh RAP used directly after milling or taken from stockpiled material. In case of fresh milling, certain cost is expected because, if not recycled, RAP has to be disposed at cost. On the other hand, stockpiled RAP usually requires certain processing before use and, therefore, its price is relatively high. This processing depends on the level of management of RAP stockpiling. The stockpiling control defines the quality of RAP, and this in turn governs the required processing which may include scalping, fractionating, reducing oversized particles, avoiding segregation, minimizing dust content, and removing contamination ( 29 ). In Egypt, however, the RAP material is produced from milled asphalt in road rehabilitation projects and used at site in cold recycling or other RAP-blend applications.
Unit Cost of RAP–Sand Blend
The cost of RAP–sand blend was estimated in this study based on actual unit rates available for a project where a new service road was to be constructed near the Cairo–Alexandria Desert Road. The main road was undergoing major rehabilitation works including milling the existing asphalt layer. The construction of the service road considered utilizing RAP from the milled asphalt on the main road, about 30 km far from site. The sand was to be brought to site from a quarry about 50 km away. All costs have been converted to equivalent US dollars.
The RAP was free of cost; the only cost incurred was for hauling of RAP. The cost of sand was $1.94/m3 excluding the transport cost. This gives a unit cost of $ 0.97/m3 for RAP–sand blend, excluding transport cost.
A linear regression model was developed using actual costs of transporting material from seven different sites with hauling distance ranging between 15 km and 145 km. Data and regression line are shown in Figure 2, which shows a linear model with R2 of 89% for expressing the transport cost as a function of the hauling distance. The model is also given in Equation 1 as follows:

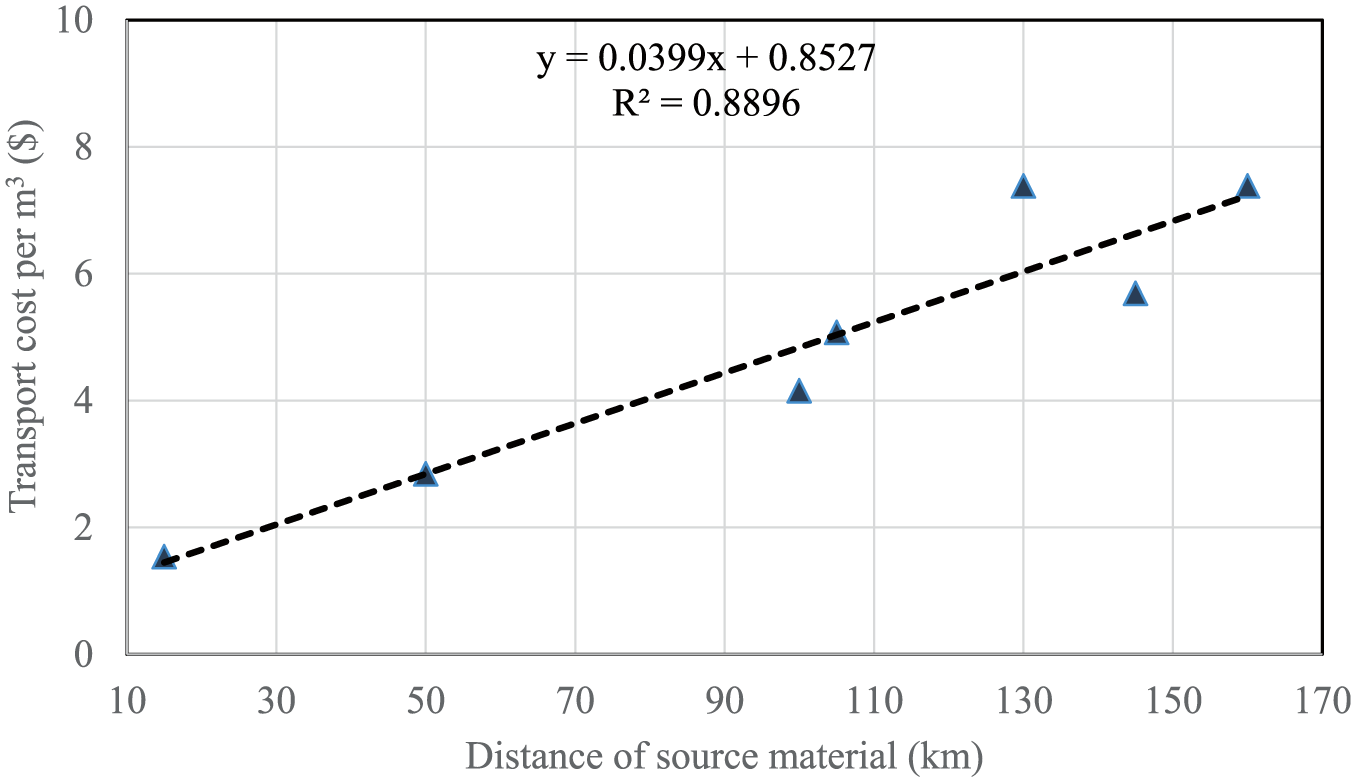
Relationship between transport cost and hauling distance.
Where (TC) is the transport cost ($/m3) and (X) is the hauling distance (km). The transport cost of 1.0 m3 RAP for 30 km is calculated as 0.853+0.04 * 30 (or $2.052/m3). The corresponding cost of transporting 1.0 m3 sand for 50 km is calculated as $2.853/m3. This makes the transport cost of 1.0 m3 of the blend (0.5 m3 RAP and 0.5 m3 sand) equal to $2.45/m3. Considering an additional cost of $ 0.27/m3 for mixing process at site, the overall unit cost of the RAP–sand blend becomes 0.97+2.45+0.27 or $3.69/m3. As can be noted, the hauling cost represented about 66% of total unit cost. This percentage, however, varies depending on the location of RAP and sand sources as well as the location where materials are blended. As previously mentioned, if the RAP is not used, it would have been disposed of at about 25 km away from site, with a transport cost of $1.85/m3. This means that there is an indirect saving of $ 0.93/m3 for the RAP–sand blend. This brings the unit cost down to $2.76/m3.
Cost Comparison
In this case study, the cost of RAP–sand blend was compared with that of the 15-cm conventional subbase layer considered for the service road mentioned above. The unit cost of conventional subbase is $7.76/m3. Since the quality of RAP–sand blend (CBR = 46.5%) is less than that of the conventional subbase (CBR = 60%), an equivalent thickness of RAP–sand layer is estimated based on the layer coefficient of each material. This was done in two steps. First, the resilient modulus (Mr) of each material was estimated using Equation 2, which was reported applicable over a wide range of CBR values ( 30 ):

Equation 2 above gives Mr values of 205.6 MPa and 242 MPa for RAP–sand blend and conventional materials, respectively. The second step was to determine the layer coefficient of the two material types using the following equation ( 31 ):

Corresponding layer coefficients from Equation 3 are 0.177 and 0.193 for the two material types, respectively, with a ratio of 1.09. Accordingly, the 15-cm conventional subbase layer was to be compared with 16.4 cm layer of the RAP–sand blend. The unit cost per square meter was calculated as $1.16/m2 and $ 0.60/m2 for the conventional material and RAP–sand blend, respectively, yielding a saving of 48.1% of the conventional material. When the cost of RAP disposal is considered, the percent saving increased to 61.1%.
This significant saving encouraged the utilization of the proposed RAP blend as a replacement for the conventional subbase material, especially as there are other benefits such as conservation of natural resources and reducing the need for disposal yards.
General Approach for Cost–Benefit Analysis
Approach and Assumptions
The cost comparison presented in the case study highlighted potential variation in the estimated saving associated with the utilization of the RAP–sand blend. Such factors include, but are not limited to, the unit prices of RAP and sand resources and their relative locations with respect to the construction site or mixer. For this purpose, it was necessary to highlight the steps followed in preparing and using the RAP–sand blend in a more general way, together with definitions of some common variables. This approach helps determine the unit cost of the RAP–sand blend for use at a given site.
After obtaining the unit cost of the RAP–sand blend, the next step was to define various scenarios under which the RAP–sand blend could be utilized. These scenarios include using the RAP–sand blend as: (a) stabilized subgrade to replace normal subgrade soil, (b) subbase layer in case there is not subbase layer in the pavement structure, and (c) subbase layer to replace a conventional subbase.
In order to assess the cost and benefit of using the RAP–sand mix in various scenarios, a pavement design is performed using the mechanistic-empirical (M-E) design concepts to determine the required asphalt overlay thickness for each scenario. All variables are kept constant throughout the analysis except the properties of the conventional material and corresponding RAP–sand mix. The cost comparison is then established by calculating the additional cost of using the RAP–sand blend and corresponding saving in the asphalt layer as discussed later in this section.
General Process of Mixing and Using RAP–Sand Mix
The flowchart in Figure 3 illustrates the procedure and steps followed for blending the RAP with sand until the blend is laid on the roadbed. In this flow chart, two RAP sources are considered, namely, fresh milled asphalt and stockpile RAP. The flow chart also shows two possible mixing methods: road mix method and stationary mixing plant. It also shows that fresh RAP, if not utilized, is discarded in a dumping yard at certain cost. The associated cost of each element in this flow chart is given in parentheses.
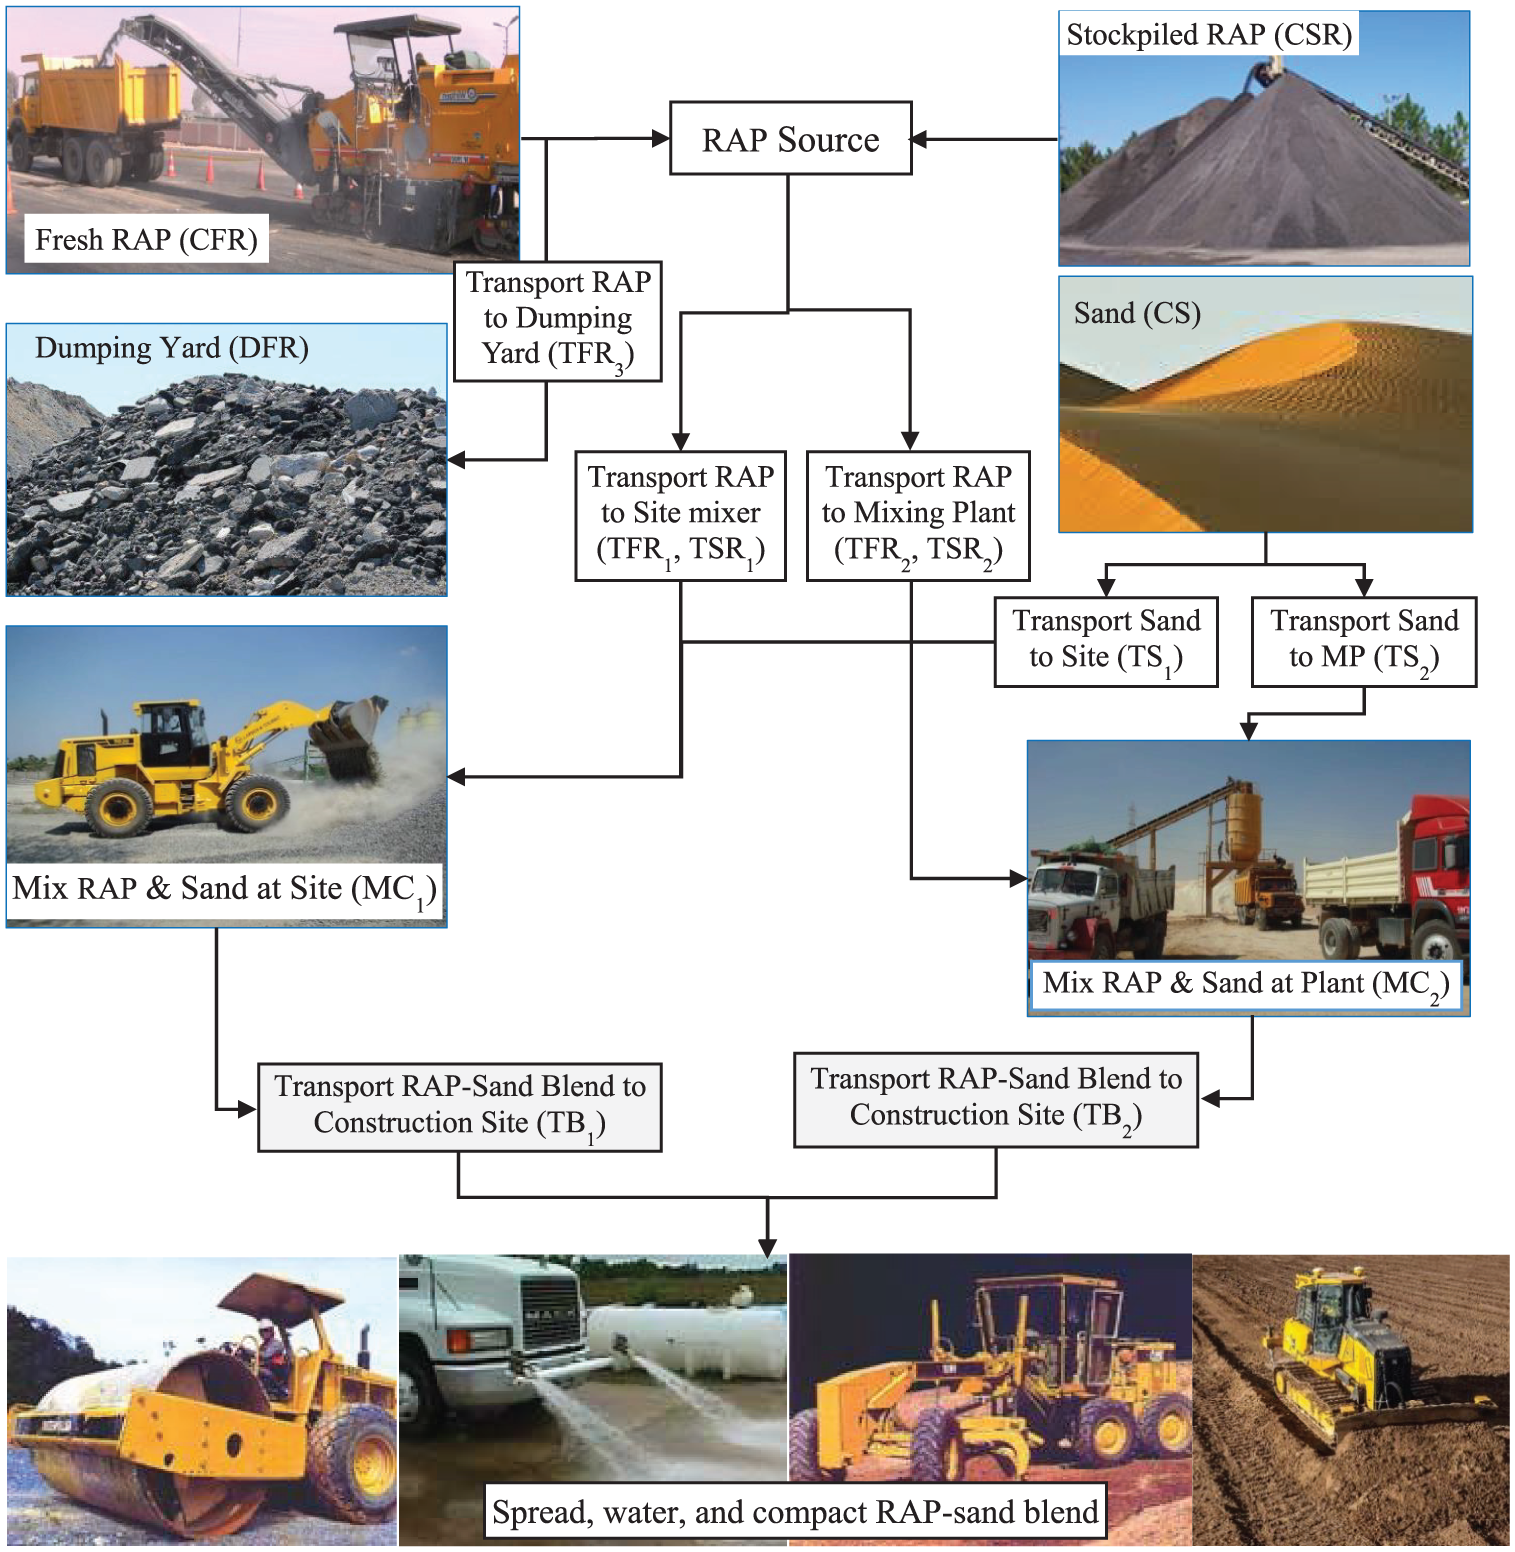
Flowchart showing steps followed in using RAP–sand blend.
Most of these rates were adopted from actual unit prices of the Cairo–Alexandria Desert Road rehabilitation project and other construction projects in the nearby area. Only two unit items were introduced to generalize this analysis. These are the nominal cost of disposing RAP at dumping yard and cost of stockpiled RAP. All rates were converted to equivalent U.S. dollars and are shown in Table 1 together with the analyzed hauling distances.
Unit Prices Used in Cost–Benefit Analysis
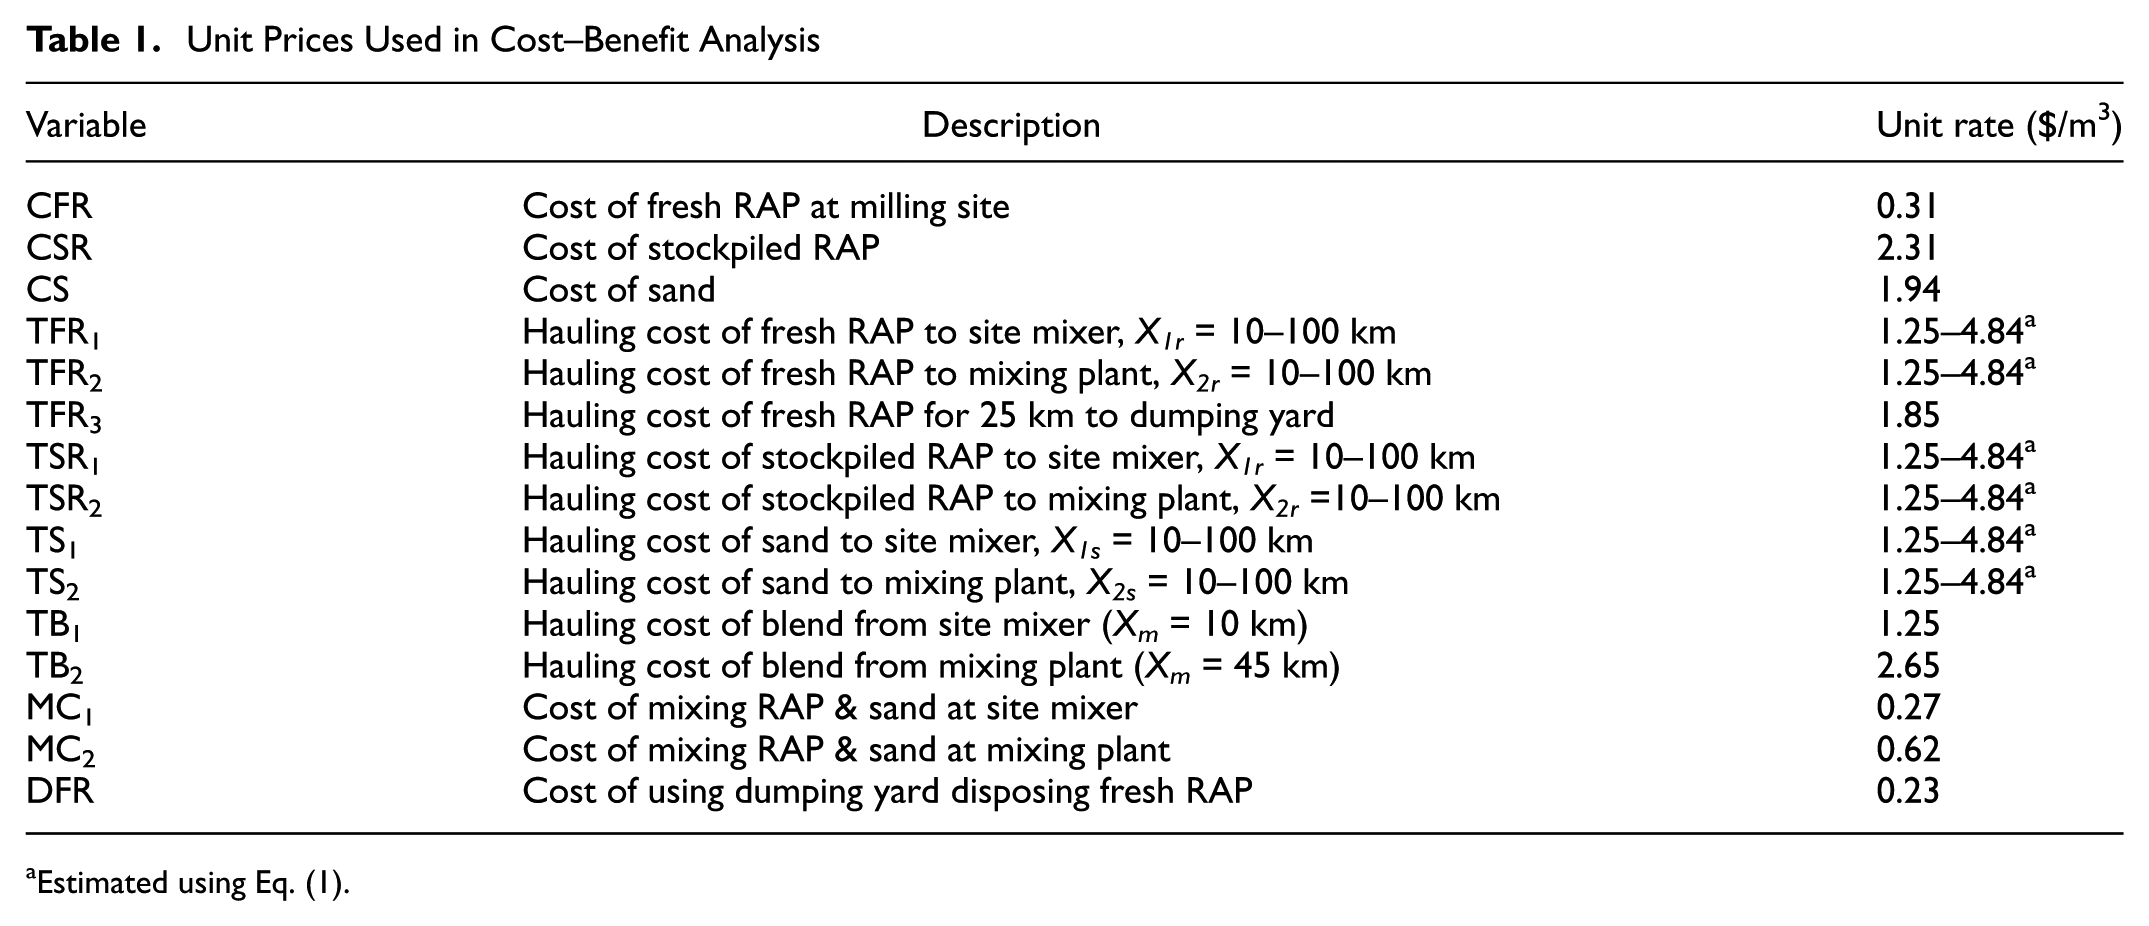
Estimated using Eq. (1).
In this analysis, the two mixing methods, site mixer and mixing plant, were considered for each source of RAP material (fresh and stockpiled), resulting in the following four options:
↑
↑
↑
↑
For each option, the unit cost of the RAP–sand blend was estimated considering various hauling distances from the source to blend mixer and then from mixer to the construction site, as shown in Table 1. The total hauling distance for each case is calculated using the following equation.

Where XTH is the total hauling distance (km), Xr and Xs are the hauling distances (km) of individual materials before mixing, and Xb is the hauling distance of blend after mixing. The multiplier (0.5) in this equation represents the content of each material in the blend. The unit costs are then plotted against the total hauling distance as shown in Figure 4, which can be used to obtain unit rates for any combination of hauling distance. For example, if the fresh RAP and sand are 30 km and 50 km away from the mixer, respectively, and the blend is moved 10 km to site roadbed (Option 1), then the total hauling distance is equal to 50 km. This rate for this case is $4.12/m3. Corresponding distances for Options 2, 3, and 4 are 50 km, 85 km, and 85 km, and unit prices are $6.16/m3, $5.86/m3, and $7.90/m3, respectively.
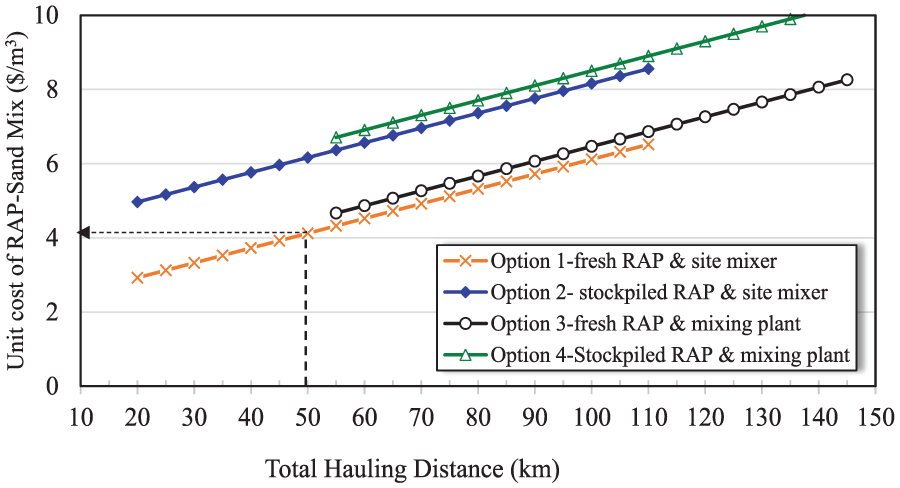
Unit cost of RAP–sand blend versus total hauling distance.
The figure shows that the unit cost increases linearly with the total hauling distance. The slope of straight lines in this graph is the same slope of the straight line of the transport cost in Equation 1. This is expected, as only the transport costs vary with the hauling distance whereas other costs are constant have impact only on the intercept of the straight line.
Scenarios of Pavement Design for Applications of RAP–Sand Blend
A total of eight (8) scenarios were considered in this analysis to quantify the benefits of using the RAP–sand blend as shown in Table 2.
Description of Scenarios Considered in Analysis
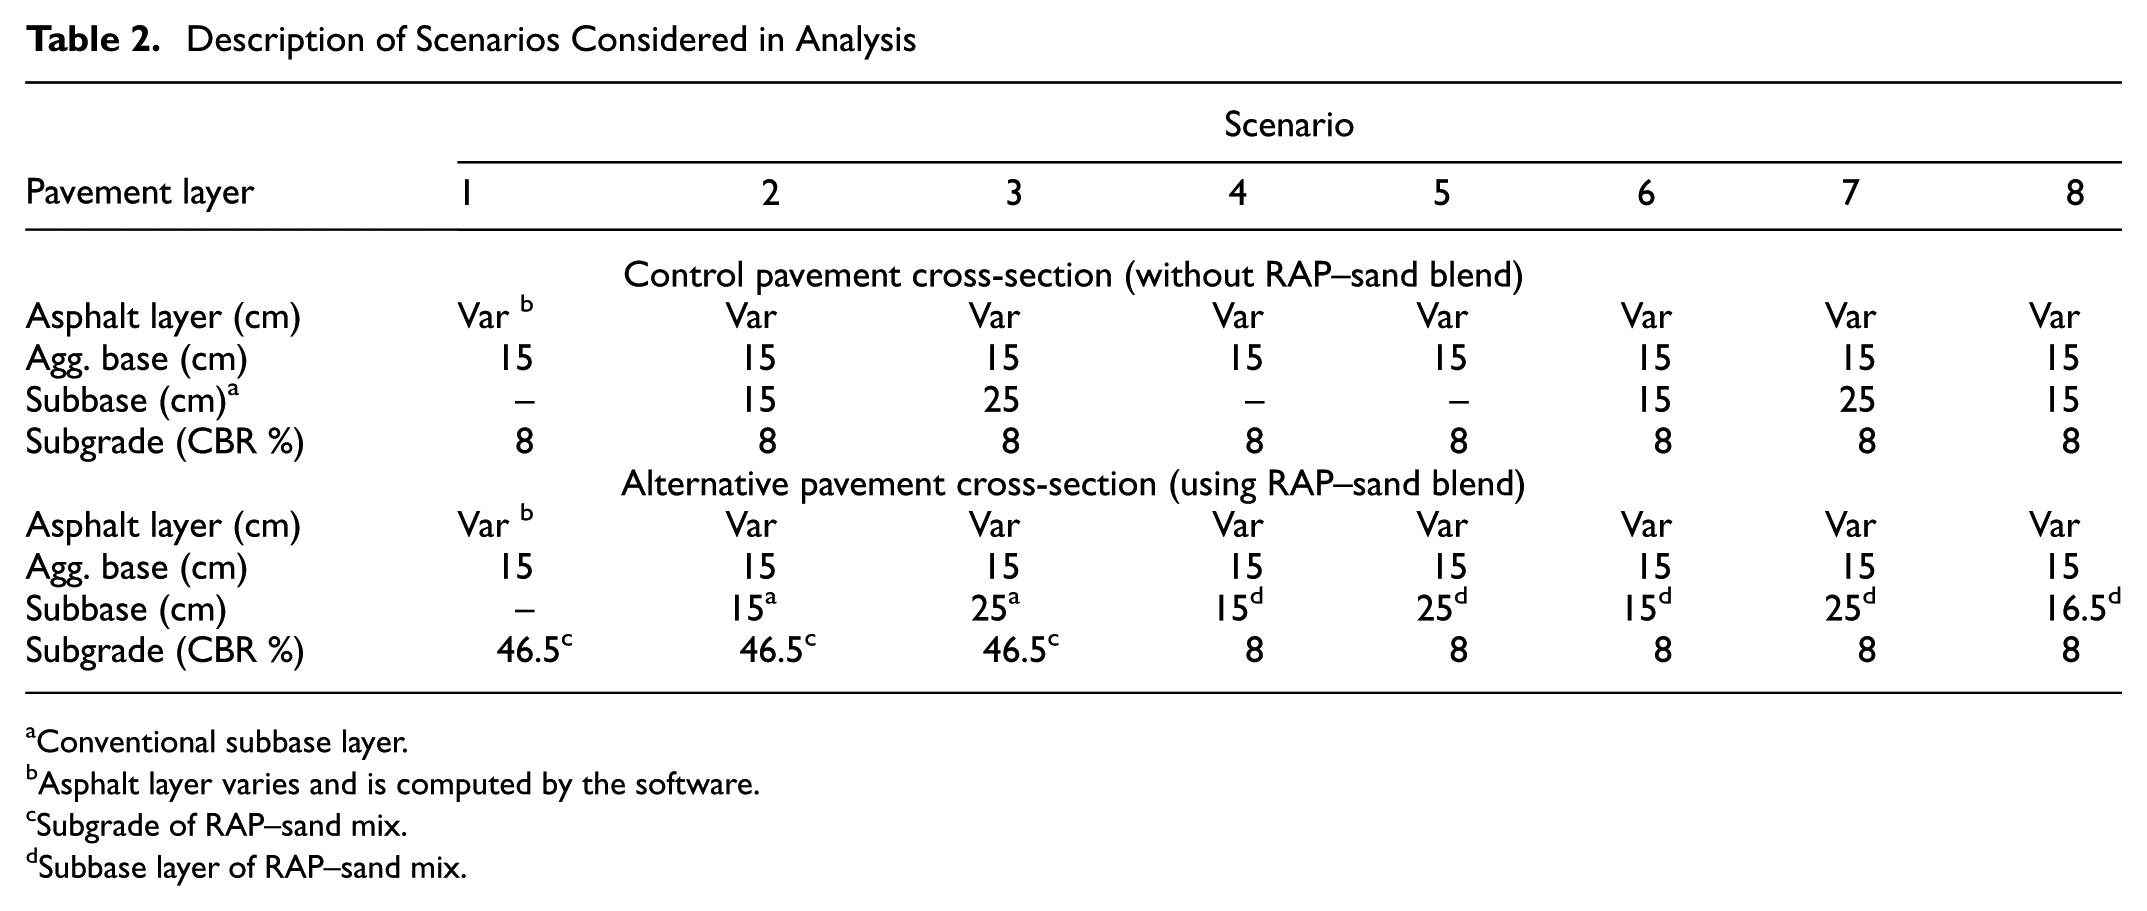
Conventional subbase layer.
Asphalt layer varies and is computed by the software.
Subgrade of RAP–sand mix.
Subbase layer of RAP–sand mix.
As shown, the scenarios are numbered Scenario 1 through Scenario 8. Each scenario compares a case where the RAP–sand blend is used with a control case without any RAP blends. The thicknesses of base and subbase in these scenarios were selected to produce different pavement structure numbers of the unbound layers and establish valuable comparisons. The structural number of certain layer having normal drainage properties is the multiplication of the layer thickness and the layer coefficient, and the latter is a function of the resilient modulus.
In general, Scenarios 1, 2, and 3 are considered to assess the use of RAP–sand blend as a stabilized subgrade. In this analysis, the thickness of subgrade layer is considered 20 cm. Scenarios 4 through 8 are considered to quantify the benefit of using the RAP–sand blend as a subbase layer whether or not a subbase layer is considered in the control pavement section.
Pavement Design of Asphalt Overlay Thickness
The M-E design was performed using a computer program named “WINFLEX 2006” ( 32 , 33 ). This software provides an option for the user to input pavement layer properties, climatic conditions, fatigue and rutting models, and traffic loading in order to obtain the required asphalt overlay thickness and the associated damages caused by fatigue and rutting. In this analysis, all variables such as axle loads, climatic conditions, and material properties of pavement layers were kept constant throughout the analysis. As previously mentioned, the modulus of resilient (Mr) of the RAP–sand blend was estimated using Equation 2 with CBR of 46.5%. Common input parameters for these runs are shown in Figure 5 for various pavement layers. In addition, the following are also considered:
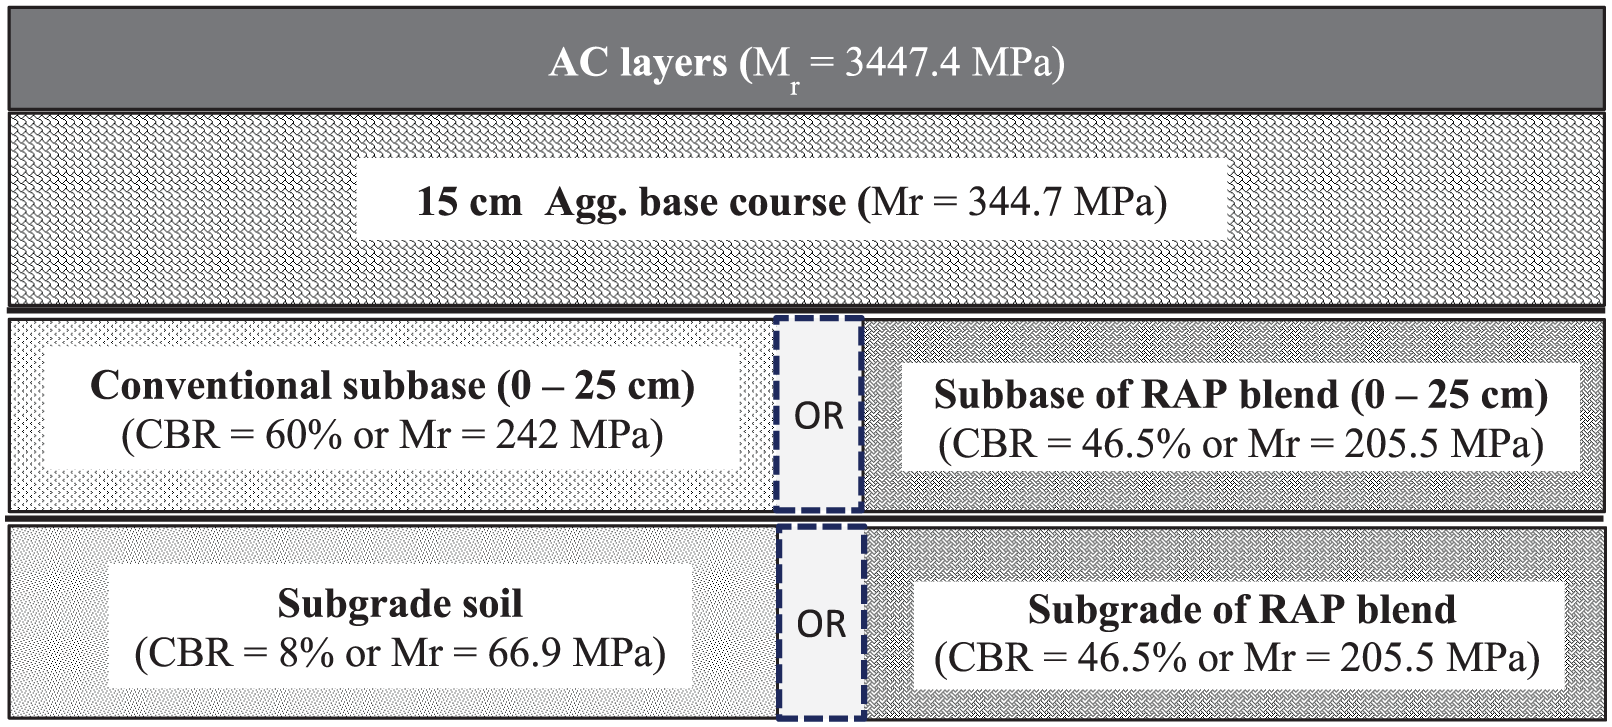
Pavement layers and their properties.
Poisson’s ratio = 0.35 for asphalt, 0.4 for subgrade, subbase, and base
ESALs = 1 to 12 million equivalent single axle loads (ESALs)
Thickness of asphalt layers = to be determined by software
Pavement temperature = Calculated by the software
Fatigue and rutting models = Asphalt Institute (built-in in software)
For each scenario, the control pavement section is used as the reference for comparing the gain resulting from using the RAP–sand blend. This gain is expressed in terms of reduction in the required asphalt layer thickness. This is estimated for 12 ESAL values for the eight scenarios. In total 192 computer runs were performed using the software: 96 runs for control sections without RAP and 96 runs for their counterparts of alternative sections with RAP blend. Figure 6 depicts the reduction in the asphalt layer owing to the use of RAP–sand mix for the eight scenarios. The shown reduction is the difference between asphalt thickness required by the control section less the corresponding thickness in alternative section.
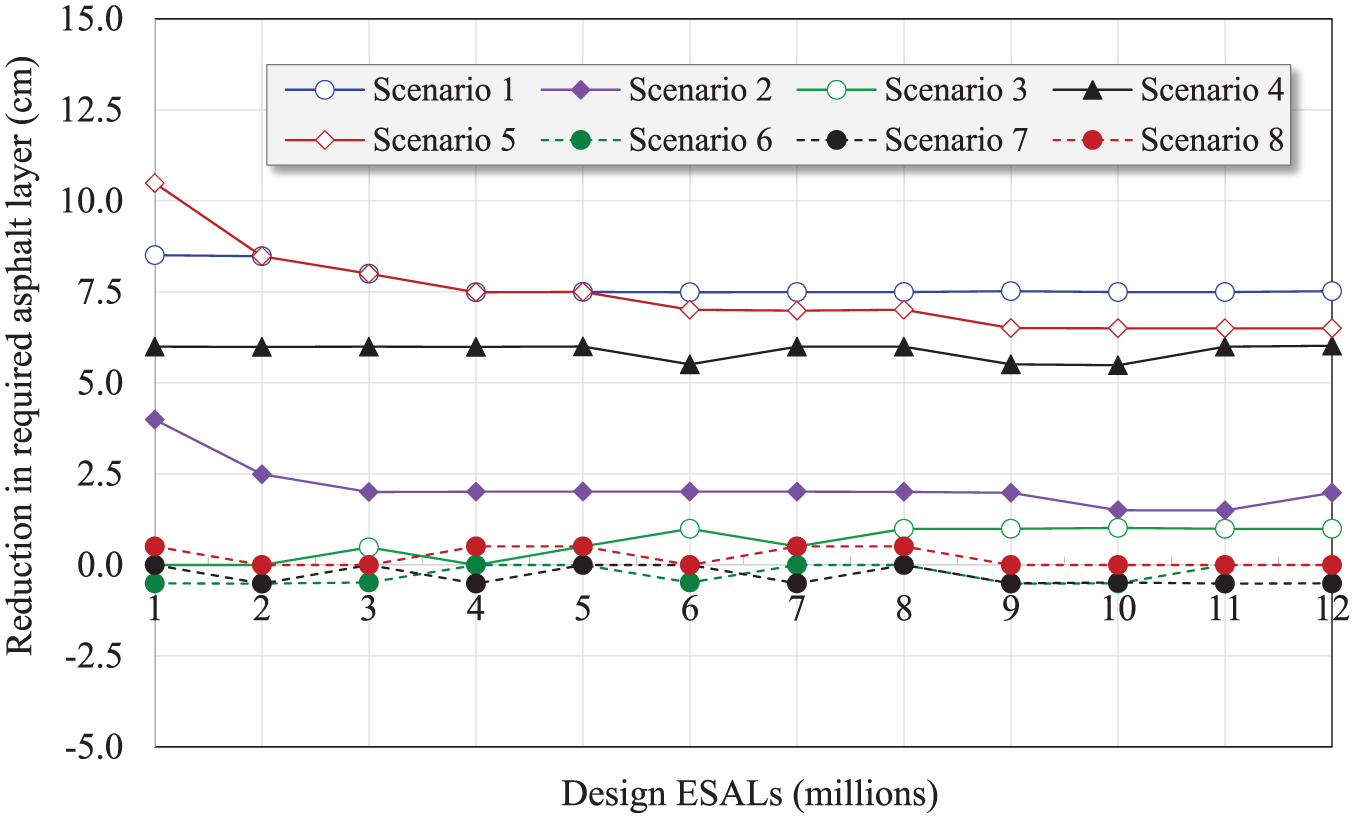
Reduction in asphalt layer for RAP–sand mix applications.
Analysis of the Pavement Design Results
The results show that Scenarios 1, 4, and 5 give the highest saving in required asphalt thickness, followed by Scenario 2. Scenarios 6 and 7 give the least saving in asphalt layer followed by Scenarios 8 and 3. Based on these results, the following can be pointed out:
↑ When the RAP–sand blend is used as stabilized subgrade (Scenarios 1, 2, and 3), the reduction in required asphalt thickness is significant only when there is no subbase layer in control section (Scenario 1). When a subbase layer is used, the reduction becomes marginal with a 15-cm subbase (Scenario 2), and even negligible with 25-cm subbase (Scenario 3).
↑ When a new subbase of RAP–sand is introduced in the alternative pavement section (Scenarios 4 and 5), an appreciable saving in the asphalt thickness is achieved, especially with Scenario 5 when 25-cm subbase is used. In fact, such reduction in asphalt thickness is expected even when a conventional material is used because adding a subbase layer increases the structural number of the unbound layers, and therefore reduces the required thickness of asphalt layer.
↑ When the RAP–sand blend is used as subbase to replace a conventional subbase layer in control section (Scenarios 6, 7, and 8), the average reduction in the asphalt layer is almost zero, reflecting the ineffective use of the RAP–sand blend.
↑ Although the analysis covered a wide range of ESALs, the results showed that the ESAL value did not have significant impact on the reduction of asphalt thickness, especially for ESALs exceeding one million.
The saving in asphalt thickness, however, must be compared with the additional cost of using the RAP–sand mix as discussed in the next sections. For this reason, all scenarios are retained for further analysis although some scenarios did not show significant impact on required asphalt thicknesses.
Cost–Benefit Analysis for Option 1
The focus in this analysis is made on Option 1 for demonstration purposes. In this option, the fresh RAP is mixed with sand at the site mixer. Furthermore, the analysis is performed on only one case in which the total hauling distance was calculated as 50 km and the unit price of the RAP–sand blend was estimated as $ 4.12/m3 (see Figure 4). In this analysis, the subgrade thickness is considered 20 cm with unit price of $1.74/m3 and the unit cost of asphalt layer is $115.15/m3.
The cost analysis is established per square meter. For Scenario 1 and 5 million ESALs, for example, the additional cost of using RAP–sand blend is estimated as the difference between the cost of RAP–sand blend and that of normal subgrade soil. This additional cost is equal 0.20 × (4.12 – 1.74) or $ 0.48/m2. From Figure 6, the reduction in asphalt thickness is 7.5 cm, yielding a saving equal to 0.075* 115.15 or $8.64/m2. This results in a net saving of $8.16/m2. This exercise is performed for each scenario for the 12 ESAL values, and results are shown in Table 3 and discussed in the following sections.
Saving ($/m2) of Option 1 for RAP–Sand Mix Application Scenarios
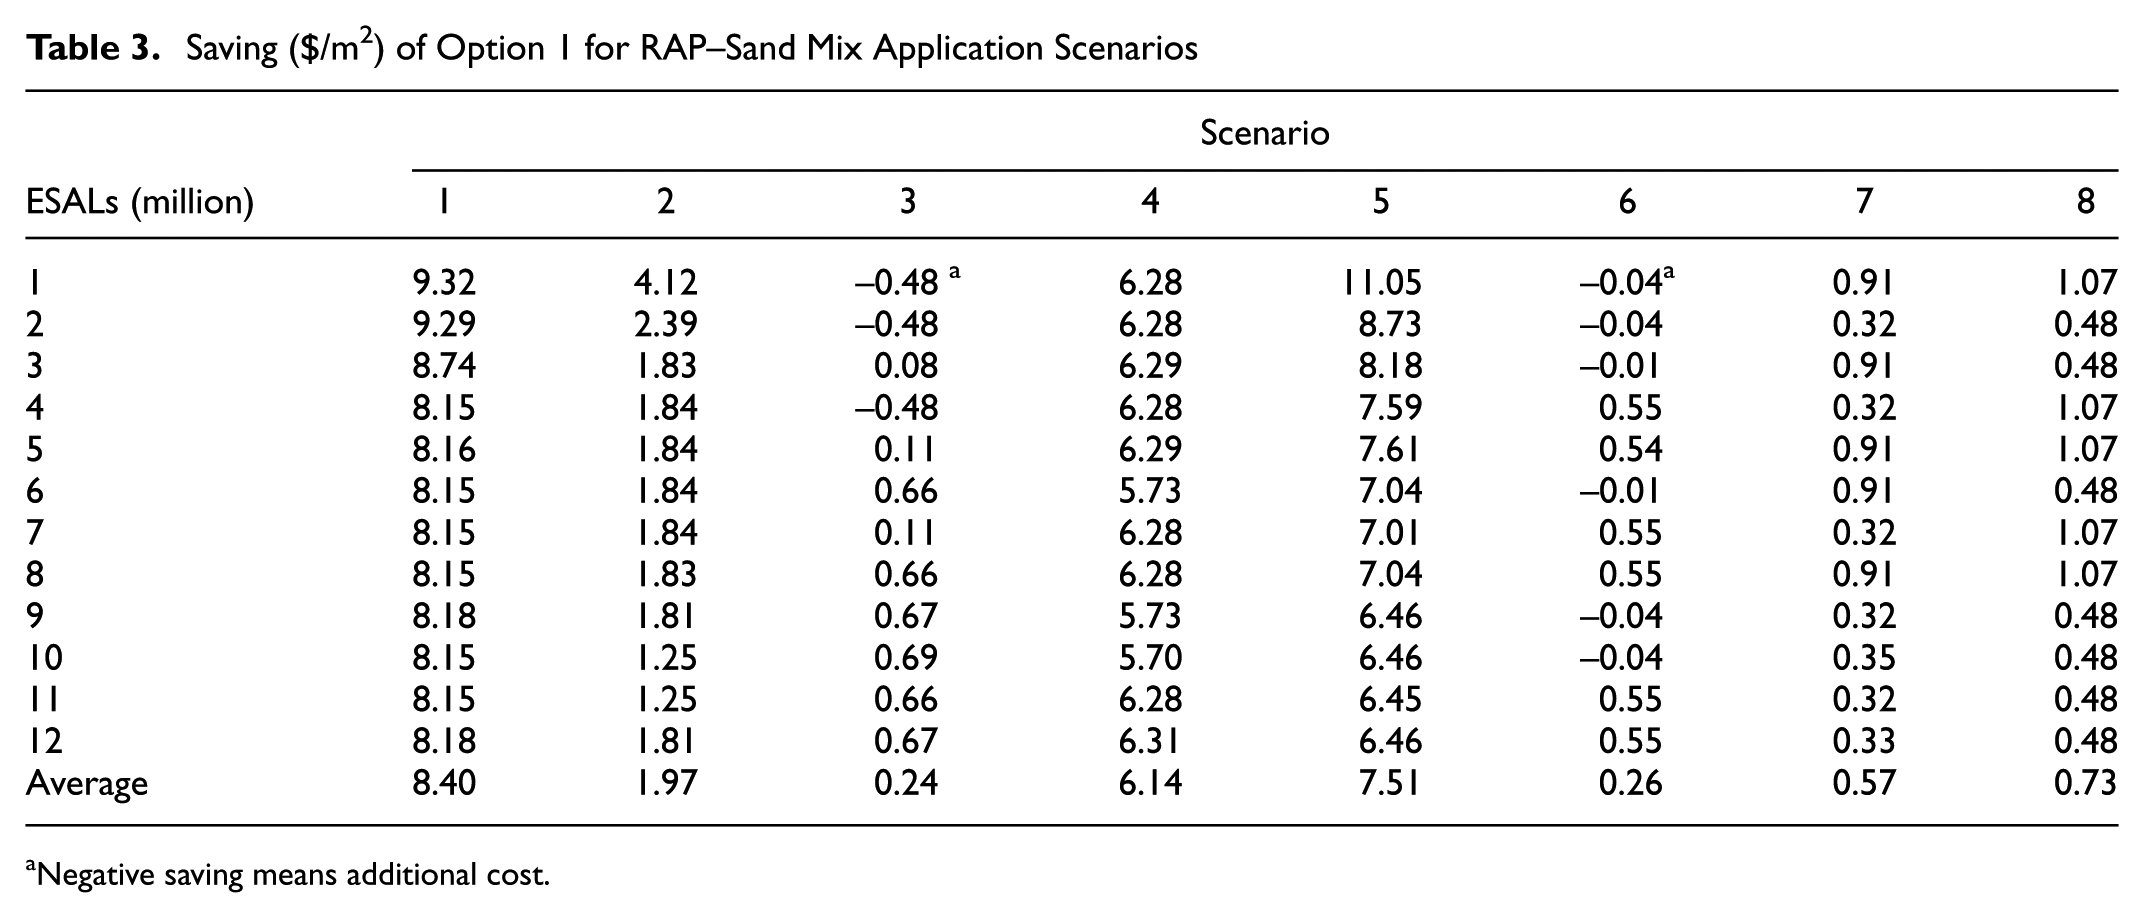
Negative saving means additional cost.
Using RAP–Sand Blend as Stabilized Subgrade (Scenarios 1, 2, and 3)
Table 3 indicates that Scenario 1 gives the highest saving among all scenarios, with an average saving of $8.40/m2. This saving is achieved when the RAP–sand blend is used as a stabilized subgrade immediately below the aggregate base course. Such saving is reduced significantly to an average of $1.97/m2 when a 15-cm subbase is used (Scenario 2) and further to $ 0.24/m2 with the use of 25-cm subbase. This is because using a subbase below the base course in the control section requires less asphalt thickness, especially with thicker subbase, and thus the use of the RAP mix is not effective.
Using RAP–Sand Blend as Subbase Layer (Scenarios 4 and 5)
In these scenarios, the introduction of a new subbase layer of RAP–sand mix in the alternative pavement section strengthens the unbound layers below the asphalt layer and thus reduces the required asphalt thickness. The average savings are $6.14/m2 and $7.51/m2 when 15-cm and 25-cm RAP–sand subbase layers are used, respectively. Although similar saving is expected even when using conventional material in the alternative pavement section, the possibility of using less costly layer of RAP–sand blend makes it an attractive and economic solution.
Using RAP–Sand Blend in Lieu of Conventional Subbase Layer (Scenarios 6, 7, and 8)
In these scenarios, the RAP–sand blend is used to replace a subbase layer considered in the control pavement section. Replacing 15-cm conventional subbase with the same thickness of RAP–sand mix (Scenario 6) resulted in average saving of $ 0.26/m2. When a 25-cm subbase is used in both control and alternative sections (Scenario 7), the average saving slightly increased to $ 0.57/m2. Finally, when 15-cm conventional subbase is replaced with RAP–sand mix of equivalent thickness (16.5 cm), the average saving is $ 0.73/m2.
In all scenarios, the ESAL value did not show significant impact on the saving in construction cost, especially when its value is above 1 million.
Benefit–Cost Ratio Analysis for the Four Options
In this analysis, the saving is divided by the additional cost to give a benefit–cost (B–C) ratio for each scenario and option. Only Scenarios 1 through 5 were included in this analysis. Other scenarios were excluded because they have insignificant net saving or they provide negative cost or saving. Figure 7 depicts the B–C ratios for the five scenarios and four options.
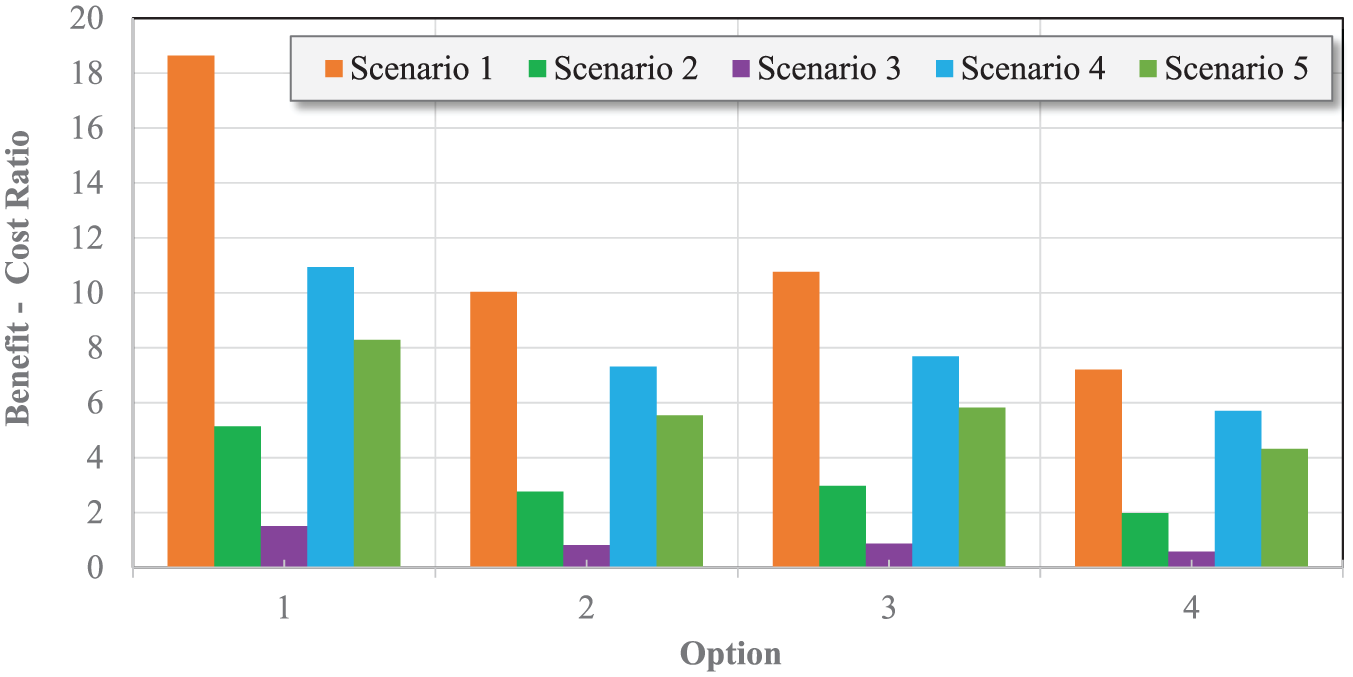
Benefit–cost ratio for different scenarios and options.
The trend of B–C ratios for various options is inversely proportional to the unit prices considered for the options. In particular, Option 1 is superior to all options, followed by Options 3 and 2, and then by Option 4. Scenario 1 is also superior to all scenarios followed by Scenarios 4 and 5 and then by Scenarios 2 and 3. As also shown, the shown B–C ratios range between 0.58 and 18.64, with Scenario 3 experiencing the least ratios.
Conclusions and Recommendations
A general methodology was proposed to conduct cost–benefit analyses for using the RAP–sand blend (50%/50%) in subgrade and subbase layers. The general findings of this study include the following:
↑ The direct comparison of unit costs indicated significant saving of up to 48.1%. This saving increases to 60% when the cost of disposing of RAP is deducted from the unit cost of blend.
↑ The general benefit–cost analysis approach, with net saving calculated based on pavement design, indicated that the saving varied significantly from one scenario to another depending on the function of RAP blend. In particular, an average saving of $9.32/m2 is achieved when RAP–sand blend is used as stabilized subgrade immediately below the aggregate base layer. This saving is reduced to $1.97/m2 and $ 0.24/m2 when using 15-cm and 25-cm subbase layers, respectively. This indicates that RAP blend is more effective when as a subgrade below a relatively thinner unbound aggregate layer.
↑ When RAP blend is used as subbase layer of 15 cm and 25 cm, the average saving is $6.14/m2 and $7.51/m2, respectively. The same concept is true here in which the blend is more effective when subbase is used below a relatively thinner unbound aggregate layer. In contrast, when RAP blend is used to replace conventional subbase layer, its impact becomes almost negligible.
↑ When more options of RAP sources, hauling distances, and mixing types are considered, the highest benefits were achieved with Option 1 that considers fresh RAP and mixing at site. Reported B–C ratios ranged between 0.58 and 18.64 depending on the scenario and option of RAP utilization, with uneconomic cases associated with Scenario 3.
↑ In all scenarios, ESALs did not show significant impacts on net saving, especially when the ESAL exceeds 1 million.
The significant savings presented this analysis encourage future implementation of this blend. However, these savings are site specific and need to be updated in view of applicable unit rates, hauling distances, and mixing procedures. It is worth pointing out that analysis presented here did not consider some cost items such as maintenance, user cost, and salvage cost, as these costs were considered similar for all scenarios. Further studies can be made for pavement life cycle costs considering specific costs for these items. Furthermore, the resilient modulus expressed the difference between original material and RAP-blend material. Negative material properties that might be caused by RAP were not considered in this analysis to keep it simple. Further studies can also be made to account for such possible negative impact.
Footnotes
Author Contributions
The authors confirm contribution to the paper as follows: study conception and design: Ragab M. Mousa, Momen R. Mousa; data collection: Ragab M. Mousa, Momen R. Mousa; analysis and interpretation of results: Ragab M. Mousa, Momen R. Mousa; draft manuscript preparation: Ragab M. Mousa, Momen R. Mousa. All authors reviewed the results and approved the final version of the manuscript.
The Standing Committee on Aggregates (AFP70) peer-reviewed this paper (19-00282).