
Abstract
AASHTO’s A Policy on Geometric Design of Highways and Streets, 6thEdition, provides design criteria for horizontal curve elements based on the point-mass model. The model equates the centripetal force needed to navigate a horizontal curve of a specific radius traveling at the design speed to the combination of superelevation rate and side friction needed to achieve that force. Few researchers have examined the safety impacts of horizontal curve radius, superelevation rate, and design speed through crash-based research. None of the research reviewed included the effects of design speed or superelevation rate in the crash modification factors (CMFs) or functions. This research explored these factors using a negative binomial regression modeling approach based on data collected from the SHRP 2 RID 2.0 for 889 horizontal curves on rural two-lane highways in Indiana and Pennsylvania, which resulted in roadway departure crash modification functions for horizontal curve radius and side friction demand. The crash modification function for side friction demand includes an interactive component of horizontal curve radius and speed and a direct effect of superelevation rate on roadway departure crashes. The results showed that roadway departure crashes are expected to increase for decreasing curve radius, increasing posted speed limit, and decreased superelevation rate. Furthermore, curve-related CMFs were sensitive to the curve radii used in their development. CMFs developed from curves with larger radii tended to result in larger CMFs. Sample applications are provided for computing the effects of changing the horizontal curve radius, posted speed limit, or both on proposed alternatives.
A Policy on Geometric Design of Highways and Streets, 6 thEdition (herein referred to as the Green Book) ( 1 ), published by the American Association of State Highway and Transportation Officials (AASHTO), provides design criteria for horizontal curve elements based on the point-mass model. The model equates the centripetal force needed to navigate a horizontal curve of a specific radius traveling at the design speed to the combination of superelevation rate and side friction needed to achieve that force as shown in Equation 1:

where
The limiting values for side friction used in the Green Book were established in the 1940s and are based on driver comfort thresholds ( 2 ). Few researchers have examined the independent safety effects of horizontal curvature or superelevation rate on crash frequency. No research of which the authors are aware has examined the combined effects on rural, two-lane highways. The Highway Safety Manual (HSM) provides crash modification factors (CMFs) for horizontal curve radii (including curve length and the presence of a spiral transition) and for superelevation deficiency ( 3 – 5 ). Other researchers have developed crash modification functions for horizontal curve radii (or degree of curvature) similar to that found in the HSM ( 6 – 8 ). At least one evaluation looked at the safety impacts of flattening existing horizontal curves ( 9 ). Bauer and Harwood found that the CMF for horizontal curves varies when considered in combination with different types of vertical alignments; however, as with other studies, the results consistently indicate that a larger curve radius is associated with fewer predicted crashes ( 10 ). None of the research reviewed included the effects of design speed or superelevation rate in the CMFs or functions. In this research, the posted speed limit was substituted for design speed based on available data.
An understanding of the relationship between side friction demand and safety at horizontal curves is needed, with potential applications of this knowledge for both performance-based design and substantive road safety management practices. The objective of this research is to explore and capture key features of the side friction demand–safety relationship relevant to designers and based on the following considerations:
Horizontal alignment is likely to be most strongly related to the expected number of roadway departure (RD) crashes, defined as a crash occurring after a vehicle crosses an edge line or center line, or otherwise leaves the traveled way ( 11 ).
Horizontal curve radius is very likely associated with the expected number of RD crashes in a non-linear fashion. The sensitivity of the expected number of RD crashes to a change in the horizontal curve radius is expected to be highest when the radius is smaller, and decrease as the radius increases (e.g., the safety benefit of increasing a radius from 500 to 750 Ft is expected to be larger than the safety benefit of increasing a radius from 1,000 to 1,250 Ft). If this is true, an “inverse radius” specification is likely to be appropriate.
The impact of the radius on RD crashes is likely to vary with speed (e.g., the safety benefit of increasing a radius from 500 to 750 Ft is expected to be substantially higher on high speed roads compared with lower speed roads). Using Equation 1, the side friction demand can be used to capture the interactive effect of speed and horizontal curve radius.
The frequency of RD crashes is likely to vary with the superelevation rate. Using Equation 1, the side friction demand also accounts for the superelevation rate, but the effect does not interact with speed and horizontal curve radius.
The frequency of RD crashes on a horizontal curve is likely to change because of the combination of curve radius and the presence of a normal crown (as opposed to a reverse crown or a larger design superelevation rate).
The remainder of this paper provides a brief overview of the data, the analytical method used, the resulting models for RD crashes and fatal and injury roadway departure (FI RD) crashes, and an application methodology for the practical use of the results of this research.
Data Summary
The authors obtained a copy of the second Strategic Highway Research Program (SHRP 2) RID 2.0 from the Center for Transportation Research and Education (CTRE) at Iowa State University. This dataset is derived from a mobile LiDAR (Light Detection And Ranging) data collection effort. The SHRP 2 RID project team collected data in six states along roads that were most frequently driven by participants in the previously conducted SHRP 2 Naturalistic Driving Study (NDS). These states include Florida, Indiana, New York, North Carolina, Pennsylvania, and Washington.
In addition to its compatibility with the NDS, the RID provides the opportunity to use its high-quality roadway inventory data for research on the effects of roadway design and traffic control strategies on highway safety. The RID includes a variety of high-resolution roadway attributes in geographic information systems format.
Data Collection
The road segments used for analysis and modeling each consisted of one horizontal curve (i.e., each observation was defined by the observed number of RD crashes occurring on an individual horizontal curve during the observation period). This section outlines the method used for collecting data associated with eligible horizontal curves and their associated roadway tangents in Pennsylvania and Indiana. The study team identified these two states as the most likely to have rural, two-lane horizontal curves within the RID dataset. Eligible study curves met the following criteria:
Unincorporated, rural location.
Two undivided bidirectional through lanes only (no dedicated turn or acceleration lanes).
There is at least a 300-ft tangent segment between adjacent horizontal curves.
Horizontal Curve Collection
The SHRP 2 RID 2.0 stores horizontal curves in a bidirectional format, with two linear elements representing each travel direction along the curve. Attributes associated with each curve direction are stored within the existing horizontal curve feature class for each state. The project team queried the Pennsylvania and Indiana RID geodatabases to identify eligible rural, two-lane curves using the python-based Dynamic Segmentation Tool developed by CTRE. The team then compared the reduced curve output dataset against the entire state RID inventory to remove rural, two-lane curves that fell within 300 Ft of an adjacent horizontal curve (i.e., one or both of the approach tangents were less than 300 Ft in length).
A unique ID was assigned to each directional pair of eligible curves, which allowed directional attributes to be merged into a single curve observation. The project team utilized the unique curve ID to generate average values along the curve and reconcile attribute differences between travel directions. As a result, attributes for average curve radius, grade, curve length, and presence of a superelevated cross-section versus a normal crown were aggregated. In addition, information on posted speed limit, advisory speed, and the presence of curve warning signs, chevrons, rumble strips, roadside barriers, intersections, and lighting were also aggregated.
The RID data provided high-quality superelevation rate data by horizontal curve direction, which afforded an opportunity to identify superelevated curves and curves with a normal crown. For superelevated curves, the average superelevation rate for the two directions was computed.
Crash Data
Pennsylvania and Indiana state crash data from 2006 through 2013 were provided as part of the RID. Originally, 3 years of data were included in the analysis dataset, but the dataset was expanded to include 2008 through 2013 data to increase the sample size and to coincide with available annual average daily traffic (AADT) data to the extent possible. Curve-related crashes were defined as those that occurred within 150 Ft upstream of the point of curvature or point of tangent, or those that fell within the limits of the horizontal curve. RD crashes were identified using the manner of collision variable associated with each state’s crash data. The collision codes included in the RD definition included non-collision, head-on, sideswipe (same direction), sideswipe (opposite direction), hit fixed object, and ran off road.
These crash types were sorted into the following two categories for further analysis: (1) the total number of RD crashes and (2) the number of FI RD crashes along a given curve. Although Pennsylvania crash data included the KABCO (injury scale in which K = fatal (killed), A = incapacitating injury, B = nonincapacitating injury, C = possible injury, and O = property damage only) designation for maximum injury severity, the available Indiana dataset only referenced fatal, injury, and property damage only crashes. For the present study, all fatal and injury crashes were combined to allow for comparison between states. Table 1 includes a summary of RD and FI RD crashes by state.
Horizontal Curve Summary Statistics
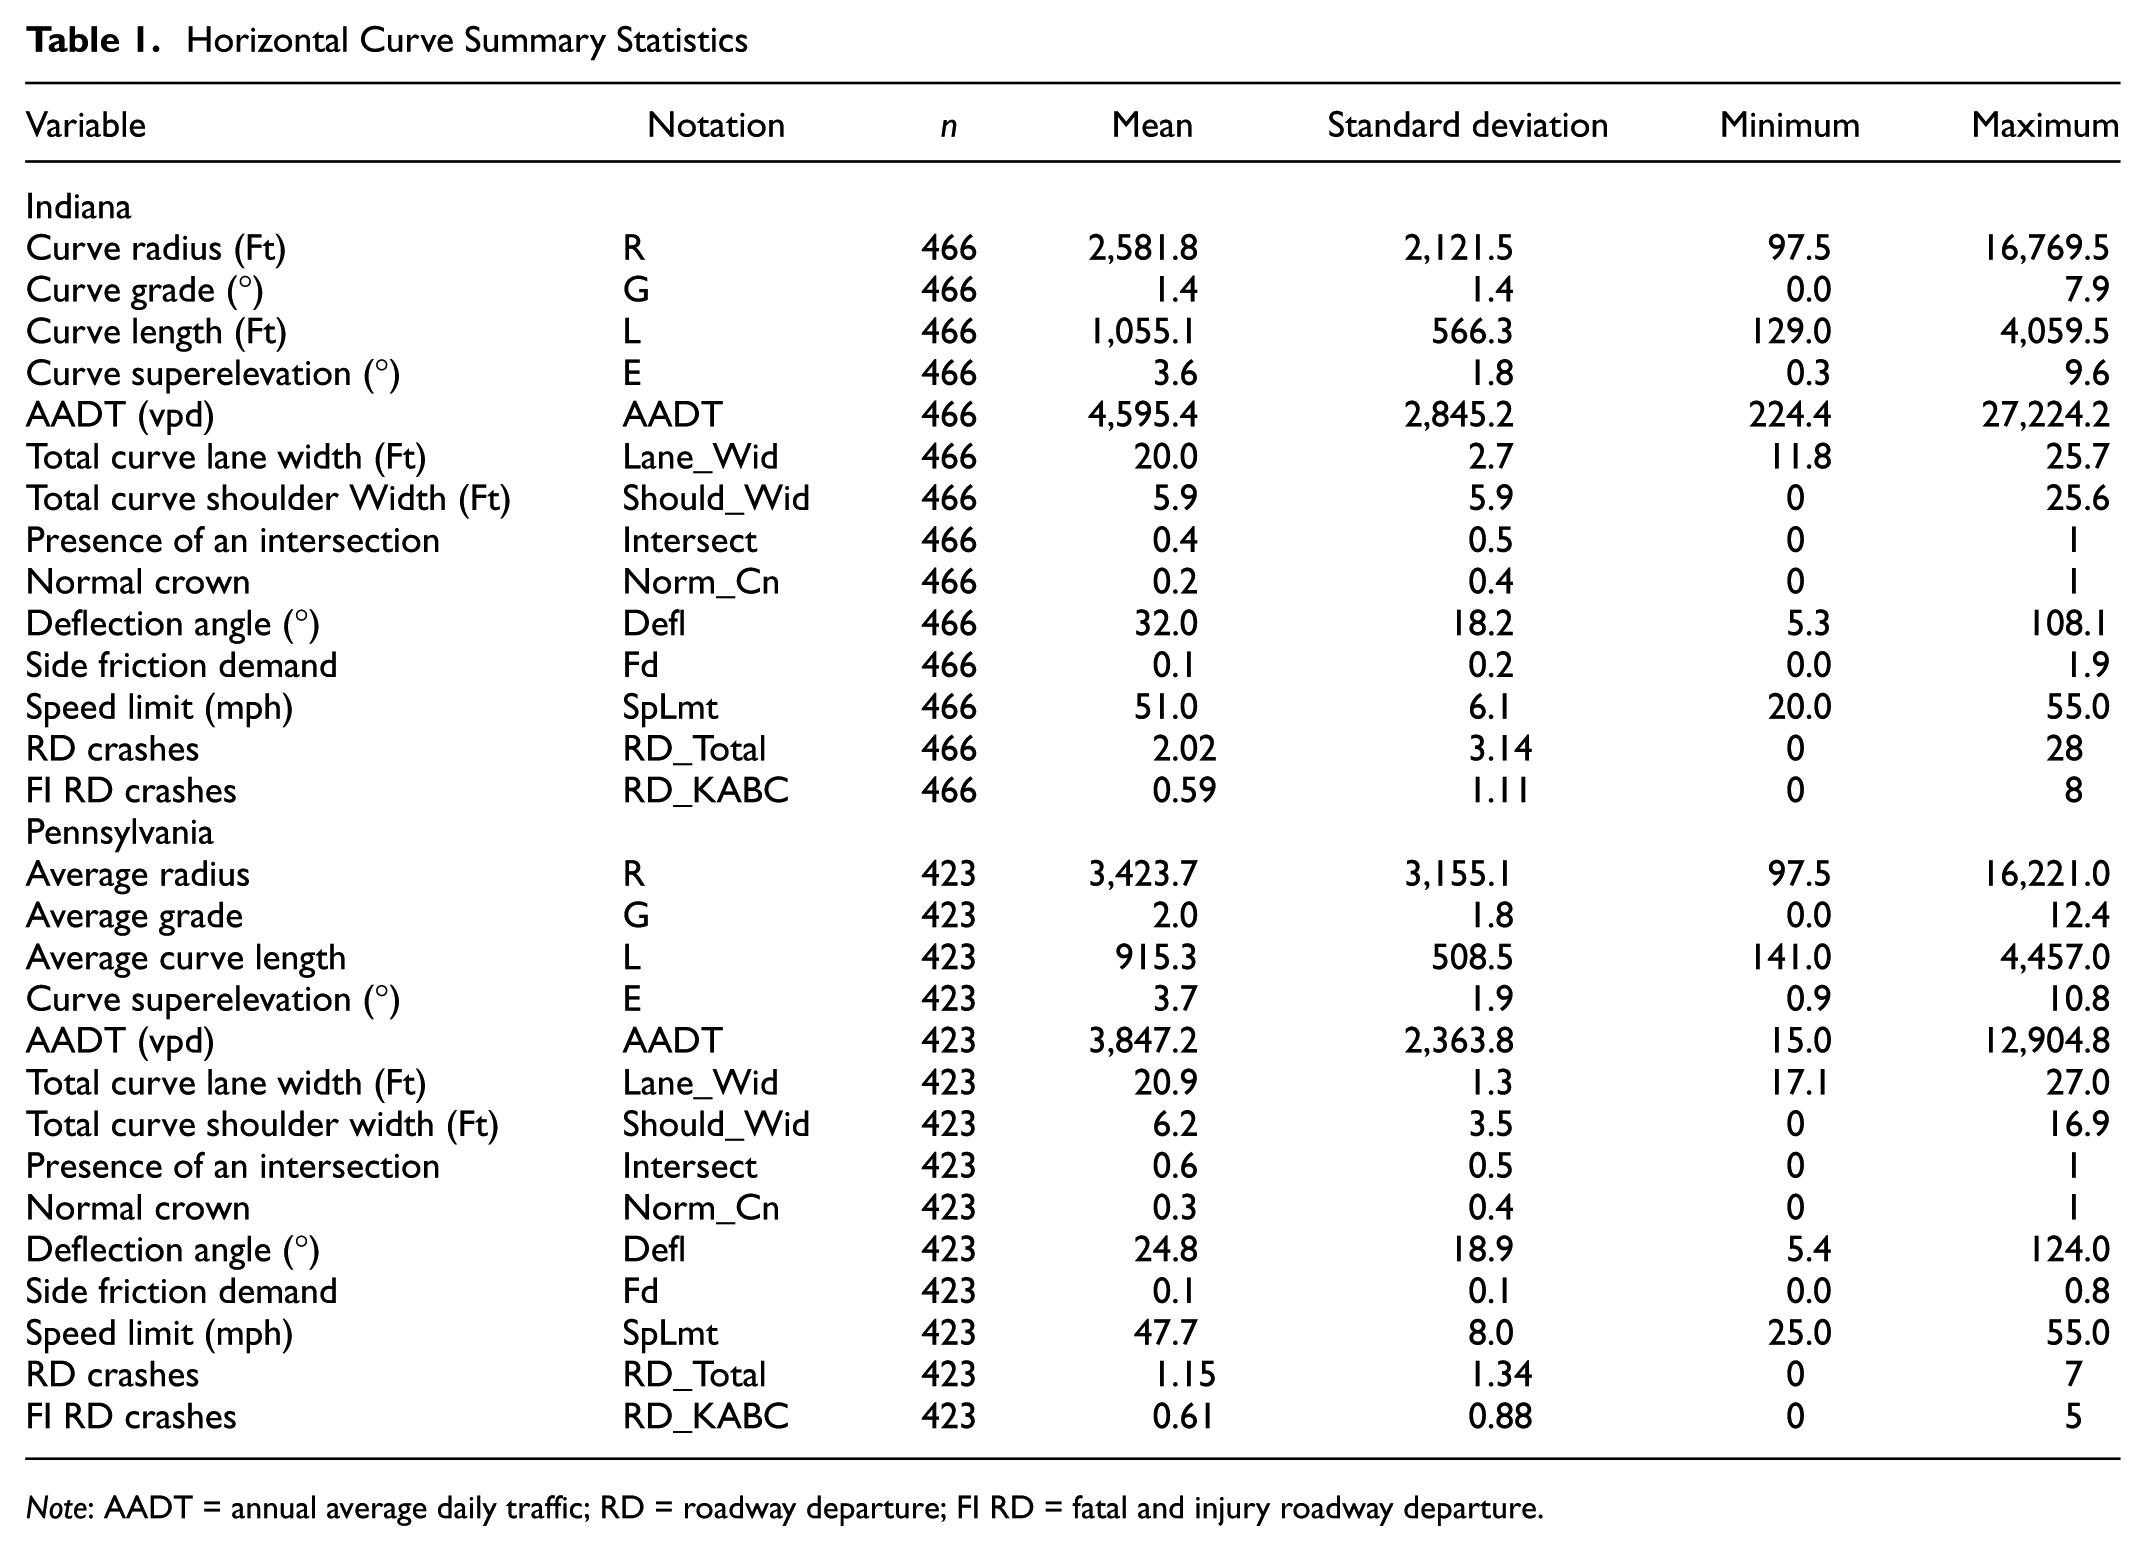
Note: AADT = annual average daily traffic; RD = roadway departure; FI RD = fatal and injury roadway departure.
The RD and FI RD crash rates for Pennsylvania were 1.09 crashes/mile/year and 0.580 crashes/mile/year, respectively. The RD and FI RD crash rates for Indiana were 1.67 crashes/mile/year and 0.49 crashes/mile/year, respectively.
Annual Average Daily Traffic Data Collection
Pennsylvania AADT data were available between 2011 and 2013 (inclusive). Indiana AADT data were available between 2009 and 2012 (inclusive). It was assumed that the earliest or latest year of observed AADT values were valid proxies for any study period years outside of the range for which data were available. This approach is consistent with that in the Part C “Predictive Method” chapters of the HSM.
Data Summary
Table 1 provides the summary statistics for data associated with the study curves in Indiana and Pennsylvania, separately. The dataset includes 466 horizontal curves in Indiana and 423 horizontal curves in Pennsylvania.
Analytical Method
A cross-sectional study design with count regression modeling was used to quantify the relationship between expected crash frequency and horizontal curve radius and side friction demand. A cross-sectional study design is a type of observational study used to analyze a representative sample of observations at a specific point in time. The safety effect is estimated by taking the ratio of the estimated expected crash frequency for two groups, one with the feature of interest (or with a feature of interest under a proposed condition) and the other without the feature of interest (or with a feature of interest under an existing condition). In this case, the feature of interest is the horizontal curve radius or side friction demand under a proposed condition versus an existing condition. For this method to work, the two groups should be similar in all regards except for the feature of interest. In practice, this is difficult to accomplish, and multivariable regression models were used to estimate the safety effects of one feature while controlling for other characteristics that vary among sites.
In this study, expected RD crash frequency was the dependent variable of interest and the explanatory variables listed in Table 1 were considered for the right-hand-side of the model, including traffic volumes and other roadway characteristics. Regression coefficients were estimated during the modeling process for each of the explanatory variables. The coefficients represent the expected change in the dependent variable (expected RD crash frequency) as a result of a unit change in the explanatory variable, all things being equal.
The current state of the practice for developing statistical road safety models of this type is to assume a log-linear relationship between expected crash frequency and site characteristics. generalized linear modeling techniques were applied to develop the models, and a log-linear relationship was specified using a negative binomial error structure. The negative binomial error structure also has advantages over the Poisson distribution in that it allows for over-dispersion that is often present in crash data (i.e., the variance is greater than the mean). It is typical in statistical road safety modeling for this “additional dispersion” to be specified as a dispersion parameter multiplied by the expected number of crashes squared (NB-2 model). Therefore, the models of the expected number of RD crashes for this analysis were structured as shown in Equation 2:

where
λi = expected number of RD crashes for the ith observation, with an observation in this analysis being the horizontal curve of interest,
Xi = a matrix of explanatory variables associated with λi, including horizontal curve radius or side friction demand,
β = a vector of parameters to be estimated that quantify the relationships between the explanatory variables and λi, and
εi = a disturbance term, where EXP(εi) is gamma-distributed with a mean equal to one and variance equal to αi.
In the NB-2 model, the variance in the expected number of crashes is then written as λi+αiλi 2 .
There are several potential sources of bias in the development of statistical road safety models. These are described in the following list with an explanation of why they were dismissed or how they were addressed:
Selection of appropriate functional form. Functional form relates to the overall form of the model and the form of each independent variable. The current state of the practice was used for the overall form of the model (i.e., log-linear relationship), and exploratory data analysis techniques were used to identify an appropriate form for each predictor.
Accounting for state-to-state differences. Data from two states were used to develop the models and an indicator variable was included in the model specifications to identify the respective state for each site.
Correlation among independent variables. Correlation refers to the degree of association among variables. A high degree of correlation among the predictor variables makes it difficult to determine a reliable estimate of the effects of specific predictor variables. The correlation matrix was examined to determine the extent of correlation among the independent variables.
Overfitting of prediction models. Overfitting is related to the law of diminishing returns. At some point, it is not worth adding any more independent variables to the model because they do not significantly improve the model fit. Overfitting also increases the opportunity to introduce correlation in the model, and the opportunity for small samples when indicator variables are considered. Several combinations of predictor variables were considered, and relative goodness-of-fit measures (e.g., likelihood ratio) were employed to penalize models with more estimated parameters.
Low sample mean and sample size. Low sample mean was mitigated by expansion of the number of sites where data were collected. Sample size was not an issue for RD crashes.
Endogenous independent variables. Endogeneity arises when one or more of the independent variables depend on the dependent variable. For example, within curve traffic control devices such as chevrons may be installed because of the frequency of RD crashes. A cross-sectional model that predicts RD crash frequency based on the presence of chevrons and other factors may conclude that chevrons increase RD crashes. Endogeneity was dismissed as a concern since study approaches were selected independent of crash history, and because horizontal curve radius and side friction demand are inherent curve characteristics rather than a safety treatment or countermeasure.
Omitted variable bias. It is difficult to completely account for the potential effects of omitted variable bias in an observational cross-sectional study. In this case, omitted variable bias was addressed to the extent possible by using the RID 2.0 database, which included several roadway characteristics related to crash frequency.
The Variable Introduction Exploratory Data Analysis method, as described by Hauer in his book The Art of Regression Modeling in Road Safety, was used to explore the functional form of the horizontal curve radius in the expected crash frequency model ( 12 ). The methodology uses the ratio of observed crashes and predicted crashes (from a base model) to determine whether the variable of interest affects the predicted crash performance. If a trend is found, the variable has an impact on safety. The base model included an offset variable (accounting for curve length and number of data years), AADT, presence of an intersection, average vertical grade, total lane width, total shoulder width, and an indicator variable for Pennsylvania. The predicted number of crashes for each curve over the analysis period was saved and compared with the reported number of crashes, aggregating curves into bins by radius in 500-Ft increments.
Figure 1 provides a plot of the ratio of observed to predicted crashes for each 500-Ft bin from 250 to 8,250 Ft (as measured by the center of each bin). A value greater than 1.0 indicates that the model under-predicts crashes for a set of horizontal curves and a value less than 1.0 indicates that the model over-predicts crashes for a set of horizontal curves. In general, the base model appears to under-predict for smaller radius curves and over-predicts for flatter curves (indicating the horizontal curve radius does indeed have an impact on safety performance). The shape generally resembles a power function.
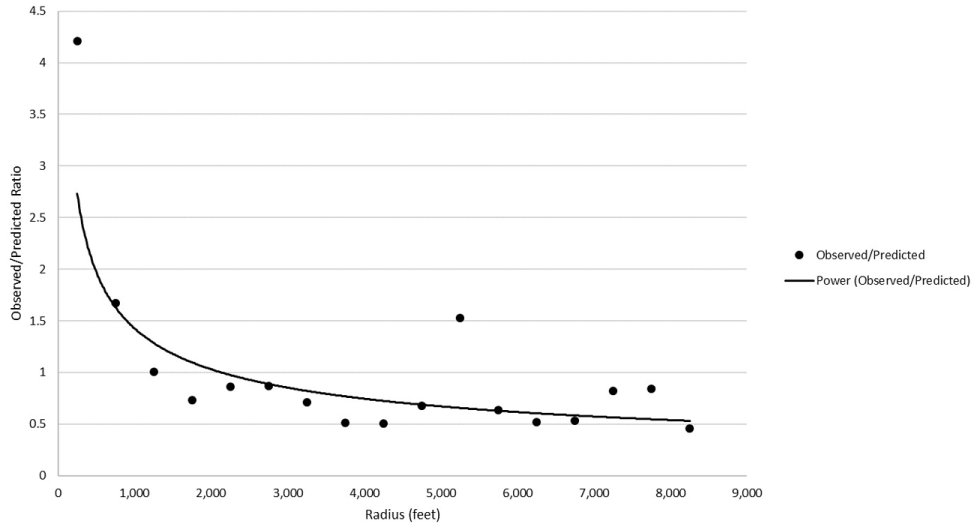
Observed to predicted crash ratio by radius.
The project team used this information to compare several functional forms for horizontal curve radius, including exponential, power, and polynomial forms. The team also explored the inverse of the horizontal curve radius, since the inverse radius flattens toward zero as the radius nears infinity (allowing for a smooth transition to tangent segments). The inverse radius form allows for greater flexibility and range for the impact of the “elbow” in crashes that generally occur on horizontal curves (i.e., once a certain radius threshold is reached, crash frequency increases at a faster rate, but the relationship is generally flat for radii above this threshold). Figure 2 compares CMFs developed from models including each functional form of horizontal curve radius. The exponential form of the horizontal curve radius was found to have the worst fit to the data and the least flexibility as a CMF. The power function fit the data approximately the same as the inverse curve radius, but the CMF elbow was less flexible. This function also includes a long, broad range of CMFs greater than 2.0. A fifth-degree polynomial was found to best fit the data and provided a generally reasonable CMF across the range of horizontal curve radii; however, this functional form provides little practical value, is difficult to interpret, and includes small fluctuations in CMFs for larger values of horizontal curve radius. Therefore, the functional form with an inverse horizontal curve radius specification was used for the final models.
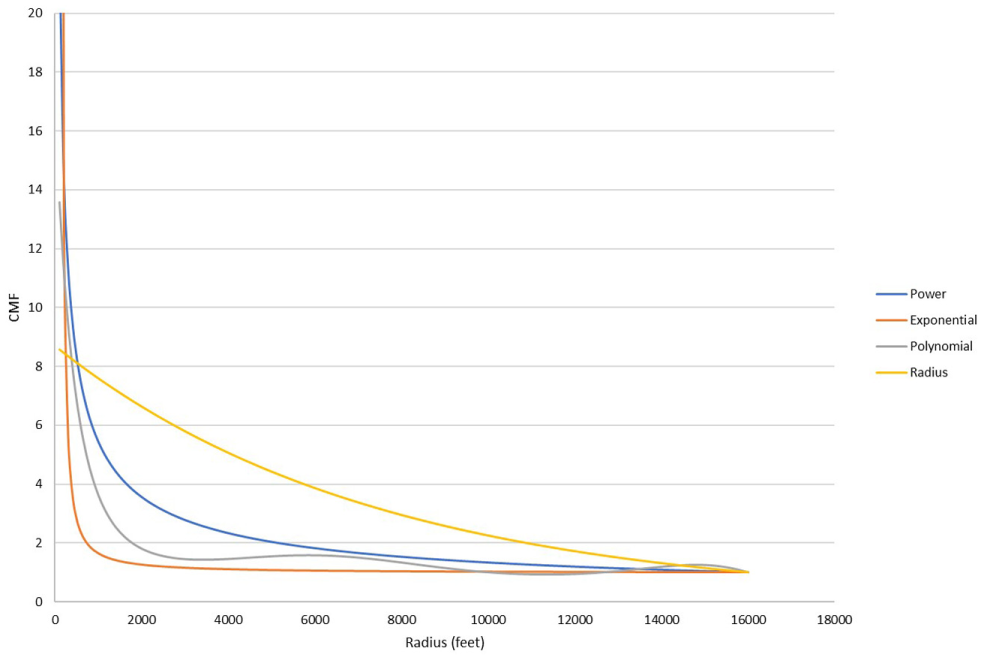
Comparison of CMFs by functional form.
Results
Tables 2 and 3 provide separate models based on the inclusion of horizontal curve radius and superelevation and friction demand, respectively. Each of the tables include two models, one for RD crashes of all severities and one for FI RD crashes. Each of the models includes variables for curve length, AADT, presence of an intersection, total lane width, total shoulder width, and an indicator for unobserved differences between Pennsylvania and Indiana.
RD Models for Inverse Radius and Normal Crown
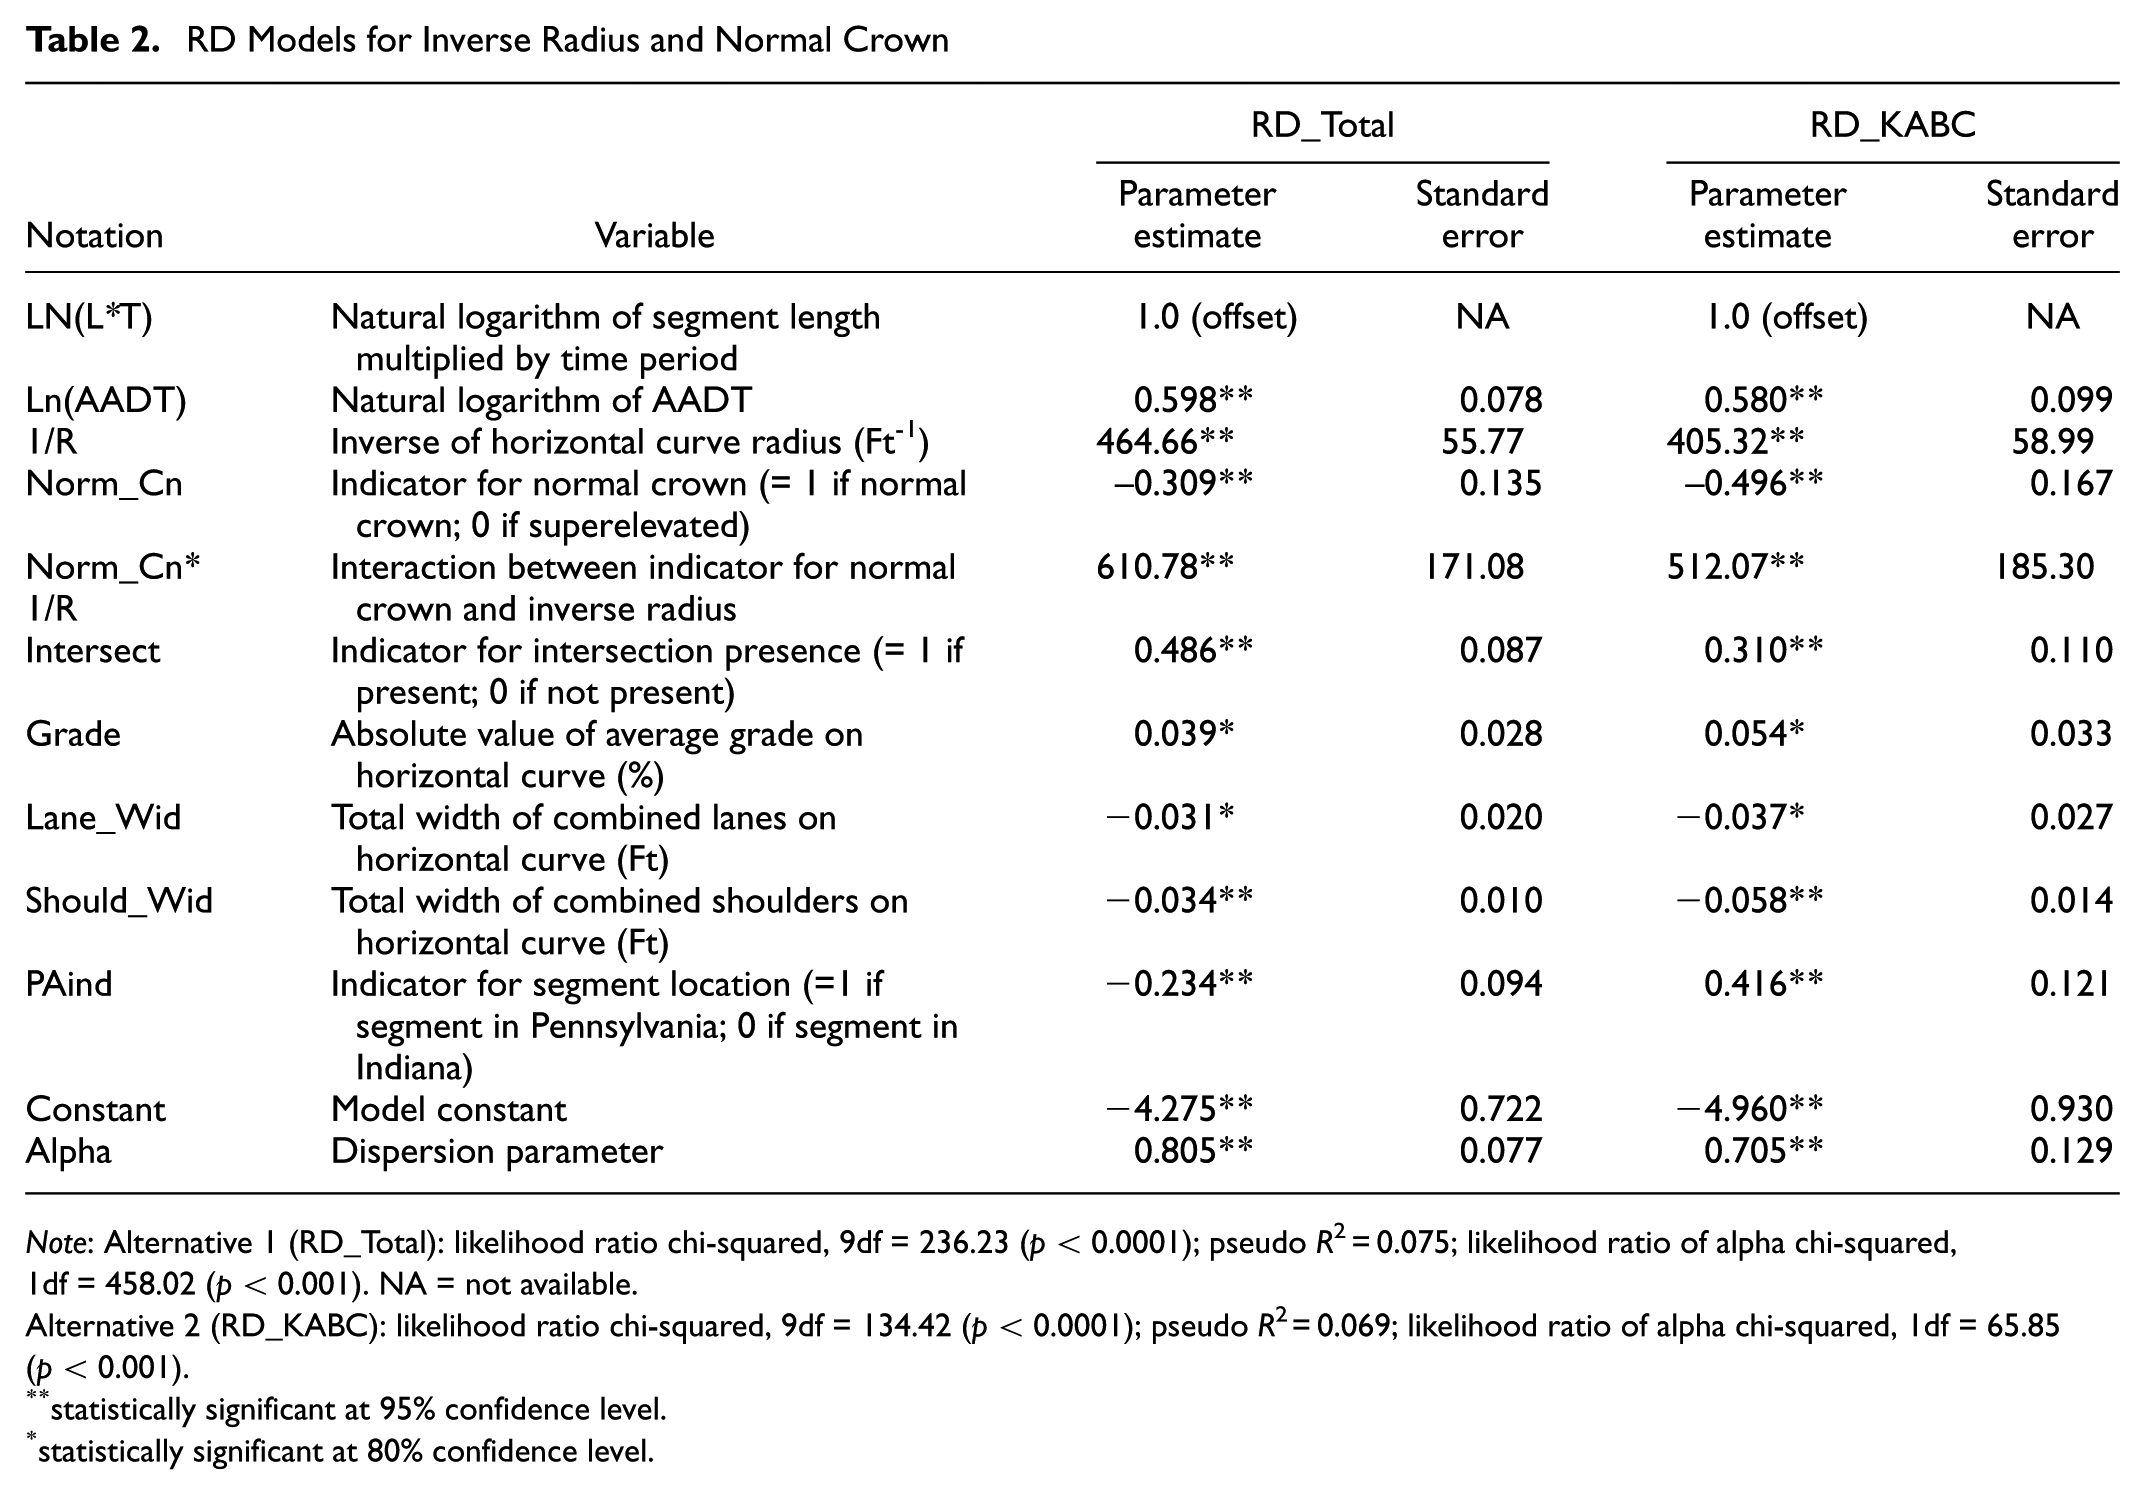
Note: Alternative 1 (RD_Total): likelihood ratio chi-squared, 9df = 236.23 (p < 0.0001); pseudo R2 = 0.075; likelihood ratio of alpha chi-squared, 1df = 458.02 (p < 0.001). NA = not available.
Alternative 2 (RD_KABC): likelihood ratio chi-squared, 9df = 134.42 (p < 0.0001); pseudo R2 = 0.069; likelihood ratio of alpha chi-squared, 1df = 65.85 (p < 0.001).
statistically significant at 95% confidence level.
statistically significant at 80% confidence level.
RD Models for Friction Demand
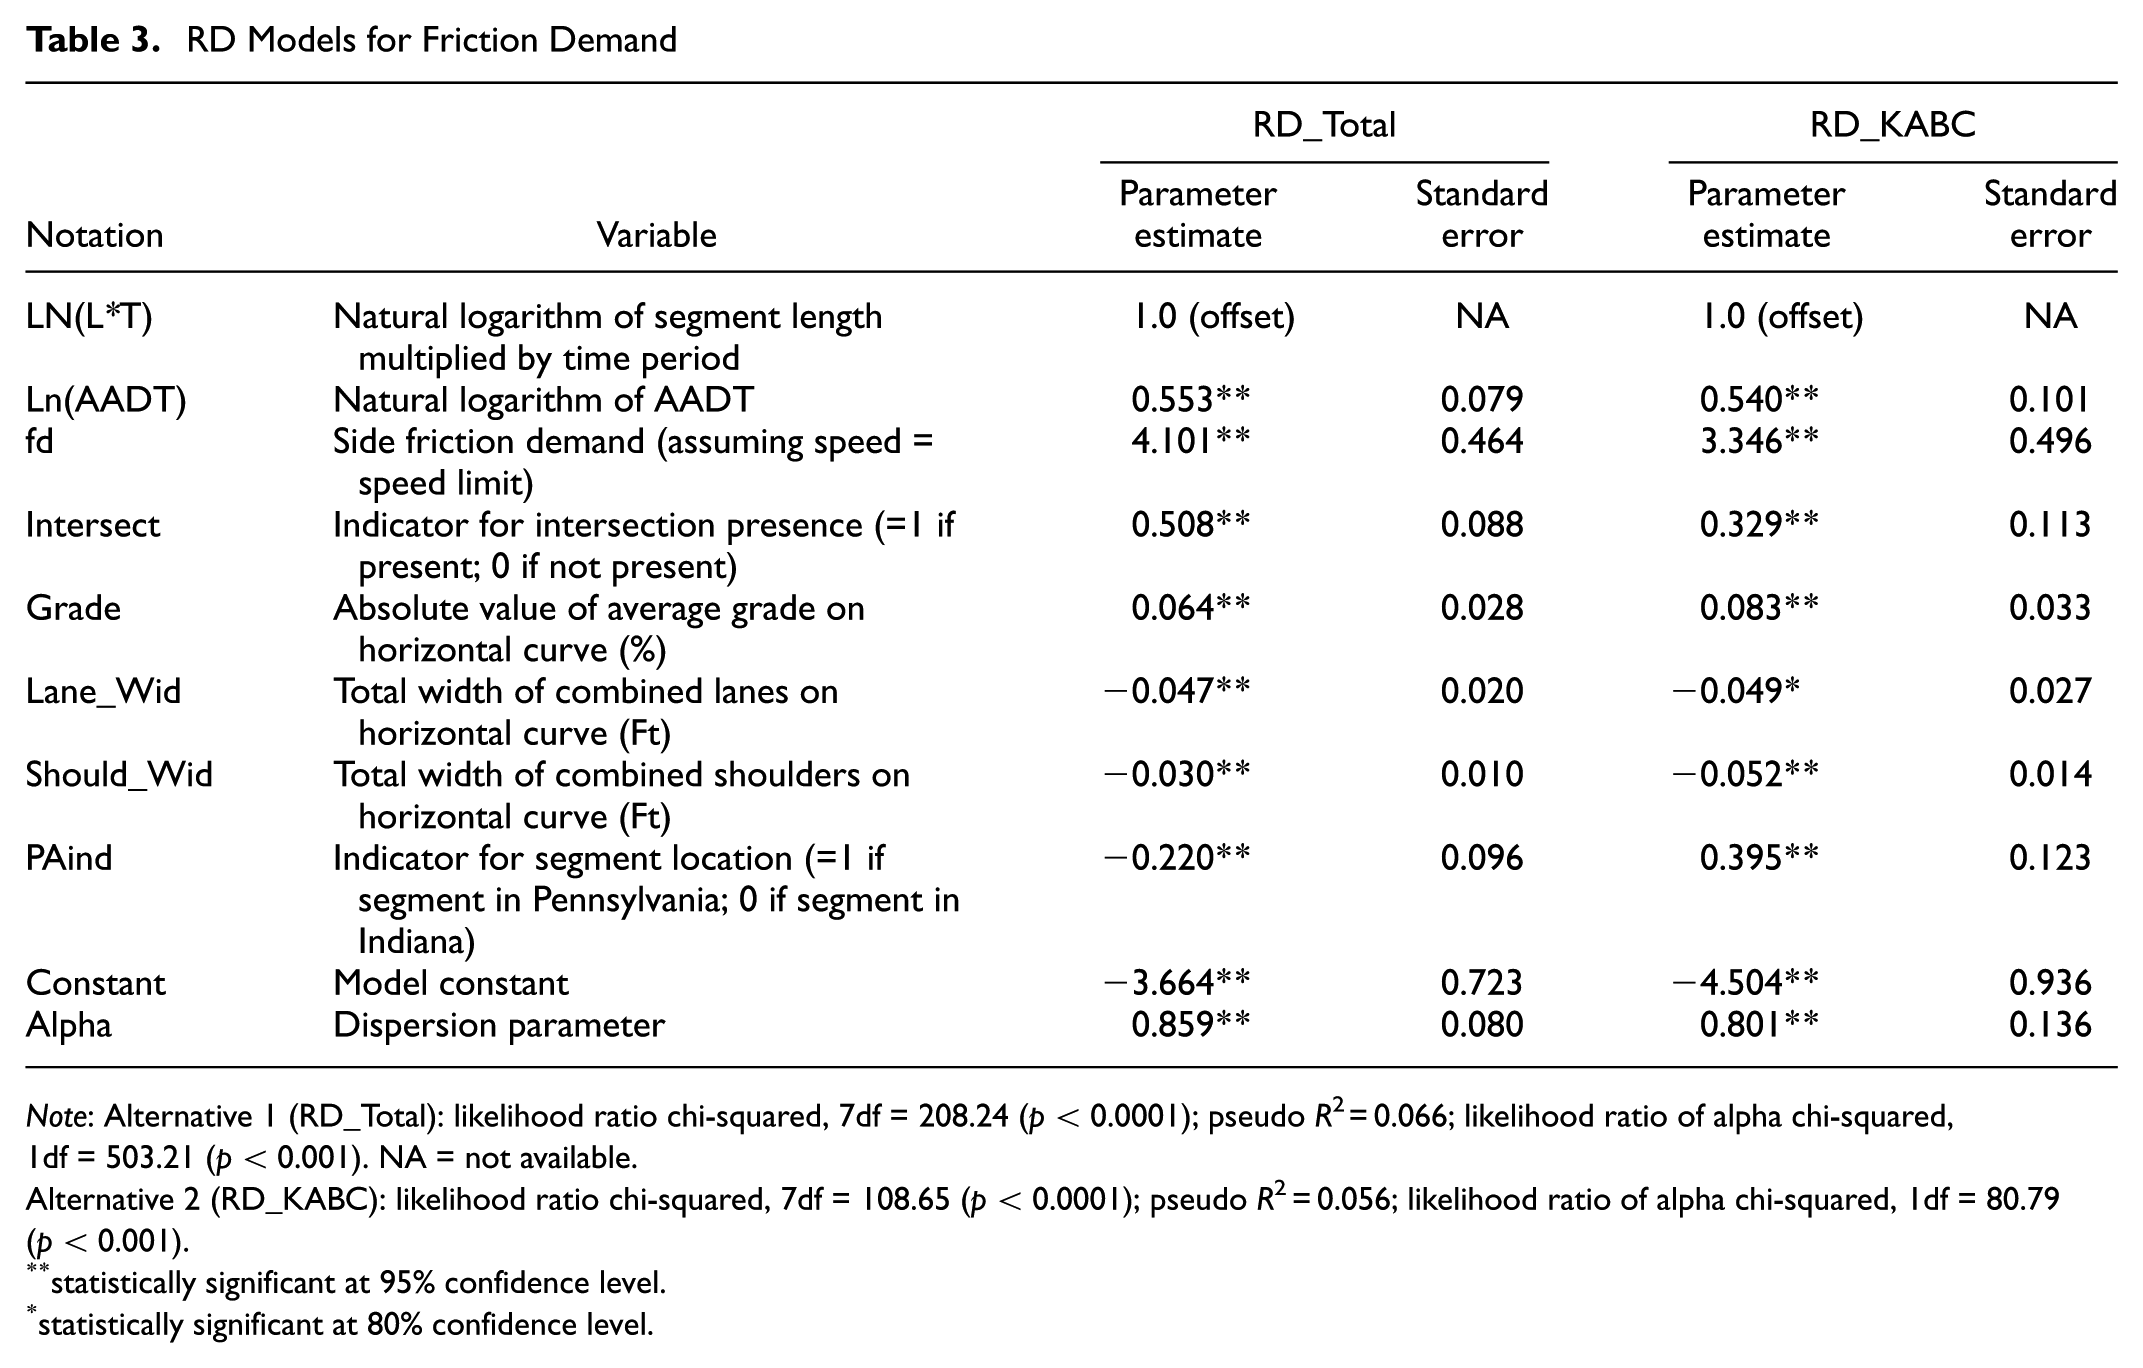
Note: Alternative 1 (RD_Total): likelihood ratio chi-squared, 7df = 208.24 (p < 0.0001); pseudo R2 = 0.066; likelihood ratio of alpha chi-squared, 1df = 503.21 (p < 0.001). NA = not available.
Alternative 2 (RD_KABC): likelihood ratio chi-squared, 7df = 108.65 (p < 0.0001); pseudo R2 = 0.056; likelihood ratio of alpha chi-squared, 1df = 80.79 (p < 0.001).
statistically significant at 95% confidence level.
statistically significant at 80% confidence level.
The relationships between expected RD crash frequency and horizontal curve design parameters are described in more detail below in the Application section. In the models shown in Tables 2 and 3, the presence of an intersection is expected to increase expected RD crashes. A unit increase in the lane and shoulder width is expected to decrease the expected RD crash frequency. The indicator for Pennsylvania indicates unmeasured characteristics on Pennsylvania curves are associated with fewer RD crashes and more FI RD crashes.
Application
Radius and Normal Crown Effects
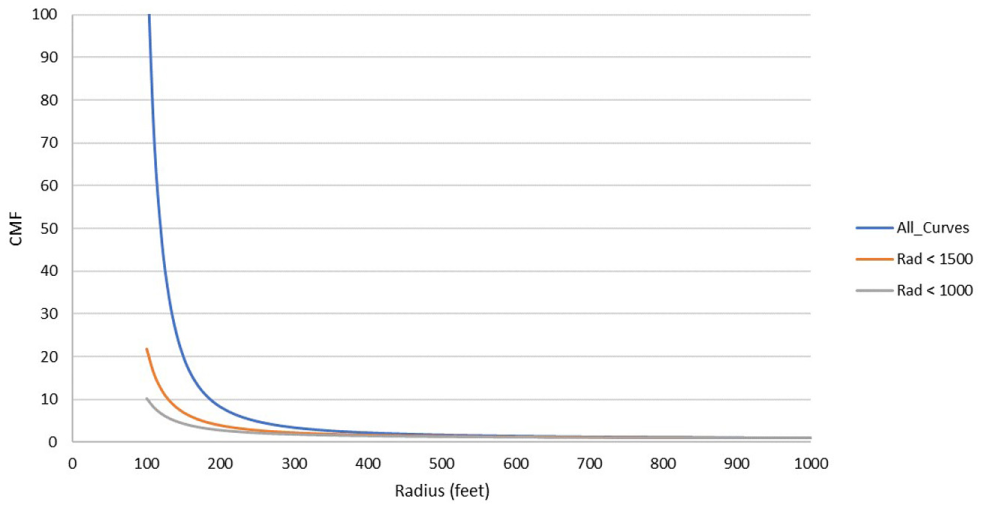
The estimated regression parameters for the safety effect of inverse horizontal curve radius were statistically significant at the 95% confidence level and indicated that the expected number of RD and FI RD crashes increases as horizontal curve radius decreases. The sensitivity between the expected number of RD crashes and radius was highest for smaller radii and the sensitivity continually decreases as the radii get larger and larger. The main effects for the presence of a normal crown and for the interaction between a normal crown and an inverse horizontal curve radius were statistically significant at the 95% confidence level. Although the main effect was significant, it has no bearing on the CMF for a change in radius from an existing condition to a proposed alternative condition if a normal crown is carried through the curve in both conditions. However, it is used in the CMF if the change from the existing condition to the proposed condition results in a change from a normal crown to a superelevated cross-section. The CMF for horizontal curvature, with or without a normal crown, is calculated using Equation 3:
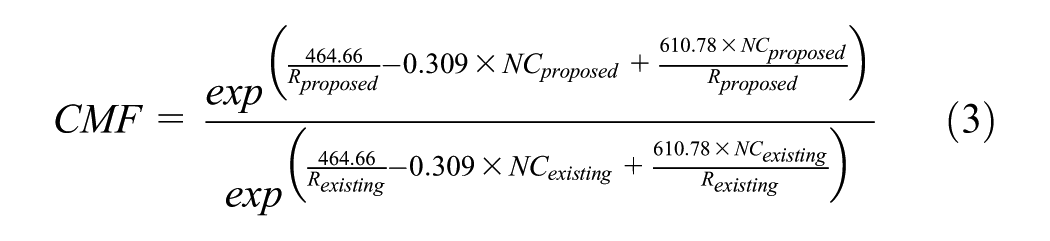
Figure 3 provides a plot of the CMF by curve radius for a normal crown and a superelevated condition for all severities of RD crashes (RD-KABCO). The plots show that the CMF is more responsive to radius on a normal crown roadway, which is expected. Additionally, the plot compares the CMF with the horizontal curve radius CMF from the HSM. The HSM radius CMF used the average curve length from the curves in this study as an input. The CMF developed from this dataset is larger than the CMF from the HSM. However, the CMFs are not directly comparable, as the HSM CMF is for all crash types.
CMF for changing radius (normal crown versus superelevated versus HSM CMF).
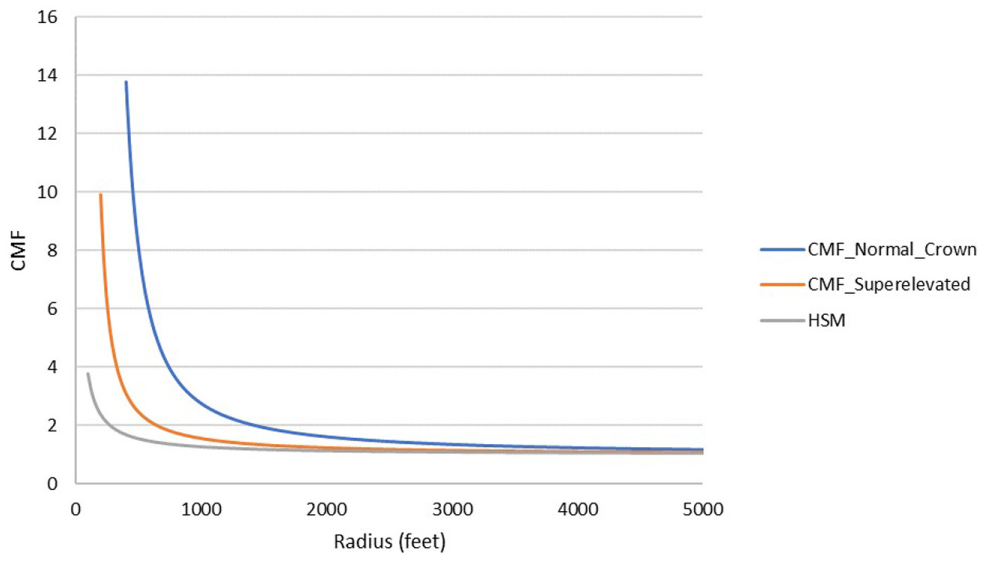
The coefficient for an inverse horizontal curve radius for all curves, curves with a radius of 1,500 Ft or smaller, and curves with a radius of 1,000 Ft or smaller was also considered. Figure 4 shows the CMFs for the horizontal curve radius, assuming a base condition of a 1,000-Ft radius, using the results of each model. The results show that when the average curve included in the analysis is larger, the estimated effect of horizontal curvature is larger. Therefore, the average effect of curvature is dependent upon the average of the sample being used. For the RID analysis, the average curve had a radius of over 2,000 Ft. It is possible that the analysis in Table 2 overestimates the safety effects of a horizontal curve radius for tighter horizontal curves. Since smaller horizontal curve radii are typically of interest in safety analyses, a large sample of smaller radius curves should be explored in future datasets. The overestimation challenge also appeared to be addressed by interacting curve radius with speed and superelevation, as described in the next section.
Comparison of CMFs by curves included in the analysis.
Friction Demand Effects
The estimated regression parameter for friction demand is statistically significant at the 95% confidence level. The results indicate that the expected number of RD and FI RD crashes increases as friction demand increases. Friction demand, as shown in Equation 1, is calculated through the point-mass model, with speed limit substituting for design speed. Under this assumption, the expected number of RD and FI RD crashes increases as posted speed limit increases, curve radius decreases, and superelevation rate decreases. The sensitivity between the expected number of RD crashes and the radius is highest for smaller radii and the sensitivity continually decreases as the radii get larger and larger. Posted speed limit, superelevation rate, and curve radius are treated as an interaction term and affect the calculated CMF in tandem (e.g., the safety effect of changing the horizontal curve radius is dependent upon the speed limit and superelevation). The CMF is calculated using Equation 4:
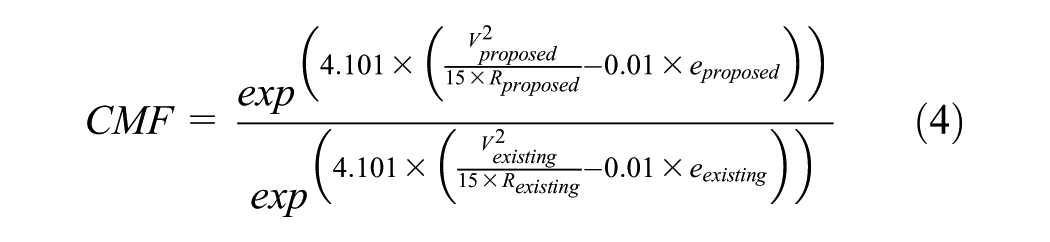
Figure 5 graphically presents the CMF (for 20, 40, and 55 mph posted speed limits) for horizontal curve radius relative to the HSM CMF for horizontal curve radius. As the figure shows, the CMF increases as the horizontal curve radius decreases at a given speed. Additionally, the CMF increases for a change in radius as the posted speed increases (e.g., the CMF for changing a radius at 20 mph is smaller than making the same change at 55 mph). Figure 5 also includes the CMF for changing the horizontal curve radius from the HSM. For smaller radii, the HSM radius CMF is closer to the lower speed curves; as the radius increases, the HSM radius CMF becomes closer to the higher speed curves.
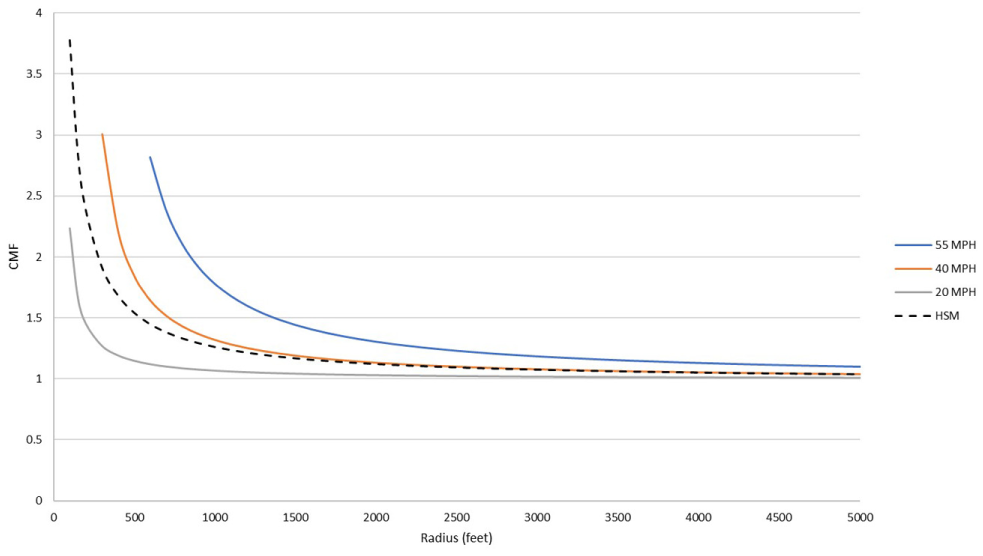
CMF for total crashes by speed versus HSM.
The friction demand CMF has broad applicability. Whereas this document provides graphical representations for changing the horizontal curve radius assuming a posted speed limit, Equation 4 can be used for the following purposes:
Assessing the safety effect of changing the horizontal curve radius while maintaining the same speed.
Assessing the safety effect of changing the horizontal curve radius while changing the posted speed limit.
Assessing the safety effect of changing the superelevation rate.
Assessing the safety effect of increasing the posted speed limit on an existing curve (inputting information for the existing horizontal curve radius and superelevation rate).
Assessing the safety effect of simultaneously increasing the superelevation rate and the posted speed limit on an existing horizontal curve.
Assessing the safety effect of simultaneously changing the posted speed limit, horizontal curve radius, and superelevation rate on an existing or proposed horizontal curve.
Example:
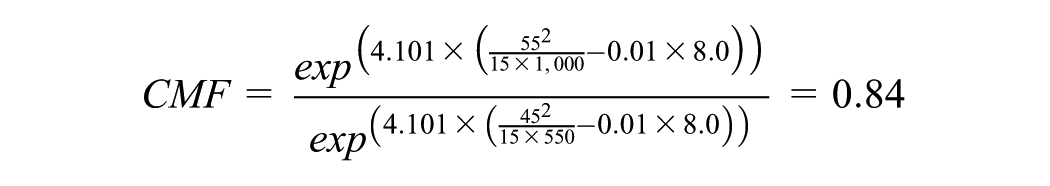
An existing curve is posted at 45 mph, has a horizontal curve radius of 550 Ft, and a superelevation rate of 8%. The safety impact of increasing the radius to 1,000 Ft is to be calculated as shown below:

The CMF indicates an expected 36% reduction in the expected number of RD crashes. If the posted speed limit were proposed to be increased to 55 mph in tandem with the increase in radius, the CMF would be calculated as:
The CMF indicates an expected 16% reduction in the expected number of RD crashes. If the posted speed limit were proposed to be increased to 55 mph with no change in radius the CMF would be calculated as:

The CMF indicates an expected 64% increase in the expected number of RD crashes.
Conclusions and Recommendations
This research explored and estimated relationships between elements of horizontal curvature and measures of design consistency, and the expected number of RD crashes along horizontal curves on rural, two-lane, two-way roads. The research explored these relationships using a negative binomial regression modeling approach and observing the regression parameter estimates corresponding to the measures. Data used for model estimation were drawn from the SHRP 2 RID 2.0. The data were originally collected for the NDS but were suitable for analysis with state-maintained traffic and crash data. A few points regarding the methodology are worth noting in this context:
1. The study design was cross-sectional. Whether estimated regression parameters from cross-sectional studies can ever represent safety effects estimates is a matter of ongoing debate. More recent safety research has implemented cross-sectional study designs intended to “mimic” randomized experiments and strengthen confidence in safety effects estimates, such as the propensity scores-potential outcomes framework. Road safety researchers have limited experience using the propensity scores-potential outcomes framework for treatments represented by continuous variables, such as horizontal curve radius or superelevation rate. The scope of this effort did not support the use of the propensity scores-potential outcomes framework.
2. The characteristics of the sample of horizontal curves, specifically related to the number or proportion of larger radii curves in the sample, appear to affect the estimated association between inverse curve radius and expected number of RD crashes. Since the modeling technique is non-linear, including larger radii curves will affect the coefficient estimates, which can lead to larger CMFs for small radii curves upon application. This challenge appeared to be addressed by including an interaction between inverse curve radius, speed, and superelevation, represented by side friction demand.
Additionally, the analysis results showed that the expected number of RD crashes on a horizontal curve changes because of the combination of that curve’s radius and the presence of a normal crown. An attempt was made to further incorporate the main effect of the actual superelevation rate (on superelevated curves) into the analysis, but a statistically significant result was not found. The results showed that the expected number of RD crashes increases at a faster rate for smaller horizontal curve radii when the curve has a normal crown. Future research should further explore the direct effect of superelevation rate and should extend this analysis to the safety impacts of superelevation deficiency (i.e., existing superelevation that is less than that recommended by the AASHTO Green Book).
The analysis results did, however, show that the expected number of RD crashes on a horizontal curve increases as friction demand increases. Friction demand is calculated using the point-mass model, the posted speed limit as a substitute for design speed, the horizontal curve radius, and the superelevation rate. The results showed an interaction between posted speed, curve radius, and the superelevation rate.
Future research should expand the analysis to all applicable RID sites to bolster sample size and to allow for utilization of the propensity scores-potential outcomes framework. This would further strengthen confidence in the results because the analytical method would reduce any potential biases associated with characteristics correlated with the horizontal curve radius. Additionally, since the RID contains information on roadways most likely to be traveled by NDS participants, the curves in this database are often on arterials, which have much larger curve radii and more forgiving design characteristics than other, lesser traveled roadways. This analysis would benefit from including more curves with radii closer to the limiting radius from geometric design policies and from lower AADT roadways. Finally, the NDS itself could be used to verify the speed and lane-keeping impacts of the horizontal curve characteristics explored in this study to further support interpretations of the findings.
Footnotes
Acknowledgements
This research is based upon work supported by the Federal Highway Administration under contract DTFH61-12-C-00032. The authors thank Mr. Joseph Cheung of the FHWA Office of Safety for his guidance.
Author Contributions
The authors confirm contribution to the paper as follows: study conception and design: ED, RJP, SH; data collection: SH, IH; analysis and interpretation of results: SH, RJP; draft manuscript preparation: SH, RJP, ED, IH. All authors reviewed the results and approved the final version of the manuscript.
The Standing Committee on Geometric Design (AFB10) peer-reviewed this paper (19-05022).
Any opinions, findings, and conclusions or recommendations expressed in this publication are those of the authors and do not necessarily reflect the views of the Federal Highway Administration.