
Abstract
Previous studies showed that the use of a stress relief course asphalt concrete (AC) interlayer (fine-graded asphalt mixture) between an AC overlay and the milled AC surface is a promising technique to mitigate reflective cracking. A performance-based mix design specification for an engineered stress relief course (ESRC) AC interlayer was developed and implemented in Nevada on two field projects. The projects were completed in summer of 2015 and 2016 on a U.S. route (US95, Las Vegas) and a residential road (Hidden Valley, Reno) in Nevada, respectively. The performance evaluation of field-produced mixtures collected during construction showed good stability, and increased resistance to fatigue and reflective cracking that can be attributed to the increased asphalt binder content and the finer aggregate gradation, thus making ESRC a promising technique to mitigate reflective cracking. This was also supported by the distress survey data collected throughout the up-to-date service life of the projects. The pavements with ESRC interlayer showed excellent performance thus far (after 2 to 3 years) when compared with the control sections, as demonstrated with a much lower level of cracking reflected in the AC overlay. A simple life cycle cost analysis was performed based on the observed field distresses from each project. The cost analysis showed that even though the ESRC mixture has a higher initial cost of materials, the agency and user life cycle costs per lane mile are lower and resulted in an average cost saving of 23%. In summary, based on the findings from this study, interlayer AC mixes designed using the presented ESRC performance-based mix design method should be used in Nevada.
The Nevada Department of Transportation (NDOT) uses various maintenance and rehabilitation repair strategies to improve the overall condition of the state’s pavement network. Asphalt concrete (AC) overlays have been one of the most commonly used methods for rehabilitating aged and deteriorated asphalt pavements caused by the combined effect of traffic loading and climate ( 1 ). Consequently, reflection of cracks from existing pavements becomes a major type of distress influencing the life of an AC overlay and controlling its long-term performance. The differential movements across the undelaying cracks resulting from the combined effects of heavy wheel loads and temperature fluctuations result in physical tearing of the AC overlay. Thus, the long-term performance of many AC overlays will highly depend on their ability to resist reflective cracking. Once the AC overlay is cracked, it allows moisture to penetrate into the mix and to the supporting layers, promoting moisture damage of the mix. It can also reduce the strength of the base and subgrade materials, which would accelerate the total failure of the flexible pavement structure ( 2 ).
Several techniques have been applied to mitigate reflective cracking in AC overlays, including increased thickness of the AC overlay, stress-absorbing membrane interlayer, stress relief course (SRC), and fabric / geotextile membranes ( 1 ). Many factors may significantly influence the long-term performance of these techniques, including the specific conditions of the existing pavement and the combination of materials, traffic, and environmental conditions under which the technique has been applied. A recent survey by Habbouche et al. indicated that none of these mitigation techniques was able to totally stop reflective cracking ( 1 ). Nonetheless, the use of SRC prevented reflective cracking for 3 years after construction and slowed down the rate of reflected transverse cracks until 5 years after construction. These observations showed that the use of SRC interlayer can extend the performance life of AC overlays and lead to long-term cost-effectiveness when properly designed as part of the overall rehabilitation strategy.
In the past, NDOT considered using a 1-inch (25.4 mm) layer of its typical Type 3 fine-graded AC mixture (labeled as SRC-T3) with a maximum aggregate size of 0.5-inch (12.5 mm) as a SRC on many of its AC overlay projects ( 2 ). However, this SRC-T3 was not specifically designed or checked for its resistance to reflective cracking. Therefore, the use of a properly designed SRC mixture as a mitigation technique for reflective cracking under Nevada’s conditions was needed. In 2006, NDOT initiated a three-phase research study to identify the promising techniques to mitigate reflective cracking in AC overlays based on the earlier work of Utah and Texas DOTs. The findings from all three phases of this study have been reported in detail elsewhere in the literature (1–4) and resulted in a preliminary performance-based mix design specification for an engineered SRC (ESRC) in Nevada. The new specification provided requirements for the ESRC aggregate properties and gradation as shown in Table 1. In addition, the specification required some performance tests to ensure the proper flexibility of the ESRC mixture under traffic and climatic stresses, as shown in Table 2. It should be mentioned that no requirements were considered for the conventional SRC-T3 to fall within the gradation bands of the newly suggested ESRC specifications.
Aggregate Property and Gradation Requirements for Engineered Stress Relief Course
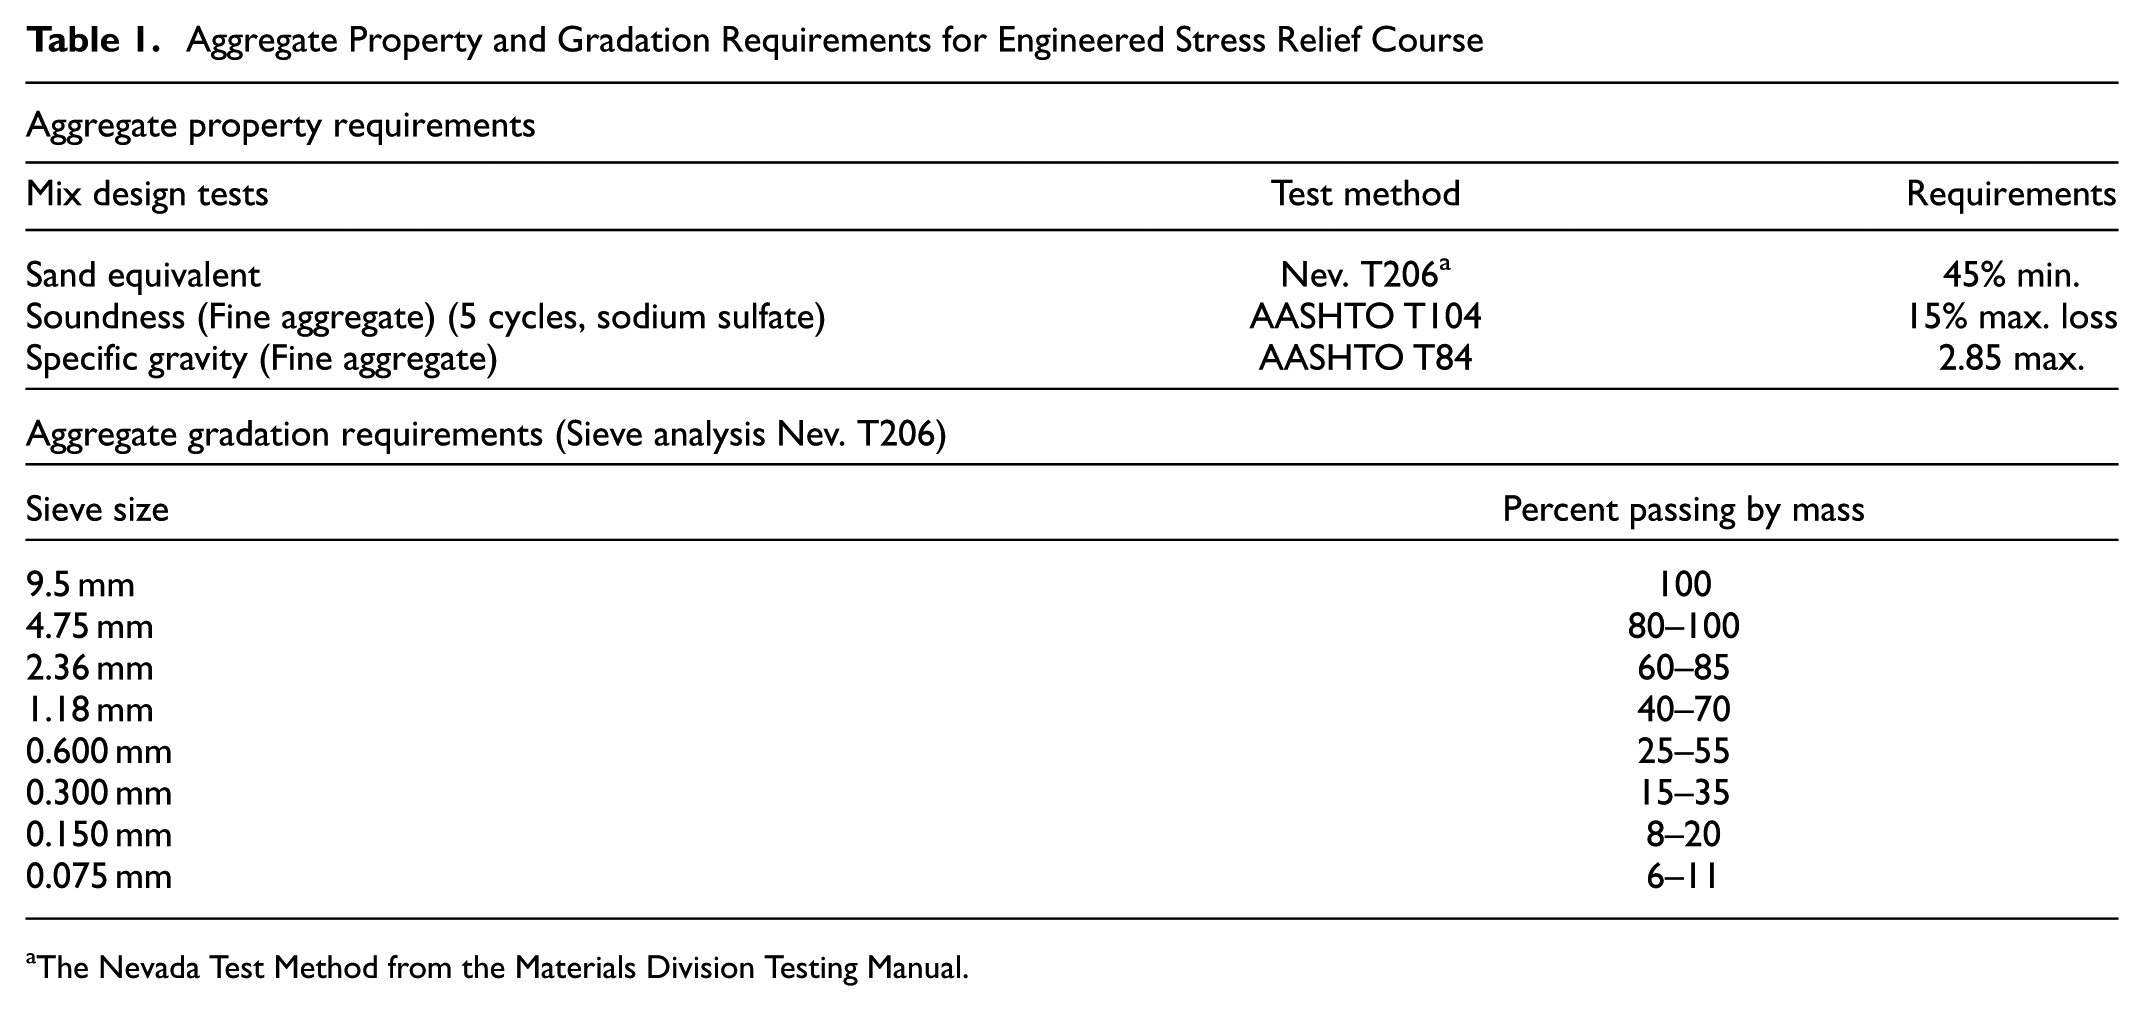
The Nevada Test Method from the Materials Division Testing Manual.
Mix Design and Mechanical Properties Requirements for Engineered Stress Relief Course
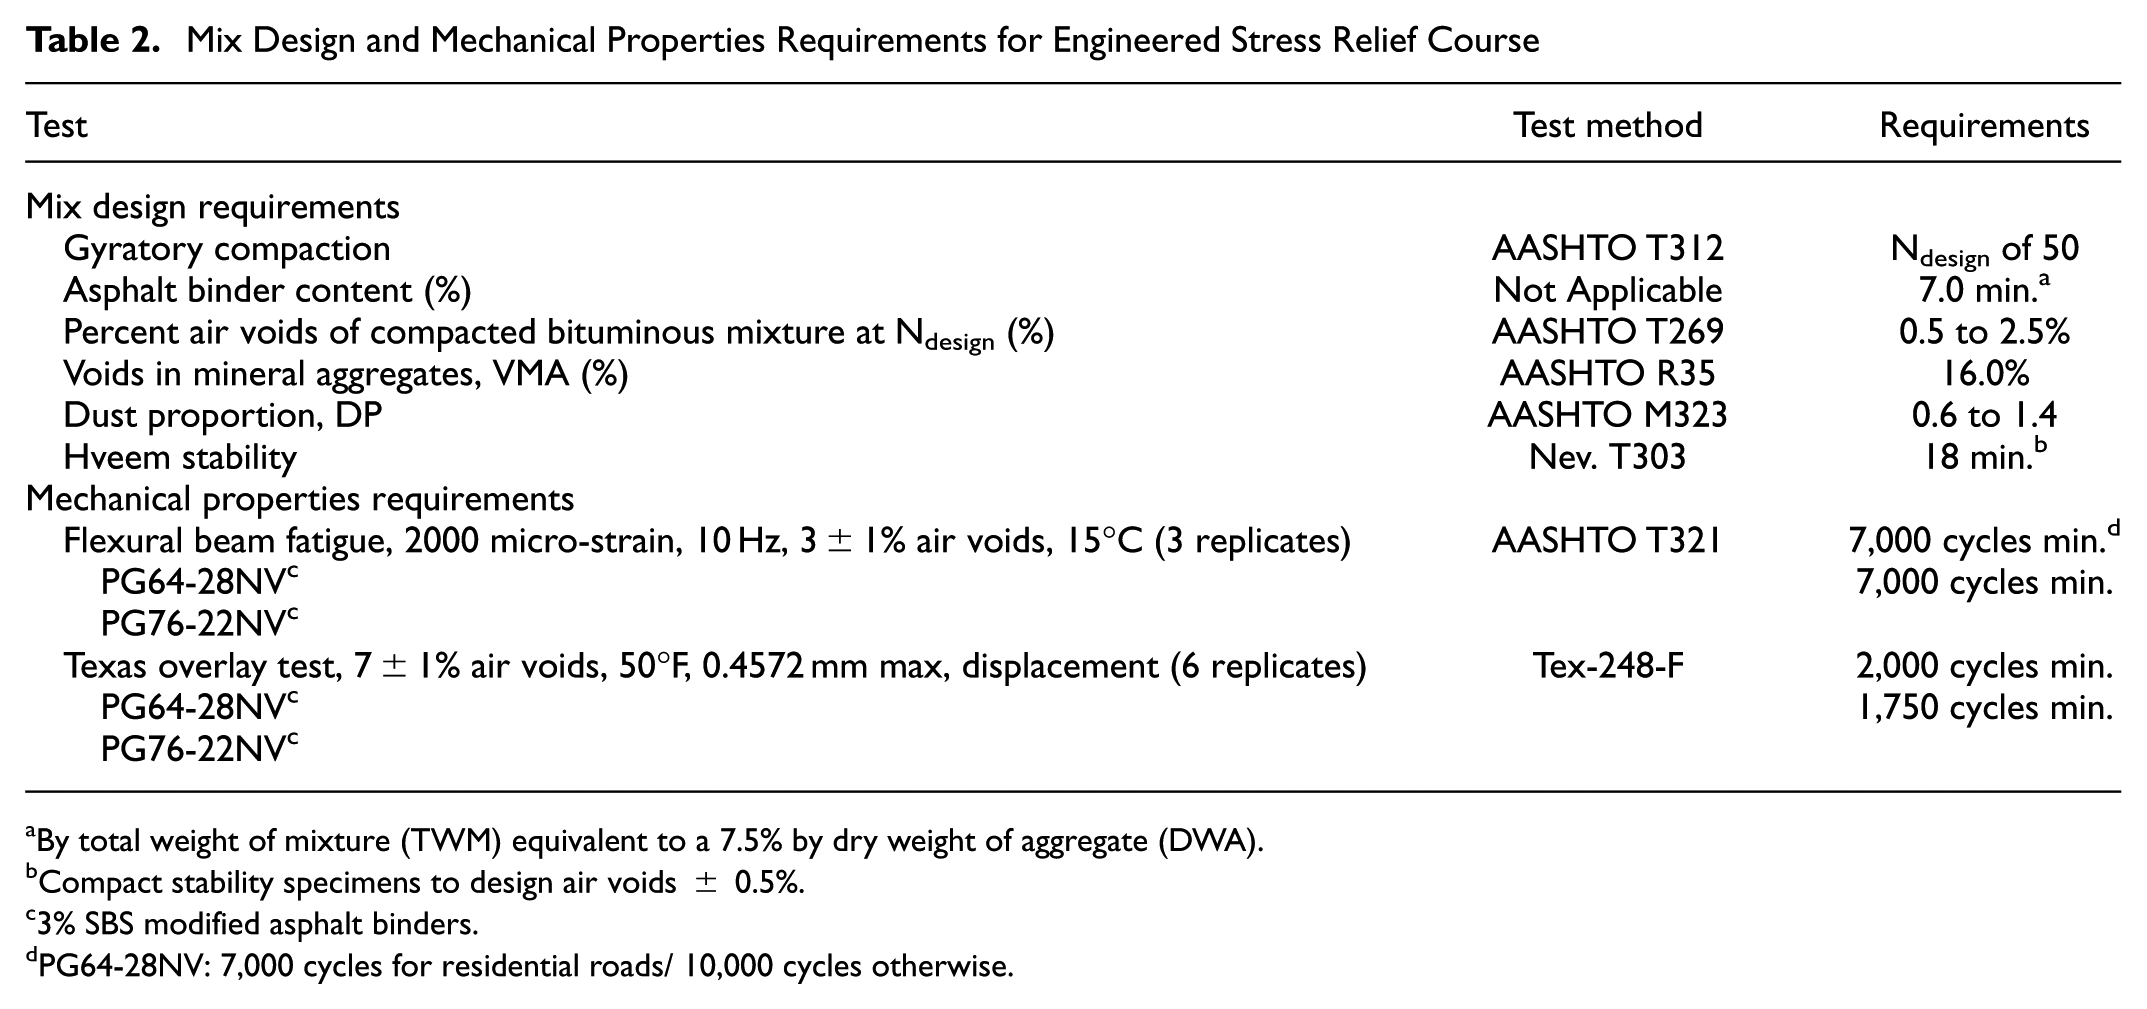
By total weight of mixture (TWM) equivalent to a 7.5% by dry weight of aggregate (DWA).
Compact stability specimens to design air voids ± 0.5%.
3% SBS modified asphalt binders.
PG64-28NV: 7,000 cycles for residential roads/ 10,000 cycles otherwise.
It should be noted that a polymer-modified asphalt binder is specified for the ESRC mixture. A PG64-28NV and a PG76-22NV styrene-butadiene-styrene (SBS) modified asphalt binders are used for the northern and southern part of Nevada, respectively. These binders have a long history of excellent performance under Nevada’s traffic and climatic conditions ( 5 ). The “NV” extension indicates that these asphalt binders have been graded with the PG-plus system which includes the Superpave performance grade (PG) binder system plus the following properties ( 6 ):
For PG64-28NV: ductility at 39°F (4°C) for original and rolling thin film oven (RTFO) binder, toughness and tenacity at 77°F (25°C) for original binder.
For PG76-22NV: ductility at 39°F (4°C) for original binder, non-recoverable creep compliance and creep recovery for RTFO binder.
Description of Field Projects
The developed ESRC specification was implemented on two field projects. In summer of 2015, NDOT constructed a demonstration project of the ESRC mixture on U.S. 95 (US95) north of Las Vegas in southern Nevada. The project included three 1,500 feet (457 m) end-to-end test sections with different strategies: (a) a section of dense-graded AC overlay (US95_OL-T2C) on top of an ESRC mixture (US95_ESRC) (Section 1), (b) a US95_OL-T2C overlay on top of a NDOT SRC-T3 (US95_SRC-T3) (Section 2), and (c) a US95_OL-T2C overlay without any stress relief interlayer (Section 3). All three sections were subjected to a 3 inch (76 mm) cold milling before placement of the new materials. In summer of 2016, Community Services Department of Engineering and Capital Projects in Washoe County used the ESRC interlayer in the rehabilitation of a 12-year-old residential pavement (Cedar Brook along with Hidden Highlands Drives) in Hidden Valley (HV) neighborhood of Reno, Nevada. The project was 0.5 miles (805 m) long with a width of approximately 48 feet (15 m) and consisted of milling 2 inch (51 mm) from the existing AC layer and replacing with a fine-graded AC overlay (HV_OL-T3) over an ESRC mixture (HV_ESRC). It should be mentioned that the mixes from U.S. 95 project used a PG76-22NV asphalt binder, whereas the mixes from the HV project used a PG64-28NV asphalt binder.
Figure 1 shows the approximate locations of both field projects. The Las Vegas area has a subtropical hot desert climate typified by long and very hot summers with an average daytime high temperature of 104°F (40°C), warm transitional seasons, and short mild to chilly winters. Abundant sunshine throughout the year (86% of all daylight hours) and low rainfall average of 4.2 inch (110 mm) characterize this climatic area. In parallel, the HV area is characterized by a steppe climate that receives precipitation below potential evapotranspiration but not as low as a desert climate, with an average precipitation of 52.3 inch (1,328 mm) per year. An average yearly daytime high temperature of 68°F (20°C) with an average high temperature of 92°F (33°C) for the month of July were recorded for this climatic area.
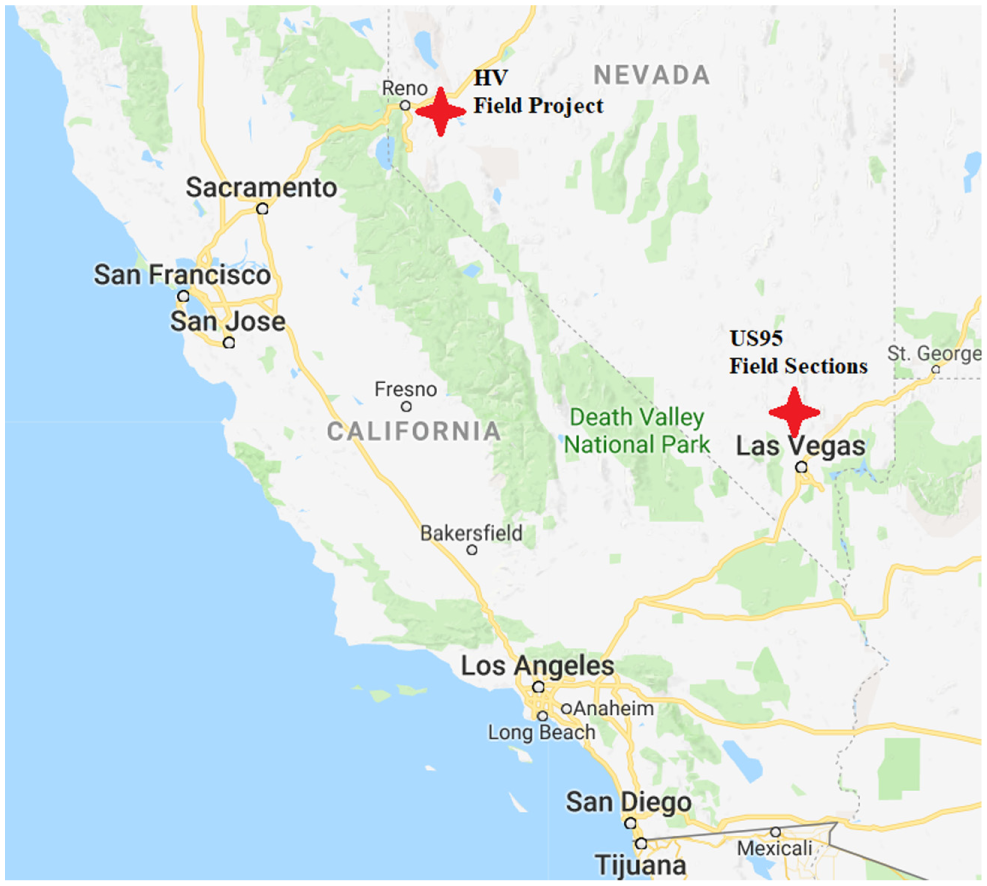
Map showing the approximate locations for the two ESRC field projects.
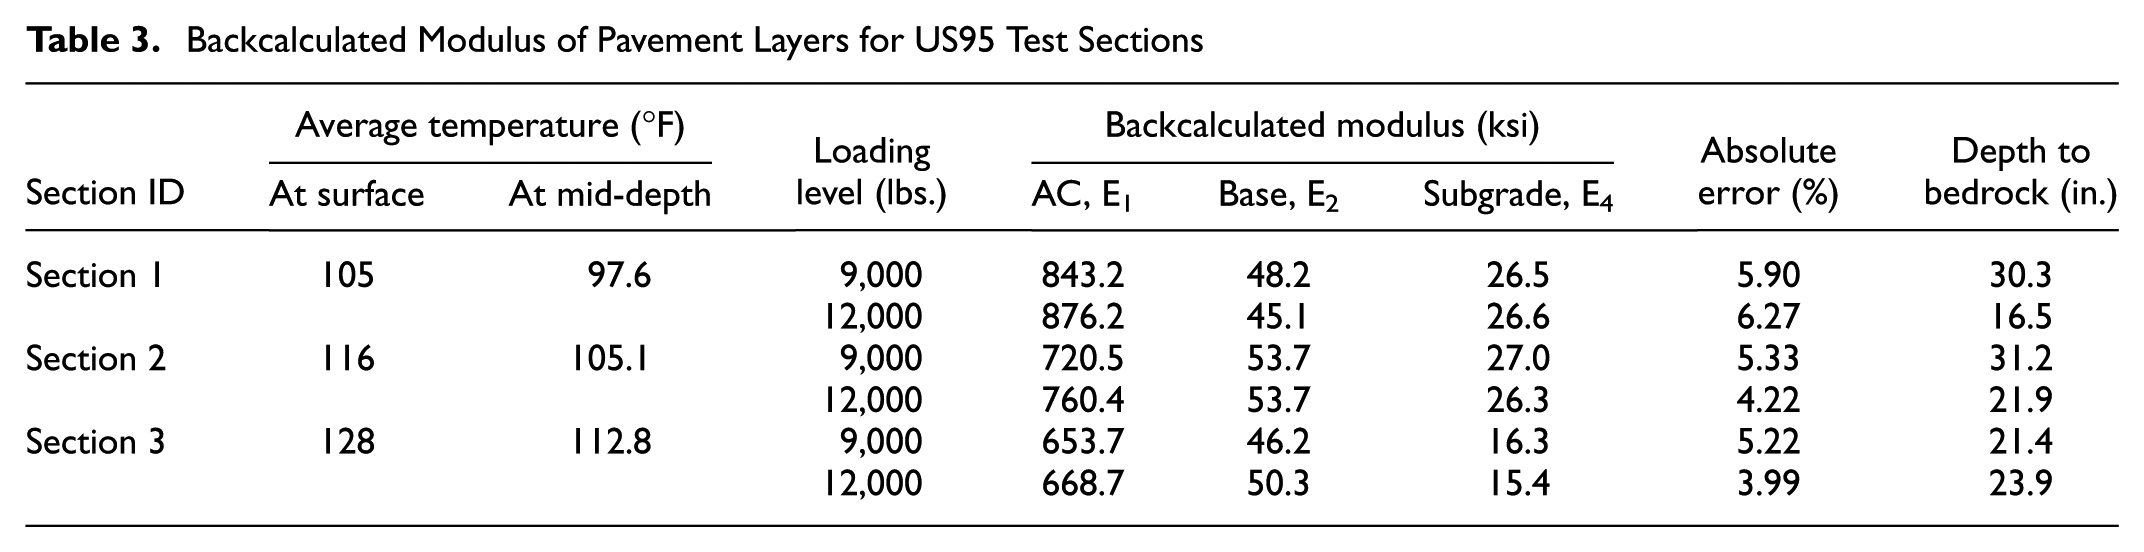
Figure 2 illustrates the pavement structures of the two projects. The existing pavement before milling on U.S. 95 had similar conditions at all three test sections. The existing AC pavement had low to moderate block cracking with no visible rutting greater than 0.1 inch (2.5 mm) throughout the entire project. Falling weight deflectometer (FWD) data at different load levels were collected from the right wheel-path throughout the project prior to rehabilitation (before milling). Figure 3 shows the center deflection (d0) and the corresponding FWD testing temperatures at different milepost locations of the three US95 sections. Modulus 6.1 software ( 7 ) was then used to backcalculate the moduli of the in-situ layers from measured surface deflections. Table 3 summarizes the backcalculated moduli of the AC layer, unbound granular base, subgrade at two loading levels (i.e., 9,000 and 12,000 lbs.) for the three US95 sections. The backcalculated damaged AC modulus of the three test sections showed similar values when shifted to the same temperature, indicating similar damage accumulation in the AC layer supporting the observed pre-existing pavement conditions before rehabilitation. It should be mentioned that all three test sections were covered with a 0.75 inch (19 mm) open-graded friction course following NDOT standard practice ( 8 ), and are being subjected to the same traffic with a two-directional average annual daily traffic (AADT) of 9,120 (2 lanes per direction) and a truck percent (T) of 16%.
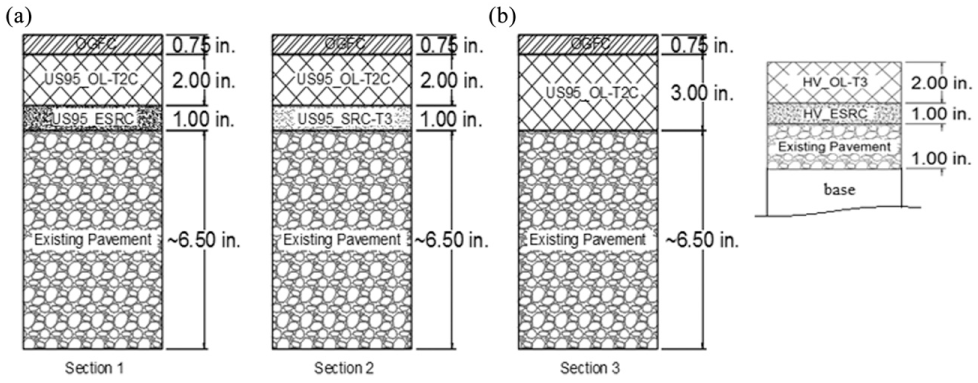
Pavement structures on (a) US95 and (b) HV projects.
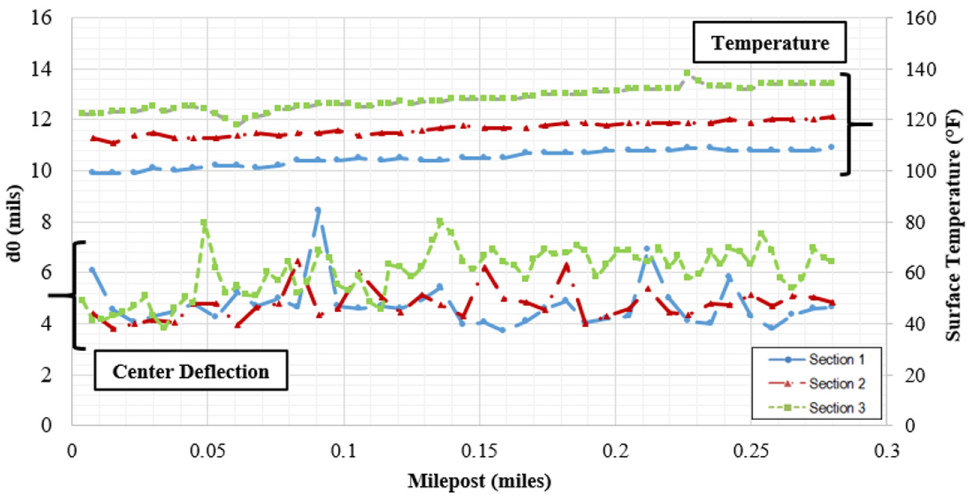
FWD center deflections and surface temperatures on the US95 test sections.
Backcalculated Modulus of Pavement Layers for US95 Test Sections
On the other hand, the existing AC pavement on the HV project had low to moderate fatigue and longitudinal cracking with a pavement condition index (PCI) of 75 ( 9 ). The traffic consisted of two-directional AADT of 3,600 and an approximate T value of 7%. It should be noted that the HV project is located on a residential road subjected to a low truck traffic. It should be mentioned that no FWD measurements were taken on the HV field section.
Overall Objective and Scope
The overall objective of this paper is to assess the field performance and cost-effectiveness of ESRC mixtures in Nevada. This was achieved by first evaluating the properties of field-produced mixtures from the two projects and comparing the results against the developed specification. Furthermore, distress survey data at different in-service pavement age were collected, analyzed, and compared with the observed performance of the respective mixtures in the laboratory. A life cycle cost analysis (LCCA) was then performed to assess the effectiveness of ESRC interlayer. This was done by predicting the performance of AC overlays in terms of reflective cracking after calibrating the prediction model with the measured distresses at multiple in-service durations.
Raw materials and field-produced mixtures were collected and evaluated in the laboratory for volumetric and mechanical properties. The raw materials were used to establish performance-based mix designs satisfying the requirements of the ESRC specifications (Table 1 and Table 2). The field mixtures were evaluated for asphalt binder content, and aggregate gradation. Furthermore, field-mixed laboratory-compacted (FMLC) samples were prepared and evaluated through measures of dynamic modulus |E*| (AASHTO T378 and R84 ( 10 , 11 )), resistance to fatigue cracking (AASHTO T321 ( 12 )), resistance to reflective cracking (Tex-248-F ( 13 )), and resistance to rutting ( 14 ). The following summarizes the mix designs for the various mixtures used on both projects.
Laboratory-Produced Asphalt Mixtures
Mix Designs
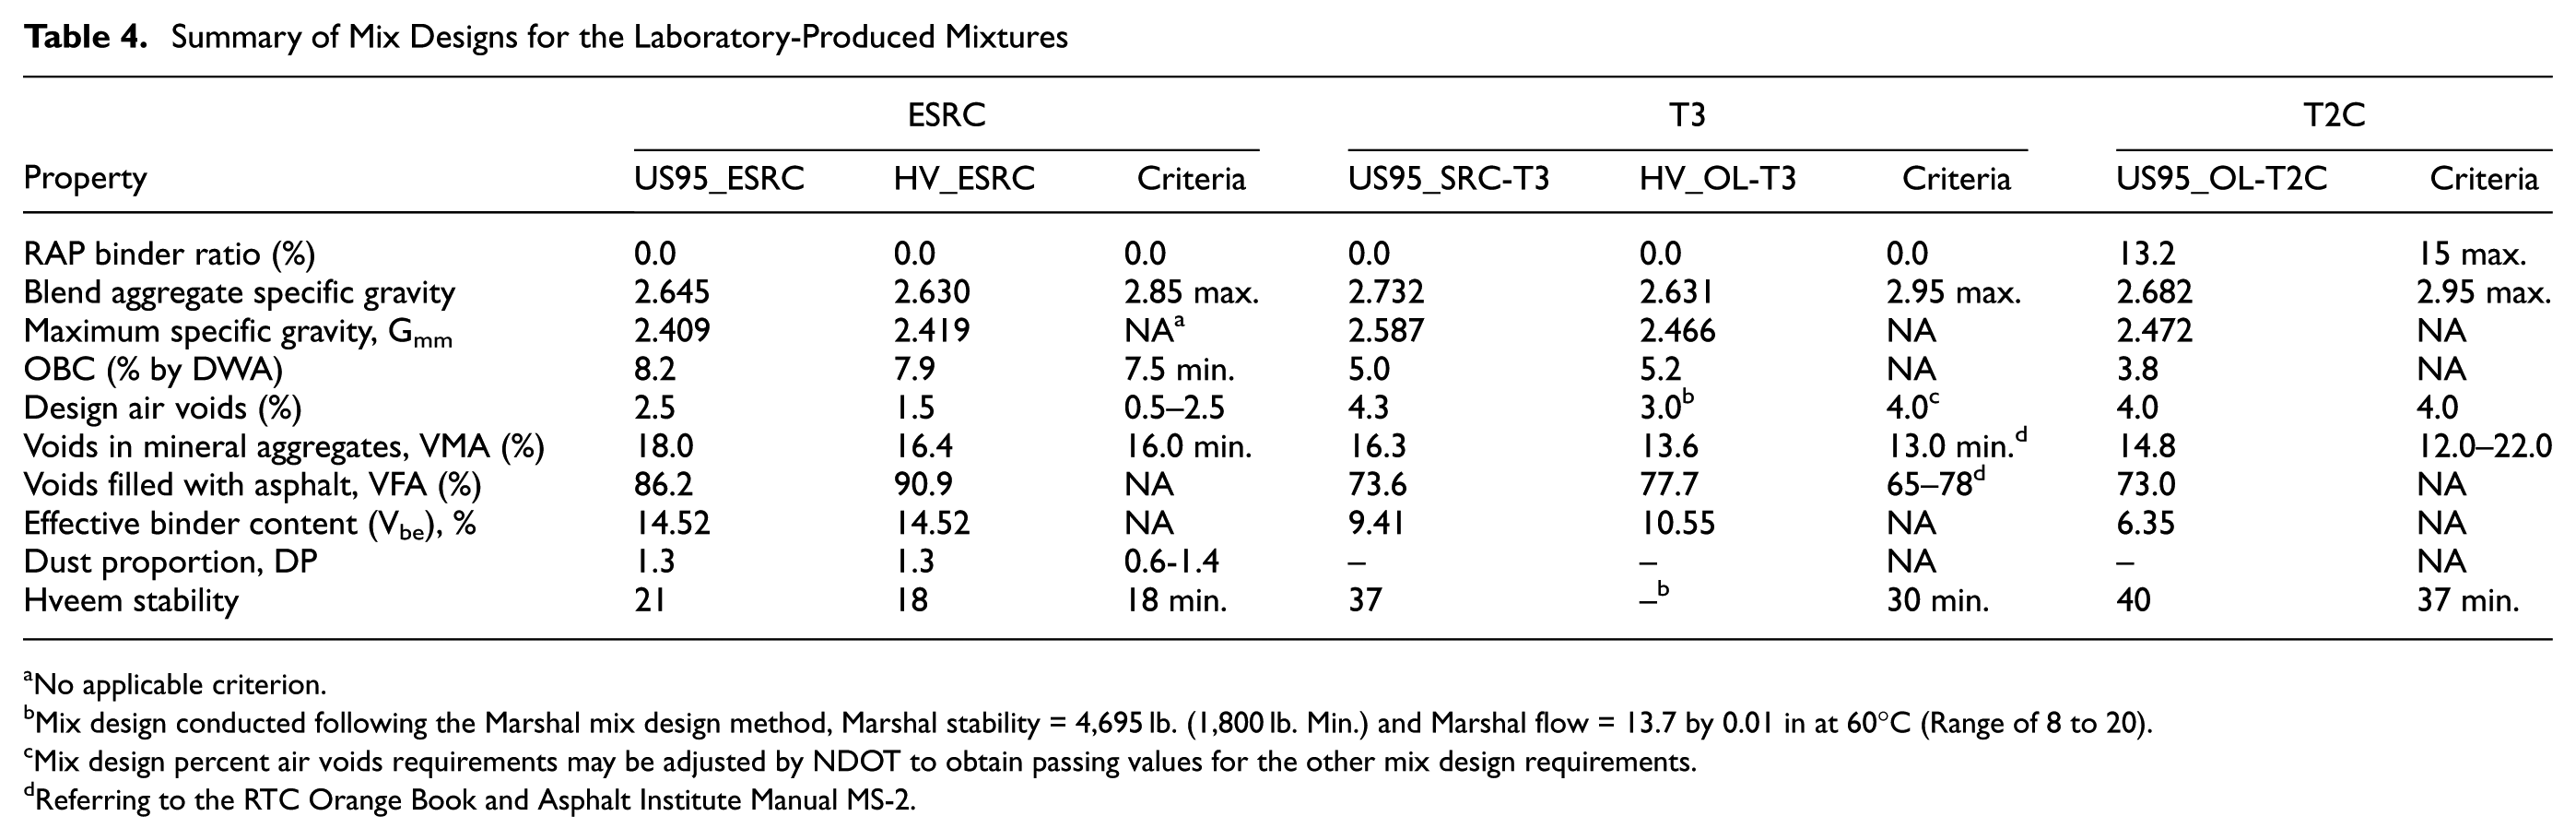
All aggregates used in the design process were lime-treated at a rate of 1.5% by dry weight of aggregate (DWA) and were marinated in sealed containers for 48 h before their use in the mixing process following agency specifications ( 8 ). Figure 4 shows the gradation curves of the blended aggregate for the five mixtures along with the control points for the performance-based ESRC aggregate gradation. It can be noticed that the ESRC mixtures were characterized by having finer blend gradations. The mix designs information for all five mixtures are summarized in Table 4. A significantly higher asphalt binder content was selected for the ESRC mixtures when compared with all other mixtures. The ESRC mixtures for both projects met the minimum Hveem stability criterion indicating a stable behavior during pavement construction and under traffic loading.
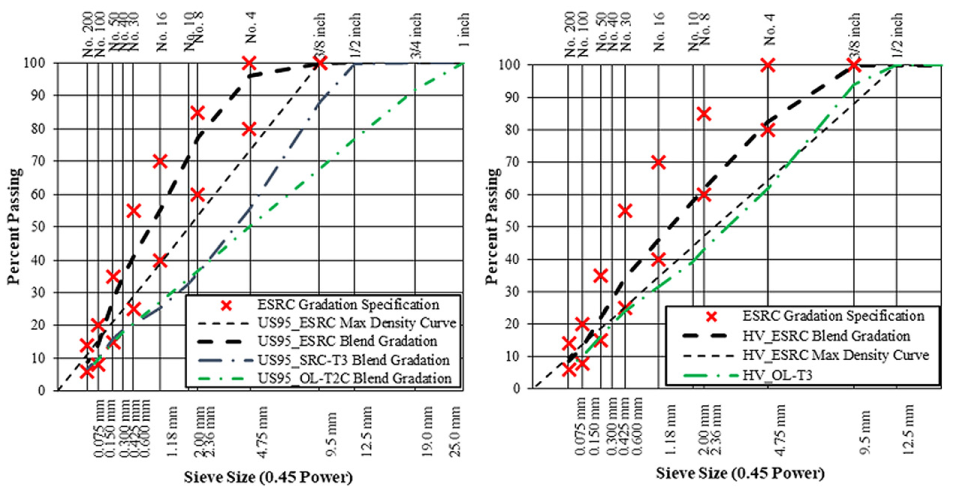
Aggregate gradations of mixtures from US95 and HV projects.
Summary of Mix Designs for the Laboratory-Produced Mixtures
No applicable criterion.
Mix design conducted following the Marshal mix design method, Marshal stability = 4,695 lb. (1,800 lb. Min.) and Marshal flow = 13.7 by 0.01 in at 60°C (Range of 8 to 20).
Mix design percent air voids requirements may be adjusted by NDOT to obtain passing values for the other mix design requirements.
Referring to the RTC Orange Book and Asphalt Institute Manual MS-2.
Mechanical Properties
The resistance of the asphalt mixtures to fatigue cracking was evaluated using the flexural beam fatigue test in accordance with AASHTO T321 ( 12 ). The test was conducted by applying a repeated haversine load at a frequency of 10 Hz on a 2.5 by 2.0 by 15-inch (63 by 50 by 380 mm) beam specimen. The beam specimen is subjected to a 4-point bending with free rotation and horizontal translation at all load and reaction points. Fatigue life at a given temperature and flexural strain level is defined as the point at which the product of the beam specimen stiffness and loading cycles is a maximum. If a maximum was not observed within the applied cycles, fatigue life or failure is then determined as the number of cycles corresponding to a 50% reduction in the initial flexural beam stiffness measured approximately after 50 loading cycles.
The Texas overlay test was used to evaluate the resistance of the asphalt mixtures to reflective cracking in accordance with Tex-248-F procedure ( 13 ). Once prepared, each specimen (6-inch (150mm) long by 3-inch (75 mm) wide, and 1.5-inch (37.5 mm) thick sample) is glued on two metallic plates, well fixed on a mounting wide plate using epoxy, and then mounted in the jig. The test was conducted in a controlled displacement mode until failure occurred at a loading rate of one cycle per 10 s (5 s of loading and 5 s of unloading) with a maximum displacement of 0.018 inch (0.4572 mm) at 50°F (10°C). The number of cycles to failure was defined as the number of cycles to reach a 93% drop in initial load. If a 93% reduction in initial load was not reached within a certain specified number of cycles (refer to “Mechanical Properties Requirements” in Table 2), the test will stop automatically after 5,000 cycles.
Figures 5 and 6 shows the measured fatigue and reflective cracking mechanical properties of the LMLC ESRC and SRC-T3 mixtures for US95 and LMLC ESRC and OL-T3 mixtures for HV, respectively. It should be mentioned that the OL-T3 mixture used as an overlay on HV project was considered to be used as a SRC layer in the past by NDOT for the northern part of the state. Therefore, a comparison of performance behavior between HV_ESRC and HV_OL-T3 was established. It can be noticed that the LMLC ESRC mixture from both projects exceeded the minimum required fatigue and reflective cracking criterion when compared with their respective T3 mixtures (i.e., US95_SRC-T3, and HV_OL-T3). In summary, all the mix design requirements for the ESRC performance-based specification were met by both ESRC mixtures. Furthermore, the flexural beam fatigue test and the Texas overlay test showed better performance for the ESRC mixture when compared with the SRC-T3, indicating a higher flexibility and resistance to reflective cracking.
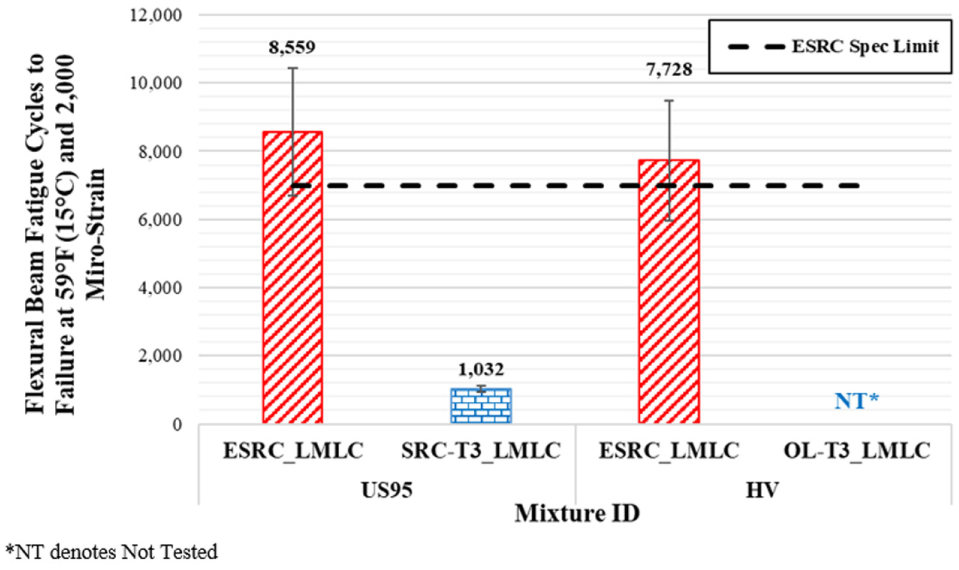
Summary of beam fatigue test results at 59°F (15°C) and 2000 micro-strain for LMLC mixtures. (Error bars represents the mean value plus or minus 95% confidence interval.)
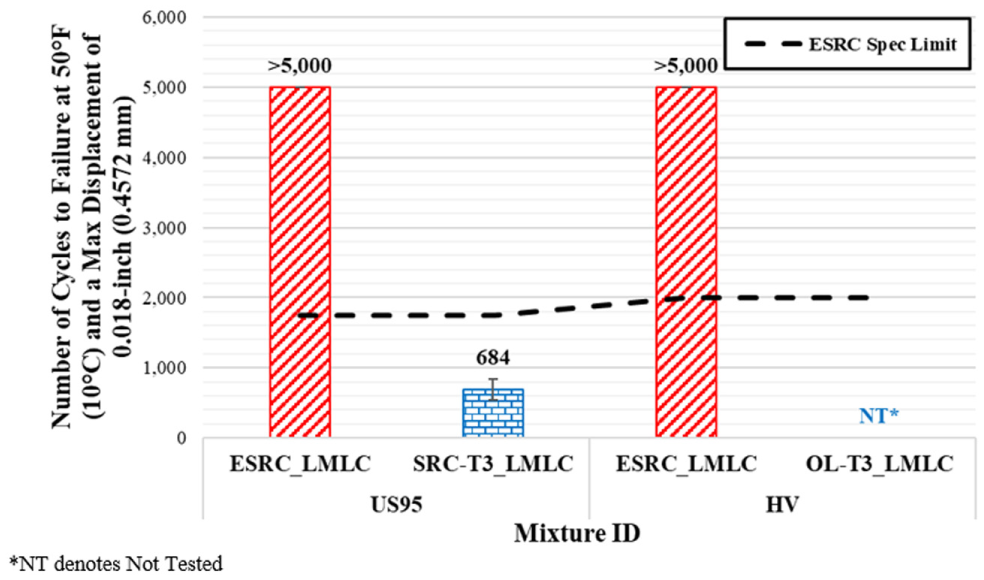
Summary of Texas Overlay test results at 50°F (10°C) and a maximum opening displacement of 0.018 inch (0.4570 mm) for LMLC mixtures. (Error bars represent the mean value plus or minus 95% confidence interval.)
Field-Produced Asphalt Mixtures
Loose mixtures were collected in five-gallon steel pails during construction and were brought back to the laboratory for further evaluation. FMLC specimens of each mixture (i.e., US95_ESRC, US95_SRC-T3, US95_OL-T2C, HV_ESRC, and HV_OL-T3) were prepared and evaluated for dynamic modulus (10, 11), as well as for their resistance to fatigue cracking ( 12 ), reflective cracking ( 13 ), and rutting ( 14 ). In particular, the ESRC mixtures were checked against the required mechanical properties shown in Table 2.
The field mixtures were reheated in force-draft ovens at 285°F (140°C) for 3 h before splitting to the appropriate sample size, and heated at the compaction temperature in the oven for 2 h before compaction. It should be mentioned that throughout the evaluation of field-produced mixtures (i.e., FMLC specimens), test specimens were compacted to the expected initial in-place air void levels.
Mix Design Verification
The field-produced mixtures were evaluated in terms of asphalt binder content and gradation of extracted aggregates, as well as their resistance to fatigue and reflective cracking. The measured properties were compared against the ESRC performance-based criteria shown in Table 1 and Table 2. All five mixtures were within the allowable tolerances of the design asphalt binder content as mandated by the agencies specifications (6, 8). In addition, the gradation of the extracted aggregates for both ESRC mixtures remained within the overall ESRC specification limits.
Figures 7 and 8 shows the measured fatigue and reflective cracking mechanical properties of the FMLC ESRC and SRC-T3 mixtures for US95 and FMLC ESRC and OL-T3 mixtures for HV, respectively. It can be noticed that the FMLC ESRC mixture from US95 test section exceeded the minimum required fatigue and reflective cracking criteria when compared with its respective T3 mixtures (i.e., US95_SRC-T3). On the other hand, the number of cycles to fatigue failure for the HV_ESRC mixture was slightly lower than the criterion (i.e., 7,000). However, the ESRC fatigue criterion was within the 95% confidence interval of the measured number of cycles to fatigue failure of HV_ESRC mixture. It should be mentioned that a shorter fatigue life was observed for the coarser mixtures (i.e., US95_SRC-T3 and HV_OL-T3) when compared with their respective ESRC mixtures from the same project. Both HV mixtures (i.e., ESRC and OL-T3) met the minimum reflective cracking criterion.
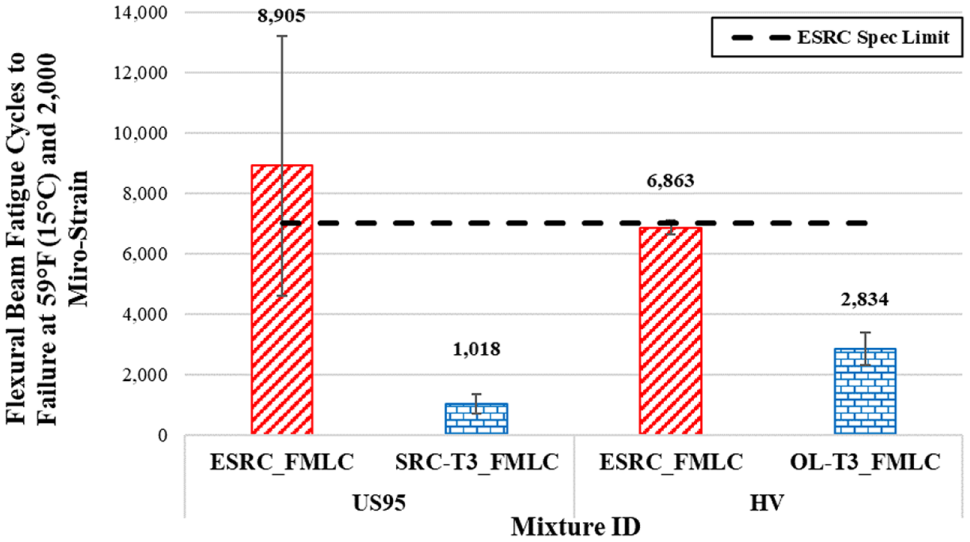
Summary of beam fatigue test results at 59°F (15°C) and 2000 micro-strain for FMLC mixtures. (Error bars represents the mean value plus or minus 95% confidence interval.)
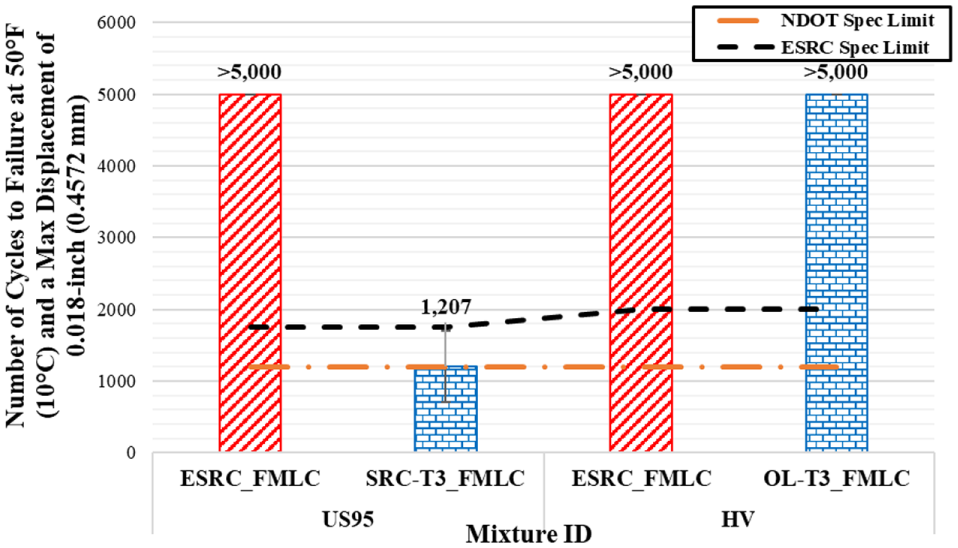
Summary of Texas Overlay test results at 50°F (10°C) and a maximum opening displacement of 0.018 inch (0.4570 mm) for FMLC mixtures. (Error bars represent the mean value plus or minus 95% confidence interval.)
In summary, the results for the FMLC mixtures in terms of high flexibility and resistance to reflective cracking were consistent with the results for the LMLC ESRC mixtures at the mix design stage.
Dynamic Modulus
Many Mechanistic-Empirical (ME) software such as 3D-MOVE and AASHTOWare® Pavement ME uses the dynamic modulus, |E*|, master curve to evaluate the structural response of the asphalt pavement under various combinations of traffic loads, speeds, and environmental conditions. The |E*| property of the AC mix is evaluated under various combinations of loading frequency and temperature ( 10 ). The test was conducted at frequencies of 10, 1, and 0.1 Hz (the 0.01 Hz was only added for the highest temperature) and temperatures of 39, 68, and 104 or 113°F for AC mixes manufactured using PG64-28NV and PG76-22NV asphalt binders, respectively. The E* test specimen consisted of a 4-inch (100 mm) diameter by 6-inch (150 mm) height cylinder cored from the center of a Superpave gyratory compacted sample of 6-inch (150 mm) diameter by 7.0-inch (175 mm) height. Three E* samples were tested per mixture type. The average air voids of the tested E* samples from US95 project were 3.5, 4.0, and 7.0% for the US95_ESRC, US95_SRC-T3, and US95_OL-T2C mixtures, respectively. The average air voids of the tested E* samples from HV project were 3.1 and 3.7% for the HV_ESRC and HV_OL-T3 mixtures, respectively.
A temperature of 68°F (20°C) and a loading frequency of 10 Hz were selected to represent an intermediate effective pavement temperature and a standard highway loading speed for the analysis, respectively. In addition, temperatures of 113°F (45°C) and 104°F (40°C) have been selected for the US95 and HV mixtures, respectively, representing an effective high temperature at which the mixture is susceptible to rutting. Figure 9 compares the E* property at 10 Hz and at the intermediate and high pavement temperatures for the different evaluated AC mixtures. A review of the |E*| data presented in Figure 9 reveals the following observations:
For US95 project, both evaluated interlayer asphalt mixtures (i.e., ESRC, and SRC-T3) exhibited dynamic moduli values comparable to the respective OL-T2C mixture at the intermediate temperature (68°F [20°C]). Meanwhile, the interlayer mixtures showed a lower E* value at the high temperature (113°F [45°C]) which can be induced by the finer aggregate gradation and the relatively higher asphalt binder content.
For HV project, the overlay mix (OL-T3) exhibited significantly higher dynamic moduli values than the interlayer mix at the intermediate and high temperatures (i.e., 68°F [20°C], and 104°F [40°C]).
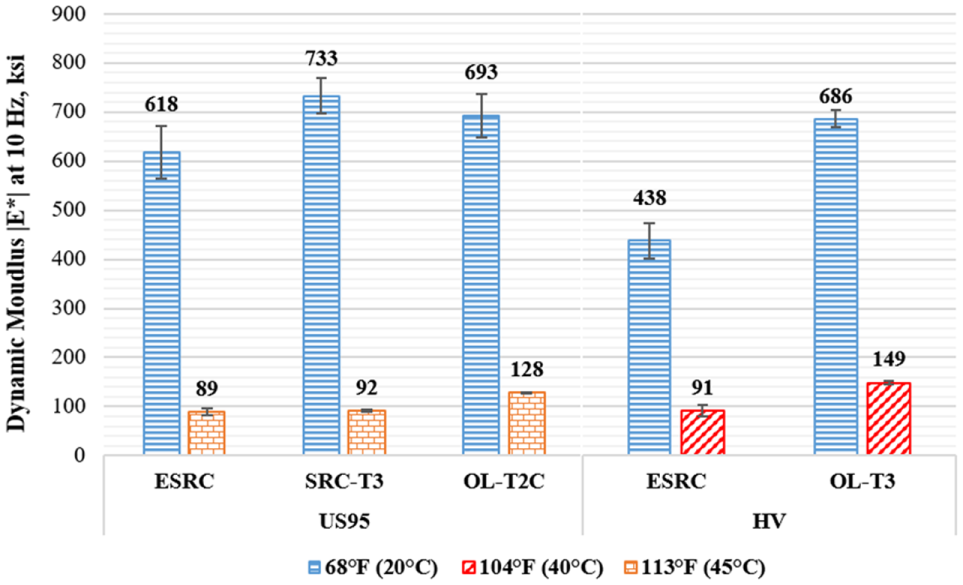
Comparison of dynamic modulus values at 10 Hz for all evaluated mixtures. (Error bars represent the mean values plus or minus 95% confidence interval.)
It is noteworthy to mention that the ESRC and SRC-T3 mixtures from the US95 project were compacted to a lower air void level than the T2C mixture. On the other hand, the ESRC and OL-T3 mixtures from the HV project were compacted to a similar air void level. For a given asphalt mixture, an increase in dynamic modulus is anticipated with the decrease in specimen air voids level.
Resistance to Fatigue Cracking
The fatigue characteristic of each of the five AC mixtures was evaluated using the flexural beam fatigue test in accordance with AASHTO T321 at an intermediate temperature and multiple strain levels. A fatigue curve for every AC mix was developed by fitting a power regression function between the number of cycles to failure and the applied strain levels. Figure 10 shows the fatigue relationships for all evaluated AC mixes at 68°F (20°C). A review of the presented data reveals the following observations:
The combination of asphalt binder grade and content (i.e., PG64-28NV, and PG76-22NV), aggregate source, and aggregate gradation had a significant impact on the fatigue behavior of the evaluated AC mixtures. For both projects (i.e., US95, and HV), better fatigue characteristics were observed for the ESRC mixes when compared with the remaining mixes at all strain levels; thus indicating an increased flexibility and resistance to fatigue cracking of the ESRC interlayer mixtures.
For the US95 project, the number of cycles to failure at 500 micro-strain for the ESRC was observed to be about 5 and 65 times higher than that of SRC-T3 and T2C mixtures, respectively. This can be attributed to the fine aggregate gradation and high asphalt binder content of the ESRC mixture. Similarly, the ESRC mixture from the HV project showed a number of cycles to fatigue failure about 8 times higher than that of T3 overlay mixture.
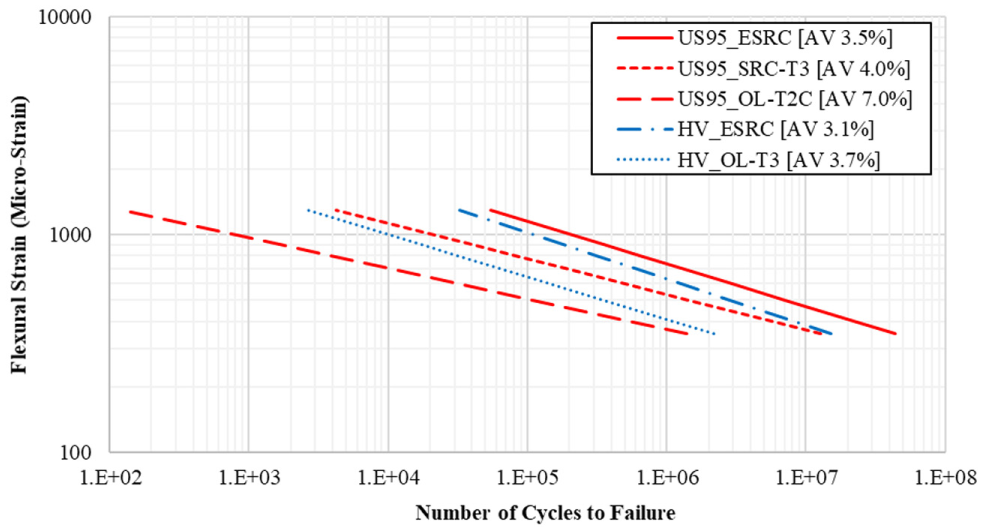
Comparison of fatigue characteristics of asphalt mixtures at 68°F (20°C).
It should be noted that a difference in the laboratory fatigue resistance will not necessarily translate into the same difference in fatigue performance of the AC pavement in the field. Many factors may highly affect the fatigue life of an AC pavement such as stiffness, the developed tensile strain under field loading, the fatigue characteristic of the evaluated AC mixture itself, and the interaction of all these factors. In a mechanistic pavement analysis, an AC layer with higher stiffness and lower laboratory fatigue life (in a strain-controlled mode of loading) may experience lower tensile strain under field loading and result in a longer pavement fatigue life. Therefore, a full mechanistic analysis would be necessary to effectively evaluate the impact of using an AC interlayer in rehabilitation projects.
Resistance to Rutting
The repeated load triaxial (RLT) test was used to evaluate the rutting characteristic of the five mixtures under repeated loading. The permanent (εp) and resilient (εr) axial strains were measured during the RLT test as a function of the number of load repetitions. The resulting cumulative permanent axial strain over the resilient strain (εp/εr) was plotted versus the number of load repetitions (N) to determine the rutting behavior of the evaluated asphalt mixtures at each of the three test temperatures. The rutting relationship (εp/εr versus N) indicates the response of the asphalt mixture to the repeated loading at high temperature. A lower relationship indicates lower accumulated permanent strains with loading, thus predicting a better resistance to rutting. Furthermore, a flatter curve indicates a lower susceptibility of the asphalt mixture to repeated loading. Figure 11 shows the rutting relationships of the evaluated mixtures at 104 and 140°F (40 and 60°C). It should be mentioned that the two selected temperatures are representative temperatures for a surface wearing course (i.e., OL-T2C and OL-T3), whereas the interlayer mixture (i.e., ESRC and SRC) might experience a lower maximum temperature it is located 2-inch (51 mm) below the pavement surface. A review of the presented data reveals the following:
The combination of aggregate source, aggregate gradation, asphalt binder grade (i.e., PG64-28NV, and PG76-22NV), and asphalt binder content had a significant impact on rutting behavior of the evaluated mixtures. For both HV AC mixtures, lower and steeper rutting relationships were observed when compared with the three US95 AC mixtures.
For the US95 AC mixtures, a similar rutting behavior at 104°F (40°C) was observed for OL-T2C and ESRC mixes with the OL-T2C mix being more susceptible to rutting at higher number of load repetitions. Meanwhile, the ESRC mixture showed a better rutting characteristic at 140°F (60°C) regardless of the number of load repetitions. It should be mentioned that the SRC-T3 AC mixture showed the best rutting behavior among the three US95 mixes at both high temperatures (i.e., 104 and 140°F [40 and 60°C]).
For the HV AC mixtures, the ESRC and OL-T3 showed a similar rutting performance at 104 and 140°F (40 and 60°C) with the ESRC mixture being more susceptible to rutting at higher number of load cycles.
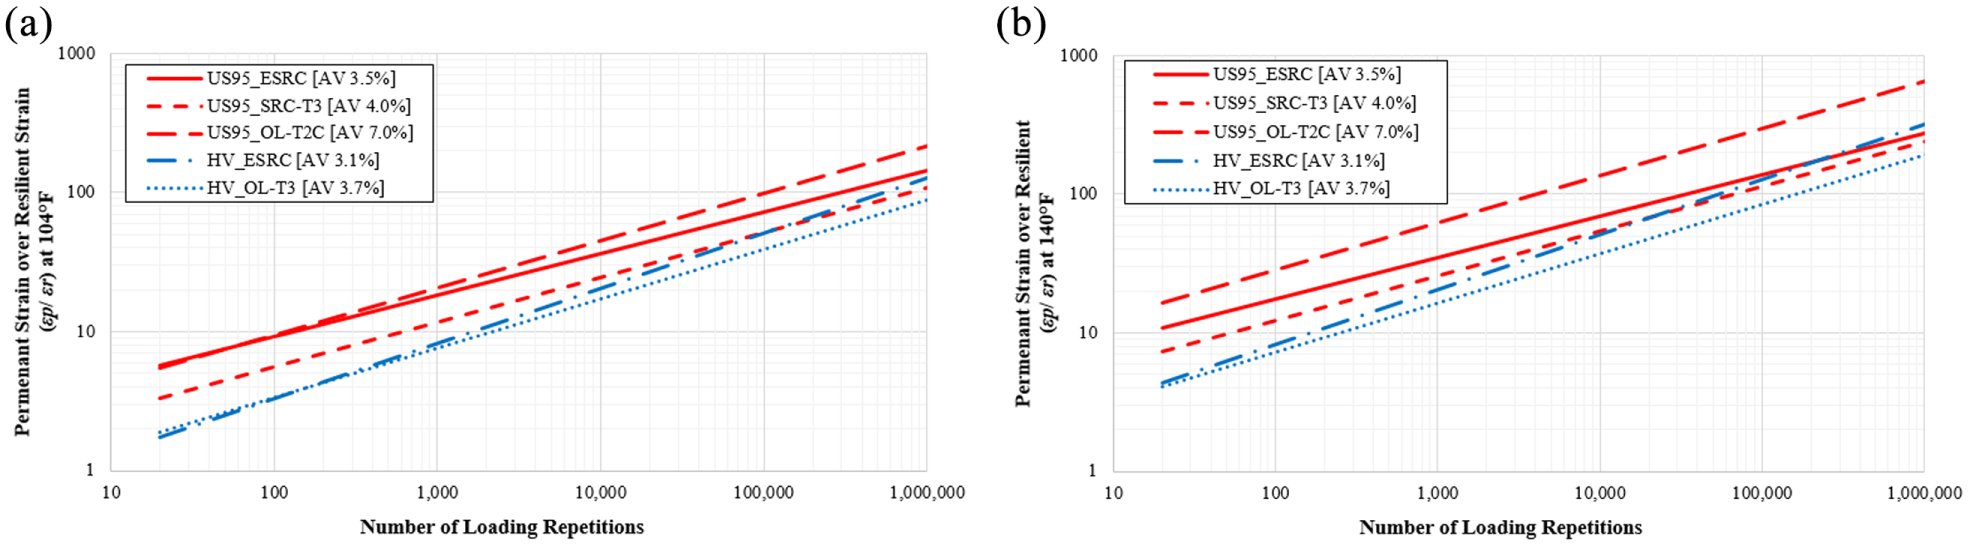
Rutting behavior of asphalt mixtures at (a) 104°F (40°C) and (b) 140°F (60°C).
In general, no rutting issues are anticipated for the ESRC mixtures on both projects during the life of the pavement considering its location within the pavement structure. However, it should be noted that a significant difference in the laboratory rutting resistance will not necessarily translate into the same difference in rutting performance (i.e., rut depth) of the AC pavement in the field. Many factors may highly affect the rutting life of an AC pavement such as stiffness, the developed compressive strain in each of the AC sub-layers under field loading, the rutting characteristic of the evaluated asphalt mixture, and the interaction of all these factors. In a mechanistic pavement analysis, an AC layer with higher stiffness and lower laboratory rutting life may experience lower compressive strains in the AC sub-layers under field loading conditions and result in a better pavement rutting life. Therefore, a full mechanistic analysis coupled with laboratory-measured engineering and performance properties would be necessary to quantify and effectively evaluate the impact of using an ESRC layer under AC overlays rehabilitation.
Field Performance
During production, significant efforts were made by the agencies and contractors to ensure the correct material was used for each layer and to ensure the interlayers were compacted to the target layer thickness. No significant issues were reported during production and construction of either project because of the use of the ESRC. Of particular interest was the noted absence of appreciable rutting in the ESRC layer under moderate construction traffic, for example haul trucks during paving operations despite specifications prohibiting construction traffic directly on ESRC layers. In-place density met specifications on all placed layers for both projects. Field cores were collected after construction to measure and verify the in-place layers thicknesses, and the in-place air voids. The test sections were monitored on yearly basis for long-term field performance to evaluate the efficiency of using ESRC interlayer to mitigate reflective cracking in AC overlays in Nevada. Figure 12 illustrates the findings from the distress survey data.
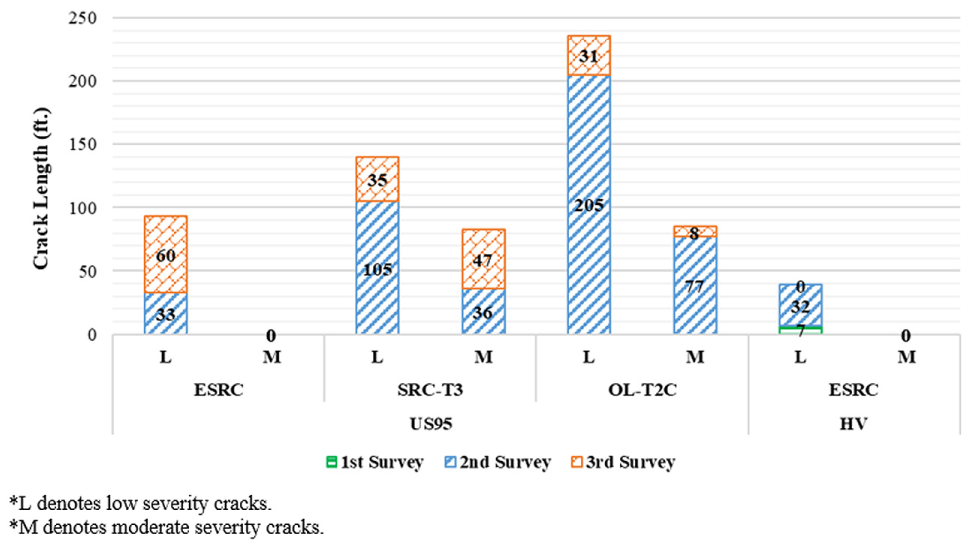
Field distress survey summary chart.
For the US95 test sections, a windshield survey was conducted in August 2016, approximately 13 months after the construction of the test sections. As expected, no distresses were observed in any of the test sections. A follow-up distress survey that was conducted in June 2017, approximately 26 months after the construction of the test sections, showed, in particular, reflective cracking with medium severity on the SRC-T3 and no interlayer (i.e., only OL-T2C) test sections. The SRC-T3 section had 36 ft. (11.0 m) of medium severity and 105 ft. (32.0 m) of low-severity reflective cracking. The T2C section had the most number of reflective cracking with 77 ft. (23.5 m) of medium severity and 205 ft. (62.5 m) of low-severity reflective cracking. The ESRC section showed a minimal number of reflected cracks with only 33 ft. (10.0 m) of low-severity cracks. Recently, a follow-up distress survey was conducted in April 2018 to evaluate the performance of the US95 test sections approximately 3 years (i.e., 34 months) after construction. Similarly, the T2C section showed the most reflective cracking with 85 ft. (25.9 m) medium severity and 236 ft. (71.9 m) low-severity cracks. The SRC-T3 section had 83 ft. (25.3 m) of medium severity and 140 ft. (42.7 m) of low-severity reflective cracking. As expected again, the ESRC section showed a minimal number of reflected cracks with only 93 ft. (28.3 m) of low-severity cracks. Figure 13 shows photographs taken at the time of the 2018 survey for each of the three test sections for the ESRC, SRC-T3, and T2C mixtures, respectively.
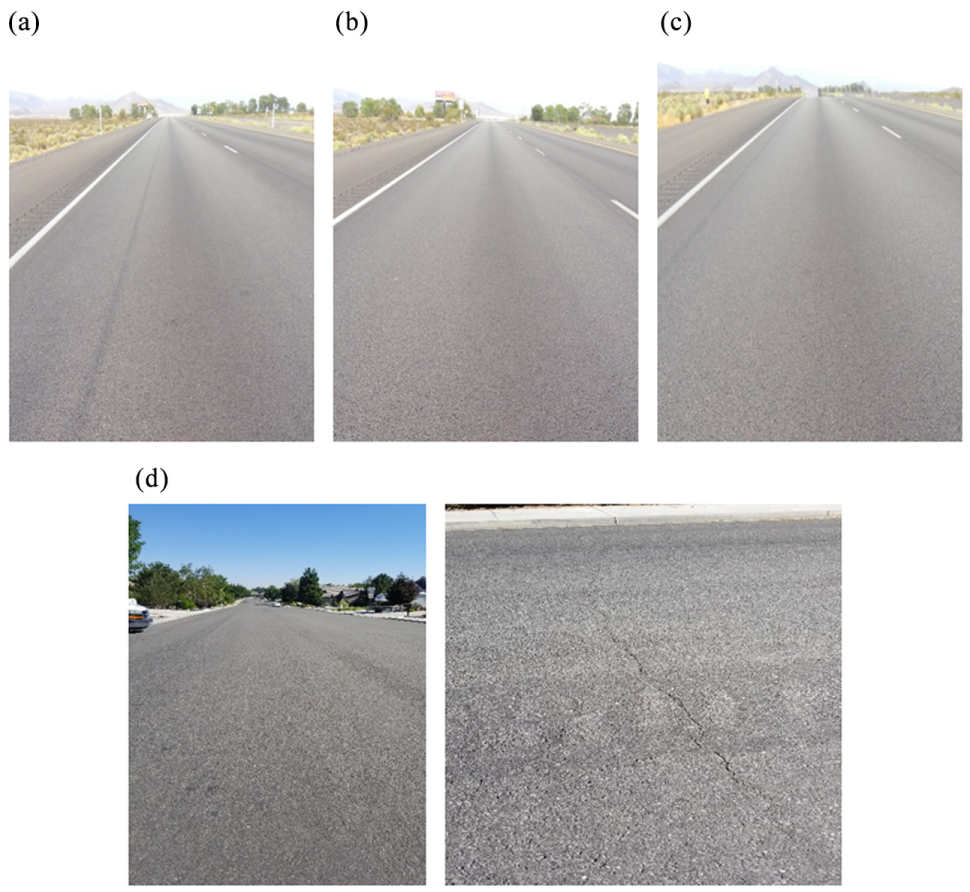
Photographs taken during the 2nd distress survey from (a) test section US95_ESRC, (b) test section US95_SRC-T3, (c) test section US95_T2C, and (d) test section HV_ESRC.
For the HV test sections, a windshield distress survey, conducted in September 2017 and July 2018, approximately 15 months and 25 months after the project construction, respectively, showed a minimal amount of low-severity cracking (i.e., 7 ft. (2 m) in 2017, and 39 ft. (11.9 m) in 2018). Figure 13 shows photographs for the HV test section taken during the survey of 2018.
Cost Analysis
Calibration of Reflective Cracking Model
The basic mechanism for reflective cracking is strain concentration in the AC overlay caused by the movement in the existing pavement at the vicinity of joints and/or cracks. In fact, the majority of reflective cracking is caused by the combination of bending, shearing, and thermal mechanisms resulting from traffic loads or daily and seasonal temperature changes. Various models have been developed to analyze and/or predict reflective cracking. NCHRP Report 669 ( 15 ) recommended a sigmoidal curve having a finite upper asymptote to simulate the amount and severity of reflective cracking as a function of time (Equation 1):

where, RFAS is the reflective cracking amount and severity, ranging from 0 to 100 percent; DTotal is the total number of days since the overlay construction was completed; and ρ, and β are calibration parameters for each severity level.
The calibration parameter ρ is considered as a scale factor for reflective cracking amount and severity; a greater ρ value indicates that to reach a certain amount of reflective crack much accumulated damage has to occur. On the other hand, the calibration parameter β indicates the steepness of the rising portion of the model, simulating the propagation rate of reflective cracking. Figure 14 illustrates the development of low-severity, moderate-severity, and total cracking amount for US95 and HV field mixtures after calibration of the reflective cracking model to the observed respective field performance.
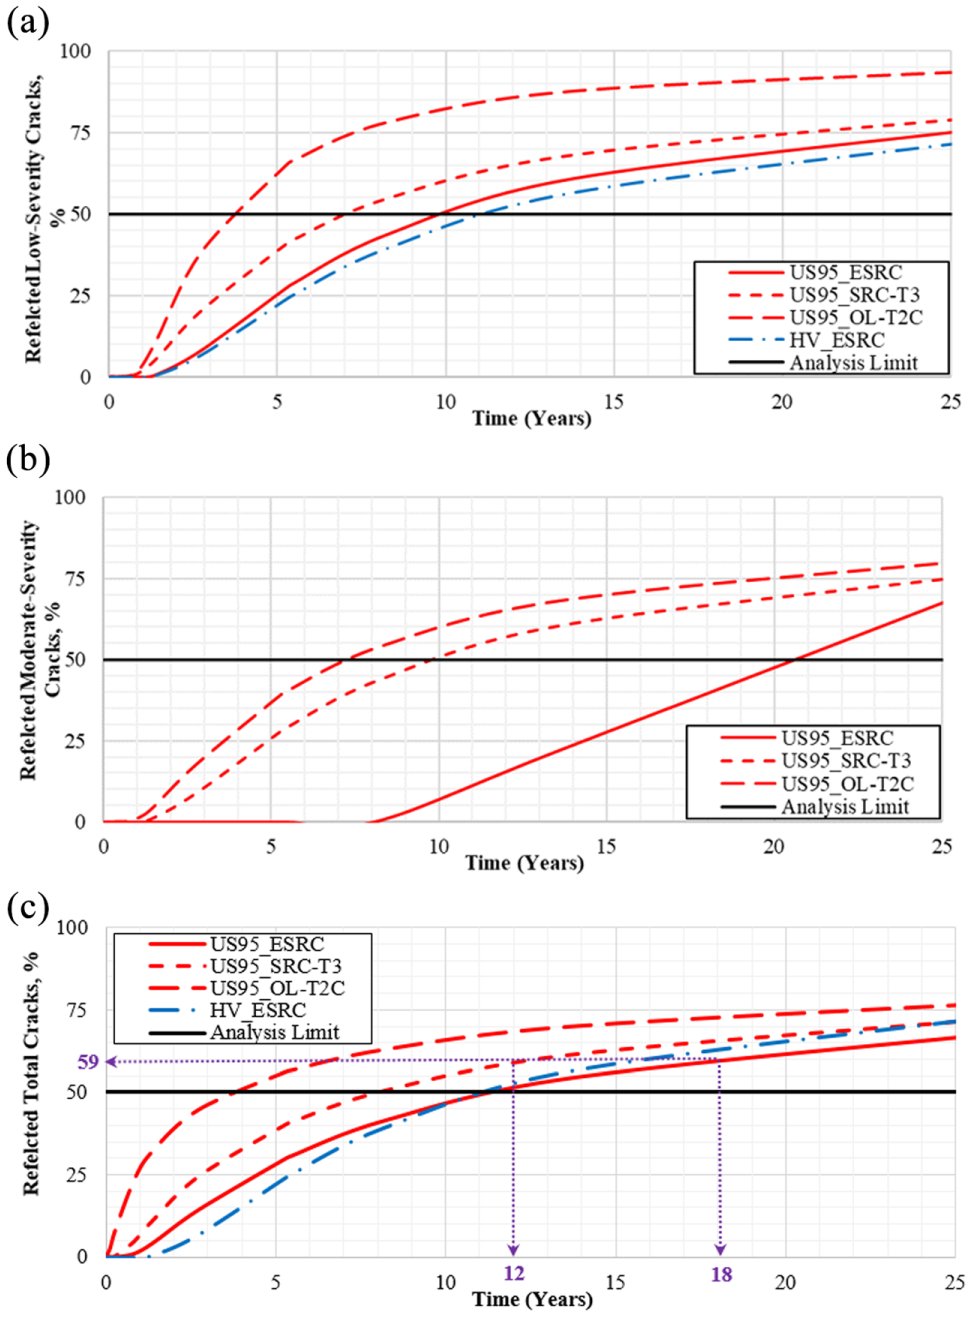
Estimated percent of reflected cracks with time: (a) low-severity; (b) moderate-severity; (c) total cracks.
For the US95 project, the preliminary analysis shows (Figure 14(a)) that low-severity cracks will show up on the AC surface within less than a year for the SRC-T3 and OL-T2C sections and within 1.5 years for the ESRC section. The ESRC, SRC-T3, and T2C sections will take almost 10, 7, and 4 years for 50% of the low-severity cracks to propagate to the surface. A similar analysis (Figure 14(b)) was conducted for the moderate-severity cracks. These cracks (moderate severity) are expected to start showing up in the AC overlay 8 years after construction for the ESRC section, and it will take 20 years for 50% of these cracks to propagate to the surface. The moderate-severity cracks will show up earlier on the other field sections and will take up to 10 and 7 years for 50% of these cracks to propagate through the AC overlay of the SRC-T3 and OL-T2C sections, respectively. Without considering the severity level of the cracks, the preliminary analysis (Figure 14(c)) shows that the ESRC test section will take 10 years for 50% of the cracks to propagate to the surface, whereas it takes 8 years for the SRC-T3 section. The T2C section will take only 3 years for 50% of the cracks to show on the surface. It should be mentioned that the calibration of the model was based on three distress survey data points.
For the HV project, where no control section was constructed, the pavement only exhibited low-severity cracks that started showing up 1.5–2 years after construction and are expected to reach an amount of 50% after 11 years. It should be mentioned that, based on typical behavior of conventional dense-graded asphalt mixtures in this area, reflective cracks would typically start showing up at the surface of the AC overlay within 1–2 years after construction.
Life Cycle Cost Analysis
The LCCA is an engineering economic analysis tool that quantifies the total costs of alternative investment options for a given project. The total cost includes both the agency cost and user cost incurred during the lifetime of the pavement. This section discusses the LCCA of the different strategies with current and predicted field performances. Following the NDOT Manual for Road Prioritization Category Life-cycles for Flexible Pavements, an AC overlay is constructed typically 12 years after the new construction/rehabilitation of an asphalt pavement section. If a SRC-T3 interlayer was applied after 12 years in between the existing AC layer and the AC overlay, approximately 59% of the cracks (Refer to Figure 14(c)) are expected to propagate to the surface before the second overlay after 12 years from the rehabilitation is due (i.e., 24 years after construction). However, if an ESRC interlayer is applied after 12 years, the same amount of cracks (i.e., 59%) is expected to show up on the surface 18 years after rehabilitation (i.e., 30 years after original construction).
Based on the above analyses and referring to the NDOT Manual for Road Prioritization Category Life-cycles for Flexible Pavements, the following treatment activities were considered for the LCCA of the three different test sections on US95 project:
Strategy I: US95_ESRC test section: 3 inch (76 mm) mill and fill with 1 inch (25 mm) ESRC and 2 inch (51 mm) OL-T2C at year 12 and 30 from original reconstruction.
Strategy II: US95_SRC-T3 test section: 3 inch (76 mm) mill and fill with 1 inch (25 mm) SRC-T3 and 2 inch (51 mm) OL-T2C at year 12 and 24 from original reconstruction.
Strategy III: US95_OL-T2C test section: 3 inch (76 mm) mill and fill with 3 inch (76 mm) OL-T2C at year 12 and 24 from original reconstruction.
A unit material cost of $87.00 per ton for SRC-T3 mix and $67.00 per ton for T2C mix were obtained from published bid documents for NDOT contract 3577 ( 16 ). The material cost for ESRC was estimated to be $99.00 per ton. An analysis period of 30 years and a discount rate of 3% were selected. The user cost for an hour delay of a passenger car, single unit truck, and combination truck were assumed at $13.96, $22.34, and $26.89, respectively, as recommended by the Federal Highway Administration (FHWA). Traffic data from NDOT database along with free flow capacity of 2,105 vphpl (vehicle per hour per lane) and queue dissipation capacity of 1,750 vphpl were used for this LCCA analysis. For the purpose of LCCA, even though the life expectancy of the overlay in OL-T2C section is far less than the SRC-T3 section, similar service life of 12 years and structural life of 14 years were considered for both sections as discussed earlier. However, the service life of 18 years for the ESRC section was estimated using the reflective cracking amount and severity model to reach the same amount of reflective cracking as in the SRC-T3 section after 12 years. In addition, a structural life of 20 years was considered for the ESRC section.
Figure 15 shows the agency and user costs in terms of present value for each of the three strategies. In addition, Figure 16 shows the expenditure stream of the agency and user costs along the selected analysis period (i.e., 30 years). Based on the LCCA outcome using Realcost 2.5 software ( 17 ), the net present value (at the construction year) of the agency cost for a lane mile of roadway showed the lowest estimation for strategy I at $87K, followed by $115K for Strategy II, and $112K for Strategy III. The net present value of the user cost for a lane mile of roadway for strategies I, II, and III was estimated at $21K, $27K, and $27K, respectively. The LCCA analysis shows that Strategy I (ESRC interlayer) can lead to $28,000 in agency cost-savings (24% savings) and $6,000 in user cost-savings (22% savings) over the SRC-T3 mixture for a lane mile of roadway. In summary, while the ESRC mixture has a higher initial cost, its agency and user life cycle costs per lane mile are lower and resulting in an average savings of 23%. A similar LCCA analysis will be conducted for the HV field project to assess the effectiveness of the PG64-28NV ESRC interlayer once more distress survey data are available.
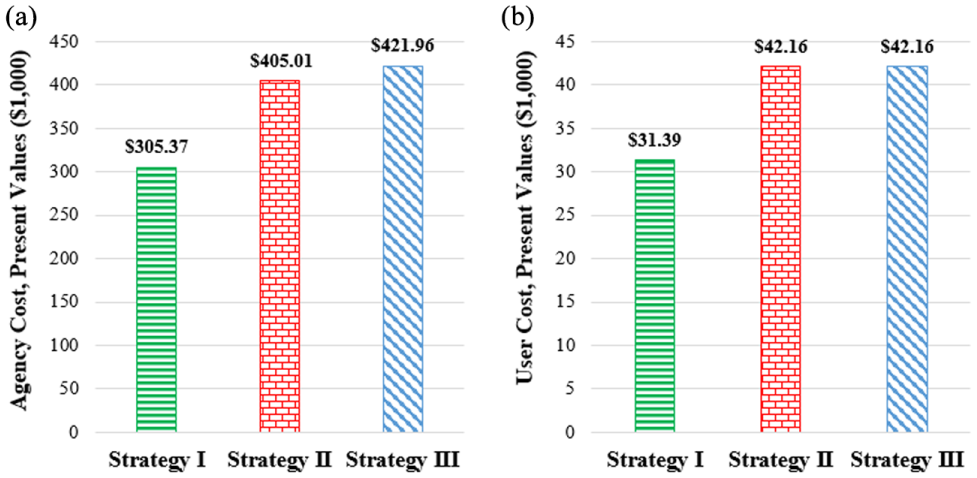
Present values for the three identified strategies: (a) agency cost; (b) user cost.
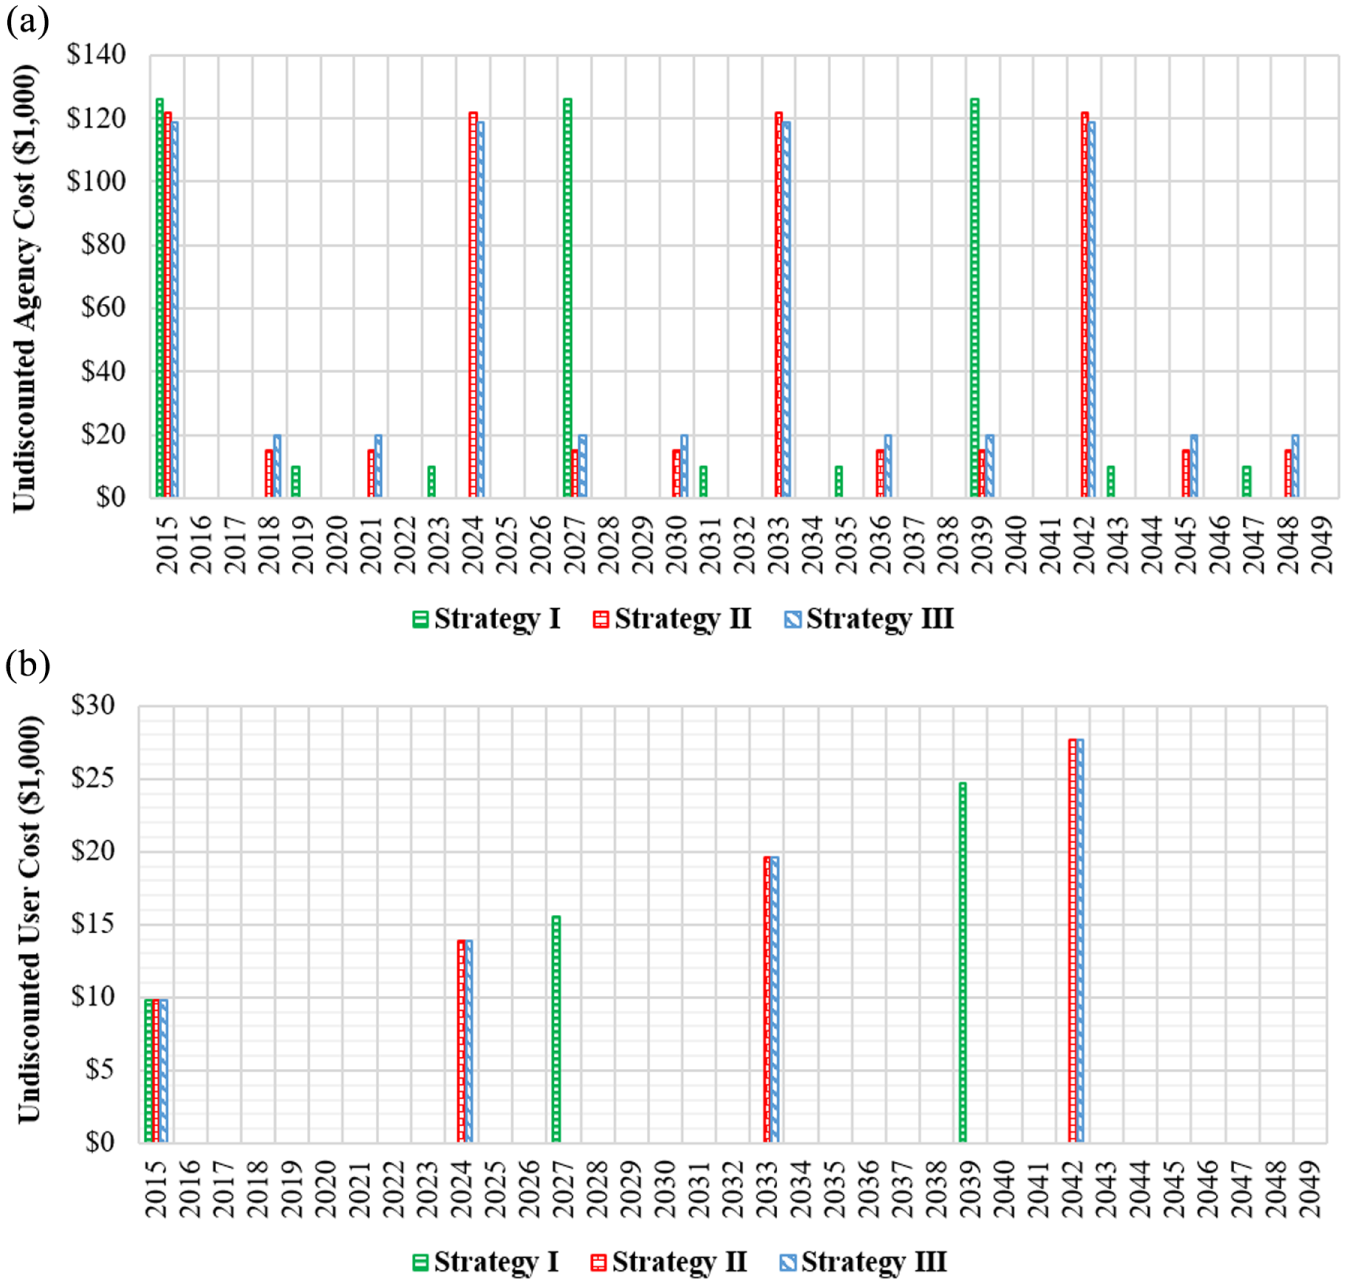
Expenditure stream of undiscounted costs along the analysis period for the three identified strategies: (a) agency cost; (b) user cost.
Overall Summary and Conclusions
Reflective cracking is one of the primary distresses found in AC overlays of asphalt pavements. The penetration of water and foreign debris into these cracks accelerates the deterioration of the AC overlay and the underlying layers, thus causing premature failure in the structural and functional performance of an asphalt pavement. Many techniques have been historically used to mitigate reflective cracking in AC overlay over AC pavements. Previous studies indicated that none of those techniques was able to completely stop reflective cracking. The overall objective of this paper is to assess the field performance and cost-effectiveness of ESRC mixtures in Nevada. Furthermore, a LCCA was then performed to assess the effectiveness of ESRC interlayer based on distress survey data collected at different in-service pavement ages.
The ESRC mix design specifications were implemented on demonstration projects at two different locations throughout the state (i.e., US95 Las Vegas, and Hidden Valley). US95 project included test sections with three different strategies: (1) AC overlay on top of the ESRC mixture (Strategy I); (2) AC overlay on top of the SRC-T3 mixture (Strategy II); and (3) AC overlay without any stress relief course interlayer (Strategy III). The HV project was 0.5 miles long (800 m) and consisted of an AC overlay (T3) on top of the ESRC mixture.
The ESRC mix designs (i.e., US95_ESRC, and HV_ESRC) were developed in the laboratory according to the developed specifications shown in Table 1 and Table 2. Meanwhile, the other mixtures (i.e., US95_SRC-T3, US95_OL-T2C, HV_OL-T3) were developed according to the corresponding agency specifications. During construction, the constructability of the ESRC was observed and raw materials and plant-produced mixtures were collected to evaluate the performance of the mixtures in the laboratory. The plant-produced mixtures collected during the construction were also evaluated for asphalt binder content, and aggregate gradation. The FMLC ESRC and SRC-T3 mixtures were evaluated in terms of their resistance to fatigue cracking and reflective cracking and compared with the criteria shown in the ESRC performance-based mix design specifications. In addition, all field-produced mixtures were evaluated in terms of stiffness property, fatigue susceptibility, and rutting resistance. The evaluation of field-produced mixtures showed superior performance for the ESRC mixes compared with the other mixtures while maintaining an acceptable stability, which can be attributed to the increased asphalt binder content and the finer aggregate gradation. The ESRC mixture did not show any issues during its production and construction.
Condition surveys were conducted approximately 13, 24, and 34 months after construction of the U.S. 95 test sections, and 15, and 25 months after rehabilitation for the HV pavement. The surveys revealed a minimal number of reflected cracks for the ESRC sections on both projects. It should be mentioned that the section with no interlayer showed a greater number of reflected cracks at higher severity levels. Based on the collected distress survey data, the reflection cracking amount and severity prediction model (NCHRP report 669) was calibrated for all four pavement sections. The percentage of reflected cracks with time was then estimated for each pavement section. Without considering the severity level of the cracks, the analysis showed that the US95_ESRC and HV_ESRC pavement sections would take approximately 11 years for 50% of the cracks to propagate to the surface, whereas the same level of cracking will reflect in 8 and 3 years for US95_SRC-T3 and US95_T2C pavement sections, respectively. Following the manual for Road Prioritization Category Life-cycles for Flexible Pavements, a LCCA study was performed to approximately quantify the cost-benefit effectiveness of using an ESRC interlay for AC overlay rehabilitation in Nevada. In summary, although the ESRC mixture has a higher initial cost, its agency and user life cycle costs per lane mile are lower, resulting in an average savings of 23%.
The successful completion of these two demonstration projects further supports the viability of the ESRC strategy as a producible and constructible alternative. Current laboratory efforts in the ESRC mixtures indicate substantial benefits in terms of reflective cracking resistance without causing undue detriment to other performance characteristics of the rehabilitation treatment. These and subsequent field monitoring projects will ultimately decide the true in-service benefits of the ESRC strategy, but for the time being the results look promising.
Footnotes
Acknowledgements
This study was sponsored by Nevada Department of Transportation (NDOT) and the Community Services Department of Engineering and Capital Projects. The authors would like to acknowledge both agencies for their help in collecting raw materials, field-produced mixtures, cores, FWD data, and any assistance needed in the field.
Author Contributions
The authors confirm contribution to the paper as follows: study conception and design: JH, EYH, and PES; Data collection: JH, MP, and NEM; Analysis and interpretation of results: JH, EYH, and MP; Draft manuscript preparation: JH, EYH, and MP. All authors reviewed the results and approved the final version of the manuscript.
The Standing Committee on Critical Issues and Emerging Technologies in Asphalt (AFK10) peer-reviewed this paper (19-05959).
The contents of this study reflect the views of the authors, who are responsible for the facts and the accuracy of the data presented herein. The contents do not necessarily reflect the official views or policies of any of the sponsors at the time of publication.