
Abstract
Globally, transport authorities are investing to improve the quality of public transport (PT) services by developing integrated networks. The success of these networks relies on multimodal transfers. However, making a transfer means more time will be spent outside the vehicle compared with a direct route, and for women, this means being exposed to the urban environment of stations for longer. The purpose of this study is to investigate the role gender plays in people’s decisions to make transfers, in order to develop integrated systems that are equitable. A survey was undertaken in three major cities in New Zealand. A total of 2,173 people, car drivers, and PT users participated. Results show that women drivers are 30% more likely than men to make a transfer, given time savings. Waiting time is the most influential factor and has a greater effect on women’s decisions to make transfers. The factor “perceived safety at stations” was only significant for female riders. With the presence of security guards, female car drivers were three times more likely to ride a route with transfer, compared with males who were two times more likely. Women, car drivers, and PT users were slightly more likely to make a transfer given good quality information and covered walkways. It is expected that these results will provide practitioners with some guidance when designing transfers for an integrated system. The limitations women face during their travels can be alleviated by implementing a PT system that is designed to meet their needs more closely.
In the last decade, a considerable amount of effort has been made to increase the accessibility of public transport (PT). This has been achieved by authorities transforming their current networks into integrated PT systems ( 1 ). Nonetheless, integrated PT systems rely on riders to make transfers, which most commuters perceive as an inconvenience ( 2 ). This paper focuses on the effect that gender has on the factors that influence how people choose to make transfers.
The significance of the role that gender plays in transport choices is evident in a few studies ( 3 , 4 ). Women travelers typically have different transport needs compared with men, given their greater share of household responsibilities. Therefore, they commonly have more complex activity patterns and are required to be more organized in their trip-chain plans. Because of their complex trip chains, those who cannot afford a car suffer from poor PT services (e.g., long wait times, poor information, unsafe stops and stations) ( 5 ). Those who can afford a car become heavily dependent on their vehicle. As such, there is a need to investigate how integrated PT systems can provide women with a more affordable and efficient transport alternative. The aim of this research is to determine the factors that are similar and different in male and female decisions to make transfers in an integrated system. A user-preference survey was conducted in the three major cities in New Zealand: Auckland; Wellington; and Christchurch. The data collection section discusses the data collection process and the characteristics of the cities. The next section provides a summary of findings from the relevant literature.
Literature Review
Role of Transfers in an Integrated Public Transport System
The purpose of an integrated system is to provide a greater number of destination choices that are accessible to PT users. One of the key components in achieving such a system is to develop “seamless” transfers. The role of transfers in an integrated system is to: (a) provide a physical and operational connection among the multimodal routes (e.g., bus, train, and ferry services, etc.) of a PT network; and (b) reduce operational costs for providers. The integration of a system can be defined by five key design elements: (a) network integration; (b) fare integration; (c) information integration; (d) physical integration of stations; and (e) coordinated schedules ( 6 ).
Proper integration of a multimodal transport system can reduce wasteful duplication of route services ( 7 ). Integrated timed transfers allow coordination among the routes of a multimodal network. This is achieved by operators synchronizing their scheduled routes to develop a pulsed-hub network ( 8 ). Terminals also need to be physically connected for the transfers to be perceived as “seamless.” Information integration is a key element in the success of uptake for integrated systems ( 9 ). Intelligent transport systems, such as automatic vehicle location systems and in-vehicle real-time information, can be used to improve the interoperability between different services. Another common global approach in the development of integrated multimodal systems has been the fare and ticketing system ( 10 ). Fare systems integration, which minimizes the cost of transfers, has been shown to increase ridership after implementation ( 11 ).
Trip Attributes Influencing Use of Transfer Routes
Several studies have identified total travel time, reliability, and transfer time as the main factors in riders’ perception of transfer routes ( 12 – 14 ). Total travel time, for commuters, has been found to be more significant than transfer waiting and walking time ( 15 ). There is much support for transfer waiting time being valued more than transfer walking time ( 16 , 17 ). Chowdhury et al. investigated the similarities and differences in policy makers’ and users’ perception of services provided by an integrated system ( 18 ). The study revealed that network integration and fare integration were the most important elements for both policy makers and PT users. However, coordinated schedules (timed transfers) were important to users and were not deemed as a mandatory service from the policy makers’ perspective. Another study by Chowdhury et al. showed that commuters prefer well-designed connections between terminals over information integration ( 19 ). The layout of a terminal that is open plan and has adequate information provisions, such as maps of local street networks and walkways between terminals, can reduce perceived walking times. Real-time information and shelters can also ease the burden of waiting for a vehicle ( 17 ).
Role of Gender in Public Transport Ridership
Women have a higher probability of using PT for trip purposes other than commuting compared with men ( 20 ). Studies related to gender for ridership evaluations have typically focused on women’s needs ( 3 , 21 ). Personal safety has been identified as one of the most importance factors in women’s travel decisions. A few studies discussed the harassment faced by women when using PT ( 22 – 24 ). Harassment can be classified as nonconfrontational (e.g., leering, sexualized slurs, offensive language) and confrontational (e.g., following the victim, aggressive speech, sexual assault) ( 22 ). Stark and Meschik discussed that fear of harassment can constrain how women travel and be the primary decision-making factor for mode choice, route selection, and the time of travel ( 25 ). Women’s concerns about crime affect not only the threshold decision of whether to use PT, but also when to use it and which mode ( 23 ). Fear can lead to women completely avoiding the use of PT and avoiding making walking trips at night.
In many cities, women are captive users. They have little access to other forms of transport modes ( 23 ). Fear of victimization can limit their access to education, employment, and other opportunities. Commonly, women are seen to make minor modifications to how they travel in response to the fear of harassment. This includes getting off the vehicle at an earlier stop, moving to a safer space in the station or vehicle, standing with other women, and placement of their bag to avoid unwanted touching. When walking through “unsafe places,” many women use their mobile phones as an active measure to reduce their anxiety ( 26 ).
As discussed earlier, more transport authorities are focusing on transforming their PT network into an integrated multimodal system. As these systems are reliant on transfers, it means that a typical route will require the user to spend more time outside of the vehicles compared with a direct route. For women, it means more time being exposed to the physical environment of a station. To ensure that integrated systems are equitable, the role that gender plays in people’s decisions to make transfers needs to be recognized in design and implementation. Unless women’s needs are addressed, they will continue to be limited in their use of PT and be unable to receive the full benefits provided by an integrated system. It is expected that the findings from this study will assist practitioners in designing transfers for a multimodal network and thereby help alleviate some of the transport limitations faced by women.
Data Collection and Background of Case Study Cities
Data Collection: Process and Questionnaire
Data was obtained from three major cities in New Zealand. They are Auckland, Wellington, and Christchurch. A total of 2,173 commuters participated in the survey. Of the 2,173 commuters, 1,247 are from Auckland, 499 are from Wellington, and 427 are from Christchurch. The section on the description of the three major cities discusses the cities’ characteristics. Data was collected by employing a survey company who attained three samples from its extensive database. The sample from each city is representative of its population. Collectively, the three samples formed the data set for this study’s analysis.
An online questionnaire, estimated to take approximately 30 min, was sent to potential participants. The questionnaire was in English. The response rate was 15%, which is typical of online surveys. Potential participants were sent a reminder email after 48 H of receiving the initial invitation and no more than two reminders were sent per person. Both car drivers and current PT users were included in this study to obtain a holistic understanding of how people perceive transfers, given that one of the aims of integrated PT systems is to increase ridership.
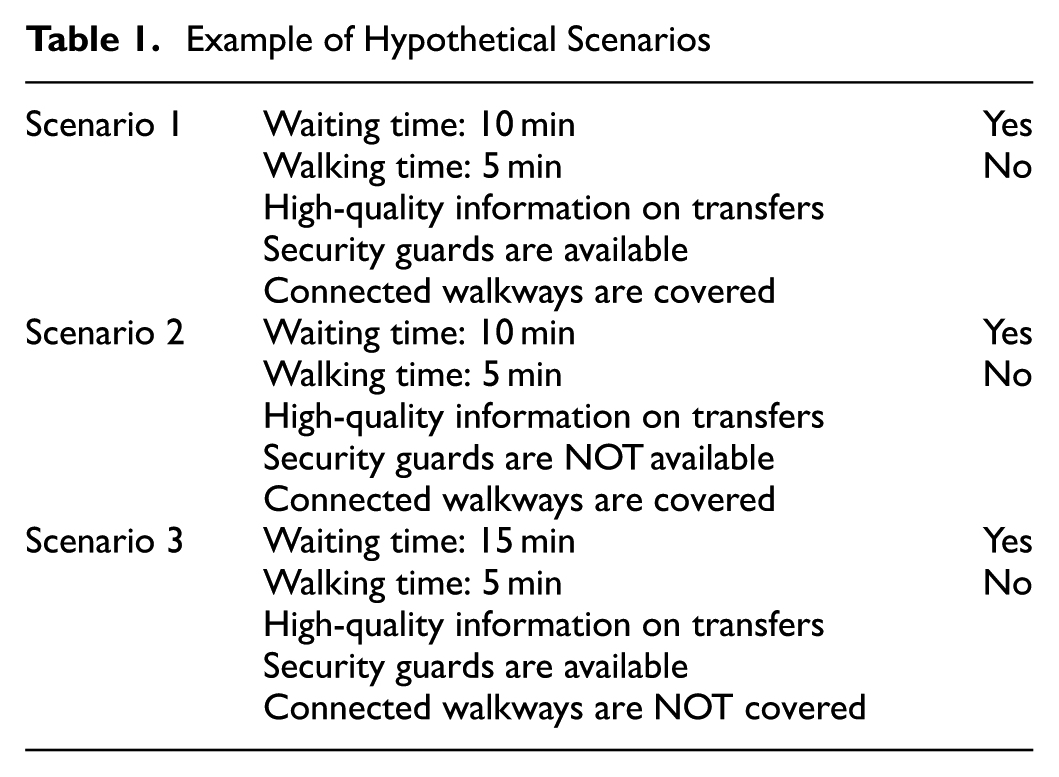
The questionnaire had three sections: (a) general sociodemographics; (b) current mode choice and trip characteristics; and (c) hypothetical scenarios. All participants were presented with eight hypothetical scenarios. They were asked to answer these scenarios based on the minimum travel time savings they would prefer for a route involving one transfer. Participants were not asked about travel cost savings because a recent fare structure in New Zealand resulted in no cost penalties for making a transfer and a reduced fare for transport disadvantaged groups (e.g., students, elderly, individuals with disabilities) ( 27 ). Each scenario had varying attributes of a transfer. The varied attributes included waiting time, walking time, high-quality information on transfer, security guards, and availability of covered walkways. Three of the eight hypothetical scenarios are shown in Table 1. For the scenarios, as the response is dichotomous, binary logistic regression models were developed to predict the dependent variable as a function of the predictor variables. The general binary logistic model is shown in Equation 1 and can be alternatively written in the logit form as shown in Equation 2:


where
P(X) = the probability of the dependent variable occurring,
α = the intercept (constant),
Example of Hypothetical Scenarios
The logit is the natural logarithm of the odds that the dependent variable is 1 as opposed to 0. Kleinbaum and Klein show how Equation 2 can be used to derived the odds ratio for the independent variables ( 28 ).
Description of the Three Major Cities: Auckland, Wellington, and Christchurch
The most recent census available is from 2014. Auckland metropolis is New Zealand’s largest and most cosmopolitan region with a population of 1.5 million. Auckland city is the largest employer in the country, attracting over 50% of the employed population ( 29 ). The median age of those living in Auckland is 35 years. The median household income is $76,500 per annum, which is the highest median across the country ( 30 ). Wellington, which is the nation’s capital, has a population of around 496,000 and Christchurch has around 341,500 residents ( 30 ). Both Auckland and Wellington are located in the North Island, whereas Christchurch is located in the South Island.
In terms of mode share, data from the National Household Travel Survey showed that 34% of the female population use PT whereas only 26% of men use it. Christchurch has the smallest PT network compared with the other two cities, whereas Auckland has the largest ( 31 ). Auckland’s PT system includes bus, train, and ferry services. In 2013, Auckland Transport (AT), the government authority, produced a statutory document, the Auckland Regional Public Transport Plan. It aims to provide commuters in Auckland with a sustainable transport system that is inclusive, safe, integrated, and affordable. In August 2016, a new integrated smart ticketing system called the AT HOP was implemented. This electronic ticketing system does not require riders to purchase additional tickets when making transfers. During this time, a new mobile application that provides real-time information for navigation also became available. The Northern Busway, located in Auckland, is the nation’s first bus rapid transit. Local feeder routes are connected to five designated stations along the Northern Expressway. Buses on the main line have a frequency of less than 5 min during morning and evening peak hours. Transfers occur between the local routes and the main line. Wellington’s network includes buses, ferries, trains, and cable cars for commuters; Christchurch’s includes buses and ferries ( 32 ). People who live in the outer suburbs of Wellington city travel to the city center by train. Buses are commonly used for short trips within the central city. All three cities facilitate transfers by providing no extra cost and a mobile application that gives information about services.
Results
Summary of Participants’ Characteristics
Of the 2,173 participants, 290 stated that they have a disability that prevents them from independent travel. Given that people with disabilities have different transport needs, they were omitted from the analysis. The data analysis was undertaken for 1,883 participants. Of the 1,883, 53% females, 46% males, and 1% gender diverse people participated in the survey. Table 2 provides a summary of male and female participants’ sociodemographic and trip characteristics. Given the small number of participants who identified themselves as gender diverse, they were excluded from further analysis.
Summary of Participants (N = 1,883)
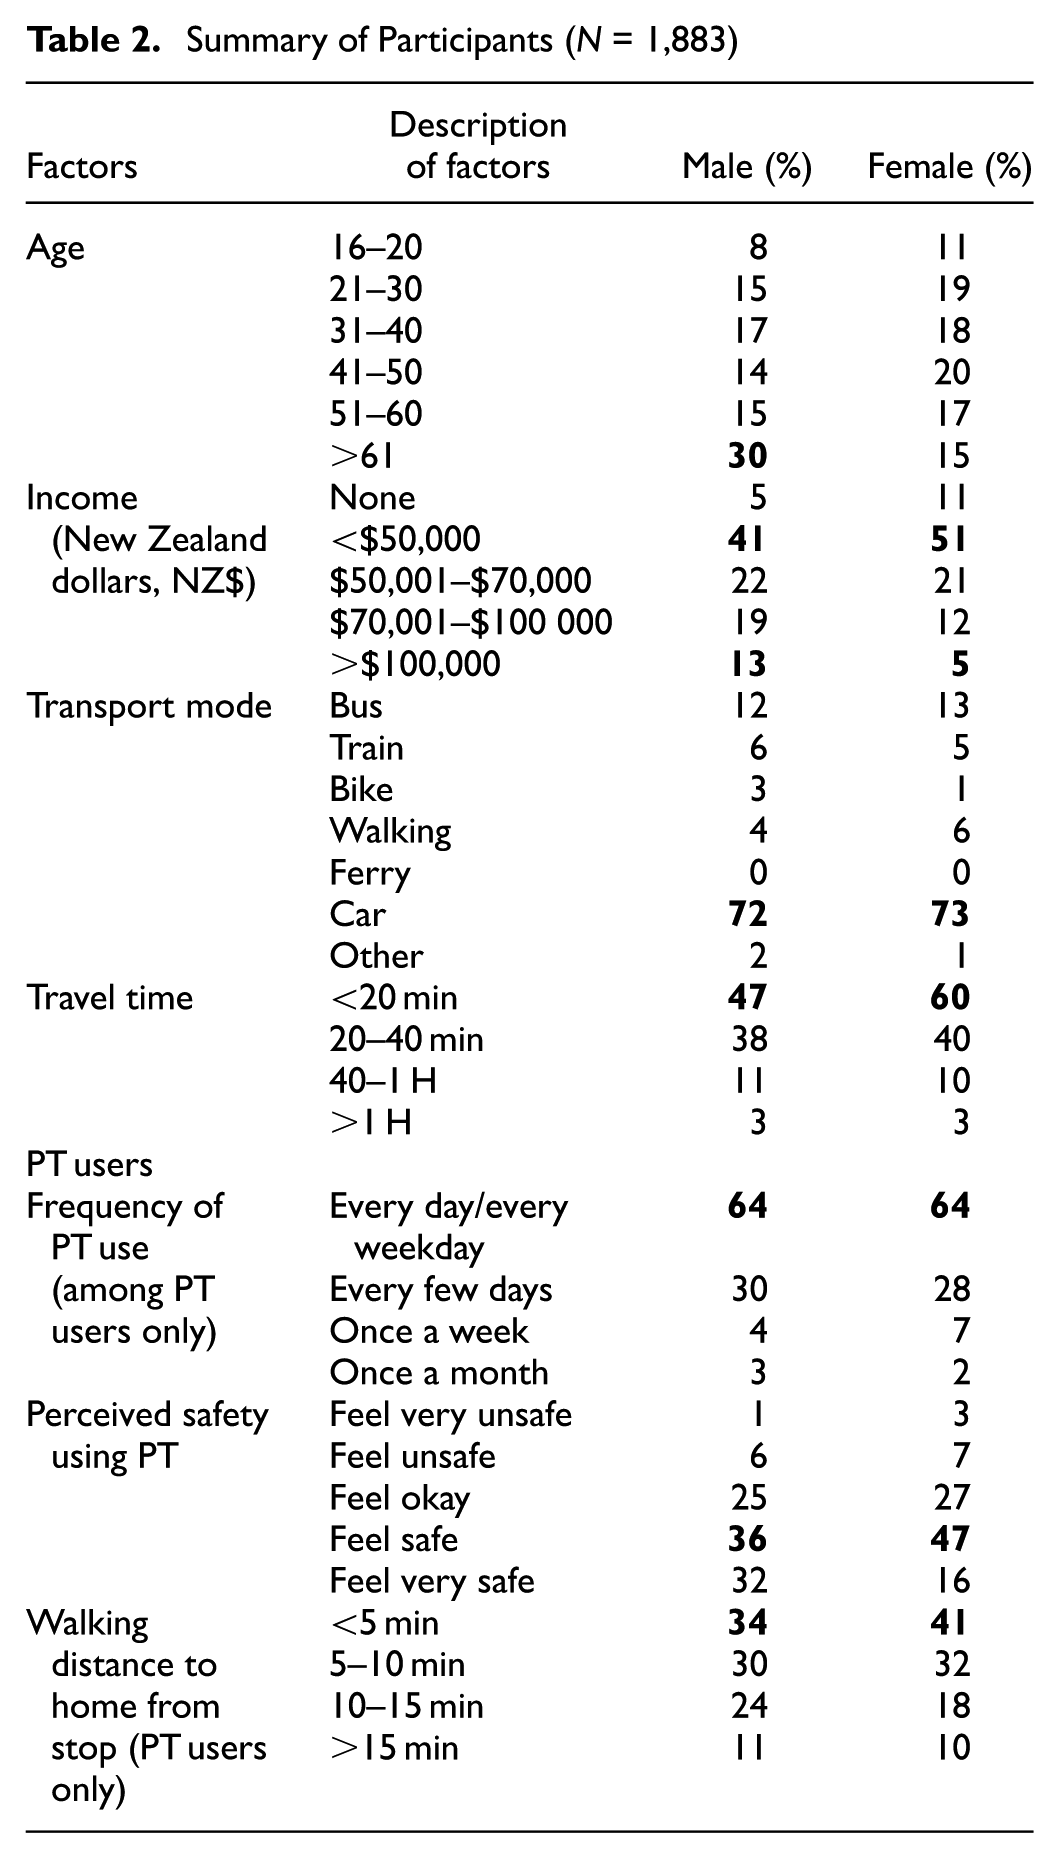
Of the 1,883 participants, 345 were PT users and 1,377 were car drivers. A higher proportion of male participants is above 61 years old (30%) compared with females (15%). Most of the participants earned less than 50,000 New Zealand dollars (NZ$). In the sample, more women are in the income group below $50,000 (10% more than men) and only 17% of the female participants earn more than $70,000 compared with 32% of the male participants. Around 73% of the participants drove a car and only 18% used PT. A smaller proportion (7%) used active modes (walking and cycling) as their main transport mode. Around 89% of the car drivers travel less than 40 min compared with 82% of PT users. Of the PT users, most were frequent riders.
Results from Transfer Route Scenarios
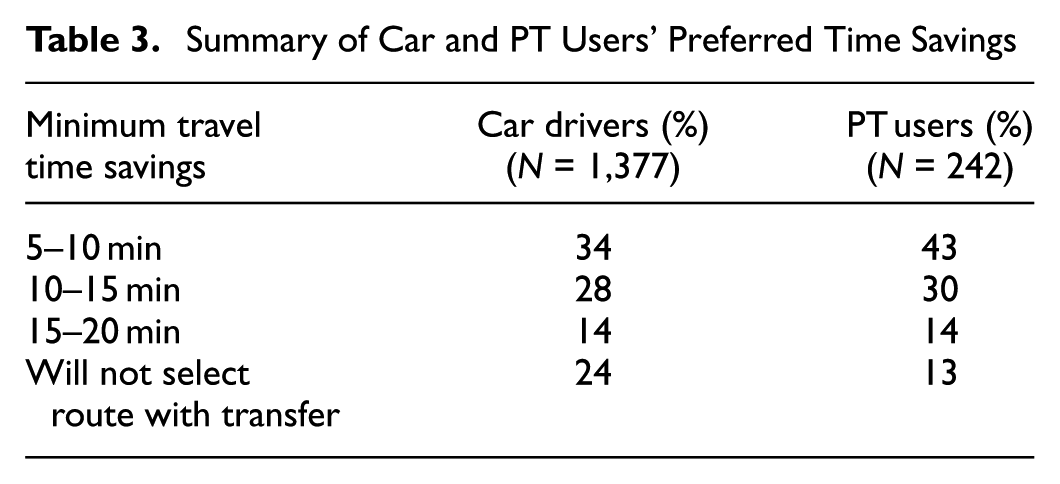
The objective of the hypothetical scenario questions was to determine PT users’ and car drivers’ willingness to use the routes with a transfer given varying levels of provisions for the connection. Only the survey data of PT users who currently do not make a transfer was considered. Of the 345 PT users, 30% made a transfer in their current route and were excluded from the study’s analysis. All car drivers (1,377 participants) were included in the analysis. A statistical package, SPSS version 25, was used to fit the data sets into binary logistic regression models. Separate regression models for male and female participants by their preferred transport mode was undertaken to determine the objective of this study. Participants were asked to select their preferred minimum time savings if they choose a route with a transfer. Table 3 gives their responses. Around 24% of the car drivers can be classified as noncaptive commuters. They were unwilling to use the PT route despite a reduction in travel time. Table 4 provides the baseline that was used for the binary regression models.
Summary of Car and PT Users’ Preferred Time Savings
Description of Explanatory Variables for Logit Models
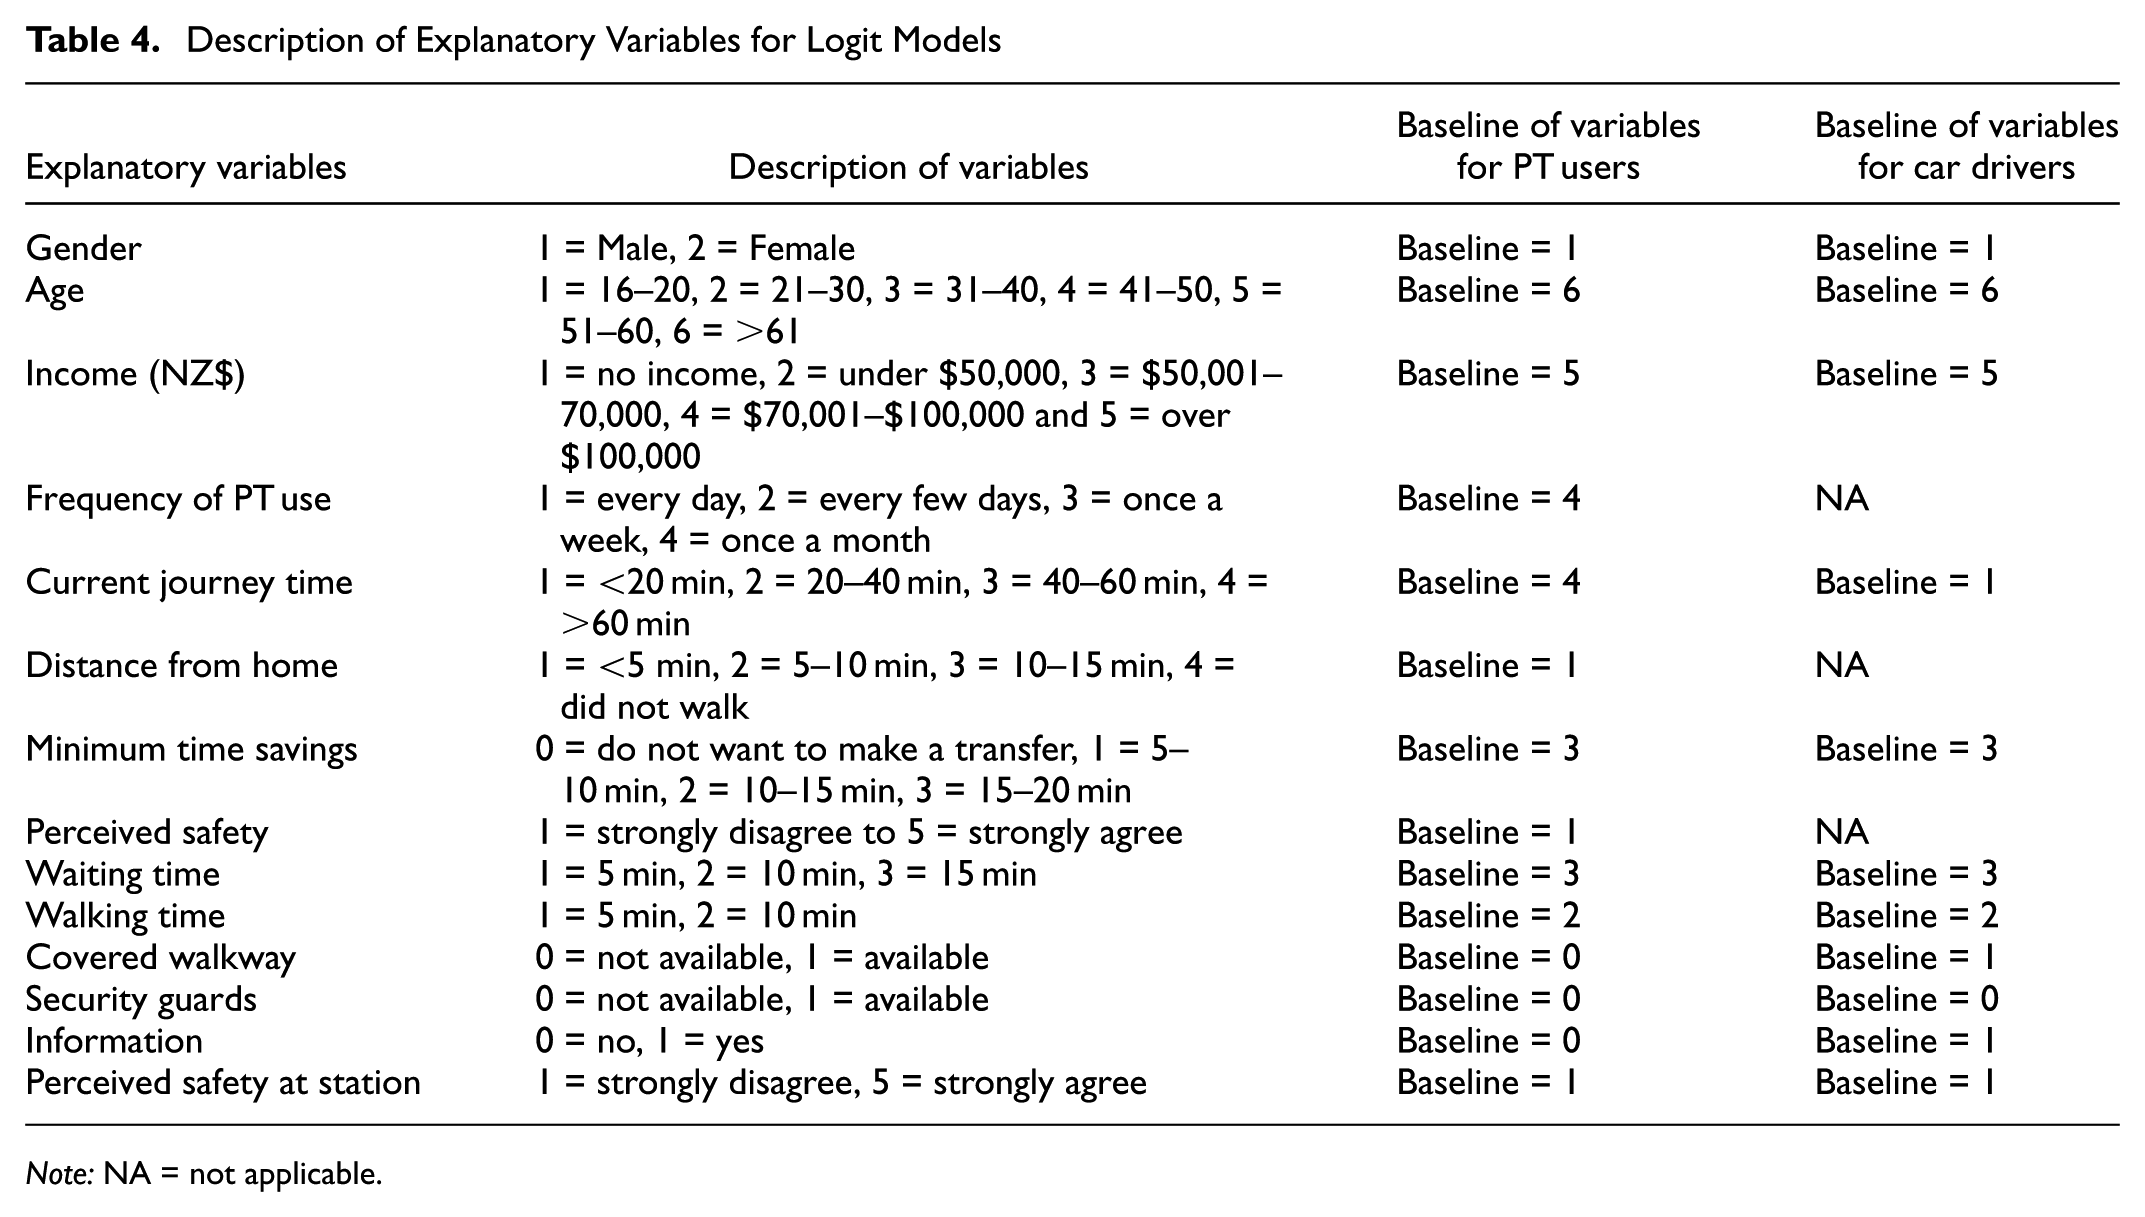
Note: NA = not applicable.
Car Drivers
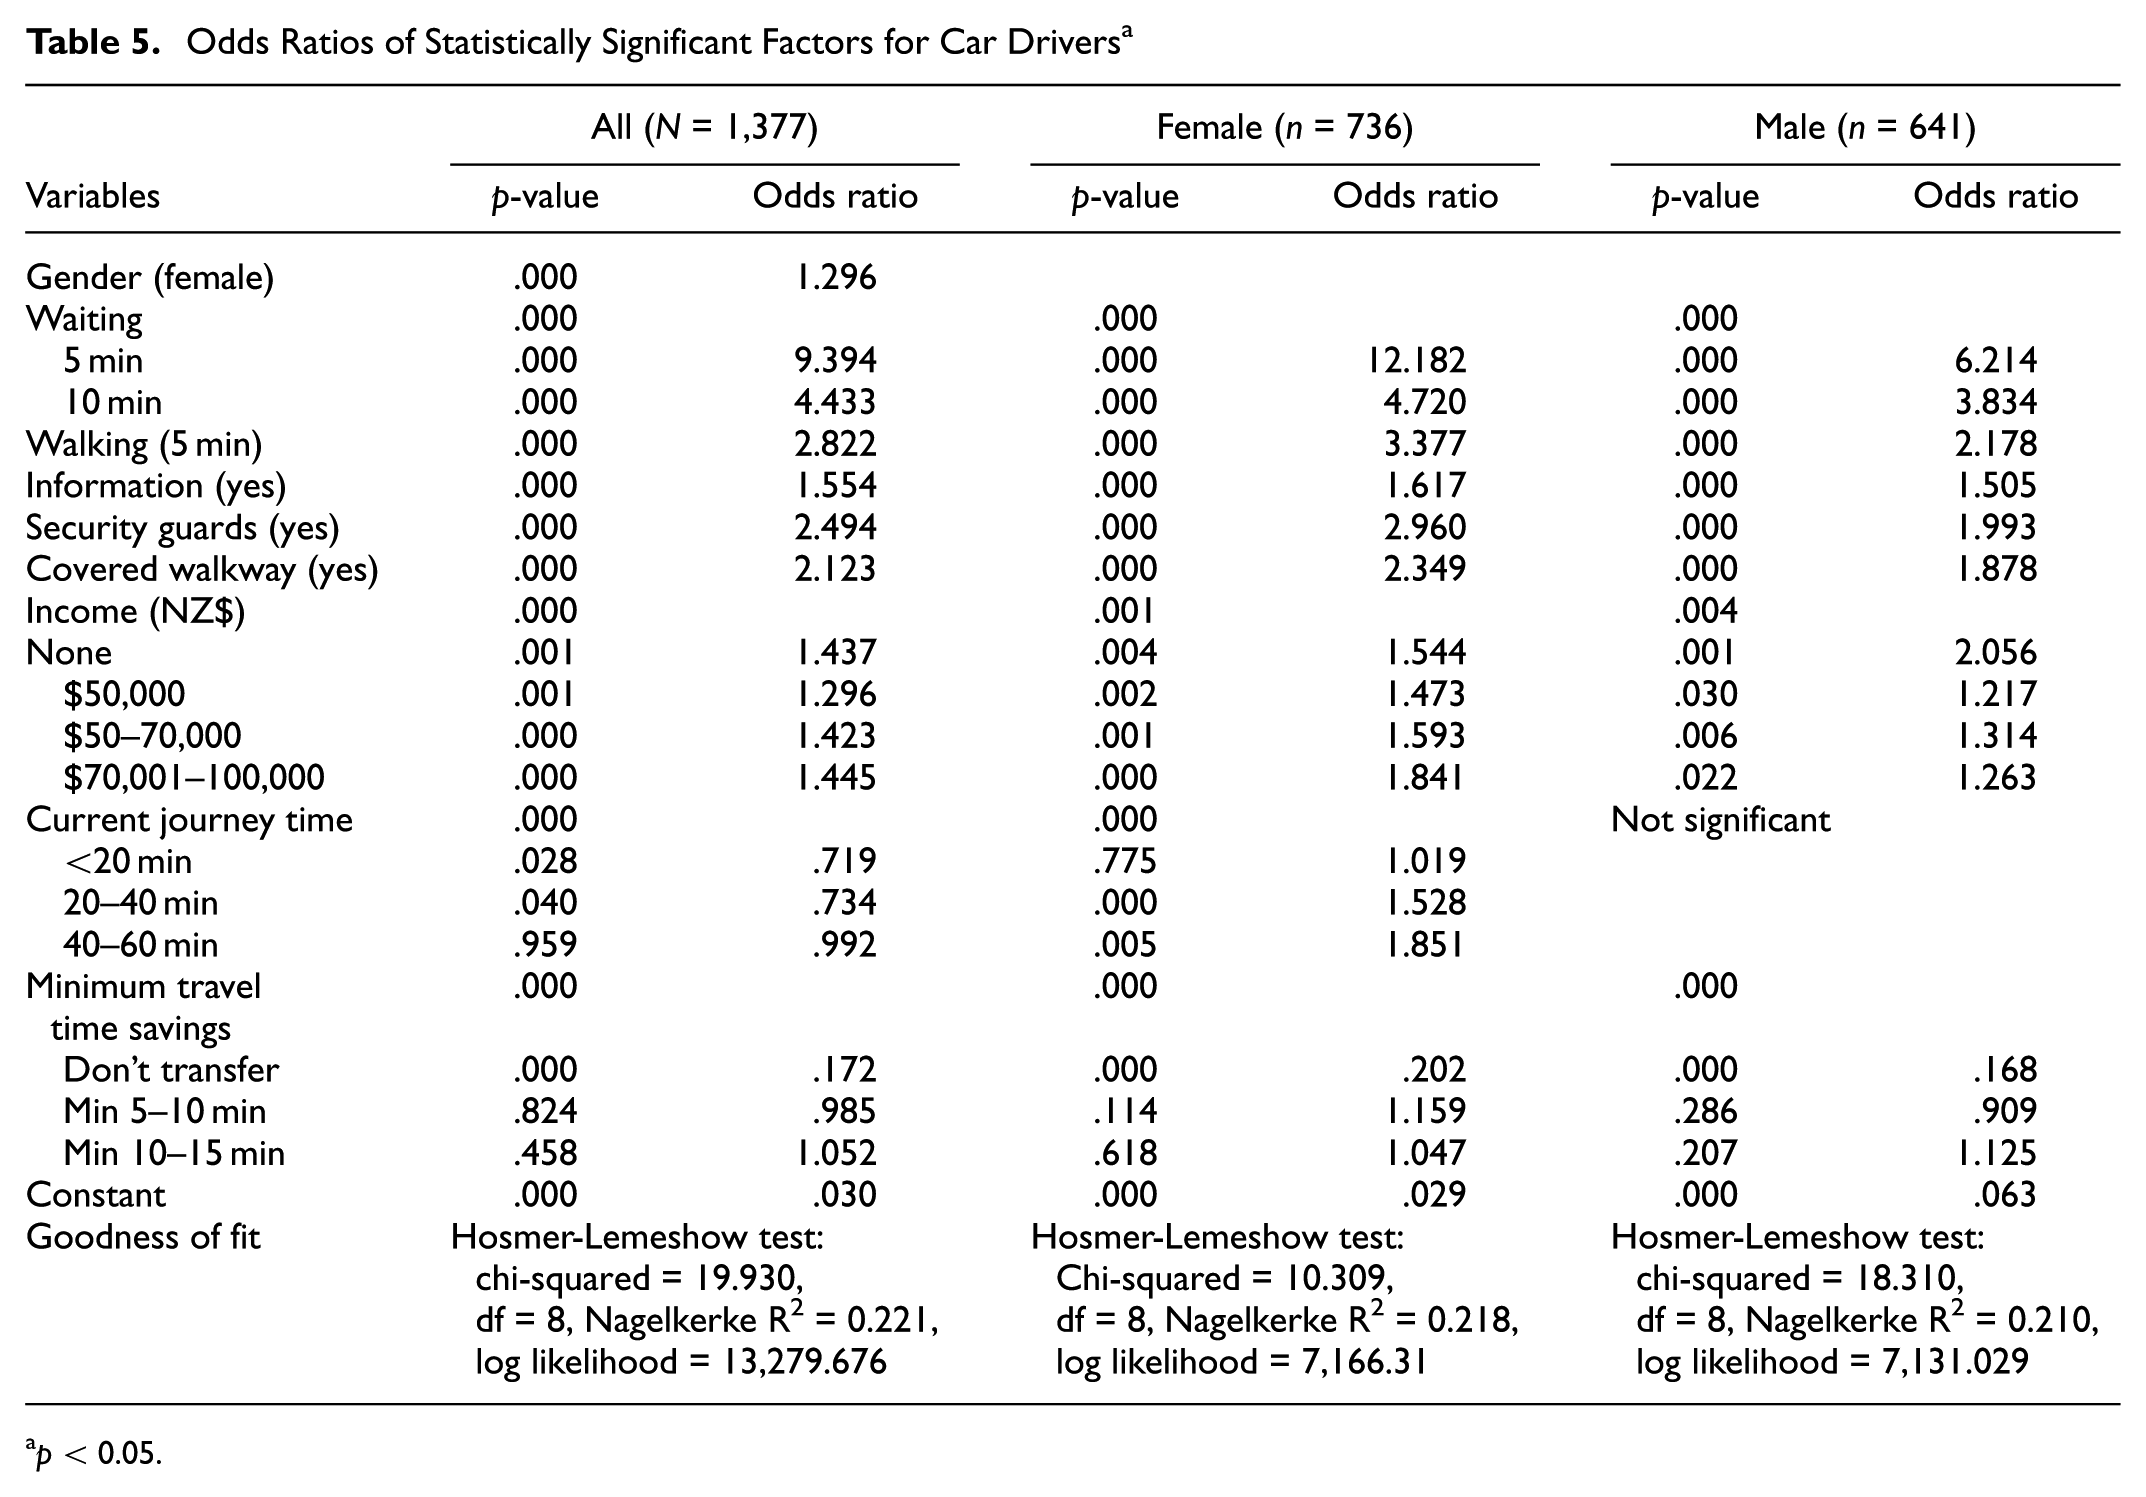
Table 5 provides the result of three binary regression models for all car drivers, female drivers, and male drivers. The Hosmer-Lemeshow test is a goodness-of-fit statistic used to determine whether the developed model reasonably approximates the data ( 28 ). The nonsignificant values of the Hosmer-Lemeshow test indicate that the models adequately fit the data sets. The regression model for all drivers shows that gender is significant: females are 1.30 times more likely to choose a route with transfer than males. Waiting time has the greatest influence on a person’s willingness to make a transfer, with women 12.18 times more likely to make a transfer for a 5-min waiting time compared with a 15-min waiting time. Comparatively, men are only 6.21 times more likely to make a transfer for a 5-min waiting time compared with a 15-min waiting time. The difference between the odds ratio for a 5-min walking time for female and male drivers is small. Women were 3.38 times more likely to transfer for a walking time of 5 min compared with 10 min, whereas men were 2.18 times more likely. These findings provide evidence for PT operators to develop integrated systems that include timed transfers. The findings also show the significance of short transfer waiting times on women’s decisions to use PT and make transfers.
Odds Ratios of Statistically Significant Factors for Car Drivers a
p < 0.05.
With the presence of security guards, women (odds ratio = 2.96) were more likely than men (odds ratio = 1.99) to make a transfer. Women were also more likely to make a transfer with covered walkways (odds ratio = 2.35) compared with men (1.88). Gender did not have an effect on the influence information has on people’s decisions to make transfers. With high-quality information, car drivers were 1.55 times more likely to make a transfer.
Income was a significant factor for car drivers, with people earning less than NZ$100,000 more likely to choose a route with a transfer (odds ratio ≈ 1.4). Interestingly, “current journey times” was not a statistically significant factor for men. Compared with a journey time greater than 1 H, women with current journey times between 40 and 60 min were 1.85 times more likely to make a transfer, whereas those with journey times between 20 and 40 min were 1.53 times more likely. The levels of minimum travel time savings were not statistically significant when compared with each other, but overall the factor is significant. This result supports previous findings that people are willing to take a PT route with a transfer if it saves them time ( 33 ).
Public Transport Users
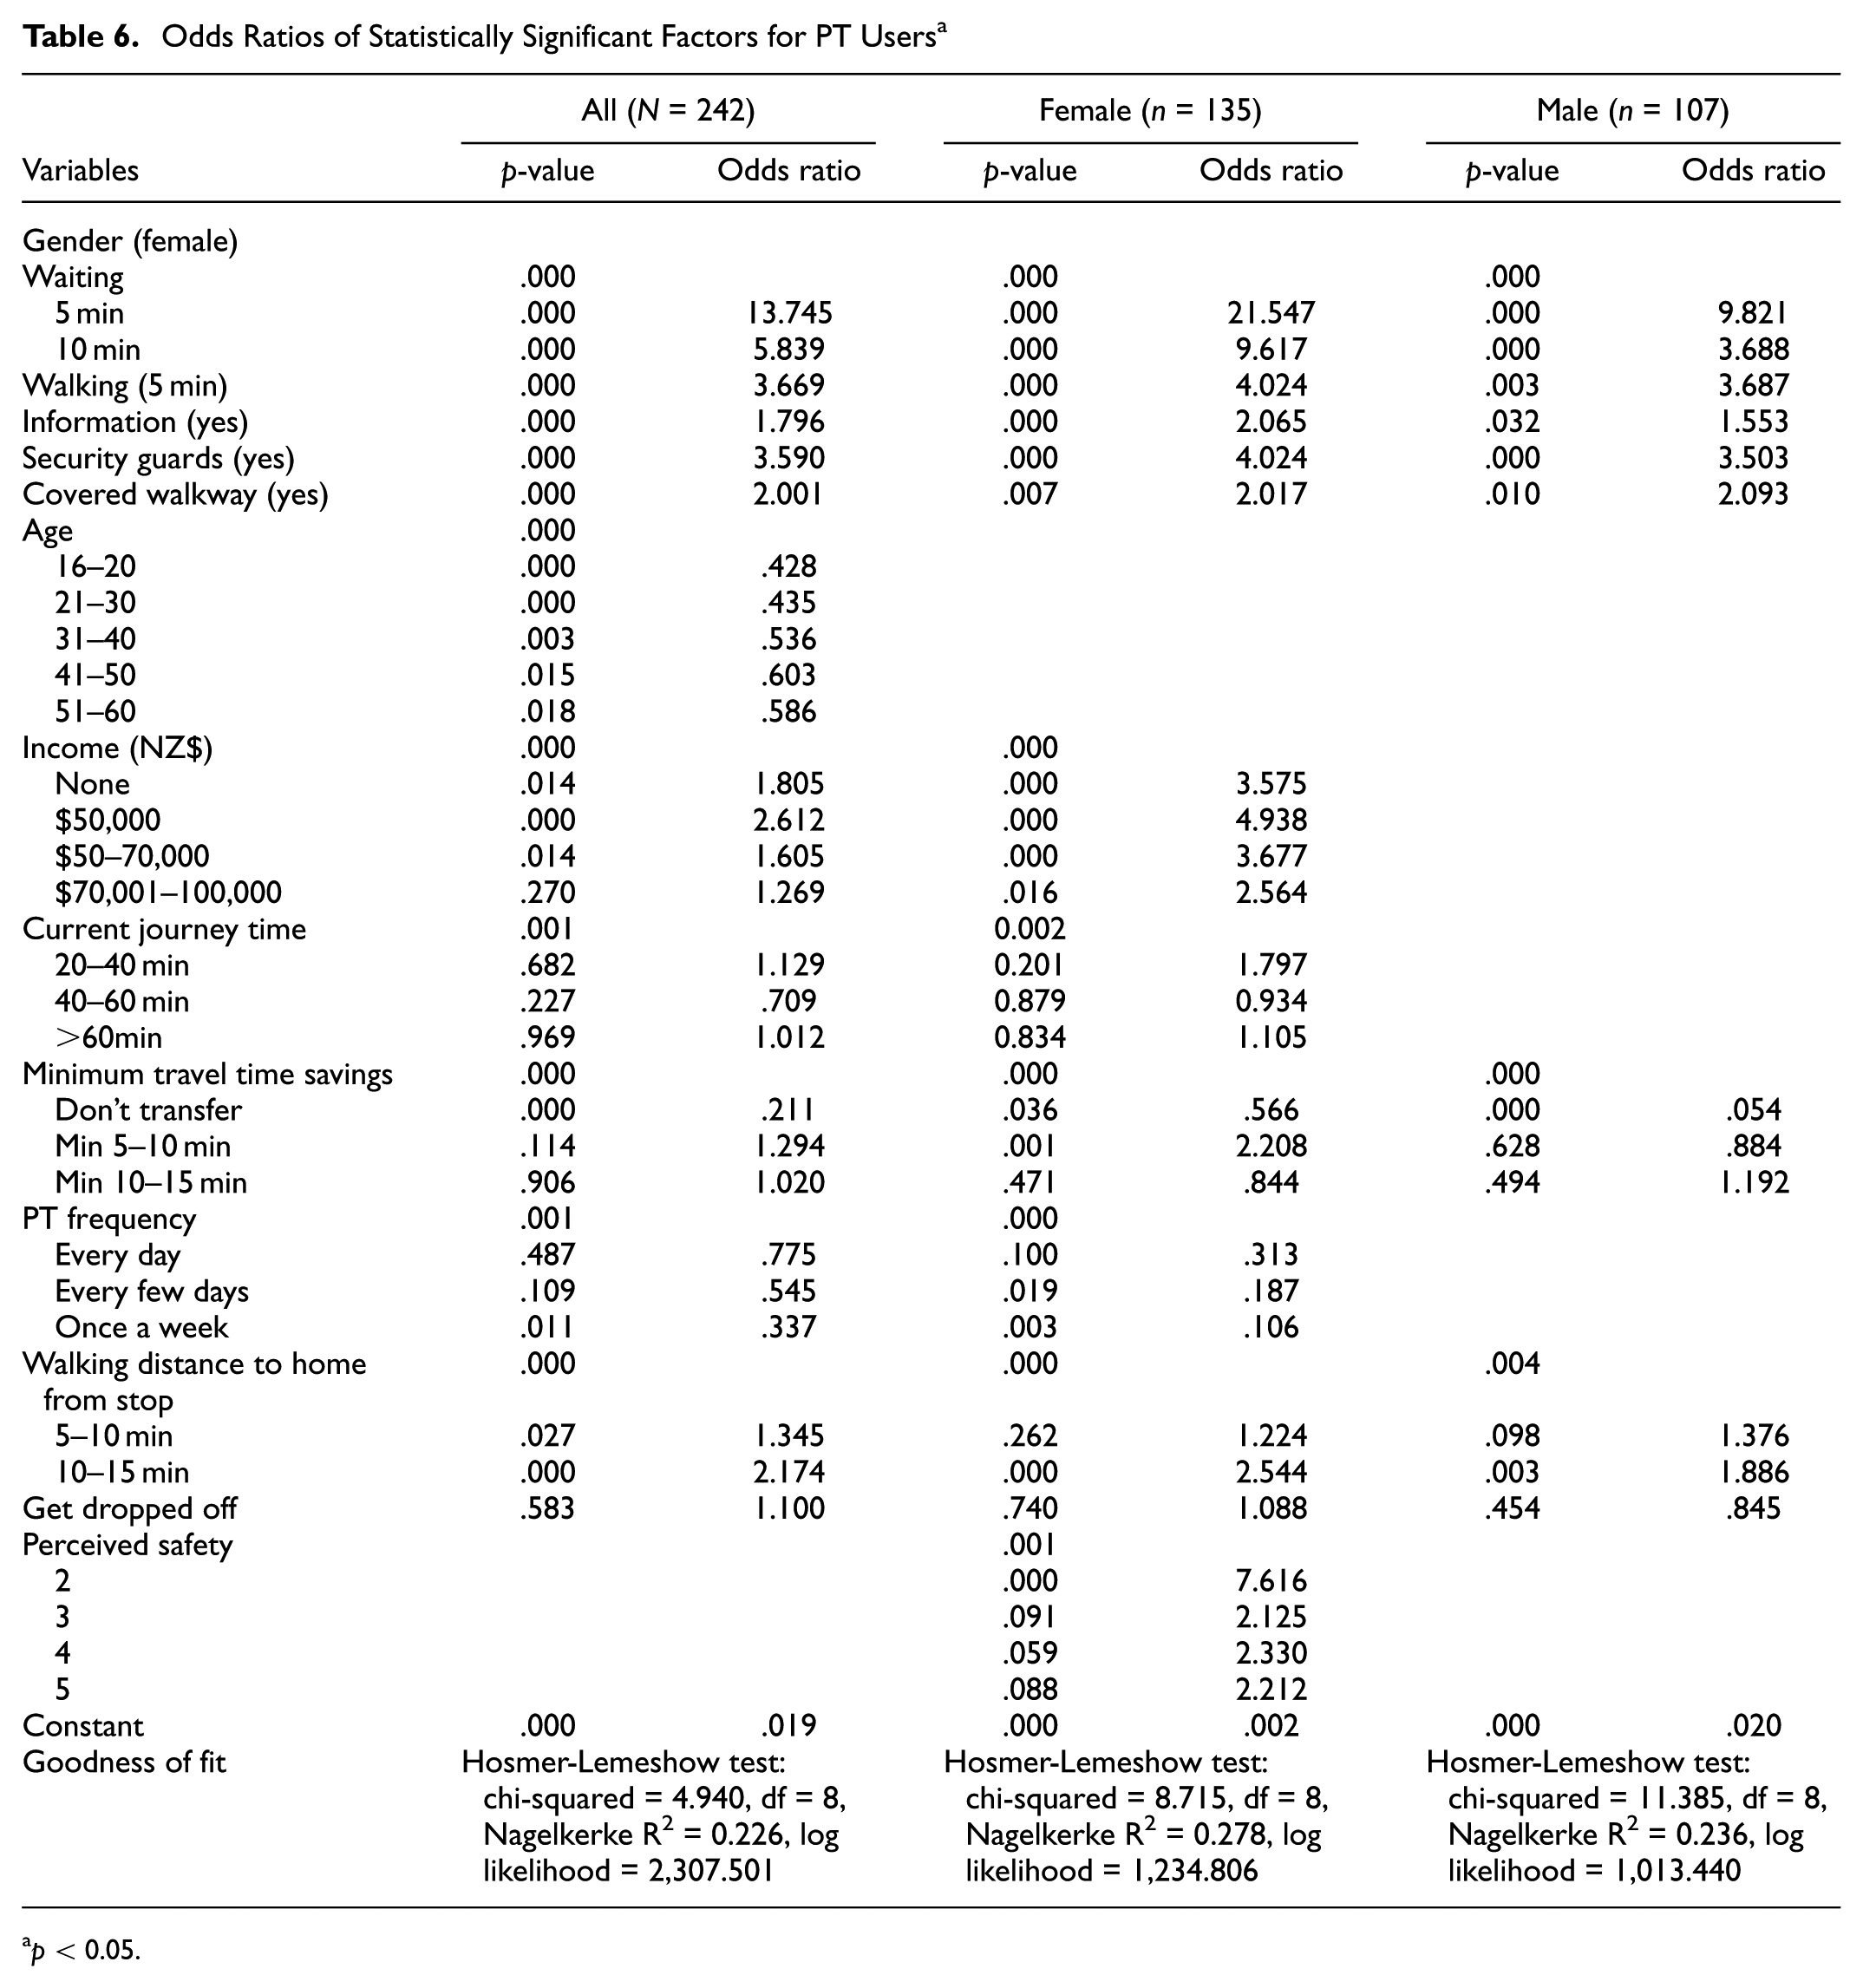
Table 6 provides the result of three binary regression model for all PT users, female users, and male users. The nonsignificant values of the Hosmer-Lemeshow test indicate that the models adequately fit the data sets. The regression model for all PT users shows that gender does not have a statistically significant effect on riders’ decisions to make transfers. Similar to car drivers, transfer waiting time is the most influential factor in PT users’ decisions. The odds ratio for a 5-min waiting time is much greater compared with car drivers. Female PT users were 21.55 times more likely to make a transfer for a 5-min waiting time compared with a 15-min waiting time; whereas male PT users were 9.82 times more likely to make a transfer given a 5-min waiting time. The difference in the odds ratios for a 5-min walking time is smaller between male (3.69) and female (4.02) users. With the presence of security guards, female users (odds ratio = 4.02) were slightly more likely to transfer compared with men (odds ratio = 3.50). Information also had a slightly greater effect on women’s decisions (odds ratio = 2.06) compared with men’s (odds ratio = 1.55). Gender did not have an effect on the factor “covered walkways.” PT users were two times more likely to make a transfer with covered walkways. These findings show that waiting time has the greatest influence on riders’ decisions to make transfers, followed by walking time and the presence of security guards.
Odds Ratios of Statistically Significant Factors for PT Users a
p < 0.05.
Reduction in travel time savings and walking distance from home were significant factors for all PT users. Those who walked 5 to 10 min to their stop or station compared with those who walked for less than 5 min were 1.34 more likely to make a transfer. Those who walked 10–15 min were two times more likely to make a transfer. This is an interesting finding. It can be reasoned that those who walk a longer distance to their stop or station are captive users and are willing to make a transfer if it means that their overall travel time is reduced. Current journey time was a significant factor in the regression model for all PT users and female riders. This finding reveals that women are more sensitive to their travel time than men and are willing to use a PT route with a transfer, given time savings.
Age was only significant in the regression model for all PT users. Income was a significant factor for female PT users and not for male users. Also, the odds ratios from the female regression model are greater when compared with those from the model for all PT users. A reason for this finding is that the women participants, on average, earned less than the male participants. Perceived safety at stations was only significant in the female regression model. Compared with those who strongly disagreed with feeling safe at their current station, those who agreed and strongly agreed to feeling safe were around 2.33 and 2.21 times, respectively, more likely to make a transfer.
Discussion and Conclusion
The purpose of this study was to investigate the effect of gender on factors that are significant in the decision to make transfers in an integrated system. Results from the regression models showed that gender has an influence on car drivers’ willingness to use a PT route with a transfer, given travel time savings. Women drivers were 30% more likely to choose PT than men . Of all the statistically significant factors, transfer waiting time was the most influential factor for car drivers and current PT users. It had a greater effect on women’s decisions to make transfers. Therefore, a transfer waiting time of 10 min or less is strongly preferred by women as they will be exposed to the physical environment of a station for a short duration. A possible reason for this result is supported by the findings for personal safety. Perceived safety of the current station was the only factor that was significant for female PT users. With the presence of security guards, female car drivers were three times more likely to ride a route with a transfer, compared with male car drivers who were two times more likely.
The duration of walking time also had a significant influence on people’s decisions, with gender playing a less significant role on how they perceive it. Women, both car drivers and PT users, were slightly more likely to make a transfer given good quality information and covered walkways.
In most analyses, it is common to include gender as a factor in the decision-making process and much less common to investigate needs from a gender perspective. One of the main purposes of PT is to meet the transport needs of the lower income and working group. With worldwide discussions on the gender pay gap, it is known that women on average earn at least 20% less than men and thus are more reliant on PT as an affordable transport mode ( 34 ). The integrated system framework can change a PT network that provides poor service to limited destinations into one that allows many destinations to be easily accessed. This provides an opportunity to provide women and those with a lower income with a transport system that is reliable and affordable. The findings from this study have shown that gender plays an important role in people’s decisions to make transfers. It is expected that these results will provide practitioners with some guidance when designing transfers for an integrated system. The limitations women face during their travels in cities with subpar PT networks can be alleviated by practitioners implementing an integrated system that is designed to meet their needs more closely. Findings from this study have shown the importance of personal safety in women’s decisions to ride PT routes. Further research is encouraged to understand how different elements of the physical environment of a station can influence women’s perceived safety and therefore their ridership of an integrated system.
Footnotes
Acknowledgements
I would like to thank Romain Cousanon, an urban planning student from École des ingénieurs de la ville in Paris, France, for helping with the data analysis.
Author Contributions
The author confirms sole responsibility for the following: study conception and design, data collection, analysis and interpretation of results, and manuscript preparation.
The Standing Committee on Women’s Issues in Transportation (ABE70) peer-reviewed this paper (19-01331).