
Abstract
This work examines the next-generation interchange control system (NIC) that aims to control connected and autonomous vehicles (CAV) at interchanges with the consideration of different mixed traffic cases. The first objective of the paper is to test several parameters including traffic demand, heavy vehicle percentage, communication range, and advance stop line (ASL) to investigate their impact on throughput and delay. The second objective is to incorporate mixed traffic in the NIC, utilizing a lane-based strategy that is responsive to market penetration rates. The NIC coordinates vehicles to traverse the interchange terminal by using a reservation-based control strategy with a first-come-first-served (FCFS) reservation protocol. The algorithm of this system was modeled in the simulation software package VISSIM using a slightly modified real-world scenario of interchange. The evaluation of the system starts with testing some key variables when market penetration rate is 100%. The results demonstrate that the increase in traffic demand and heavy vehicle percentage affects the performance of the NIC by increasing the delay. Although the effects of communication range and advance stop location do not have clear patterns, the communication range of 600 ft and ASL of 100 ft indicate a relatively lower delay. Throughput and delay results reveal that the NIC outperforms traffic signals when the market penetration rate is 75%, whereas a 25% market penetration rate provides similar performance to traffic signals.
Diamond interchanges at freeway-arterial ramp terminals are typically controlled by signalized intersections. In practice, the signalized intersection does not provide sufficient capacity, which limits the traffic mobility at the interchange when compared with other types of interchange designs, such as a roundabout interchange ( 1 , 2 ). In fact, the existing interchange designs are restrained in capacity because of the time–space within the ramp terminal intersections and as a result cannot be fully utilized. For example, at signalized interchanges, the signal operations require vehicles to use the intersection ramp terminal movement by movement; this operation cannot maximize the efficiency of the interchange ramp terminals. At roundabouts, the island in the middle of the interchange cannot be used by vehicles, which is also a waste of the ramp terminal intersection’s space.
With the aid of connected and autonomous vehicles (CAVs), the capacity issue of interchanges can be potentially improved. One of the most promising mitigation solutions is through the operation of autonomous interchanges by eliminating traffic signals, so as to increase the use rate of interchanges’ time and space, and in turn enhance the interchange capacity. With the rapid advancement of CAV testing and usage, the implementation of autonomous interchanges in the real world has come closer than before. In this sense, this paper introduces next-generation interchange control (NIC) that operates CAVs at a diamond interchange with the least geometric modifications. The first objective of the paper is to test several parameters including traffic demand, heavy vehicle percentage, communication range, and advance stop line (ASL) to investigate their impact on the system performance including delay and throughput. It aims to address the capacity issue pertaining to the existing types of interchange operations, such as the signalized interchange.
Ideally, 100% CAV would achieve the optimal capacity performance. Nevertheless, having a market penetration rate of 100% cannot be achieved in the near future. Thus, it is imperative to accommodate human-operated vehicles in the proposed NIC. Yet, there are limited strategies to accommodate human-operated vehicles in autonomous intersections. Dresner and Stone introduced the traffic-light policy, which includes both all-lanes strategy and single-lane strategy to accommodate human-operated vehicles ( 3 ). In the all-lanes strategy, the green light is given for the entire approach and the green light cycles through all approaches. On the other hand, the single-lane strategy has the same concept of circulating the green light but by lane rather than approach. One of the safest methods is a lane-based strategy that divides the approach into dedicated lanes for CAV and dedicated lanes for human-operated vehicles. It allows human-operated vehicles to traverse interchange areas with multiple traffic signal phases and then allows CAV to traverse with one phase. The separation of CAV and human-operated vehicles prevents unsafe interactions between CAV and human-operated vehicles inside the intersection area.
All the existing work for mixed traffic operations has been mostly focused on intersections. There is a lack of research on accommodating human-operated vehicles in autonomous interchanges. Therefore, the second objective of this research is to propose incorporating a mixed traffic solution in the NIC and to introduce lane configurations based on market penetration rate. The analysis considers different variables and the evaluation of NIC performance includes throughput, delay, and level of service (LOS).
Literature Review
Several innovative designs have been introduced and implemented to improve the performance of diamond interchanges. Diverging diamond interchange (DDI) has received increasing attention in recent years because of its improved performance and cost-effectiveness over the traditional diamond interchange design. The main idea of DDI is to accommodate left-turning movements onto the arterial without using a left-turn bay ( 4 ). DDI has great potential to improve performance over the conventional diamond interchange by increasing capacity and reducing delay because of its efficient two-phase signal operation ( 5 – 9 ). However, the DDI design has some limitations as most of the relevant papers have assumed that freeway frontage roads do not exist; the DDI needs an additional third phase to accommodate the through movements on the frontage roads ( 10 ).
Research on autonomous intersections emerged early last decade and Dresner and Stone provided one of the first works in this area ( 11 ). They developed a reservation-based intersection model for traffic streams for fully autonomous vehicles. In their work, they assume the existence of only through movements without turning movements. The work also assumes fixed vehicle speeds inside an intersection. In another work, Dresner and Stone proposed an algorithm that considers a first-come-first-serve strategy ( 3 ). The centralized strategy works with the intersection controller, accepting or rejecting vehicle requests to proceed through the intersection with a priority for the vehicles that arrive first to the intersection. Therefore, the decision on the vehicles’ passing sequence is made regardless of the number of vehicles arriving to each approach, which may cause less operational efficiency at the intersection. In a related work, Shahidi et al. ( 12 ) extended the work of Dresner and Stone ( 3 ) by examining different navigation policies in which autonomous vehicles are dynamically able to alter their planned paths. The proposed algorithm dynamically reserves the vehicles along lanes by receiving updates of traffic conditions every 60 s.
Vasirani and Ossowski ( 13 ) have improved the reservation-based model of Dresner and Stone ( 11 ) to consider unbalanced traffic volumes. They have modeled the relationship of supply and demand at intersections that controls movements based on the volume-over-capacity ratio of the approach. Moreover, the proposed model incorporates a pricing policy into the reservation-based intersection control system to minimize the delay. However, the algorithm that determines the sequence of vehicles proceeding through the intersection has been implemented for instant reservation requests, which makes traversing not optimal over time.
Li et al. introduced a reservation-based intersection control system named autonomous control of urban traffic (ACUTA) and implemented it in the simulation software package (VISSIM) ( 14 , 15 ). The operational, safety, and sustainability performance characteristics of ACUTA were evaluated in comparison with the results of optimized signalized control. The operation of the proposed system determined a reduced delay and higher intersection capacity under different traffic demand conditions. Safety performance was evaluated by use of the surrogate safety measure model, and few conflicts between vehicles within the intersection were detected. The sustainability performance measures reveal that energy consumption can be lowered by about 4% when traffic volume is low to moderate and by about 12% when traffic volume is high.
Most of the autonomous intersection studies have considered the existence of autonomous vehicles only (100% market penetration rate). Few studies have dealt with the case of mixed traffic in autonomous intersections. Dresner and Stone ( 3 ) introduced the traffic-light policy, which includes the all-lanes strategy and the single-lane strategy. In the all-lanes strategy, the green light is given for the entire approach and the green light cycles through all approaches. The single-lane strategy uses the same concept of circulating green light, but by lane rather than approach. Dresner and Stone ( 3 ) found that the all-lanes strategy is suitable for a low market penetration rate, whereas the single-lane strategy helps at a high market penetration rate.
Li et al. proposed a mixed traffic dynamics model, based on the assured clear distance ahead criterion (ACDA-MTD) ( 16 ). The model assumes a 100% compliance rate with an operational strategy that is consistent with the assured clear distance ahead criterion. Each vehicle in the proposed system adjusts speed and distance from the vehicle ahead to ensure a safe traveling distance. However, the compliance of drivers with the suggested speed and distance is questionable.
The research gap this work is trying to fill is the lack of studies testing the performance of autonomous interchanges with dedicated lanes for CAV and dedicated lanes for human-operated vehicles. This paper evaluates a lane-based strategy for accommodating mixed traffic in autonomous interchange NIC.
The Operations of the NIC
To employ the NIC in mixed traffic and evaluate its performance in the simulation environment, multiple scenarios of lane configurations are designed to efficiently accommodate CAV and human-operated vehicles based on the market penetration rate. Then, an algorithm has to be created to run simulations for the proposed designs with the different lane configurations.
Reservation-Based Control of Autonomous Interchange
The reservation-based system is a centralized control strategy that aims to manage autonomous vehicles at interchanges by reserving spots at which vehicles may have conflicts. The concept is based on the assumption that all vehicles in the system have the ability to communicate with a single control unit, called the interchange manager (IM). Theoretically, the IM controls the interchange by receiving reservation requests from vehicles, determining the passing sequence of all of the approaching vehicles, and sending accept or reject notifications to vehicles ( 17 – 20 ).
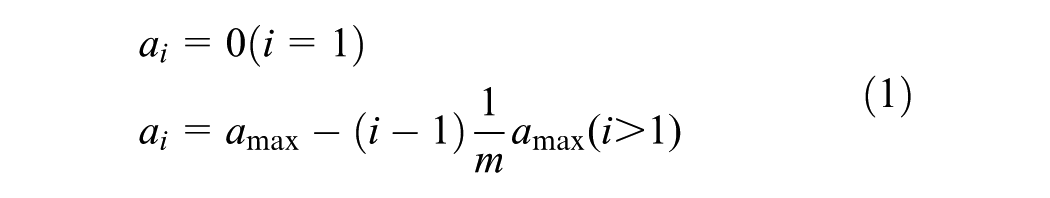
When a CAV enters the communication range, it connects with the IM and immediately sends a reservation request along with basic information about the vehicle such as location, speed, acceleration rate, and routing information. The process of reservation request starts when the IM computes the time–space required for the vehicle to traverse the interchange based on the given information by the requesting vehicles. Acceleration from the current location of the requesting vehicle to the boundary of the interchange terminal is the key in computing the required time–space. Using different acceleration rates can significantly change the required time–space for the vehicle to traverse the interchange terminal. The alternative acceleration rates considered by the IM range from 0 to the maximum acceleration rate of the particular vehicle (threshold). Alternative accelerations in the NIC are calculated by the following equation as found in the work of Li et al. ( 14 ):
where
Although vehicles may differ in their maximum acceleration rates, vehicles in the NIC must maintain a constant speed while traversing the interchange terminal. Technically, when the vehicle’s center point enters the interchange terminal, the speed of the vehicle has to be constant until the vehicle completely clears the interchange terminal. At every simulation step in this system, the IM checks whether the intended tiles in the interchange terminal have already been reserved by other vehicles. When a potential conflict is detected, the IM attempts an alternative acceleration rate in computing the required time–space, then checks again whether the new acceleration rate will result in the time–space being traversed without conflict or not. The IM keeps repeating the same process and this iterative process in the NIC is named “internal simulation.” In this system, the maximum number of alternative acceleration rates can be controlled. When all alternative acceleration rates have been attempted by the internal simulation process and the results demonstrate conflicts in the reservation system, the reservation request will be rejected. The system is based on a first-come-first-served (FCFS) reservation protocol and priority in the reservation process is given to vehicles that arrive at the interchange terminal first. The IM in the NIC is designed to automatically reject the requests from a following vehicle that has no reservation to avoid rear-end collisions which may result if a leading vehicle is still rejected and a following vehicle is accepted.
When the IM decides to reject a vehicle, it sends a rejection message with a designated deceleration rate to make sure that a vehicle can stop before the interchange terminal on the advance stop location (or line), which is a parameter introduced by Li et al. ( 14 ). The idea of the ASL is to address the issue of reserving tiles for vehicles with slow speed. When vehicles stop at the traditional stop line, they do not have enough time to accelerate and reach a relatively higher speed. This may result in a significant number of vehicles having a lower constant speed while traversing the interchange, and therefore lowering the capacity of the interchange terminal. The employment of the ASL helps vehicles with rejected reservations stop at a location upstream from the entrance of the interchange terminal. Thus, vehicles will have enough space to achieve a higher speed when they approach the entrance point of the interchange terminal. When a vehicle receives a rejection for its reservation request, the vehicle will immediately start to decelerate as soon as the rejection message is received along with the designated deceleration rate. The designated deceleration as described by Li et al. ( 14 ) is calculated as

where
When a vehicle’s request is approved, the IM sends an approval message with a designated acceleration rate that certainly will not cause conflicts with already approved reservations. The approval message includes the time of acceleration and time of clearing the interchange terminal. The vehicle must follow the approval message information until it clears the interchange terminal.
Modeling the NIC in VISSIM
To evaluate the proposed system in this research, the NIC is implemented in the simulation environment using the well-known simulation software package (VISSIM). The implementation of the NIC requires a well-identified algorithm that can be modeled in VISSIM. This section describes the algorithm that determines occupied tiles and allows vehicles to proceed through the interchange terminal.
The concept of the reservation-based interchange is associated with dividing the interchange terminal into an n-by-m mesh that contains small tiles. The number of tiles depends on adjustable numbers of n and m, named “granularity” as described by Dresner and Stone ( 17 ). A high number of tiles can provide higher accuracy of reservations and lower unreserved space. However, the high granularity requires a longer computational process and available processors cannot handle such computational complexity.
The NIC was modeled based on a modified version of a real-world interchange with a three-lane arterial and two-lane off-ramps and on-ramps. In most of the previously introduced systems, vehicles could go through or turn from any lane. However, in this research, the NIC considers the use of different geometrical designs with different combinations of dedicated and shared lanes. As most interchanges include a right-turn bypass lane, the NIC neglected right-turns in the interchange area. Figure 1a illustrates the reservation-based approach for operating the interchange in the NIC algorithm and Figure 1b represents one of the possible geometric designs with an example of possible paths of traversing for vehicles approaching the interchange from the westbound approach. The NIC algorithm is based on a two-dimensional coordinate system projected onto the interchange terminal to represent the boundaries and the background of the n-by-m mesh. The main idea is to use this coordinate system as the major coordinate system to compute the location of vehicles. The origin O is located at the southwest corner (M1) of the interchange terminal, and M2 is the southeast corner, M3 the northeast corner, and M4 the northwest corner as Figure 1b shows.
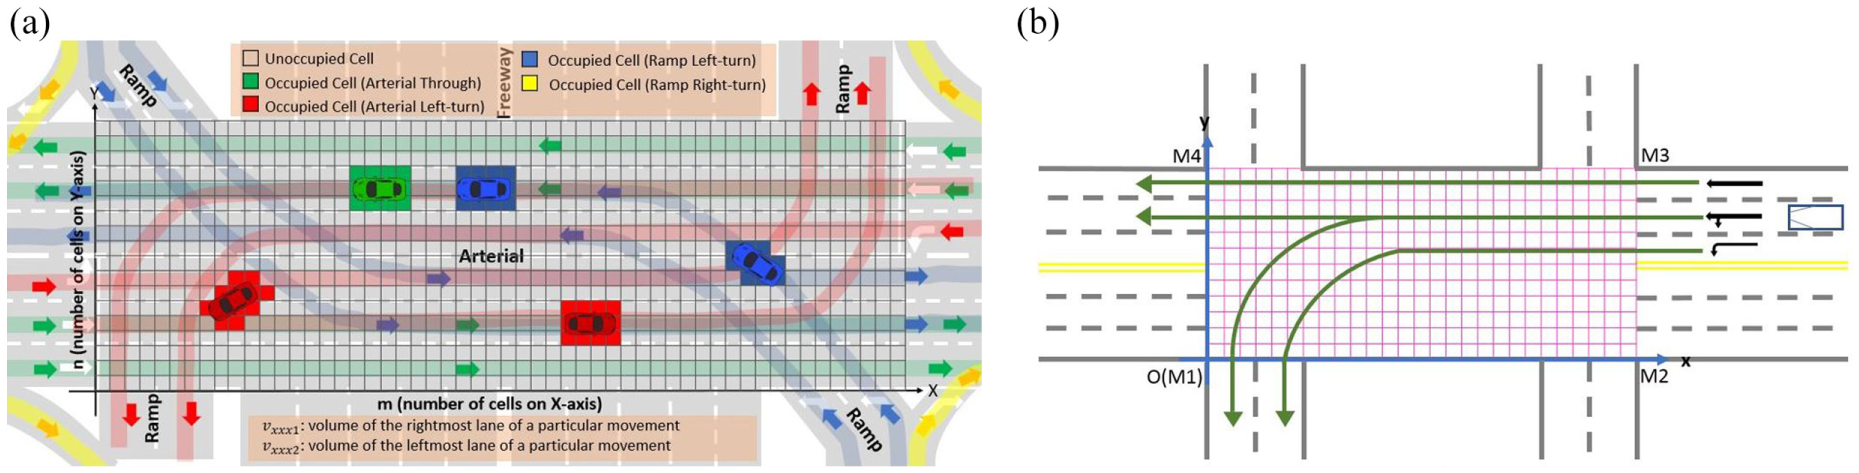
Interchange terminal in NIC: (a) reservation-based approach; (b) layout and traversing paths.
Strategies to Accommodate Human-Operated Vehicles
This research considers using different lane configurations to efficiently accommodate CAV and human-operated vehicles based on the market penetration rate. For the purpose of simplifying the evaluation of the simulation experiment results, four market penetration rates are considered including 25%, 50%, 75%, and 100%. Therefore, the number of dedicated CAV lanes is proportional to the market penetration rate. For the considered market penetration rates, having a four-lane road might be ideal so that each 25% increment of market penetration rate can have a dedicated lane. Nevertheless, having a balanced design in the real-world case is not guaranteed as a market penetration rate of 25% increment is assumed for evaluation purposes only. Although the market penetration rate is not expected to fluctuate in higher percentages, dedicated lanes can be dynamically responsive to changes in the market penetration rate by utilizing the changeable lanes concept with the use of digital signs on top of each lane.
In the case of 100% market penetration rate or in the case for which all vehicles are human-operated vehicles, all lanes can be dedicated to CAV or dedicated to human-operated vehicles, respectively, as shown in Figure 2, a and b . When market penetration rate is 25%, one lane is dedicated to CAV, whereas the other two lanes are dedicated to human-operated vehicles as illustrated in Figure 2c. When market penetration rate is 75%, two lanes are dedicated to CAV, with only one lane for human-operated vehicles as shown in Figure 2d. The critical situation is when the market penetration rate is 50% as either CAV or human-operated vehicles have to take the advantage of having an extra lane. Therefore, two different designs are considered in the case of 50% market penetration rate. The first design in the case of 50% is with one CAV lane (as in the 25% design) and the second design is with two CAV lanes (as in the 75% design). The designs for market penetration rates of 25%, 50%, and 75% are described by Figure 2c and d .
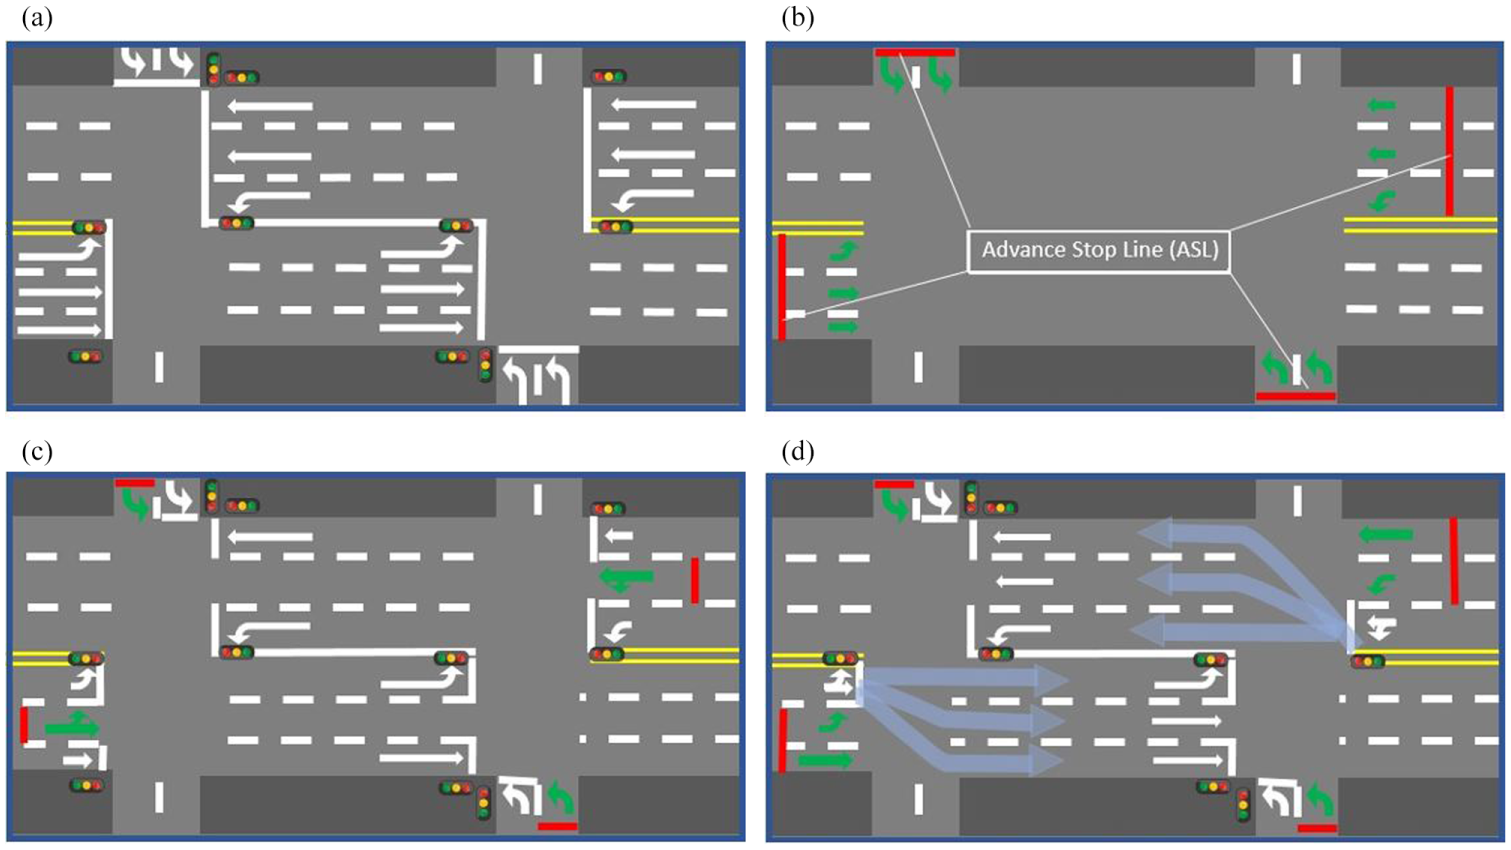
Layout and lane configuration: (a) traffic signal (MPR = 0%); (b) NIC (MPR = 100%); (c) NIC (MPR = 25% & MPR = 50% with one lane); (d) NIC (MPR = 75% & MPR = 50% with two lanes). MPR = market penetration rate.
Estimation of Interchange Capacity with Mixed Traffic
The transition to all autonomous vehicles (100% market penetration rate) seems far ahead in time. One of the widely considered solutions for mixed traffic at autonomous intersections is to divide lanes into dedicated lanes for CAV and dedicated lanes for human-operated vehicles. The lanes with human-operated vehicles have green time based on an optimized signal timing using highway capacity software (HCS) for signalized intersections. Once the cycle length is over, all CAV lanes can traverse the interchange terminal in one phase and one cycle length, while all the human-operated lanes are having all-red time.
Most studies have considered 100% market penetration rate and found a dramatic improvement in the capacity of the intersection and the overall delay per vehicle. The capacity of the interchange can be found as the sum of the capacity of lane groups and the capacity of the NIC. Therefore, the capacity of mixed traffic with dedicated lanes and separated cycle lengths as proposed in this research can be formulated as

where
Experiment Design
The algorithm of the NIC in this research considers several parameters related to traffic characteristics, geometric specifications, and IM features. First of all, speed at the interchange follows the speed limit at the site (30 mph) and IM considers this speed limit in all processes including internal simulation, which means vehicles are restricted to 30 mph. For turn-left movement, vehicles are additionally restricted to the safe speed for horizontal curves based on the radius. The experiment considers two heavy vehicle percentages of 3% and 15% in testing NIC parameters. However, when mixed traffic scenarios are compared, the experiment considers a heavy vehicle percentage of 10% and 90% of passenger vehicles. Moreover, vehicles on off-ramps are allowed to turn left only as at most diamond interchanges, and right-turn movements use right-turn bypasses. Human drivers require a response time known as perception–reaction time. However, the response time (
Before testing NIC in a mixed traffic environment, a couple of parameters related to IM have to be tested to choose the most suitable ones. A preliminary study is conducted to find the range of values within which each parameter shows an impact. The communication range of IM within which CAV can start to send requests and receive messages is tested with three different values including 600 ft, 800 ft, and 1,000 ft. Moreover, a key parameter in NIC is the ASL and this paper will consider testing three different values including 45 ft, 60 ft, and 100 ft. The ASL allows vehicles with rejected reservations to gain enough speed to avoid a slow speed reservation, which is an operational efficiency treatment unique to NIC.
For evaluation purposes, the traffic signal scenario is also simulated to compare it with the performance of NIC with different market penetration rates. The traffic signal scenario represents the existing situation at the real-world site. The cycles and phase lengths of the traffic signals were optimized using HCS.
As traffic demand is a key element in evaluating the performance of any transportation facility, the experiment design includes testing the six proposed designs with five different levels of traffic demands making a total of 30 unique scenarios. The total simulation running time for each scenario is 75 min starting with a 15-min warm up period and 60 min of actual running. Each scenario includes 10 runs with 10 random seeds to ensure having statistically significant results. The considered traffic demands are described in relation to number of vehicles per hour per lane (vphpl). Off-ramps’ lanes are left-turn only and each lane has only 50% of the traffic demand value. Left-turn movements on the arterials represent 30% of the total volume, whereas 70% is through. Although traffic demand is represented as vphpl, the difference in movement distributions (through and left-turn) and the variation of market penetration rates create several lane distributions for each scenario.
Performance Measures
To evaluate the performance of NIC in this research, two measurements have been obtained from VISSIM: throughput and delay. Throughput is the total number of vehicles passing through the interchange terminal during an hour (vph). Delay is the additional time taken by the vehicle to travel within the interchange comparing with the ideal time of doing that with the posted speed limit (in seconds per vehicle, or s/v). In the comparison of the performance of different systems, delay is converted to LOS according to the Highway Capacity Manual (HCM 2016) to add more meaning to the results.
Analysis of NIC Parameters
The sensitivity analysis of NIC with 100% market includes traffic demand, heavy vehicles percentage, communication range, and ASL. The results are illustrated by heatmaps with counters for throughput and delay in the following subsections.
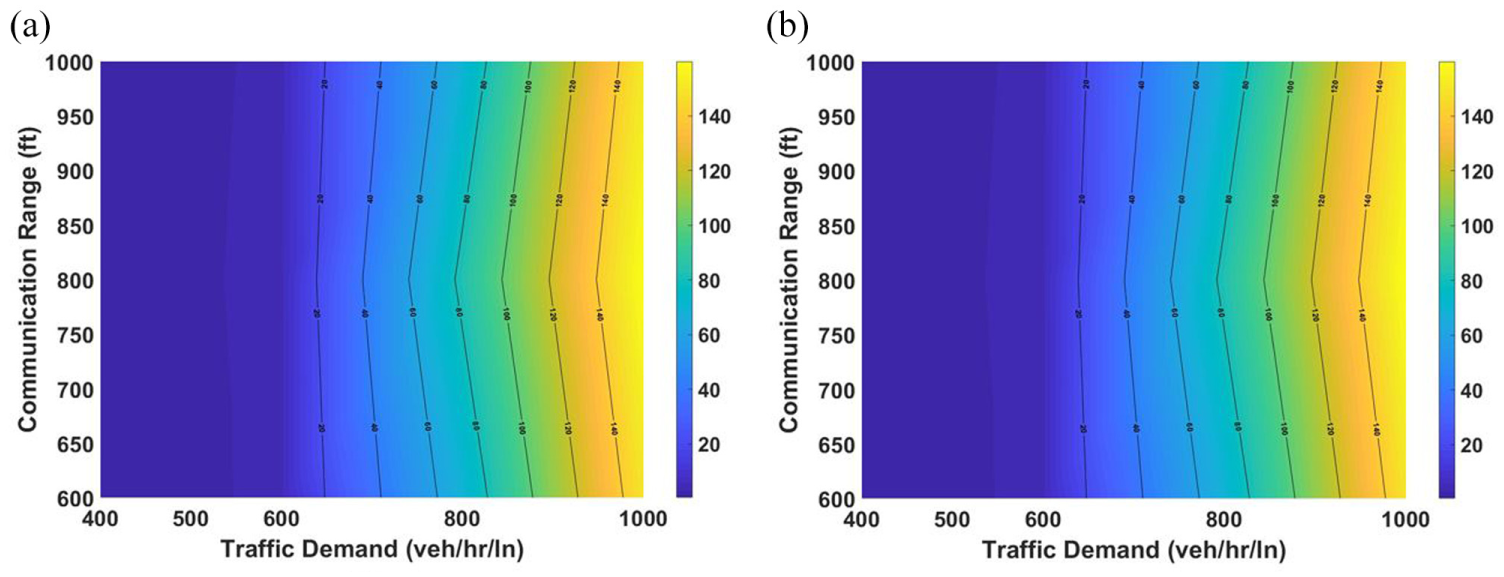
Communication Range Effect on Throughput
The effect of communication range on throughput when heavy vehicles are at 3% is illustrated by Figure 3a. At low traffic demands, all communication ranges perform the same because the capacity is significantly higher than traffic volume. When communication range is 600 ft, higher throughput is observed at moderate traffic demand (800 vphpl) comparing with communication ranges of 800 ft and 1,000 ft. This might be because the communication range of 600 ft is limited to the queue length, whereas IM in the case of 800 ft and 1,000 ft considers upcoming vehicles. However, the communication range of 1,000 ft demonstrates the highest throughput. Figure 3b shows the relation between throughput and communication range when heavy vehicles are at 15%. It seems that the increase of heavy vehicle percentage affects the communication range of 800 ft the most, as can be seen in Figure 3. Therefore, the results indicate that the communication ranges of 600 ft and 1,000 ft give higher throughput than the 800-ft range. The maximum throughput, when heavy vehicles are at 3%, is approximately 6,500 vph, whereas it is approximately 6,000 vph in the case of 15% heavy vehicles.
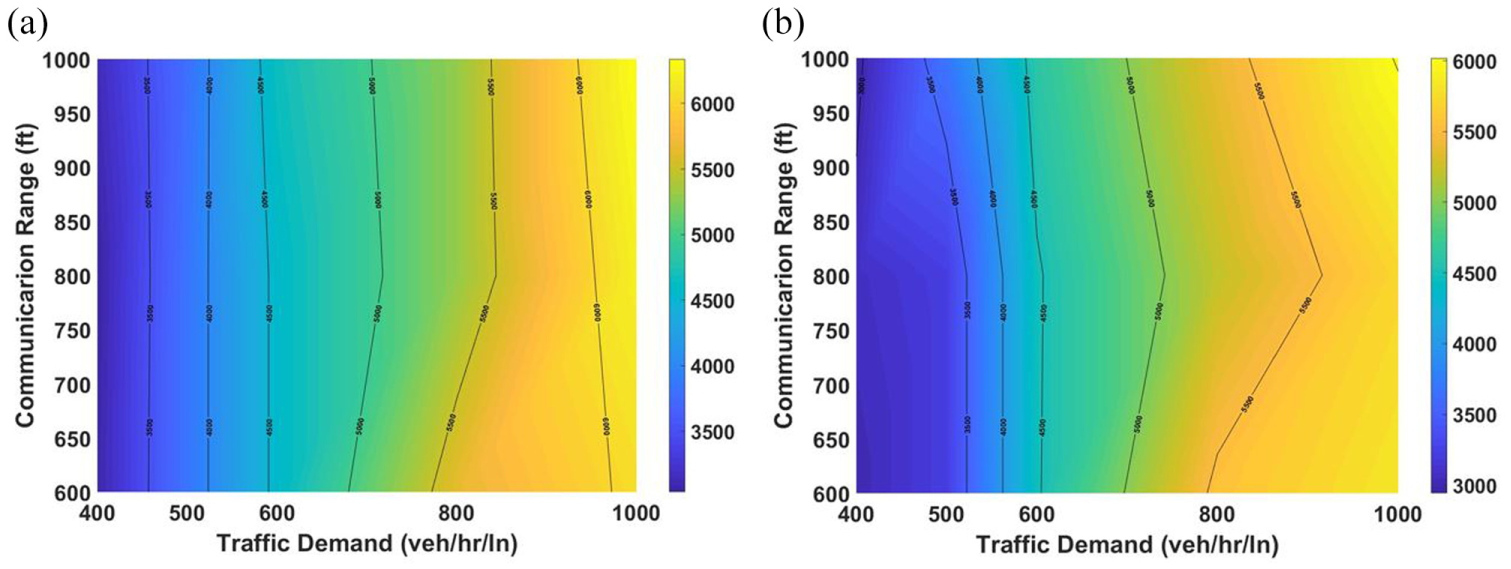
The effect of communication range on throughput in NIC: (a) heavy vehicles = 3%; (b) heavy vehicles = 15%. Veh/hr/ln = vphpl.
Communication Range Effect on Delay
The delay in the case of heavy vehicle percentages of 3% and 15% is less sensitive to the communication range. The difference between 600 ft, 800 ft, and 1,000 ft seems minimal as Figure 4, a and b shows. However, the communication range of 800 ft demonstrates a relatively lower delay comparing with 600 ft and 1,000 ft. It can be noticed that the heavy vehicles percentage of 3% yields a maximum delay of 140 s/v, whereas it is 160 s/v when heavy vehicles are at 15%.
The effect of communication range on delay in NIC: (a) heavy vehicles = 3%; (b) heavy vehicles = 15%. Veh/hr/ln = vphpl.
ASL Effect on Throughput
The effect of ASL on throughput, when heavy vehicles are at 3% and 15%, has a similar pattern, as appears in Figure 5, a and b . At low traffic demands, all ASLs perform the same because the systems can let all vehicles proceed. When traffic demand is moderate, the delay with different ASLs demonstrates slightly different performance. The difference can be observed when the ASL is at 60 ft and heavy vehicles are at 3% as the system performs better than when ASLs are at 45 ft and 100 ft. However, the advance line with 60 ft performs worse than line at 45 ft and 100 ft when heavy vehicles are at 15%. This might be because the ASL at 60 ft is affected by the length of heavy vehicles. The maximum throughput, when heavy vehicles are at 3%, is approximately 6,500 vph, whereas it is approximately 6,000 vph in the case of 15% heavy vehicles.
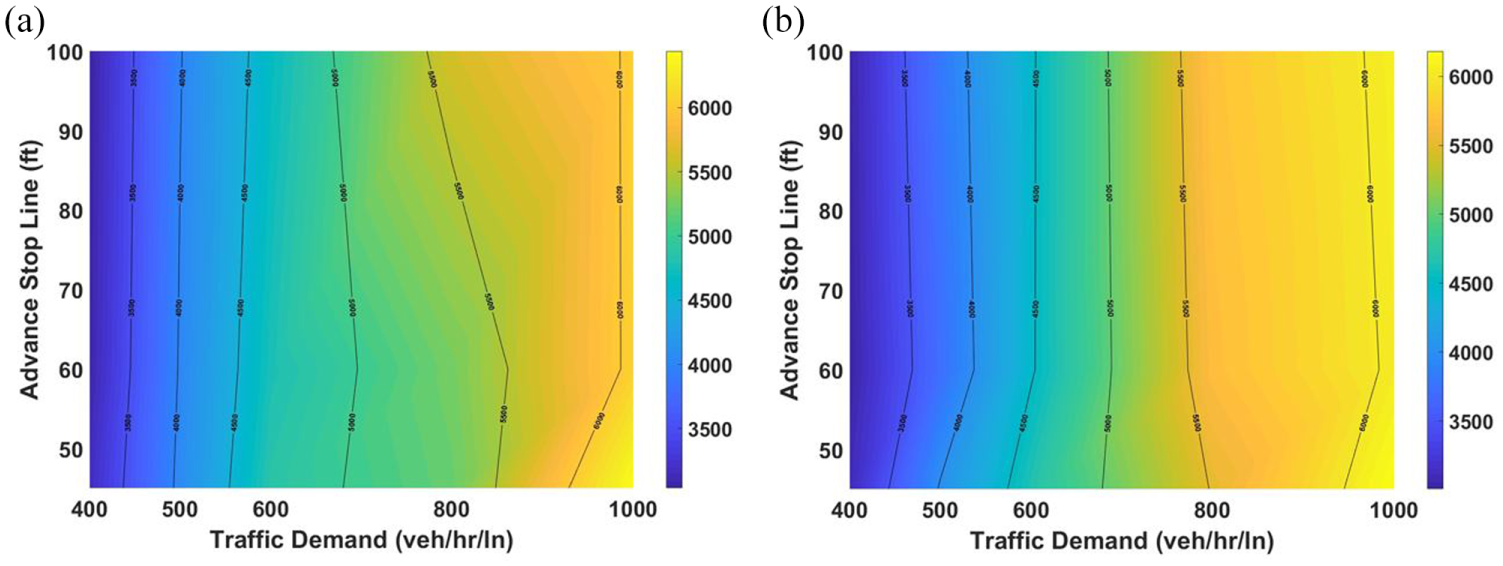
The effect of ASL on throughput in NIC: (a) heavy vehicles = 3%; (b) heavy vehicles = 15%. Veh/hr/ln = vphpl.
ASL Effect on Delay
The delay in the case of heavy vehicle percentages of 3% and 15% is less sensitive to the ASL.
The difference between 45 ft, 60 ft, and 100 ft seems minimal as Figure 6, a and b shows. However, the ASL of 45 ft demonstrates a relatively higher delay comparing with 60 ft and 100 ft. It can be noticed that the heavy vehicles percentage of 3% yields a maximum delay of 140 s/v, whereas it is 160 s/v when heavy vehicles are at 15%.
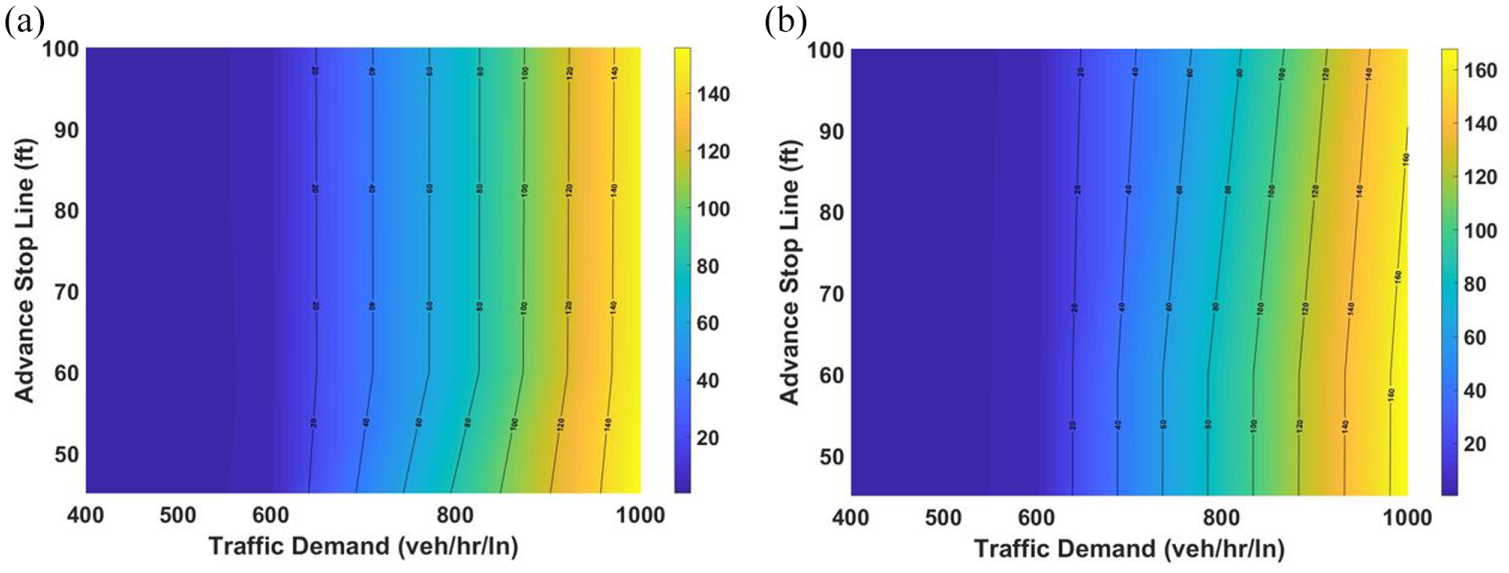
The effect of ASL on delay in NIC: (a) heavy vehicles = 3%; (b) heavy vehicles = 15%. Veh/hr/ln = vphpl.
The findings from the sensitivity analysis of NIC with 100% market penetration rate are used in the simulation of mixed traffic scenarios. Although the effects of communication range and advance stop location do not have clear patterns, a communication range of 600 ft and ASL of 100 ft have demonstrated a relatively lower delay. The idea is to use these optimum parameters for CAV to ensure better performance in mixed traffic situations.
Analysis of Mixed Traffic Impact
Analysis of Throughput in Mixed Traffic
The mixed traffic results demonstrate a linear relation between the market penetration rate and throughput, except when market penetration rate is 50%. As Figure 7 illustrates, when market penetration rate is 25%, the system is unable to demonstrate a higher performance than with traffic signals. However, it is clear that the system outperforms traffic signals when market penetration rate is 75% and 100%. In the case of 50% market penetration rate, the design with one lane for CAV demonstrates lower performance than both 25% market penetration rate and traffic signals. However, the results of the design with one lane of CAV outperform the two-lane design. This may be explained by the lane with CAV in NIC having a higher capacity than the lane with human-operated vehicles. Thus, NIC can handle higher traffic demand in a single CAV lane better than a single human-operated lane can deal with higher traffic demand. The differences between NIC with different market penetration rates and the traffic signal design are tested using a T-test to evaluate the significance of the difference in throughput.
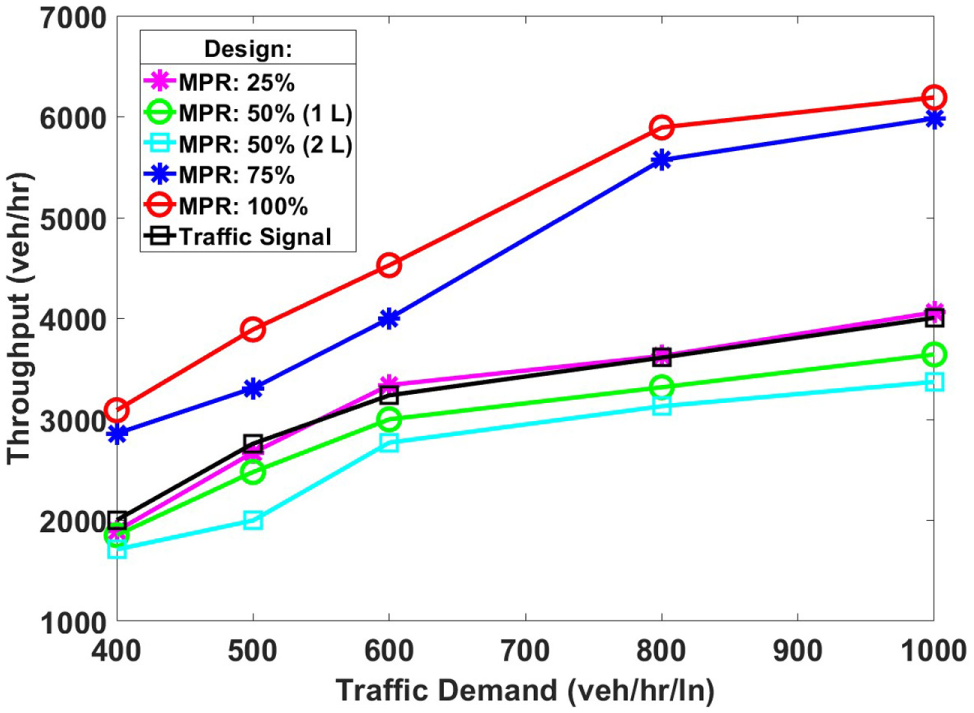
Throughput of traffic signals, fully autonomous NIC, and mixed traffic NIC. Veh/hr/ln = vphpl; veh/hr = vph.
Table 1 describes the difference in throughput between tested systems at all traffic demands. The difference is represented as a percentage compared with the benchmark (the traffic signal system). In addition, the p-value of the T-test from comparing the mean of 10 runs demonstrated significant differences between traffic signals and NIC with different market penetration rates. However, the difference at traffic demand of 600 vphpl between the market penetration rate of 25% and the traffic signal system is the only insignificant one. By looking at Figure 7, it can be noticed that traffic signal and NIC with market penetration rate of 25% are almost identical.
Statistical Test for Throughput of Traffic Signal, Fully Autonomous NIC, and Mixed Traffic NIC
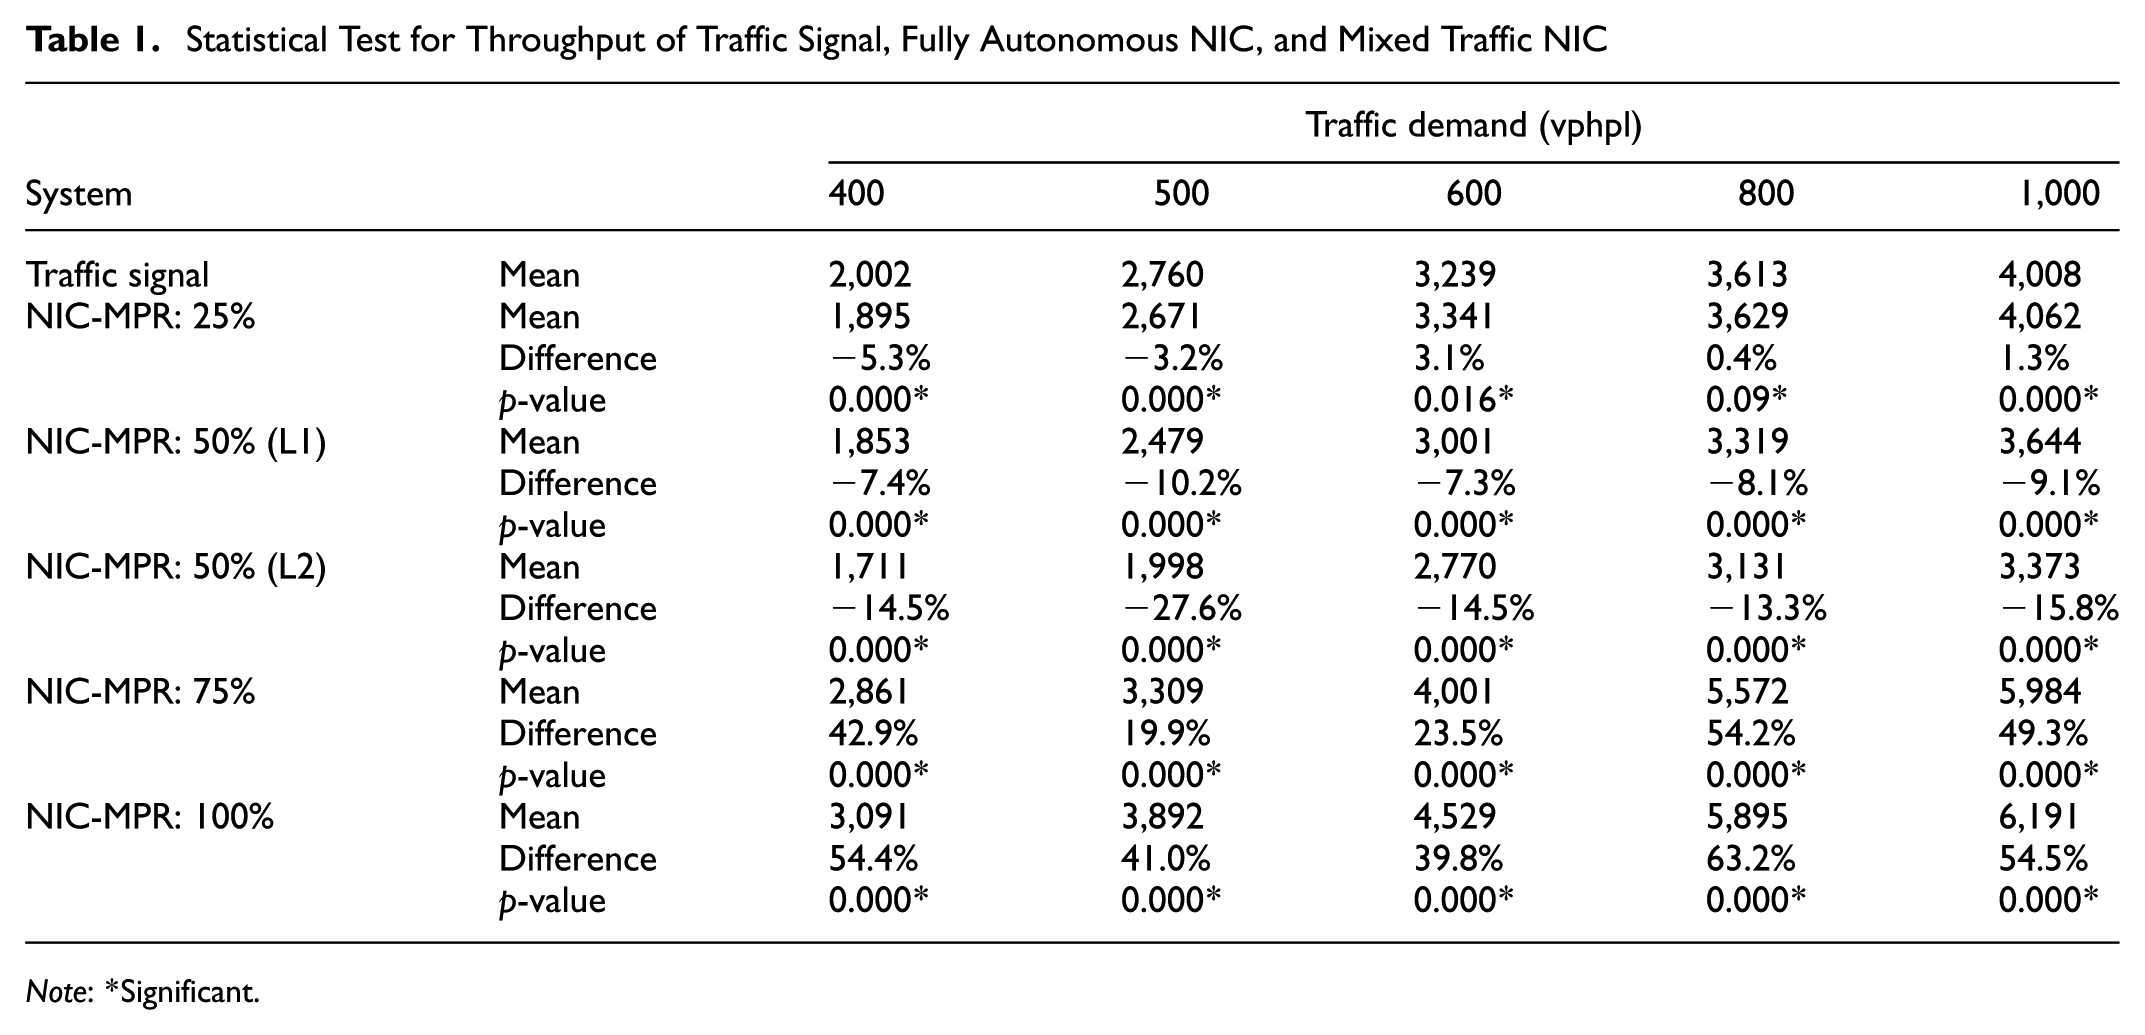
Note: *Significant.
Analysis of Delay and LOS in Mixed Traffic
Delay results demonstrate a linear relation with the market penetration rate, except when market penetration rate is 50% (see Figure 8).
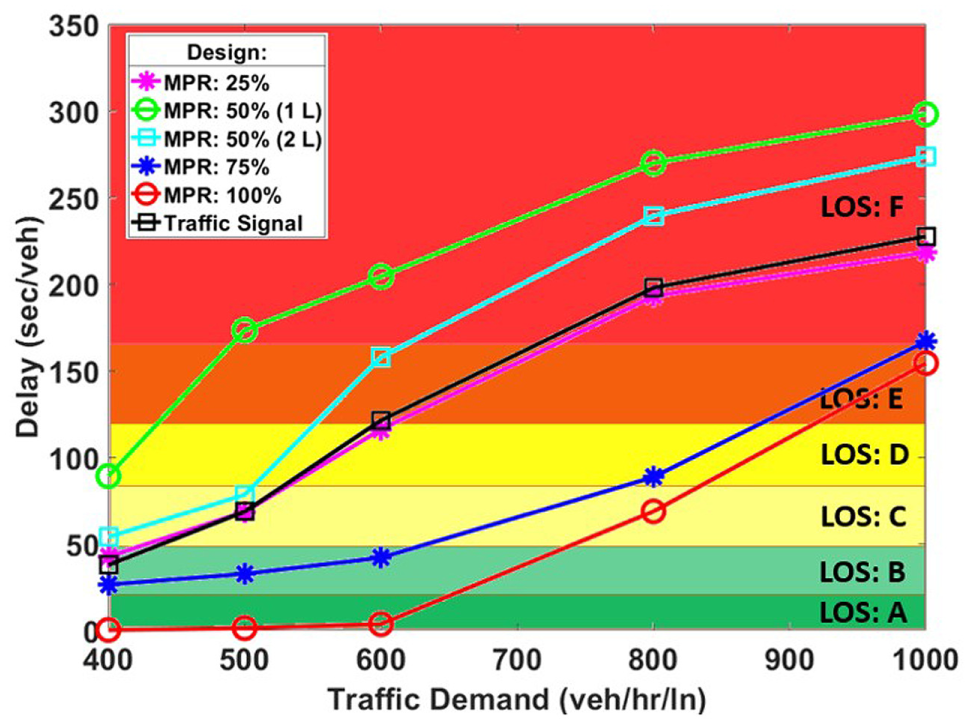
Delay and LOS of traffic signal, fully autonomous NIC, and mixed traffic NIC. Veh/hr/ln = vphpl; sec/veh = s/v.
As shown in Figure 8, when traffic demand is 1,000 vphpl, traffic signals and NIC with market penetration rates of 25% and 50% demonstrate LOS of F. However, when the market penetration rate is 75% or 100%, NIC can achieve LOS of E. The two designs of a market penetration rate of 50% perform similarly to the traffic signal system. Nevertheless, the two designs demonstrate lower LOS than traffic signals when traffic demand is 600 vphpl. When traffic demand is 400 vphpl, 50% market penetration rate with the one lane of CAV design outperforms the two-lane design and the traffic signal system.
Discussion
The effect of a higher heavy vehicle percentage on the performance measures of NIC is noticeable as better performance is related to a lower percentage of heavy vehicles. However, the relation between communication range and performance measures is questionable as there is no clear pattern. This might be related to the ability of the IM algorithm to handle reservation requests while there are many vehicles backing up. On the other hand, the location of ASL seems to provide better performance when it is closer to the interchange terminal (45 ft) or further away (100 ft), but not at 60 ft. This may be because 60 ft does not allow as much acceleration time as 100 ft does and at the same time it requires longer travel time than in the case of 45 ft.
With two dedicated lanes for CAV and one lane for human-operated vehicles, the NIC with 75% market penetration rate is able to significantly improve the performance measures. However, other market penetration rates demonstrate performances similar to or lower than traffic signals. This may be explained as low lane utilization because of the dedication of lanes for either CAV or human-operated vehicles. Therefore, another solution can be considered in dealing with mixed traffic at interchanges, such as the tandem intersection concept introduced by Xuan et al. ( 21 ). The concept aims to increase the capacity of signalized intersections with separate left-turn phases. In autonomous interchanges, it can be utilized to deploy both longitudinal and lateral control using pre-signals ( 22 ).
As shown in Figure 9, the tandem design splits the longitudinal direction into separate phases with one being for human-operated and the other being for CAV. The design relies on a pre-signal that dispatches vehicles based on the type of vehicle and the current phase being served. It is worth mentioning that such a system would require a high level of coordination between phases and an optimization scheme that incorporates human-operated vehicles and CAV.
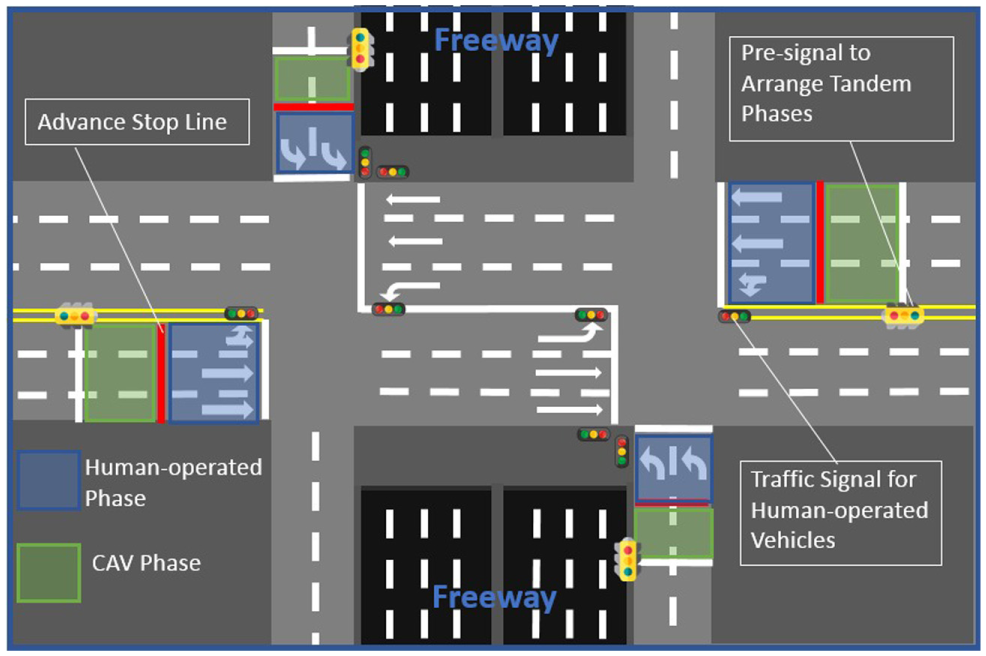
Depiction of employing tandem intersection concept in NIC.
Conclusions
This paper has developed an algorithm that deals with interchanges (NIC) and has tested the performance of the system in different mixed traffic situations. The system has considered the accommodation of human-operated vehicles by utilizing a lane-based strategy in which market penetration rate is the main criterion in the design of lane configurations. The NIC coordinates vehicles to traverse the interchange terminal by using a reservation-based control strategy with FCFS reservation protocol. The algorithm of the system has been modeled in the simulation software package VISSIM using a slightly modified real-world scenario of interchange.
The evaluation of the system starts with some key variables when market penetration rate is 100%. The increase in traffic demand and heavy vehicle percentage affects the performance of NIC by increasing the delay. Although the effects of communication range and ASL do not have clear patterns, the communication range of 600 ft and ASL of 100 ft demonstrate a relatively lower delay.
When market penetration rate is 25%, the system is unable to demonstrate a higher performance than traffic signals. However, it is clear that the system outperforms traffic signals when market penetration rate is 75% and 100%. In the case of 50% market penetration rate, the design with one lane for CAV demonstrates lower performance than either 25% market penetration rate or traffic signal. This is because the arterials in this experiment have three lanes, which means either CAV or human-operated vehicles must be saturated in one lane. The results of the design with one lane of CAV outperforms the two-lane design, however. This may be explained by the lane with CAV in NIC having a higher capacity than the lane with human-operated vehicles. Thus, the NIC can handle higher traffic demand in a CAV lane better than the human-operated lane can deal with higher traffic demand. Therefore, the number of lanes can play a significant role in a lane-based strategy, which is a limitation in this study. Another limitation in the simulation can be overcome by solving the computational complexity to test different granularity parameters. Future research may consider the number of lanes along with other variables such as other interchange designs and speed limits. In addition, the lane-based strategy can be compared with another mixed traffic solution such as the tandem intersection concept.
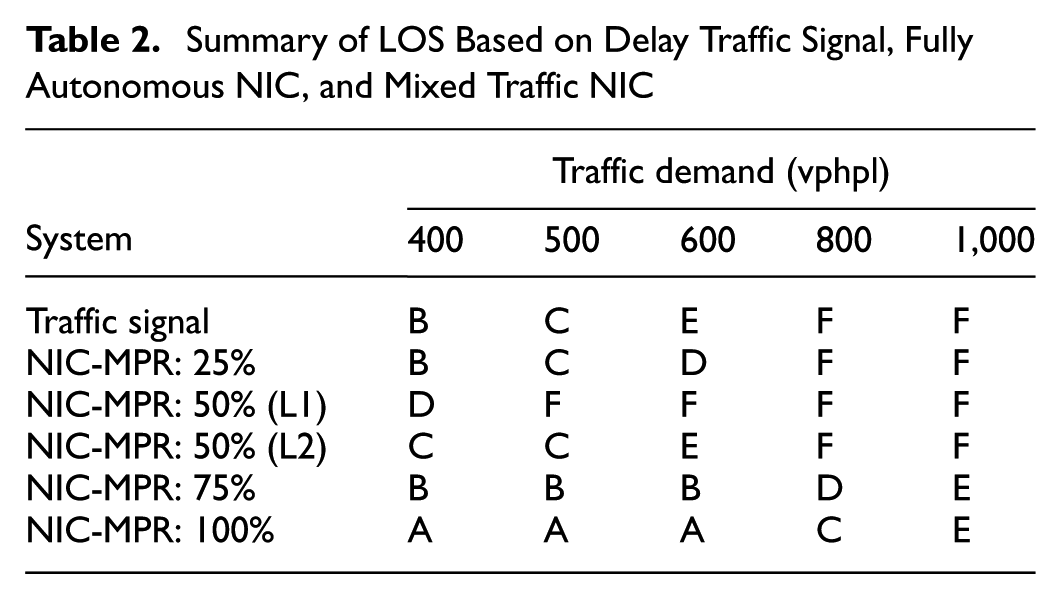
Table 2 summarizes the LOS of NIC with different market penetration rates and traffic signals based on delay.
Summary of LOS Based on Delay Traffic Signal, Fully Autonomous NIC, and Mixed Traffic NIC
Footnotes
Acknowledgements
This paper is based on research funded by National Science Foundation I/UCRC Center for EV-STS and University of Louisville EVPRI research grant.
Author Contributions
The authors confirm contribution to the paper as follows: study conception and design: ZL; data collection: MA; analysis and interpretation of results: MA, ZL; draft manuscript preparation: MA and ZL. All authors reviewed the results and approved the final version of the manuscript.
The Standing Committee on Intelligent Transportation Systems (AHB15) peer-reviewed this paper (19-01801).
The work presented reflects the authors’ view only.