
Abstract
Road safety modelers frequently use average annual daily traffic (AADT) as a measure of exposure in regression models of expected crash frequency for road segments and intersections. Recorded AADT values at most locations are estimated by state and local transportation agencies with significant uncertainty, often by extrapolating short-term traffic counts over time and space. This uncertainty in the traffic volume estimates, often termed in a modeling context as measurement error in right-hand-side variables, can have serious effects on model estimation, including: 1) biased regression coefficient estimates; and 2) increases in dispersion. The structure and magnitude of measurement error in AADT estimates are not clearly understood by researchers or practitioners, leading to difficulties in explicitly accounting for this error in statistical road safety models, and ultimately in finding solutions for its correction. This study explores the impacts of measurement error in traffic volume estimates on statistical road safety models by employing measurement error correction approaches, including regression calibration and simulation extrapolation. The concept is demonstrated using crash, traffic, and roadway data from rural, two-lane horizontal curves in the State of Washington. The overall results show that the regression coefficient estimates with a positive coefficient were larger and those with a negative coefficient were smaller (i.e., more negative) when the measurement error correction methods were applied to the regression models of expected crash frequency. Future directions in applications of measurement error correction approaches to road safety research are provided.
The quality of data and measurement of variables are of central importance to the results of any statistical analysis. The potential effects of measurement error on analysis results have long been recognized in various fields of study in which the measurement accuracy of important variables is a frequent issue, including biomedical, epidemiology, and ecology. When explanatory or right-hand-side (RHS) variables are measured with uncertainty or error, the problem is referred to as measurement error for continuous variables and misclassification for categorical variables ( 1 ). The implications of ignoring measurement error in RHS variables of statistical regression models can be substantial, often resulting in unreliable parameter estimates ( 2 ). In other words, ignoring measurement error introduces bias and inconsistency in regression coefficient estimates and increases error dispersion of statistical models ( 3 , 4 ).
In the most optimistic scenario, the bias resulting from measurement error may be ignored if it is judged to be much smaller than the estimates’ standard error ( 5 ). Often in multiple variable regression models, some of the RHS variables are measured with error and some without error. When measurement error exists for one or more RHS variables, the parameter estimates of error-free RHS variables are also biased and the direction of bias depends on the correlation between the error-free and error-prone explanatory variables (6–9). Along with measurement error bias there are other biases that exist in the statistical modeling of crash frequency. They are omitted variable bias, functional form misspecification, and sample selection bias.
The effects of measurement errors on the results of statistical road safety models have not been fully explored in the road safety literature. In statistical road safety modeling, the number of vehicles that pass by a fixed point during a specified time period (i.e., traffic volume) represents a measure of exposure ( 10 , 11 ). In regression models of expected crash frequency for road segments and intersections, traffic volume is most commonly represented as average annual daily traffic (AADT). AADT represents the average 24-H traffic volume at a given location over a full 365-day period. At many locations on the road network, AADT values are estimated by state and local transportation agencies by extrapolating short-term traffic counts over time and space. The data from these short-term traffic counts are collected for 1 to 7 days, every few years, at selected points across large-scale roadway networks ( 12 ). These counts are factored up to a yearly estimate based on yearly trends, represented by seasonal and monthly variation factors, which are developed using the data obtained from permanent automatic traffic recorder stations ( 13 ). This general process results in significant uncertainty, or measurement error, in AADT estimates at any given location. Most published regression models of expected crash frequency for road segments and intersections do not explicitly account for the fact that some explanatory variables used in the safety models (such as AADT) are estimates themselves with estimation errors. Effects of traffic volume estimation error on safety modeling and on the analysis of crash rates have been explored by some, but relatively few, researchers. Results showed unreliable parameter estimates and findings resulting from the measurement errors (14–16).
This paper seeks to add to the current knowledge on addressing measurement error in statistical road safety models of expected crash frequency by investigating and applying functional measurement error correction methods that adjust for measurement error bias. The measurement error correction approaches are applied using crash, traffic, and roadway data from rural, two-lane horizontal curves in the State of Washington and investigating AADT as the main error-prone variable. However, the methodology itself is relevant and adaptable to other error-prone explanatory variables, study designs, and statistical analysis settings.
Literature Review
The effects of error-prone explanatory variables on regression coefficient estimates, as well as potential remedies to measurement errors, have been explored for over two decades ( 17 , 18 ). Multiple methods have been developed to handle different types of measurement errors, study designs, and statistical analysis settings. The most widely discussed methods are suitable for handling continuous explanatory variables in generalized linear models. There have been fewer developments for applications to categorical explanatory variables (19–21).
The correction strategies for measurement error can be broadly grouped into functional and structural approaches ( 3 ). Functional approaches regard the error-prone explanatory variables to be unknown, nonrandom constants (or parameters). Structural approaches regard the error-prone explanatory variables to be random variables ( 1 , 2 ). Bayesian method applications to measurement error correction are an example of structural approaches, which are implemented using Markov chain Monte Carlo algorithms to correct for the measurement error in random explanatory variables ( 1 ). The two functional measurement error correction methods that have been applied to generalized linear models in previous published studies are regression calibration (RCAL) and simulation extrapolation (SIMEX) ( 6 , 22 , 23 ).
RCAL is a conceptually straightforward approach to estimation bias reduction and has been successfully applied to a broad range of regression models ( 24 ). The estimator obtained from this method is fully consistent in linear and log-linear models, and approximately consistent in nonlinear models. The method is appropriate when a linear measurement error with a constant variance applies to the error-prone explanatory variable ( 25 ). RCAL was first studied and applied in the context of proportional hazards regression ( 26 ). Later, the method was applied to logistic regression and other generalized linear regression models (27–30). In the case of logistic regression, the method was found to be effective in several studies and applications ( 29 , 30 ). However, some studies found that RCAL was ineffective at reducing bias in nonlinear models when the measurement error variance of the error-prone variable was large ( 24 ). Objective characterizations of “large” in this context are not available in the literature, and therefore no clear, objective distinctions have been made on the successful or unsuccessful application of this method to different regression models.
SIMEX is a widely applicable, simulation-based method of estimating and correcting for bias in a broad range of empirical settings. It is the only method that provides a visual display of the effects of measurement error on regression coefficient estimation ( 3 , 22 , 31 ). The estimator obtained from SIMEX is also fully consistent in linear models (like RCAL) and approximately consistent in nonlinear models. The method was first proposed by Cook and Stefanski and further developed by Stefanski and Cook ( 31 , 32 ). Later, there were multiple applications of this method in other research fields, including biostatistics, epidemiology, and ecology (33–36). These published studies found that the SIMEX method was effective in readily estimating and correcting the regression coefficient estimates that are biased because of error-prone explanatory variables in any type of regression models. One study by Fung et al. evaluated RCAL and SIMEX in Poisson regression and found that RCAL performed very well with reference to reducing attenuation bias, or the biasing of the regression slope toward zero, in regression coefficient estimates and in estimating accurate standard errors of the regression coefficient estimates ( 18 ).
Measurement error correction methods have been applied in very few studies published in the transportation literature, even though measurement error in the transportation context is widespread ( 37 ). Studies that applied measurement error models to error-prone average daily traffic estimates and work zone length during work zone conditions found significant bias in uncorrected regression coefficient estimates (37–39). In the field of road safety, El-Basyouny and Sayed proposed a lognormal measurement error model applicable to crash prediction ( 14 ). Their approach compared regression coefficient estimates obtained from the lognormal measurement error model with parameter estimates of models that did not account for measurement error. Traffic volume was the main error-prone variable of interest. Results showed that bias in regression coefficient estimates increased with magnitude of measurement error in traffic volumes when developing a safety performance function ( 14 ).
Despite the existing literature on the impacts of measurement error in explanatory variables on regression models of expected crash frequency, the application of measurement error correction strategies in road safety research has gained little attention. In recent years, there has been increased interest in the applications of epidemiological methods in road safety research ( 40 ). Functional measurement error correction strategies applied in epidemiological studies potentially hold promise with respect to their adaptability to road safety modeling.
Methodology
This section presents the methodology for modeling the expected number of crashes as a function of traffic and road characteristics while accounting for measurement error in the AADT estimates. Acknowledging that both functional and structural measurement error correction strategies can be used to correct for measurement error, the methodology in this paper focuses on functional approaches. Functional approaches do not require any distributional assumptions for the unobserved (or true) explanatory variable, whereas the structural approaches do require a parametric distribution for the unobserved (or true) explanatory variable. In other words, if the unobserved variable, or the true value of AADT in this case, is regarded as an unknown constant, then functional approaches should be applied. Since measurement error correction methods are scarcely applied in the field of road safety, functional approaches are a good starting point for further exploring and understanding the effects of measurement error in regression modeling of expected crash frequency, with structural approaches as a logical follow-on for future research work. The statistical concepts and theory behind applying these functional approaches is discussed in this section. As these correction approaches heavily rely on assumptions, this study explores and implements two different functional approaches and compares the results for both approaches with each other and with the uncorrected models.
Negative Binomial Regression Models
As crashes are count outcomes, and the variance of crash counts is almost always greater than the mean (or overdispersion), a negative binomial (NB) regression model was used to model the expected number of crashes as a function of road and traffic explanatory variables (
41
). The NB regression model is estimated using maximum likelihood, constructed based on the assumptions that the observations are independent. To further formulate the models in this paper, let the response variable,

where
In the NB-2 model, the variance in the number of crashes is written as
Functional Measurement Error Approaches
In modeling the expected number of crashes, significant uncertainty (or measurement error) in explanatory variables, specifically AADT estimates, is a concern. For a given explanatory variable (i.e., AADT), the true baseline value of the variable, y, is unobservable. Instead, it is assumed as a sum

where
The impact of this measurement error on the ability to quantify the relationship between all of the specified explanatory variables and expected number of crashes is substantial and could result in significantly biased regression coefficient estimates. The basis and methodology of RCAL and SIMEX are described in the following sections.
Regression Calibration
RCAL is a popular method for correcting bias in regression coefficient estimates because of measurement error. It has become popular because of its simplicity in application to any type of regression model ( 28 , 30 , 42 , 43 ). The basis for the RCAL algorithm in measurement error analysis is the construction of the calibration model for generating estimated covariate values for the unknown true covariates ( 25 ). This is accomplished using replication, validation, instrumental data, or measurement error variance in place of unknown true covariates. The unobserved covariates are represented by their predicted values, and then a standard analysis is conducted to obtain the regression model parameter estimates. Finally, the resulting standard errors are adjusted to account for the estimation of the unknown covariates, using either bootstrap or sandwich methods ( 3 , 25 ).
The true covariate (or explanatory variable) subjected to measurement error is
Use the observed values of
The estimate of
Run a standard analysis, that is, regress
Simulation Extrapolation
SIMEX is another general measurement error correction method that shares the simplicity, generality, and approximate-inference characteristics of RCAL, and is suitable for problems with additive measurement error. This method is a simulation-based method of estimating and reducing bias caused by measurement error ( 3 , 31 ). SIMEX consists of a “simulation step” and an “extrapolation step,” and is particularly useful for complex models with simple measurement error structures ( 19 ). The estimates are obtained by adding additional measurement error to the data in a resampling-like stage, and establishing a trend of measurement error-induced bias versus the added measurement error variance. Once the trend is established, the final estimates are obtained by extrapolating this trend back to the case of no measurement error ( 31 , 45 ). In summary, SIMEX estimation in this study consists of the following steps ( 46 , 47 ):
In the first step, which is also known as the simulation step, additional measurement errors, that is, in addition to the existing measurement error (with mean 0 and variance
In the second step, regression coefficient estimates for the error-prone explanatory variable (
After these two steps are repeated 1,000 times, the average value of the regression parameter estimate for each value of
The fourth and final step involves extrapolation to the ideal case of no measurement error, where the value of
An estimate of the measurement error variance is required before the two measurement error correction methods can be applied in statistical road safety modeling. This estimate is usually derived by considering deviations from a “gold standard” value, through collecting additional data. A “gold standard” value or the feasibility of collecting additional data in rural areas for the duration of the study (often 3 to 6 years) is not likely to be available in road safety studies. Therefore, a good starting point will be to use previous research and findings on the measurement error variance in AADT estimates. Professor Ezra Hauer, in his influential book on observational road safety studies, identified an unpublished model that estimated the percent coefficient of variation, using number of count days, and AADT estimates as follows ( 48 ). This equation was used to calculate the measurement error for AADT estimates used in this study:
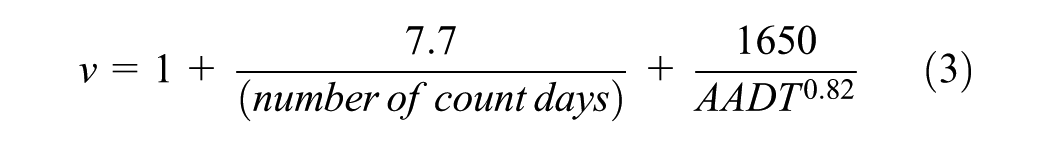
where
AADT = annual average daily traffic.
The natural logarithm of AADT (log AADT) is typically specified in regression models of expected crash frequency, and that practice is followed in this paper. The general formula for the coefficient of variation in a lognormal distribution is as follows:

where
Using the above equations, the coefficient of variation is determined using the number of count days and the AADT estimates (i.e.,
A convenient feature of the two measurement error approaches is that standard software can be used for estimation. The analysis was implemented using the “rcal” function and “simex”function in stata software. In this algorithm, measurement error variance is defined as a matrix that is used to generate the parameter estimates while accounting for measurement error in observed AADT estimates. In addition to the regression coefficient estimates, standard errors were also estimated by running 1,000 bootstrap samples in both functional approaches. The major difference between the two approaches is that the RCAL approach attempts to estimate the unknown true covariate and then run the standard analysis using the approximant in place of unknown true covariate. However, SIMEX simulates data to see the effect of measurement error on the regression coefficient estimates, and then extrapolates back to the results in which the covariate has no measurement error. The parameter estimates and standard errors obtained from both measurement error correction approaches were compared with a “naïve” regression model (i.e., a model that assumes no measurement error) to understand the strengths and limitations of employing measurement error correction approaches in statistical road safety modeling.
Data Collection
The investigation of the potential relationship between expected crash frequency and a set of explanatory variables, including the effects of measurement error in AADT estimates, is executed in this paper using data from rural, two-lane horizontal curves. Because of the presence of rarely available horizontal and vertical curve information through the Highway Safety Information System (HSIS) database and state department of transportation (DOT), data from the State of Washington were used to test the methodology and quantify the effects of measurement error in regression models of expected crash frequency ( 49 ). Two types of data were obtained and assembled in a unified database: (i) traffic and roadway data; and (ii) crash data. Detailed vertical curve data, including the length of vertical curve and percent grade of the approach grades, were obtained directly from the Washington State DOT through a data request made by the authors.
Traffic and Roadway Data
The horizontal curves and the traffic and roadway characteristics associated with the curves were located using state route number and milepost information. The roadway cross-section characteristics (e.g., lane width, shoulder width, and type) and other roadway attributes, including posted speed, truck percentage, functional classification, and AADT, were then linked to the horizontal curves using the state route number and milepost information. Some of the longer horizontal curves had multiple AADT estimates associated with them. The higher AADT estimates were assigned to the curves in those cases.
The vertical curve information was also linked to the horizontal curve information using state route number and milepost information. If any of the vertical curve geometric attributes changed along a horizontal curve segment, a new horizontal curve segment was defined. This was done to make the roadway segments homogeneous for the statistical analysis. Therefore, each row in the data set is a homogeneous horizontal curve segment associated with the roadway, traffic, and crash information for the entire study period. A detailed description of the crash data that were linked to horizontal curve segments is provided in the next section.
Crash Data
Crash data were obtained for crashes occurring on rural, two-lane horizontal curves for 5 years, from 2008 to 2012. Crash location in the HSIS database was identified by state route number and milepost information, similar to the traffic and roadway data. Crashes were linked to horizontal curves using this location information. A 5-year total crash count (i.e., all crash types and severities) was developed for each curve. This research does not include crashes involving pedestrians and bicyclists, which generally occur more frequently in urban areas. Descriptive statistics for the traffic, roadway, and crash data for the rural, two-lane horizontal curves in the State of Washington are provided in Table 1.
Descriptive Statistics for Rural, Two-Lane Horizontal Curve Segments
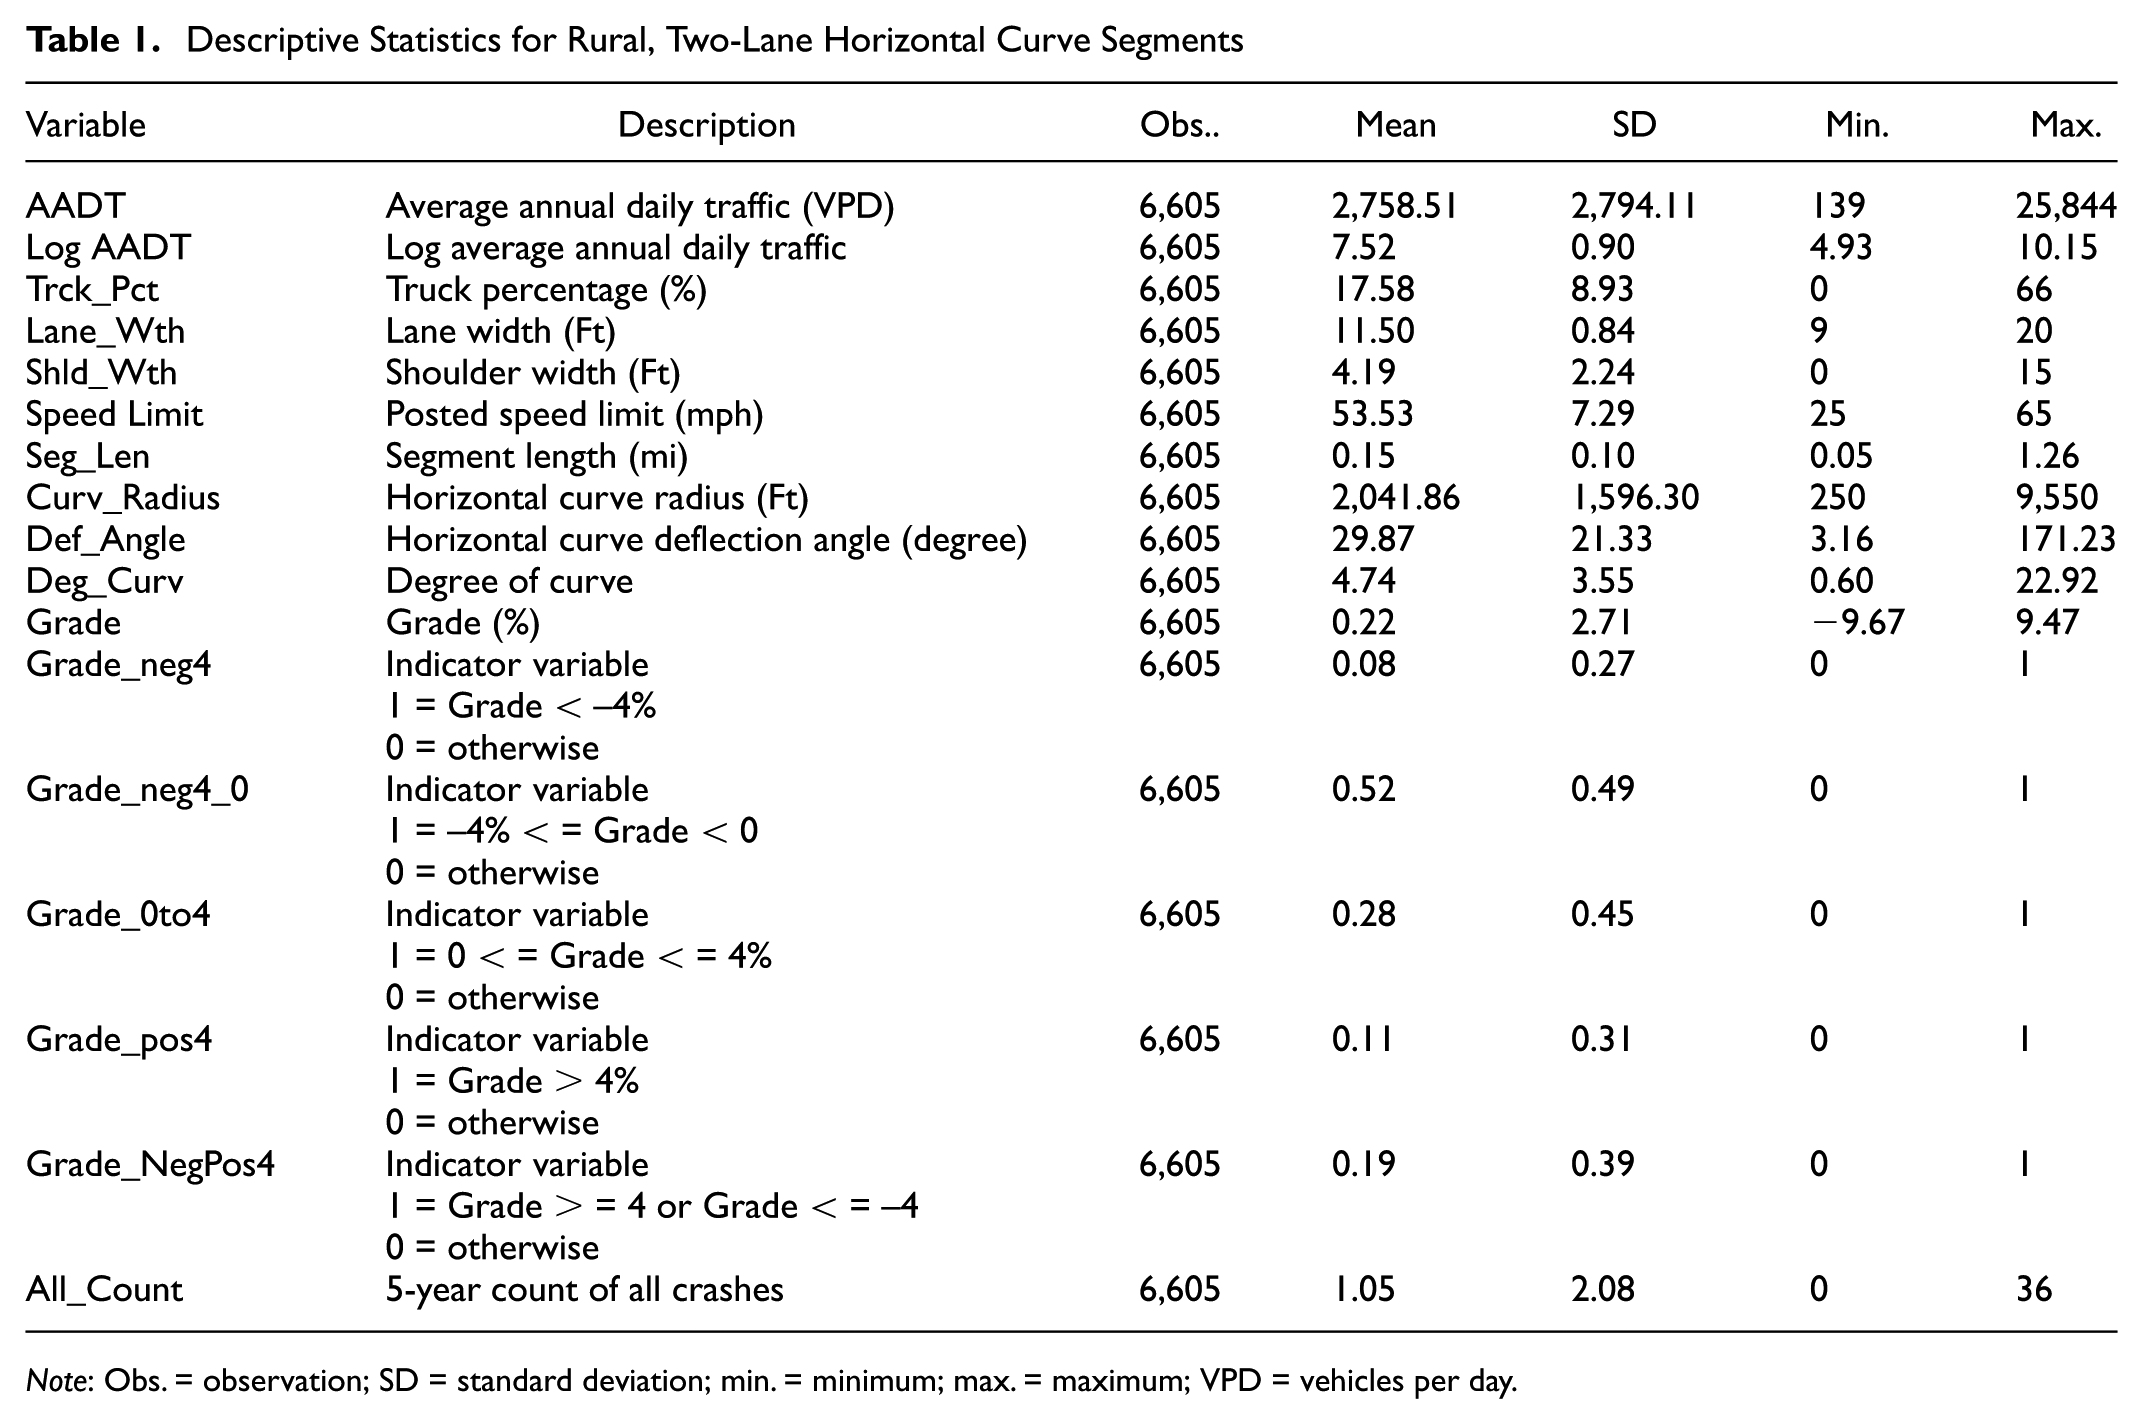
Note: Obs. = observation; SD = standard deviation; min. = minimum; max. = maximum; VPD = vehicles per day.
Statistical Modeling Results
The data set described in the previous section was used to investigate the potential relationship between the explanatory traffic and roadway variables and expected crash frequency on rural, two-lane horizontal curves. The previously described NB-2 regression model was used, with the expected number of total crashes (all types and severities) as the dependent variable, and the selected traffic and roadway characteristics, including the observed AADT estimates, as explanatory variables on the RHS of the regression equation. The modeling process started with estimating NB-2 models of total crashes that included the error-prone AADT estimates without correction, as well as the other explanatory variables from the data set. Many different model specifications were explored until a final model specification was obtained, including variables that were statistically significant at a 95% or higher confidence level (i.e., probability of Type I error ≤ 0.05). Model estimation results for models including the uncorrected error-prone AADT estimates as one of several explanatory variables are provided in Table 2.
NB Regression Model for All (Total) Crashes on Rural, Two-Lane Horizontal Curves with Error-Prone AADT Estimates
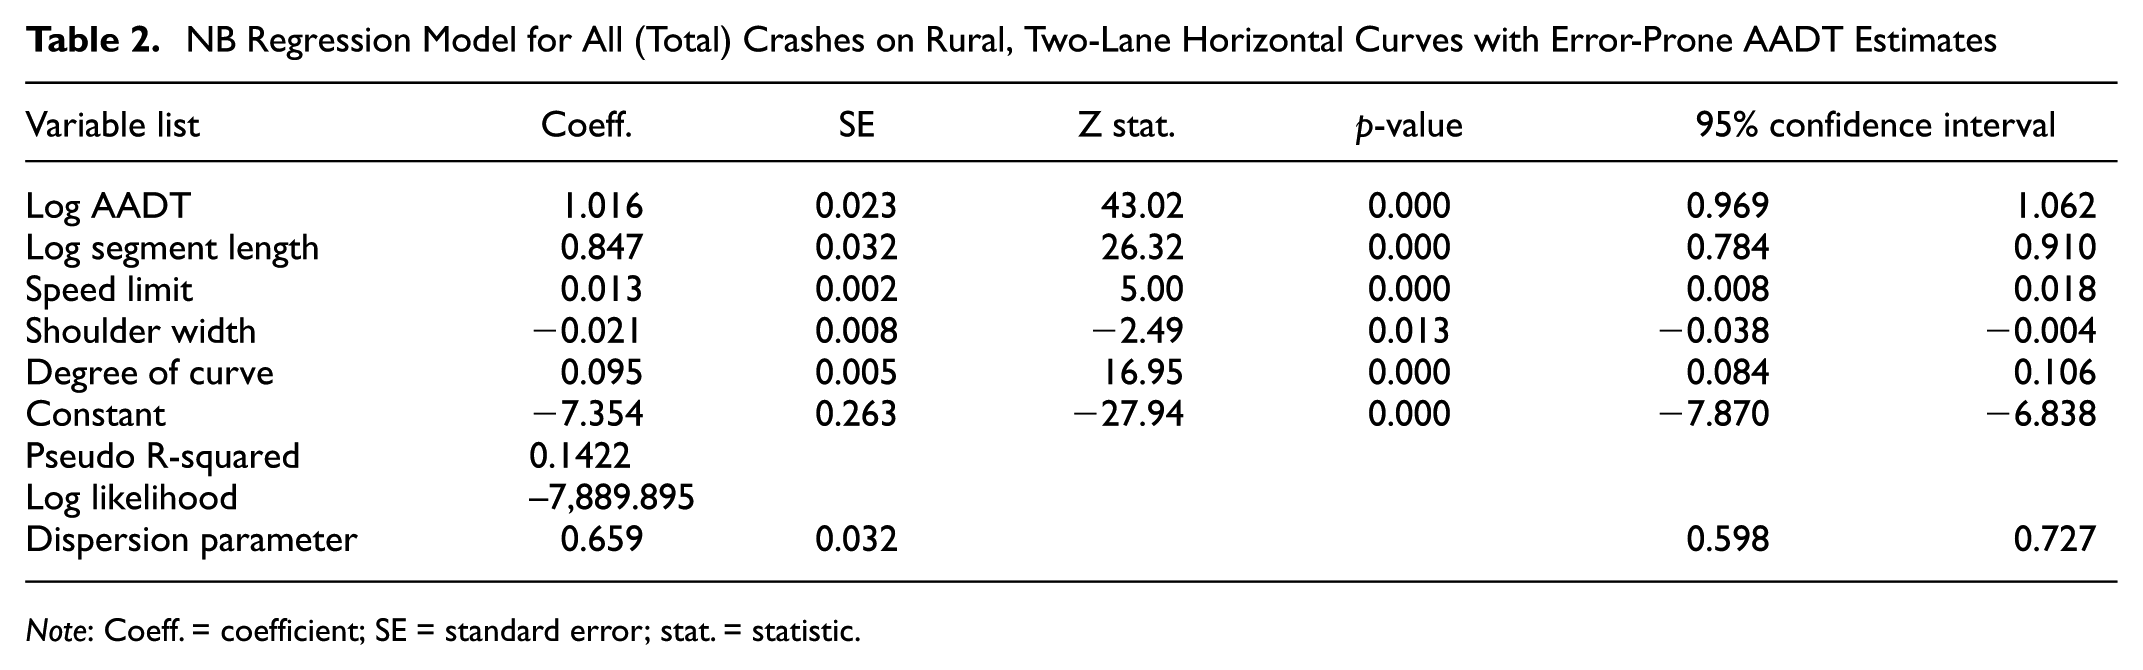
Note: Coeff. = coefficient; SE = standard error; stat. = statistic.
The positive coefficient for the natural logarithm of AADT shows the intuitive increase in the expected number of crashes as traffic volume increases. Similar to log AADT, the regression coefficient for natural logarithm of segment length is positive, which captured the increase in expected crash frequency with an increase in segment length. Typically, segment length is included as an offset variable (i.e., parameter for natural logarithm of segment length constrained to 1.0). The parameter for the natural logarithm of segment length was estimated in this analysis to see if the measurement error for natural logarithm of AADT has an effect on the natural logarithm of segment length (shown in the section on the effect of measurement error on safety models). Segment length, along with traffic volume, represents exposure. The posted speed limit is associated with an increase in the expected number of crashes, which could be explained by higher posted speed limits being associated with higher operating speeds, which correspond to more severe crashes that are more likely to be reported. The shoulder width was statistically significant with the regression coefficient being negative. This indicates the beneficial influence of shoulder width; an increase in shoulder width is associated with a decrease in the expected crash frequency. Degree of curve had a positive coefficient, which is intuitive and suggests that the expected number of crashes increases as the curve becomes “sharper.”
Modeling Measurement Errors in Traffic Volume
The final step of this research was to estimate the measurement error variance associated with the AADT estimates and employ measurement error correction approaches in the statistical road safety models of expected number of crashes on rural, two-lane horizontal curves. This is executed to determine how and to what magnitude functional measurement error correction approaches address the error bias that tends to be overlooked in the context of statistical road safety modeling.
Estimation of AADT Measurement Error Variance (
)
In this study, the variance of measurement error was estimated using the previously described coefficient of variation equation from the unpublished study. The information on the number of count days for AADT estimation for the roadway segments was not available to calculate the coefficient of variation objectively. Therefore, a sensitivity analysis was conducted to evaluate the effects of measurement error in AADT estimates when the level of measurement error is unclear.
The error for the AADT estimates considered in this analysis was assumed to range from 10% to 40% of the actual value of AADT, with the short-term count days fluctuating from 2 to 5 days. Using the coefficient of variation equation described in the section on simulation extrapolation, this results in measurement error variance estimates for the natural logarithm of AADT ranging from 0.05 to 0.20 for the analysis. Consequently, this research explores the sensitivity of parameter estimates to the variance of measurement error for the natural logarithm of AADT estimates when it ranges from 0.05 to 0.20, with analysis being performed for variance estimates in increments of 0.05 (i.e., .05, 0.10, 0.15, 0.20). The hypothesis is that the application of measurement error correction approaches will correct the bias in all the explanatory variables caused by error-prone AADT estimates in safety models.
Effect of Measurement Error on Safety Models
Model estimation results employing functional measurement error correction approaches for the natural logarithm of AADT are provided in Table 3. This table presents the estimated regression coefficients, bootstrap standard errors, observed significance levels, and 95% confidence intervals for all of the explanatory variables after employing the functional measurement error correction approaches in regression models of expected crash frequency.
RCAL and SIMEX Model Results for All (Total) Crashes on Rural, Two-Lane Horizontal Curves accounting for Measurement Errors in AADT Estimates
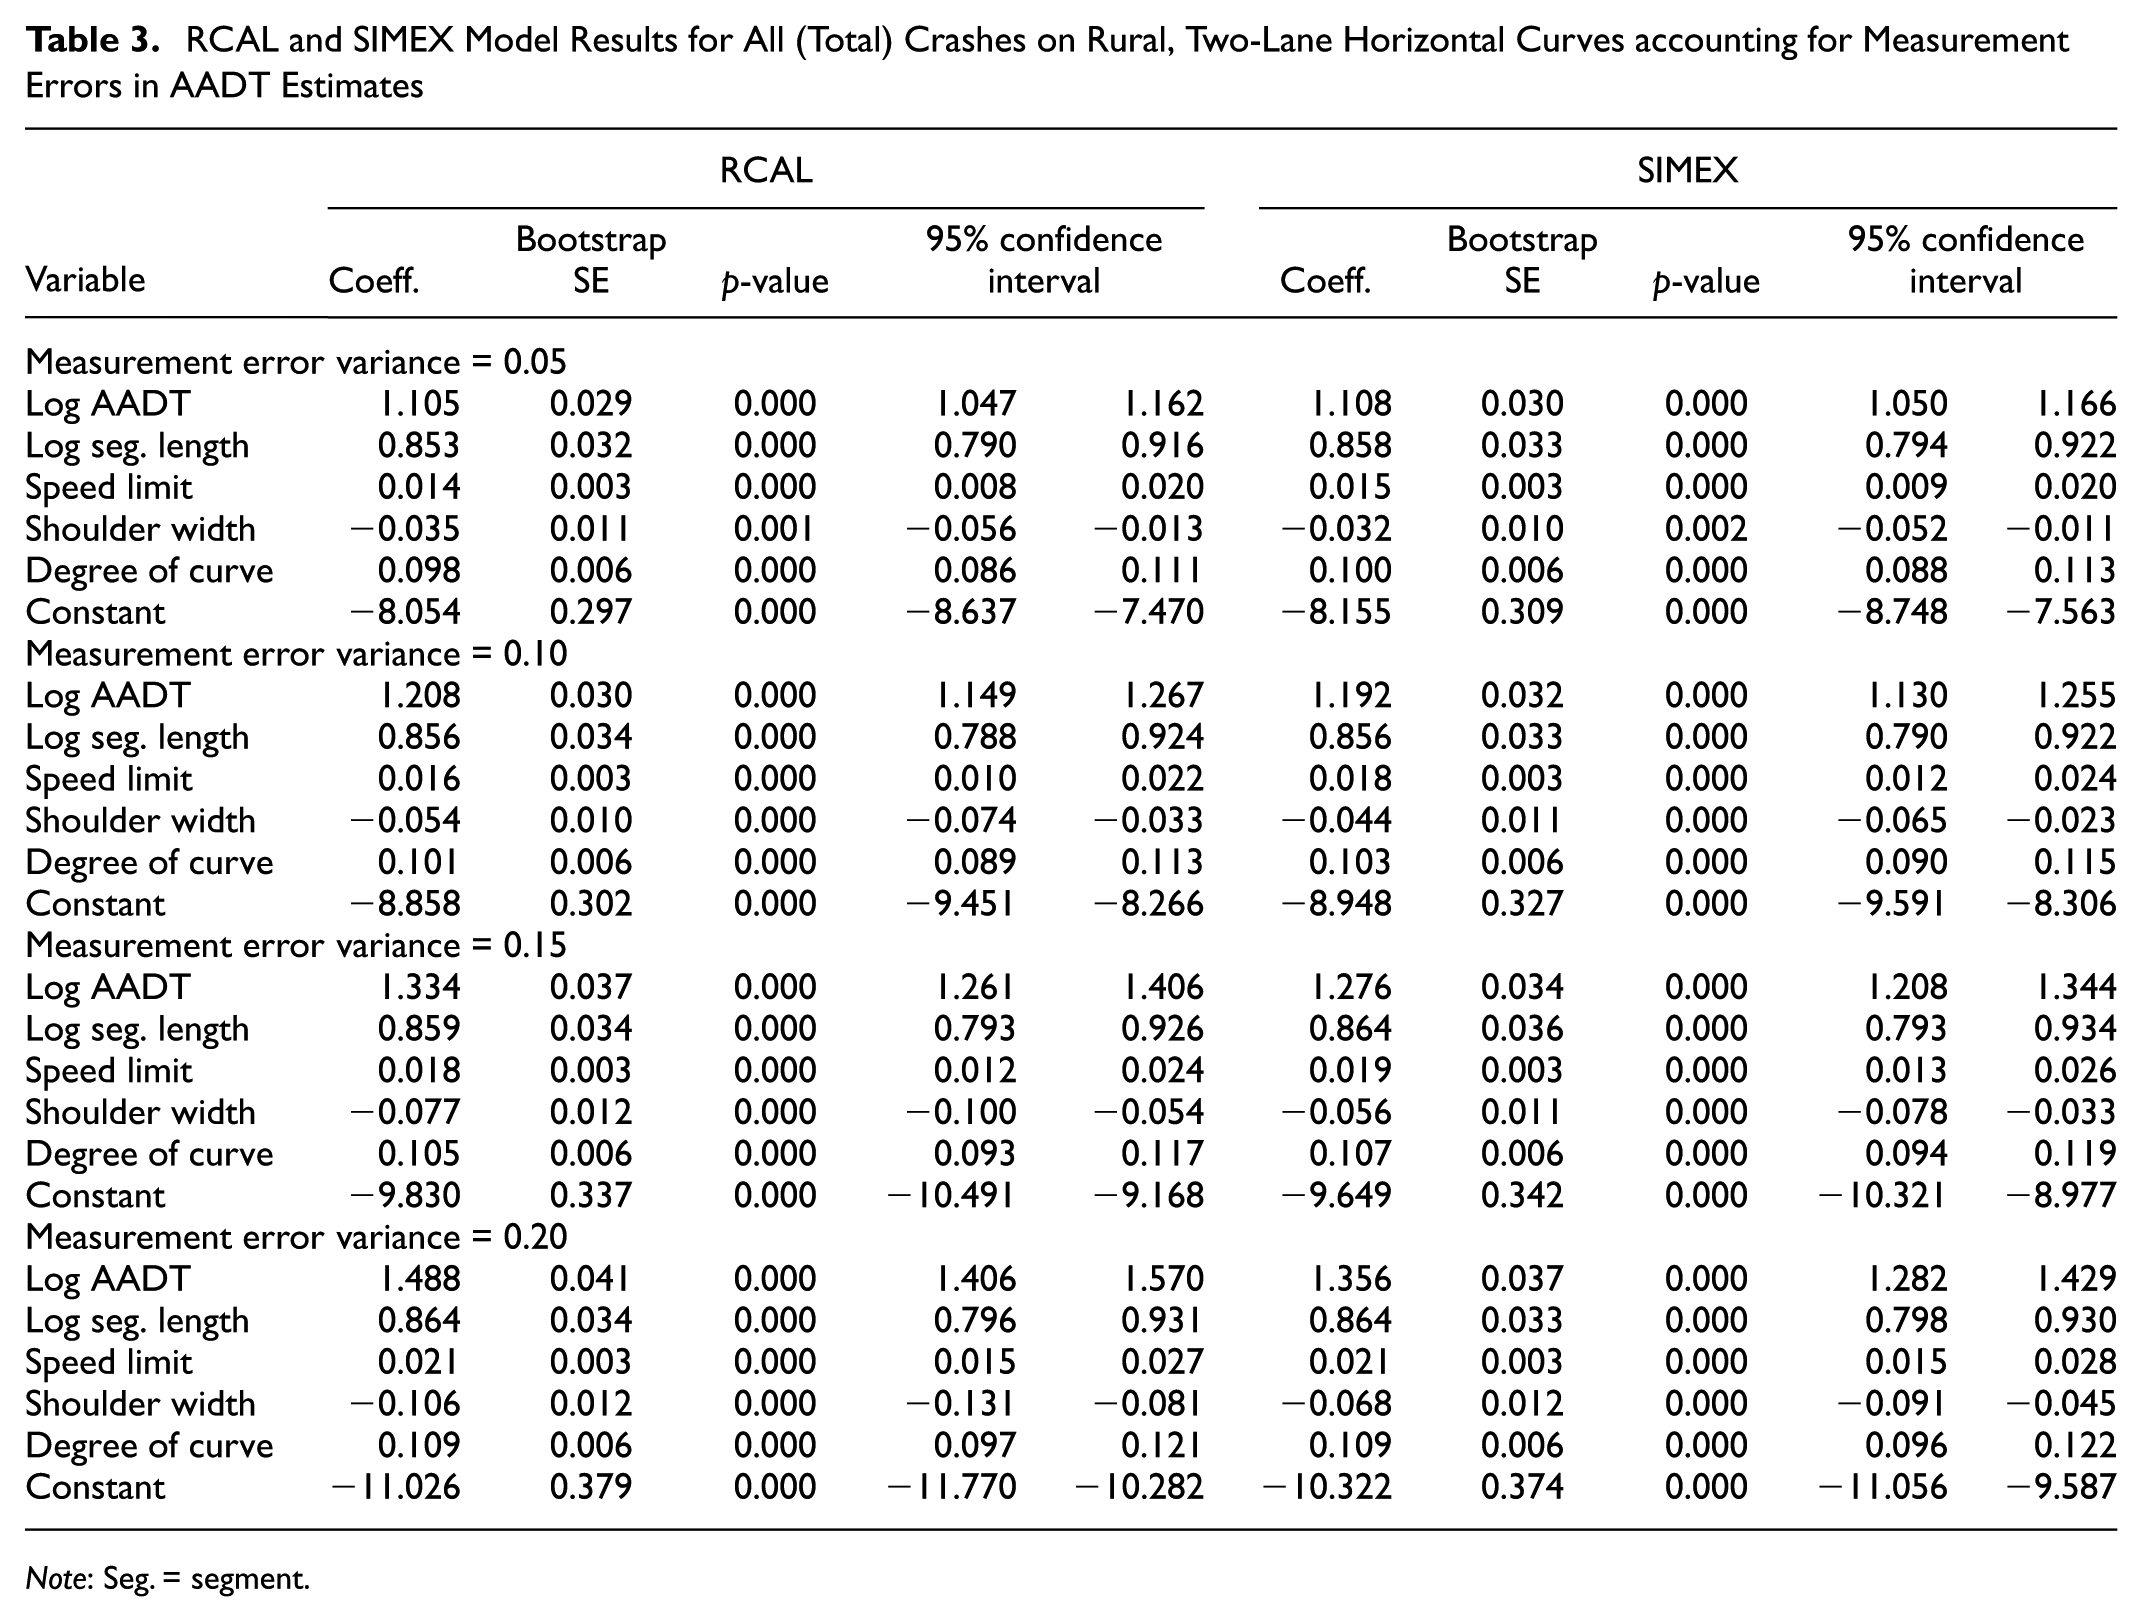
Note: Seg. = segment.
The overall results from Table 3 show that the regression coefficient estimates with a positive coefficient were larger and those with a negative coefficient were smaller (i.e., more negative) when the measurement error correction methods were applied to NB regression models of expected crash frequency. This implies that the regression coefficient estimates for the explanatory variables with uncorrected measurement error are biased toward zero. This is consistent with the literature, which suggests that measurement errors shrink estimates toward zero ( 22 , 50 ). The results from the table also show the bootstrap standard error estimates for all the explanatory variables, which were obtained after the measurement error correction methods were employed for each size of measurement error. The bootstrap standard errors estimated from the functional approaches were larger when compared with the standard errors obtained in the uncorrected regression model estimation in Table 2. This shows that NB regression models that do not account for measurement error in error-prone explanatory variables underestimate the standard errors of the parameter estimates. This finding is consistent with the literature that standard errors of parameter estimates of uncorrected NB regression models are smaller ( 14 ).
For the natural logarithm of AADT (i.e., the error-prone variable), the estimated regression coefficient is much smaller for the uncorrected regression model (1.016) than for those obtained from RCAL and SIMEX approaches for each size of measurement error, consistent with previous research ( 14 ). As the magnitude of measurement error variance increased, the magnitude of the regression coefficient estimates for the natural logarithm of AADT increased, also consistent with previous research findings ( 14 , 38 ). When RCAL was applied, the regression coefficient estimates increased when compared with the uncorrected model by 8.75% to 46% as the size of measurement error variance for log AADT increased from 0.05 to 0.20, respectively. Similarly, when SIMEX was applied, the regression coefficient estimate increased when compared with the uncorrected model by 8.5% to 33.5% when the size of measurement error variance for log AADT increased from 0.05 to 0.20, respectively.
The regression coefficient estimates for correctly measured explanatory variables are also expected to be biased when measurement error is present in one of the explanatory variables. For the natural logarithm of segment length, for example, the regression coefficient estimates increased when compared with the uncorrected model by 2% when a measurement error variance of 0.20 for log AADT was applied with RCAL and SIMEX approaches. Similarly, for posted speed limit, the regression coefficient estimates increased when compared with the uncorrected model by 8% to 60% for RCAL and 15% to 60% for SIMEX when the size of measurement error variance for log AADT increased from 0.05 to 0.20, respectively. For shoulder width, the regression coefficient estimates increased when compared with the uncorrected model by 60% to 400% for RCAL and 50% to 200% for SIMEX as the size of measurement error variance increased from 0.05 to 0.20 for log AADT estimates. The regression coefficients for degree of curve also increased by 3% to 15% for RCAL and 5% to 15% for SIMEX as the size of measurement error variance for log AADT changed from 0.05 to 0.20.
Of all the correctly measured explanatory variables, the effect of measurement error in AADT was largest in estimated parameters for shoulder width, followed by estimated parameters for posted speed limit, degree of curve, and natural logarithm of segment length. This is because of correlation among the explanatory variables. There was a higher observed correlation between log AADT and shoulder width in this data set when compared with the other correctly measured explanatory variables; thus, the effect of measurement error in AADT on the shoulder width parameter was highest. Similarly, if the variables were not as highly correlated, the effect of measurement error on the respective estimated regression parameters was found to be lower. One common finding with respect to the regression coefficient estimates for all explanatory variables is that the differences in parameter estimates between the error corrected and uncorrected models increased as the magnitude of the measurement error variance in log AADT estimates increased. Moreover, if the results are compared between the two measurement error correction methods, SIMEX tended to preserve the precision of the regression coefficient estimates. RCAL tended to correct for a larger amount of potential effect bias in the regression coefficient estimates than SIMEX, particularly for the error-prone variable.
Summary, Conclusions, and Recommendations
Measurement error is a prevalent but commonly ignored problem in road safety research. Measurement error in explanatory variables of regression models may lead to serious biases in regression coefficient estimates and confidence intervals of both error-prone and error-free explanatory variables. This study adds to existing knowledge in the literature by investigating and applying measurement error correction methods that adjust for measurement error bias while examining the associations between a set of explanatory traffic and roadway variables and expected crash frequency. The bias corrections were employed by estimating the variance of measurement error in traffic volume estimates while modeling expected crash frequency. The “rcal” and “simex”functions in STATA were used to generate regression coefficient estimates and standard errors of all explanatory variables, accounting for measurement error in AADT. The uncorrected NB model estimation results were also provided in this study to allow for comparison of regression coefficient estimates and standard errors before and after accounting for measurement error in AADT estimates.
The overall results from NB regression models show that the regression coefficient estimates with a positive coefficient were larger and those with a negative coefficient were smaller (i.e., more negative) when the measurement error correction methods were applied to the regression models of expected crash frequency. This means that regression coefficient estimates for the explanatory variables are biased toward zero when measurement error is not accounted for in regression modeling. The results also showed that the bootstrap standard errors estimated from the functional measurement error correction approaches were larger when compared with the standard errors obtained in the naïve (i.e., uncorrected) regression model estimation.
The value of measurement error variance of the error-prone explanatory variable (log AADT in this paper) used in the measurement error correction methods was an important consideration. This study utilized an equation from an unpublished study and sensitivity analysis to determine the likely size of measurement error variance in log AADT estimates. This was done to show the potential application of these measurement error correction methods to NB regression models of expected crash frequency and uncover trends in the findings. However, the calculation of a “true” measurement error variance in log AADT estimates would be helpful in obtaining reliable results. This remains a needed area of future research.
Looking at the results, it can be said that in statistical road safety modeling, an attempt to correct measurement error in explanatory variables should be explored whenever justifiable and possible. In general, the choice of measurement error model should be guided by the type of error-prone variables (e.g., continuous versus categorical explanatory or response variables, or both), type of regression model used to model the data, and capabilities of the software, in addition to other fundamental issues such as underlying assumptions of each method. Determining the actual effects of incorporating measurement error in finding the ranking of sites for safety countermeasure implementation and before-after evaluations will be a logical next step in this research.
Footnotes
Acknowledgements
Development of the data set analyzed in this paper was partially funded by the Federal Highway Administration, Office of Safety Research & Development. The authors would like to thank the staff of the Highway Safety Information System (HSIS) and Washington State Department of Transportation (Washington State DOT) for providing roadway, traffic, and crash data for the State of Washington.
Author Contributions
The authors confirm contribution to the paper as follows: study conception and design: Am, RJP; data collection: AM; analysis and interpretation of results: AM, RJP; draft manuscript preparation: AM, RJP. Both authors reviewed the results and approved the final version of the manuscript.
The Standing Committee on Safety Data, Analysis and Evaluation (ANB20) peer-reviewed this paper (19-04990).