
Abstract
Emergent technologies like autonomous/connected vehicles and shared mobility platforms are anticipated to significantly affect various aspects of the transportation network such as safety, mobility, accessibility, environmental effects, and economics. Transit agencies play a critical role in this network by providing mobility to populations unable to drive or afford personal vehicles, and in some localities carry passengers more efficiently than other modes. As transit agencies plan for the future, uncertainty remains with how to best leverage new technologies. A survey completed by 50 transit agencies across the United States revealed similar yet different perceptions and preparations regarding transportation network companies (TNCs) and autonomous transit (AT) systems. Transit agencies believe TNC market share will grow, either minimally or rapidly (72%), within the next 5 years and have either a negative (43%) or positive (35%) impact on their transit system. Only 30% of agency boards instructed the agency to work with TNCs, despite no perceived transit union support. For AT systems, 22% of agencies are studying them, 64% believe the impacts of AT over the next 10–20 years will be positive, but fewer agencies are influenced to consider new technologies because of AT systems (38%) compared with TNCs (72%). Surprisingly, transit administration is mostly unsure about driver and transit unions’ perceptions of these technologies. In addition, a significant number of transit agencies do not believe they should play a role in ensuring TNCs are safe and equitable and that TNCs should not have to adhere to the same regulations (50%, 28% respectively).
The 2014 Automated Vehicles Symposium identified automated transit and shared mobility as a focus for future research and transit an apt environment to introduce autonomous vehicle (AV) technology ( 1 ). The speakers attending, ranging from academics to federal and state agencies, echoed well-known benefits of autonomous transit (AT) systems: reduced labor costs ( 2 ), the primary operational cost for transit agencies, expansion of service coverage through first/last mile connections to line-haul systems ( 3 ), and augmentation of paratransit services ( 4 ).
In 2016, the Shared Use Mobility Center (SUMC) published the most recent and comprehensive examination of the state of shared-use mobility in the U.S., following a Transportation Research Board report analyzing policy challenges technology-enabled transportation services are creating ( 5 , 6 ). The report presents transit agencies and transportation departments with actions and partnership models to encourage flourishing urban mobility through a complementary relationship with transportation network companies (TNCs). The SUMC study included a survey of transportation officials in seven U.S. metropolitan areas, revealing agencies are willing to adapt toward a mobility service provider model, leverage new technologies for paratransit and first/last mile services, and are currently piloting or in the works to partner with TNCs ( 5 ). SUMC developed guidance for transit agencies in different urban sized markets on working with TNCs (e.g., midsized urban areas should explore first/last mile partnership opportunities with TNCs, whereas small urban areas should explore TNCs to increase the utility of public transit in poor transit coverage areas).
However, many transit agencies are worried about operating in a legal gray area created by partnering with an under-regulated industry, as compared with a public transit agency. A recent case study of two (Kansas City [Missouri] Area Transportation Authority and Pinellas Suncoast Transit Agency) transit agency’s experiences partnering with TNCs to offer on-demand mobility sheds light on how to best approach partnerships in this climate, thereby providing a critical piece of knowledge for both researchers and transit operators ( 7 ). In this study, Westervelt et al. argue that the “crux to developing an effective relationship with a TNC is recognizing that they are technology and marketing companies, not transportation companies,” and as such, partnerships should leverage each other’s skills to confer the maximum benefit to the public—that is, transit operators can prioritize the Americans with Disabilities Act (ADA), Title VI, and labor unions during pilot development, work with the Federal Transit Administration (FTA) in ensuring the pilot falls within the regulatory framework, and maximize the existing transit network capabilities while the TNC capitalizes on its technological and marketing expertise.
Meanwhile, the FTA is aware of both the potential for autonomous technology to strengthen transit and the legal uncertainties within the existing regulations. In December 2017, the FTA revealed a 5-year Strategic Transit Automation Research roadmap that supports research, demonstrations, and partnerships in the goal of realizing automated transit research to commercial deployment ( 8 ).
With a prioritization and effective green light from the FTA in both technologies, a review of transit agency perceptions is needed. This research is a review of the current perceptions and readiness of transit agencies to plan and leverage new technologies. The results will also help to identify whether the current state of practice aligns with SUMC recommendations by surveying a larger range of transit agencies ( 9 ).
This paper is organized as follows: a presentation of survey administration procedures and description of responding agency characteristics; a discussion of the responses to questions about shared mobility and TNCs; a discussion of the responses to questions related to autonomous transit (AT) systems; and a summary of this study with a conclusion of major findings.
Survey Administration and Respondent Characteristics
Survey Administration
Email invitations to the online survey were sent to over 100 transit agencies drawn from the National Transit Database (NTD) ( 10 ). Contact information of appropriate persons within the different agencies were obtained from the respective agency web pages and with assistance provided by Jacksonville Transportation Authority, the sponsoring agency for this study. Although the NTD lists over 540 transit agencies, emphasis was placed on reaching out to those that ranked higher in relation to the volume of unlinked passenger trips (i.e., greater ridership) as these are more likely to be concerned about TNCs and AT systems. The survey remained open from December 2017 to July 2018. After email reminders and follow-up phone calls, a total of 50 completed responses were obtained. Figure 1 below projects the locations of the responding transit agencies onto a Google Maps sublayer.
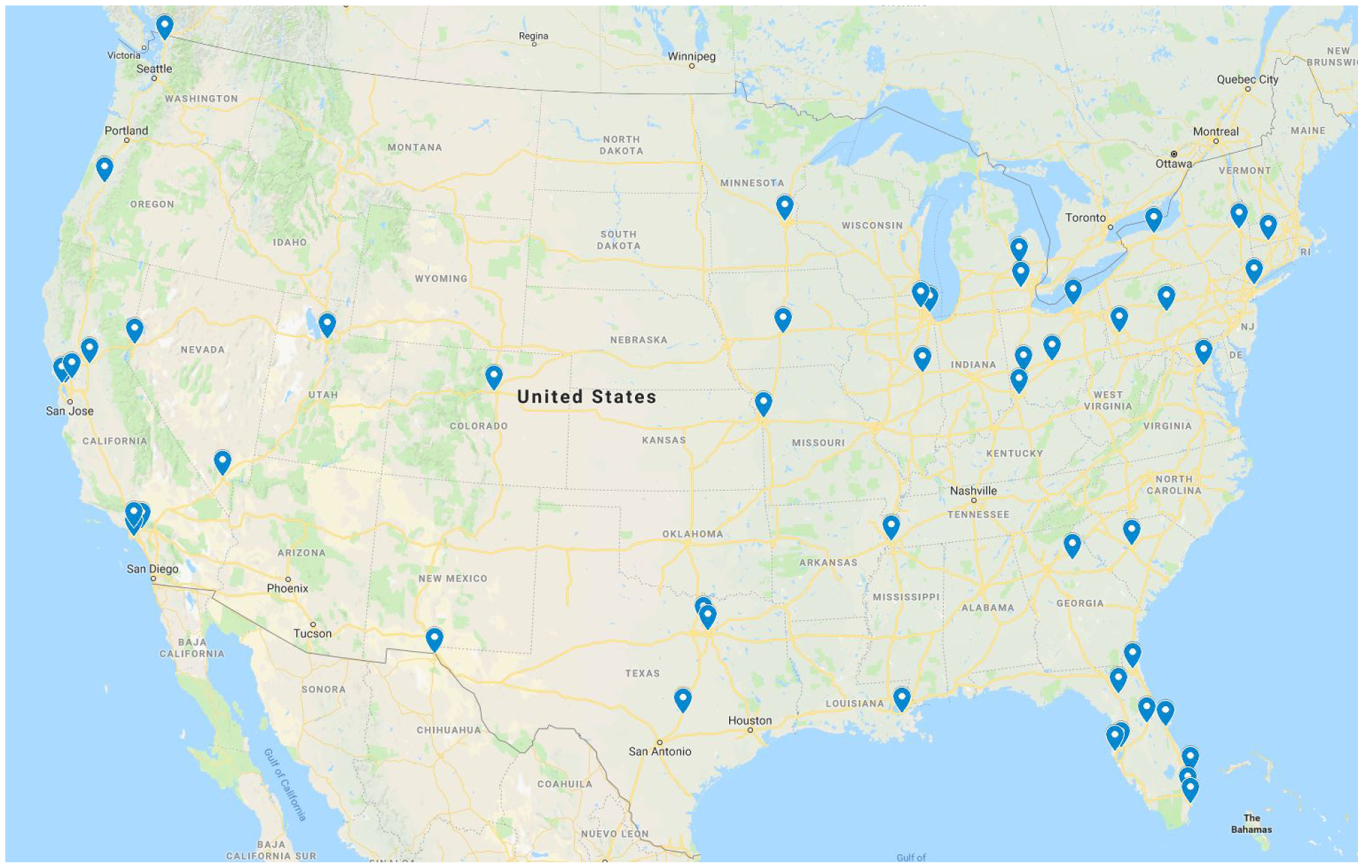
Locations of responding agency (n = 50).
The responses were often made by a willing employee at the transit authority who could be reached and personally felt qualified to respond to the survey on behalf of the agency. Some agencies reported to the team that they had internal deliberations about who would be most qualified to answer the survey given staff time resources and expertise. In some instances, a few different people from the agency provided the responses with each focusing on a different part of the survey (for example, one person answered questions about shared mobility and another answered questions about AT). Respondents were overwhelmingly in upper management positions: 10 are chief officers, 11 are directors, 12 are managers, three are vice presidents, and five are either a principal or senior in their field.
Respondent Characteristics
Before analyzing the survey responses, it would be useful to examine how the responding agencies compare with transit agencies in general in the USA in relation to their service/operational characteristics and overall size of the population served. The NTD database records several such measures. Figure 2 captures the ranking of the responding agencies (n = 50), shown by blue dots, as measured by six variables out of the list of all complete, full reporting NTD agencies (n = 543).
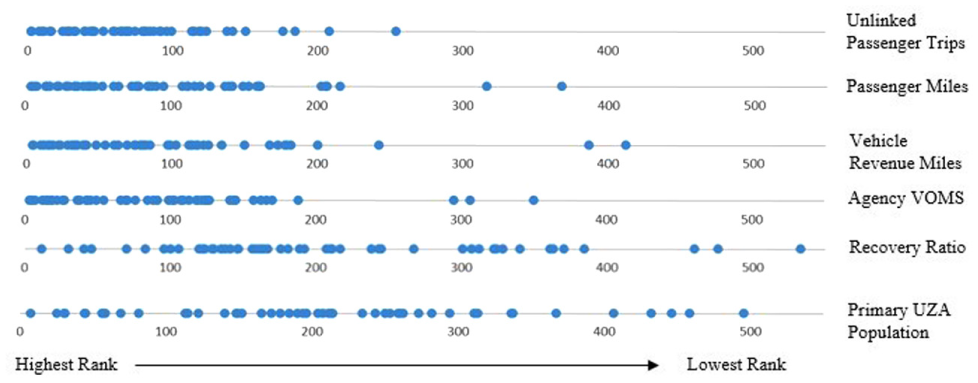
Spread of transit agency rank by variable in 2015 NTD reports (n = 50).
Of the 50 responding agencies, 38 (around 76%) are ranked in the top 100 agencies by ridership (i.e., unlinked passenger trips, defined in the NTD glossary as the total count of passengers boarding transit vehicles). The lowest ranking responding agency is ranked 254, reflecting the general intent of this survey to reach out to agencies with larger ridership. Most of the responding agencies were also ranked high in relation to other service measures such as (1) passenger miles (i.e., the cumulative distance ridden by all passengers during the fiscal year), (2) vehicle revenue miles (i.e., the miles that transit vehicles travel while in revenue service), and (3) agency vehicles operated in maximum service (or VOMS, the number of vehicles needed to meet the maximum service load, excluding atypical days, special events, or both). The Recovery Ratio (“the proportion of operating expenses that are paid for by fare revenues”) shows a greater spread in the ranking of agencies responding to the survey. Lastly, the populations served (i.e., primary UZA population, “the population of the urbanized area primarily served by the agency”) also shows a greater spread in the rankings ( 10 ). This is reasonable, as transit agencies with high ridership can be in large urban areas or smaller urban areas such as college towns.
The responding agencies were classified into “Large,”“Medium,” and “Small” sizes based on their rankings on variables that determine service characteristics. As the different characteristics (unlinked passenger trips, passenger miles, revenue miles, and VOMS) are fairly strongly correlated, the classifications were generally similar irrespective of measure used. Table 1 presents a descriptive summary of NTD variables for these “Large” (top one-third), “Medium” (middle third), and “Small” (bottom third) agencies and compares them with the same for the entire NTD.
Summary Statistics for Responding Transit Agencies Compared to Full Reporting NTD Agencies
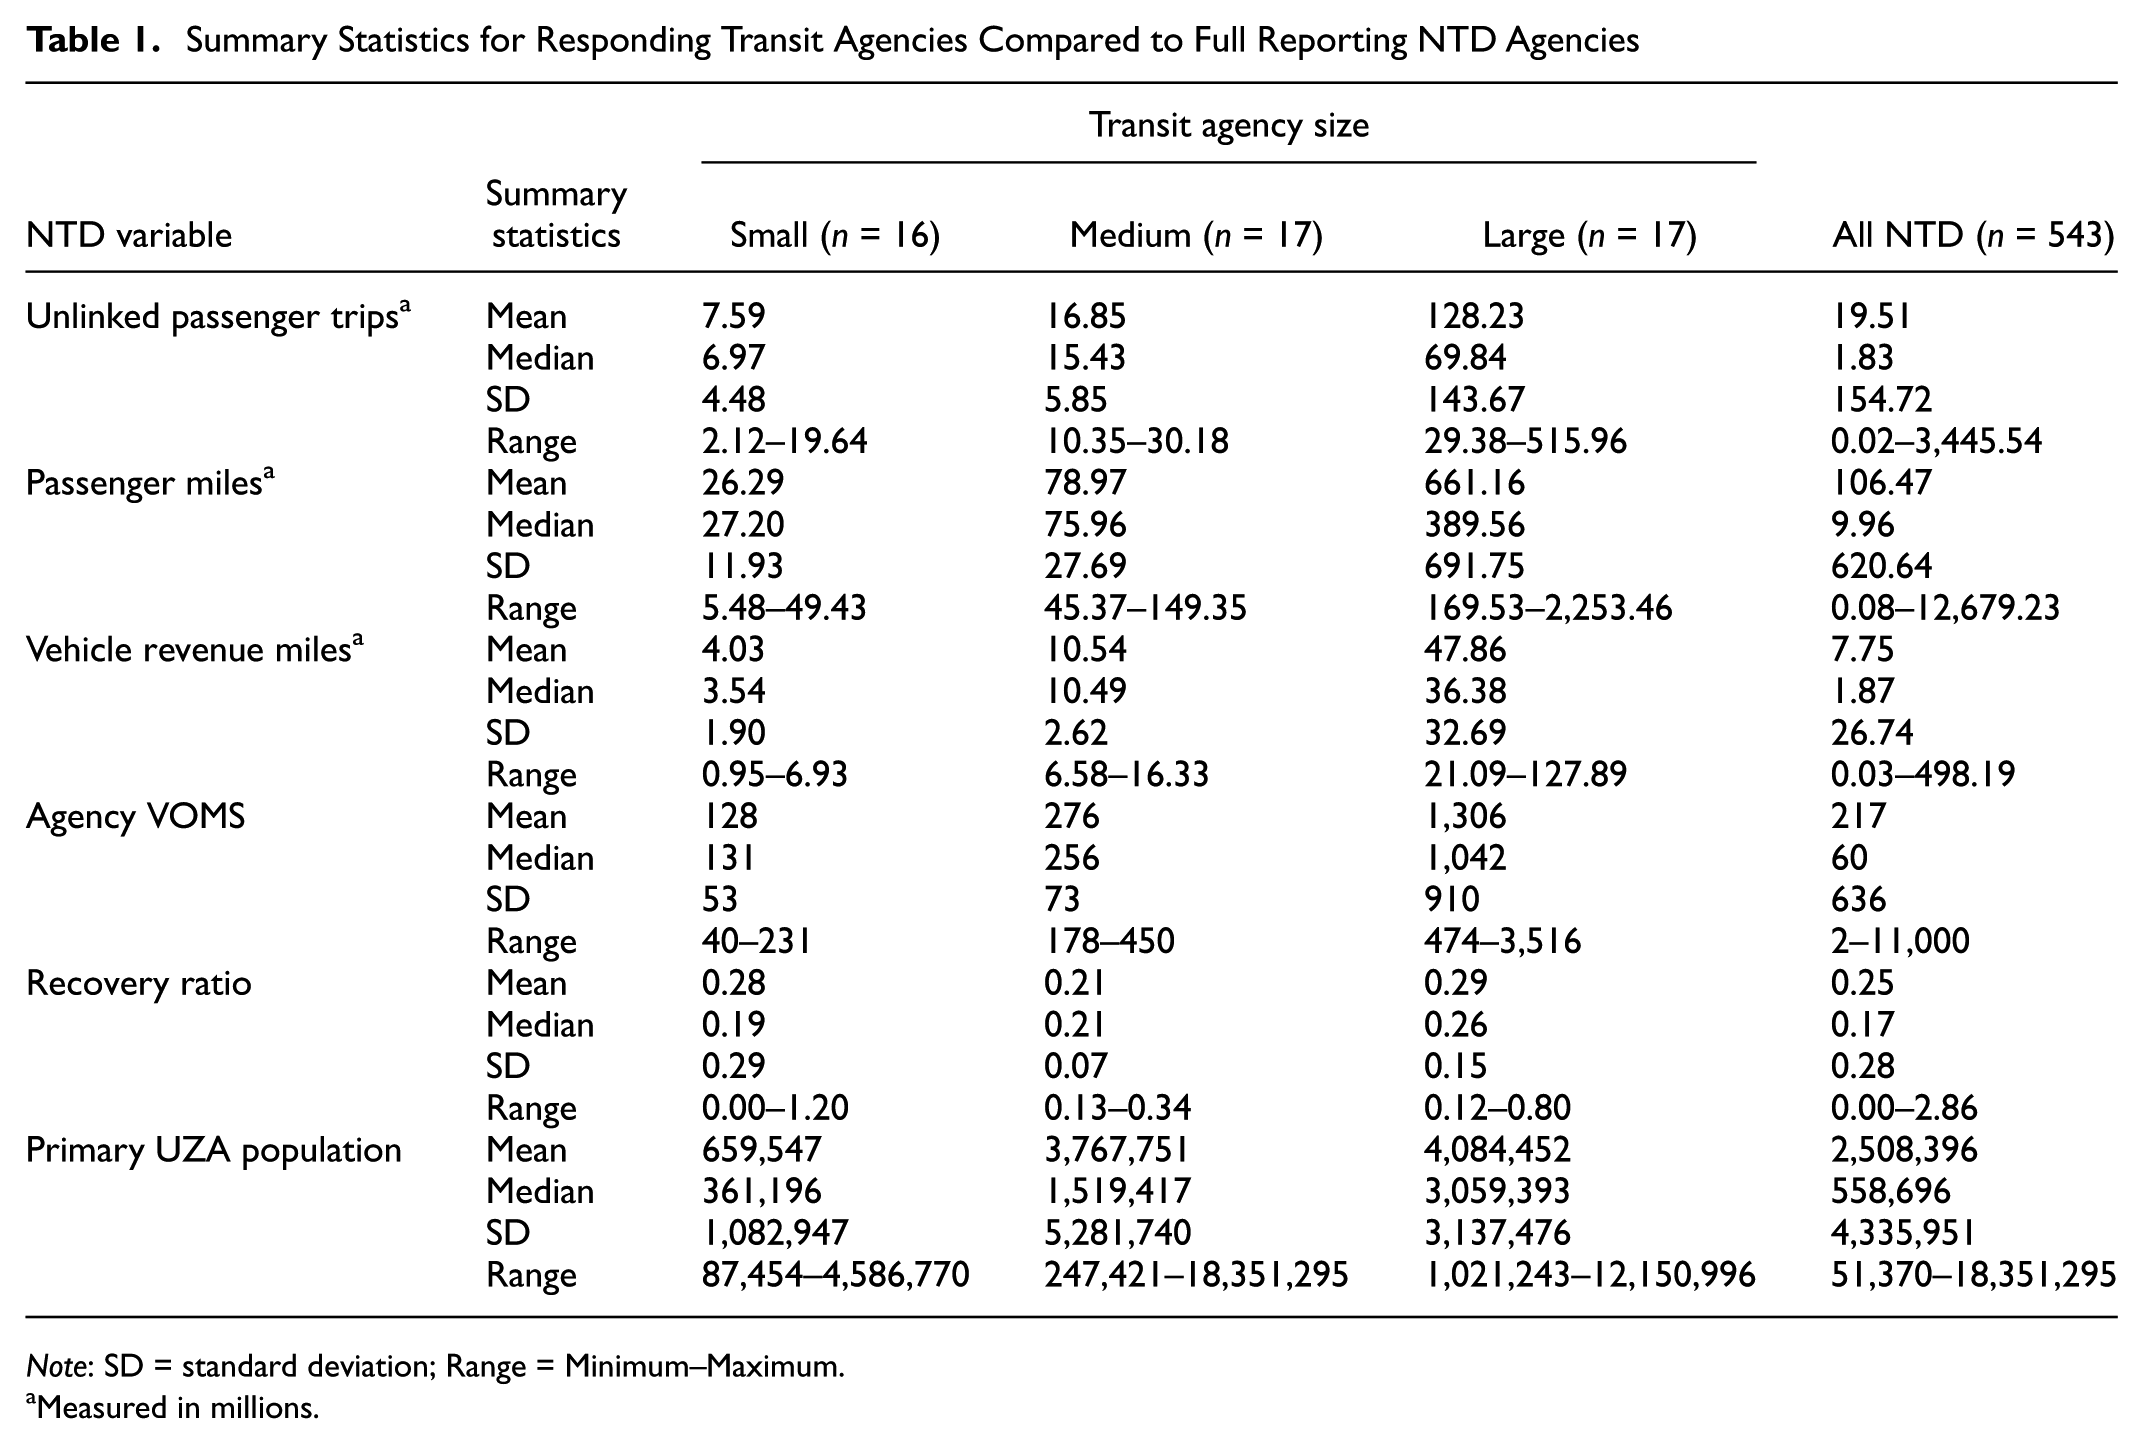
Note: SD = standard deviation; Range = Minimum–Maximum.
Measured in millions.
It is useful to note that other ways of classifying the transit agencies (for example, based on size of the urban area served) were also explored. However, the correlation patterns between the survey responses and agency size (discussed in the next two sections) were largely similar to the correlation patterns between the survey responses and urban area size. Therefore the team chose to present stratifications based on transit agency
At the beginning of the survey, the transit agencies were asked to describe their typical user group(s) in relation to age, educational attainment, income (agencies were allowed to select multiple responses), and smartphone ownership. These are summarized in Figure 3. A typical transit rider is likely to be middle-aged, a high school graduate, low-to-mid income, and a smartphone owner/user. The trends are predominantly the same irrespective of the size of transit agency.
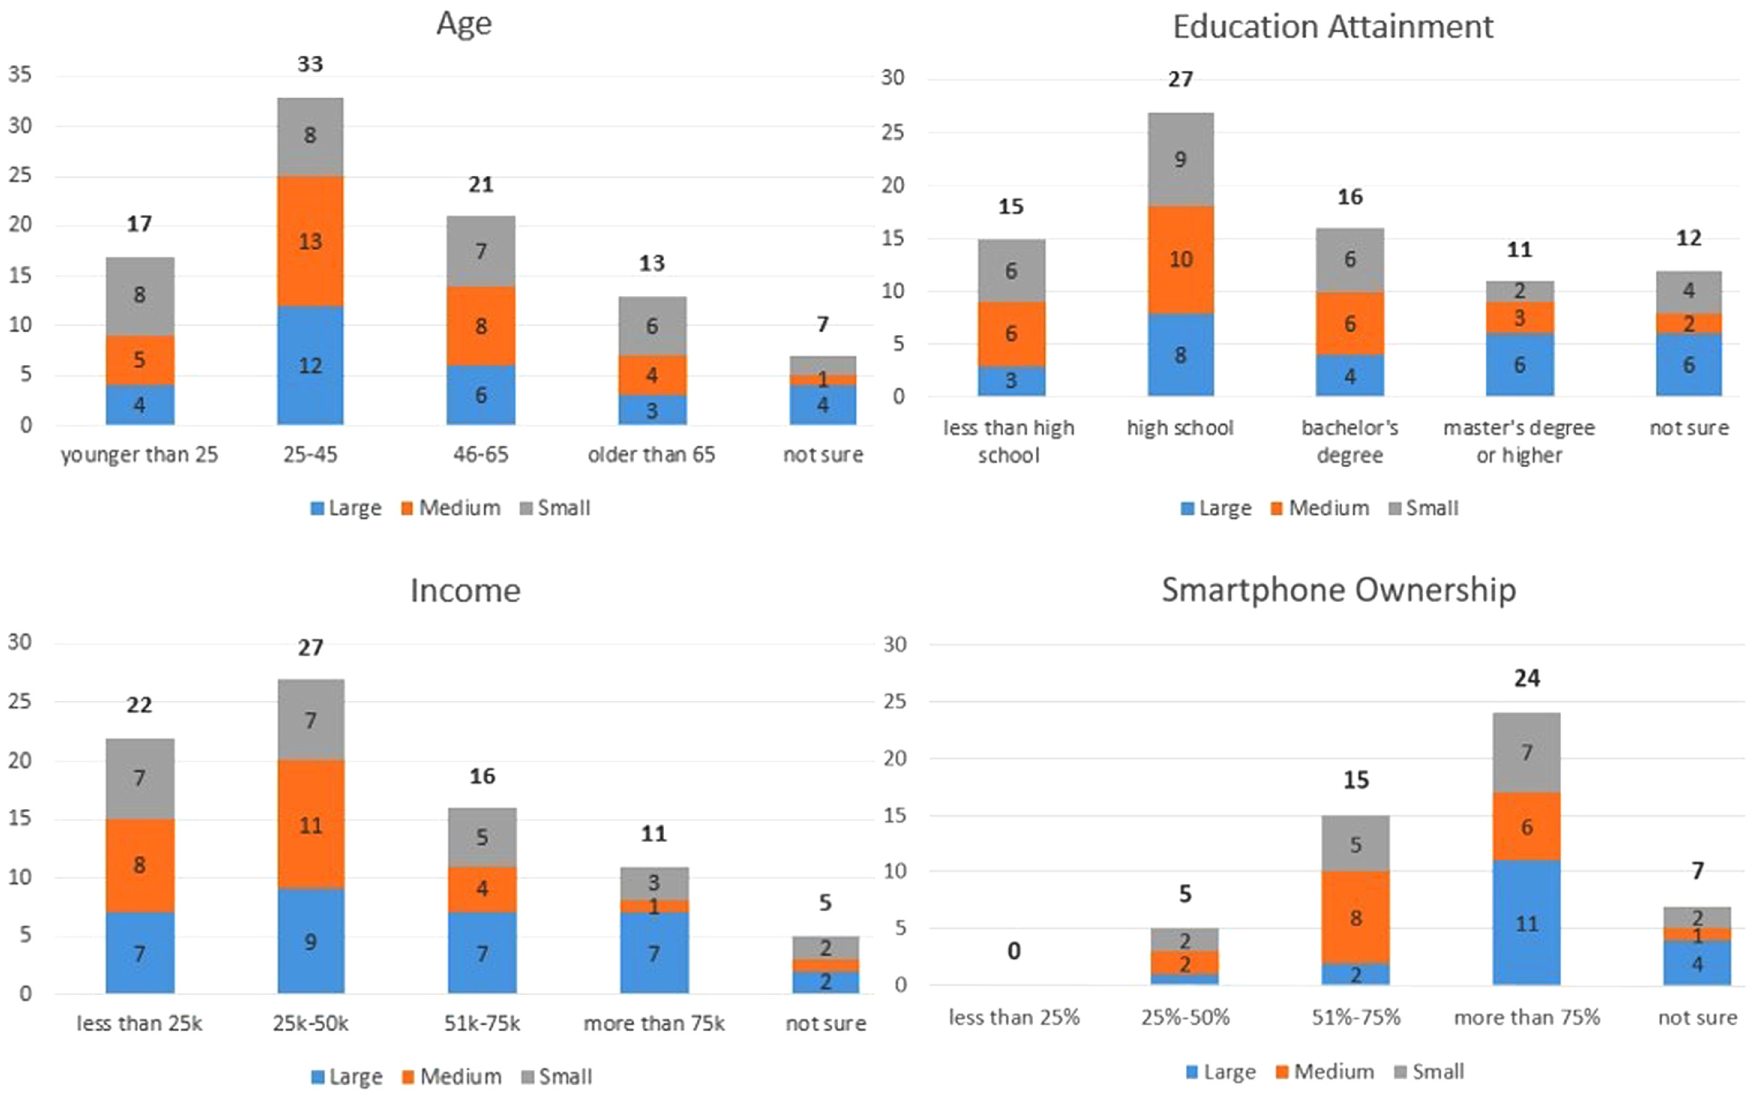
Count of transit agency’s typical user group(s).
Survey Results: Shared Mobility and TNCs
The survey included a total of 22 questions about shared mobility, TNCs, and transit systems. The responses to these questions are discussed in this section organized into six sub-sections: (1) stakeholder opinions, (2) regulatory differences, (3) pursuing partnerships with TNCs, (4) TNC impacts on transit agencies, (5) projections and preparedness, and (6) key findings.
Stakeholder Opinions
The survey examined the opinions and actions of various stakeholders such as the governing board, the public, the transit union, and the drivers.
Roughly one-third of transit agencies have been directed by their governing boards to work with TNCs, whereas two-thirds were not (a third option of “not sure” was also given but this was generally not chosen). As a follow-up question, the transit agencies were asked whether they have received public pressure (e.g., from newspaper articles, citizen groups, and transit riders) to work with TNCs; 13% of small agencies, 29% of medium-sized agencies, and 41% of large agencies indicated that they have received such pressure.
A vast majority (over 86% overall) of agencies reported that they were unaware if their transit union is in support of TNCs, suggesting that there is either little communication between the transit agency and the transit union or this topic has not thoroughly been addressed and expressed by the union. It is also interesting to note that the rest of the agencies said “no” and, thus, none of the agencies report that their unions are actually in favor of TNCs. This sentiment is shared regardless of agency size.
Paratransit services have often been seen as a low-hanging fruit that shared mobility providers can address ( 1 ). Transit agencies were asked whether their transit union has asked the agency to implement more on-demand paratransit services and a majority (62%) stated they had not. Researchers again note that about one-third (34%) of agency respondents are unsure.
Respondents were split on whether they thought transit drivers were aware of or concerned about the impact of TNCs—46% are unsure and 36% say the drivers do know or are not concerned about the impacts of TNCs (see Figure 4a). Almost two-thirds of respondents were unsure if their drivers worked for a TNC. Small transit agencies were more likely to give a definitive answer (63% of respondents say “yes” or “no”) while medium and large agencies were likely to be unsure roughly three-quarters of respondents say “not sure”) (see Figure 4b).
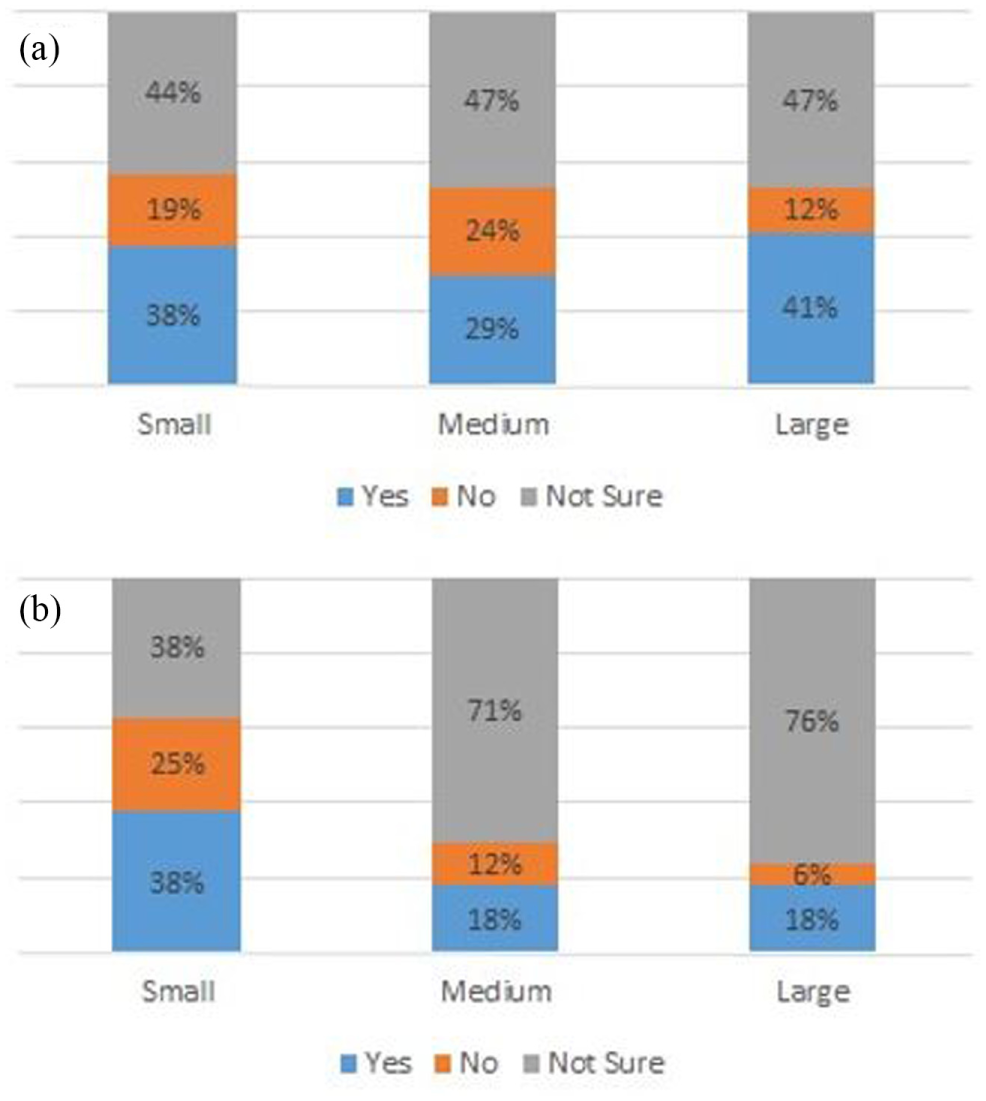
(a) Percent of agencies who believe drivers are aware or concerned about TNC impacts and (b) Percent of agencies who believe drivers work for a TNC.
Regulatory Differences
It is believed that the general public is unaware of the regulatory differences between TNCs and transit agencies. The survey confirmed this belief—66% of transit agencies say the public is not aware of these differences and only 18% say the public is aware. Further, the larger the agency the more likely they are to not know the general public’s awareness of TNC impacts.
Nearly 4 in 10 transit agencies believe TNCs should adhere to the same regulations as transit agencies, whereas around one-third say they are unsure (Figure 5a). Generally, the larger the transit agency the more likely they are to suggest TNCs ought to adhere to the same regulations; the smaller the agency, the more likely they are to not want TNCs to adhere to the same regulations as transit agencies.
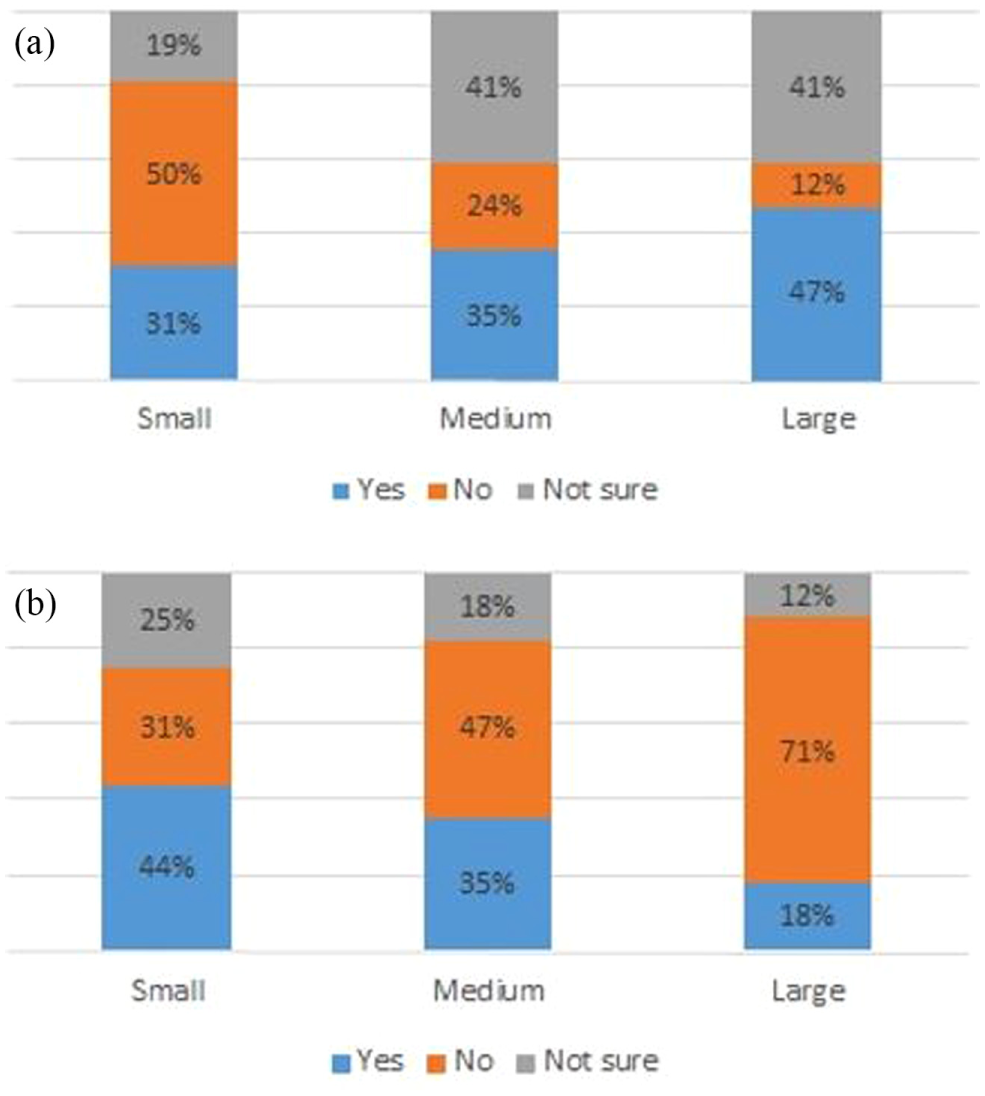
(a) Percent of transit agencies that believe TNCs should adhere to the same regulations as themselves and (b) Percent of transit agencies that believe they have a role in ensuring TNCs are equitable and safe.
Although many agencies claimed that regulations should apply uniformly for all transport mode regardless if it is a bus, or taxi, or Uber/Lyft, about one-half of the agencies did not think they need to be particularly involved in ensuring TNCs are equitable and safe. It could happen on the state or federal level, and may not be the major role for agencies directly involved except those who have a strong partnering relationship with TNCs. Figure 5b shows that larger agencies are more likely to say they should not/need not play a role in ensuring TNCs are safe and equitable even though they are also generally more likely to believe that TNCs should have the same regulations as themselves. Of all respondents, only seven agencies believed TNCs should have the same regulations as transit agencies and that the agency itself should play a role in ensuring TNCs are safe and equitable.
Pursuing Partnerships with TNCs
Although most transit agencies have not been directed by their boards or pressured by the public to work with TNCs, 50% of small agencies and 71% of medium and large agencies have held meetings with TNCs to identify partnership strategies.
Most transit agencies have met with Uber or Lyft, but some micro transit companies like Chariot and via were also mentioned. The most frequently cited services transit agencies hoped the partnerships would yield were first/last mile, paratransit, and emergency ride home or late night services (10, five, and three mentions respectively). Other partnership strategies include mobile app integration, co-marketing, and replacing inefficient fixed routes with on-demand services, and serving certain populations (e.g., university students or healthcare employees). Interestingly, one agency mentioned that TNCs could be leveraged to serve non-transit-dependent riders, indicating a potential for TNCs to attract new riders.
As mentioned by Westervelt et al. ( 7 ), TNCs collect comprehensive detailed travel data but are not willing to share their data as expected (for many reasons, such as personal information security, fare competition, management, etc.). In this survey 34% of agencies reported currently receiving data, anticipating data, or are negotiating (to be determined). The remaining agencies reported ongoing contract discussions.
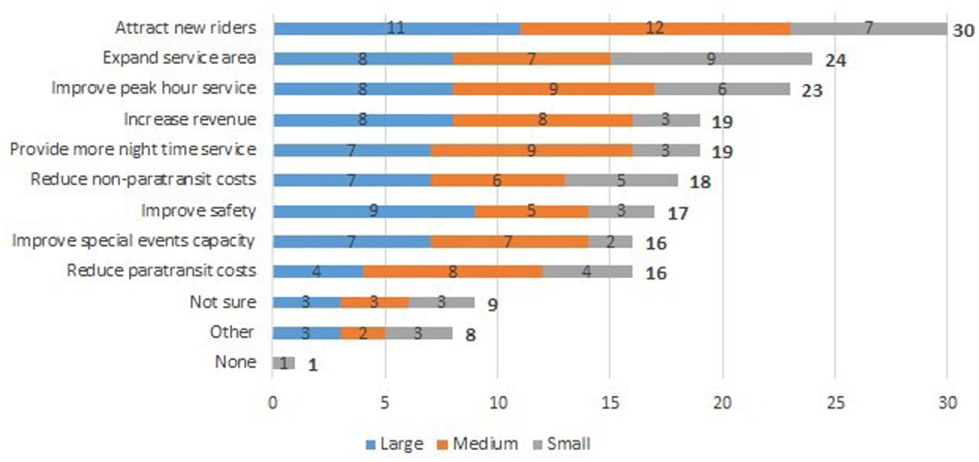
Six major benefits for transit agencies from working with TNCs were identified: expanding service area, attracting new riders, providing more night-time services, reduced paratransit and non-paratransit costs, and improved special event capacity (Figure 6). Transit agencies who provided “other” responses stated improved general capacity, expanded service outside of transit operational hours, first/last mile connections, and better customer experiences.
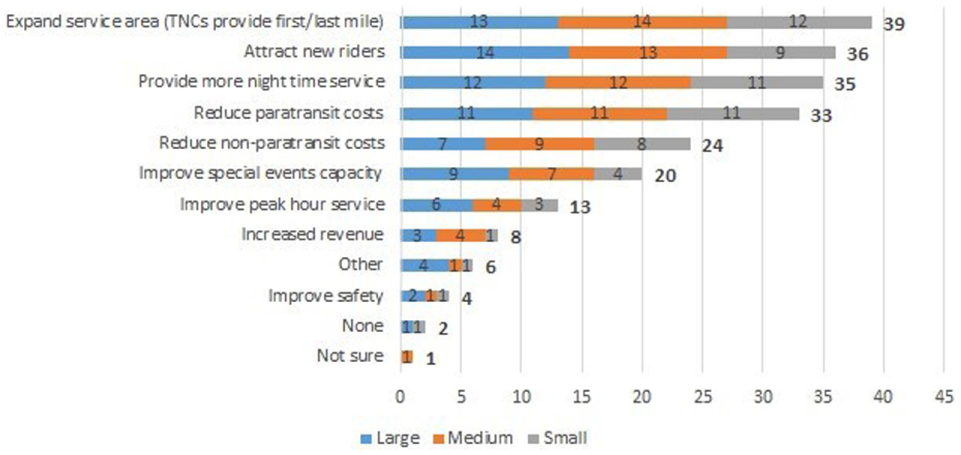
Count of transit agency benefits from working with TNCs.
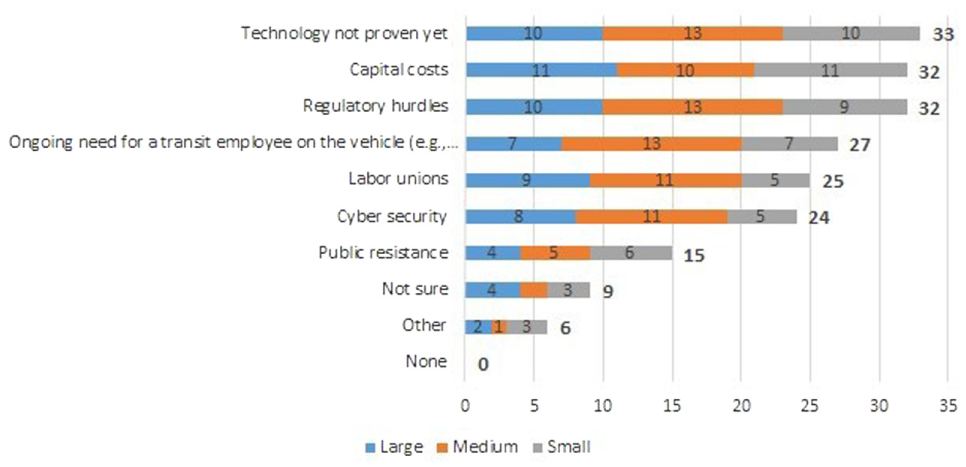
Four major barriers to incorporating TNCs into public transit were identified: data sharing (just 42% receive aggregate data under existing contracts), national and state regulatory differences, and limited staff time or resources of agencies (Figure 7). Other barriers listed by transit agencies were: TNCs do not have wheelchair-accessible vehicles, delineation between responsibilities, and data and technology compatibility. In general, the perceptions about the key benefits and barriers do not appear to vary across agency size.
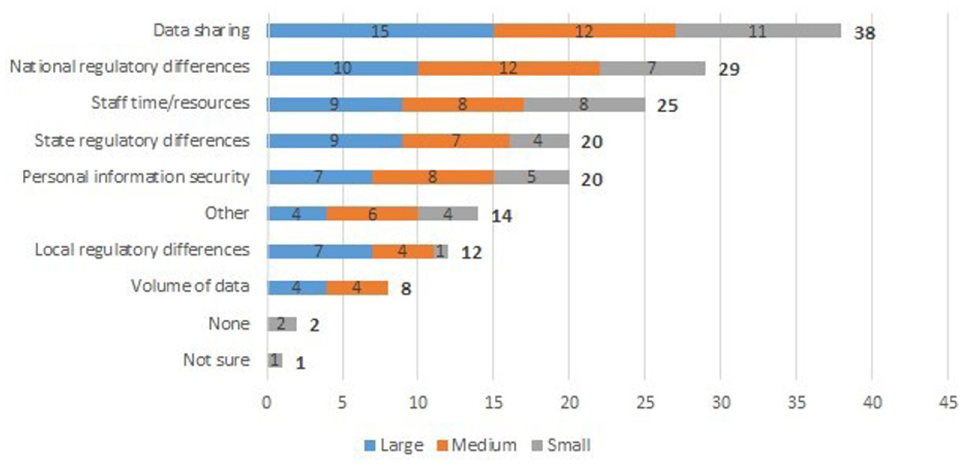
Count of barriers to incorporating TNCs into public transit.
TNC Impacts on Transit Agency Services
TNCs have greatly influenced transit agencies to adopt (or consider adopting) new technology/software services—72% agree to this statement, whereas just 24% disagree. Further, the larger the agency the more likely TNCs have already influenced the agency to adopt or consider adopting new technology or software services (88% for large to 50% for small). For example, a medium-sized agency who mentioned “data and technological compatibility” as a barrier to incorporating TNCs into transit planning and operations and a large agency who noticed a “drop of a million riders” coinciding with the rise of TNCs say they are considering adopting new technology because of this new shared mobility mode. It would seem that the new technology would allow the transit agency to achieve agency goals like partnering with TNCs or retaining and/or attracting riders.
In regards to operational conflict between agencies and TNCs, the most cited answer from the respondents was “none.” However, for large transit agencies, conflict has occurred near or at bus stops partly caused by the TNC picking up or dropping off riders. For cities with regular transit and heavy TNC market share, curbside traffic and management is a rising issue and planners must decide how to regulate curbside lanes through dedicated bus lanes, dedicated parking spaces, or even dedicated ride-hailing loading zones via geo-fencing. Adopting rules and regulations corresponding to ride-hailing services is a good way to manage the traffic. Agencies who provided “other” answers reiterated misuses of bus facilities (e.g., bus terminals/ turnarounds, blocking of bus lanes for pickups/drop-offs) and the need for TNC providers to ensure equal access and capacity for disabled patrons with new partnerships.
Transit agency’s three most competitive advantages over TNCs were identified: stable prices, can be used without cell phones or credit cards, and lower user cost. These all contribute to the transit equity and make it accessible for more people, especially disadvantaged populations (e.g., low-income or under/unbanked). Figure 8 displays the multi-response counts associated with this question on transit agency competitive advantages over TNCs by transit agency size. The “other” responses include familiarity, mass transit environmental benefits during peak hours, and access to existing resources—paratransit operators and funding as a regulated transit agency.
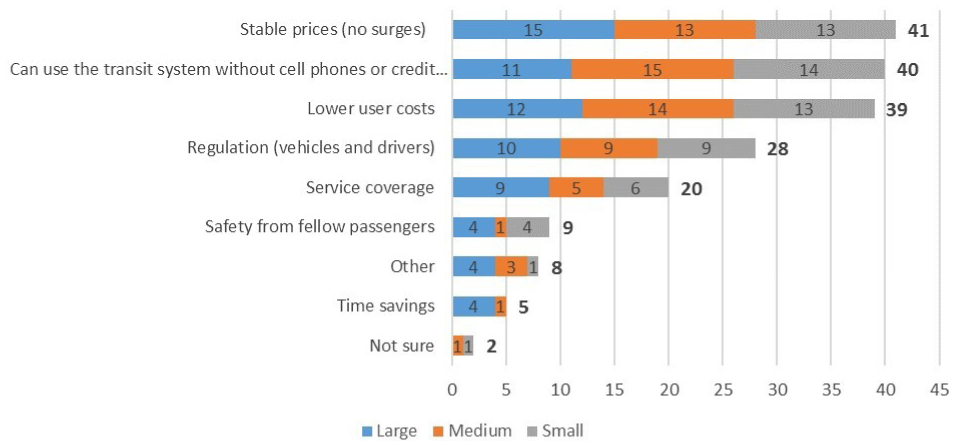
Count of transit agency’s competitive advantages over TNCs.
The three most frequently cited competitive advantages of TNCs over transit agencies were: door-to-door service, travel time savings, comfort/no crowd. Although travel time savings may not always hold true, especially during congested peak hours, door-to-door service does to a large extent eliminate first/last mile concerns which exist across transit agency size while offering extra comfort, luxury, or both for individual trips. Figure 9 displays the multi-response counts associated with this question on TNCs’ competitive advantages over transit agency by transit agency size. Here, the “other” responses are more numerous and include on-demand services, overall user experience, optimization of routes, and positive perception.
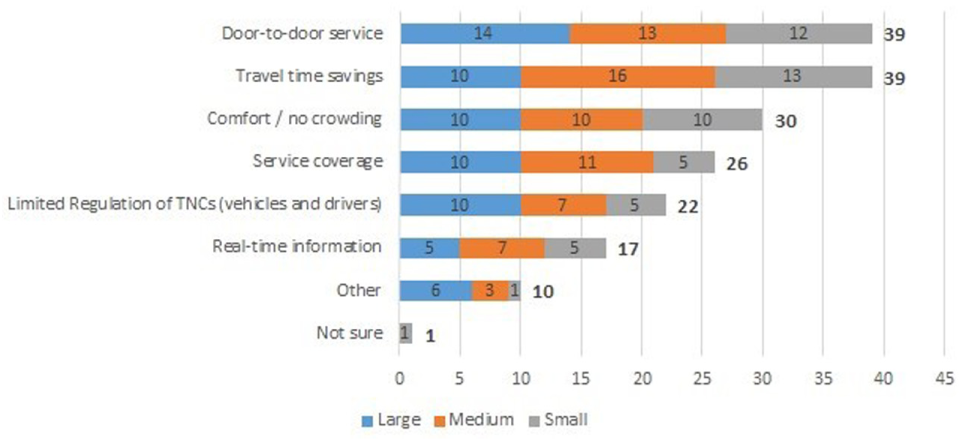
Count of TNCs’ competitive advantages over transit agencies.
The literature documents the potential synergy between transit agencies and shared mobility providers during specific times of the day; for example, TNCs may be used quite frequently for night-time social trips when transit is limited or not an option ( 5 ). The research team asked transit agencies whether TNCs would overall impact their agency ridership broken down into categories and overall revenue. Figure 10 shows that TNCs are believed to mostly have no impact or cause a decrease in transit’s peak hour ridership, off-peak ridership, night-time ridership, and weekend ridership. Total ridership and overall revenue were determined as leaning more toward a decline. Generally, the larger the agency the more likely TNCs are expected to cause a decrease in all but one ridership category and overall revenue—paratransit ridership. Moreover, the smaller agencies are more likely to indicate TNCs have no impact on their ridership. Finally, few agencies report any level of increase in ridership, suggesting that TNCs are perceived more as competitors than complements to existing transit systems.
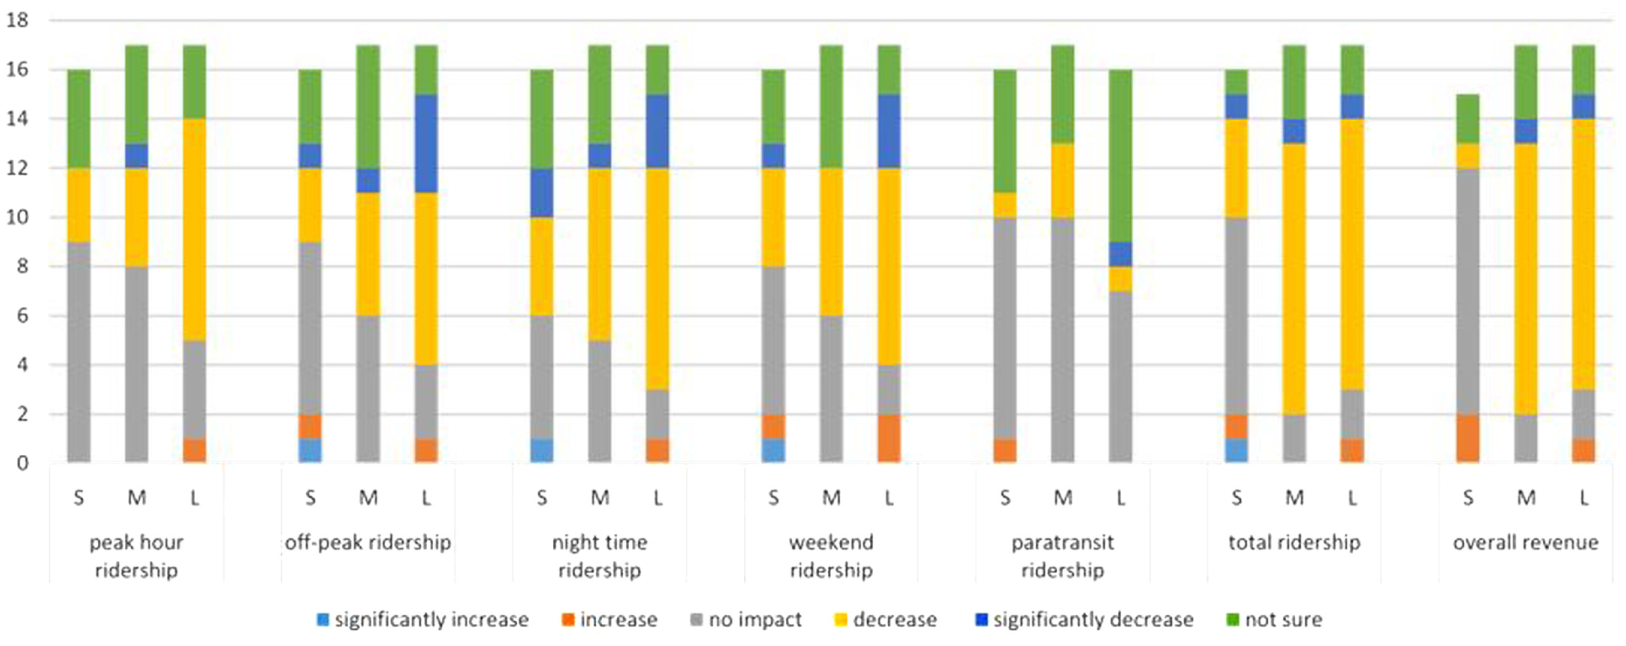
TNCs’ overall impact on transit agency by parameter (S = “Small”, M = “Medium”, L = “Large”).
Agencies were asked how (open-ended format) they quantified the impacts they reported to the previous question. Only one agency conducted a system-wide customer survey revealing that roughly 30% of customers regardless of transit mode have started using more TNC service in place of typical transit commuting patterns. Thirteen agencies have seen declining ridership since the rollout of TNCs, but five admit this decline could be related to other factors. Four agencies have seen declines during night-time, special events (particularly for the return trip), and on limited operational hours. Although a majority of transit agencies believe TNCs will not have any impact on paratransit, one agency believes that it will decrease this service because their existing model provides only a general pickup time range with widely fluctuating wait times for paratransit users. Overall, it appears that the perceived impacts are largely based on professional experience/engineering judgment rather than based on statistical analyses of data.
Projections and Preparedness
Public transit agencies, regardless of agency size, forecast that within the next 5 years TNC market share will experience growth (40% rapid growth and 32% minimal growth). Figure 11 also shows that few agencies believe there will be a decline in TNC market share—all were small to medium-sized agencies.
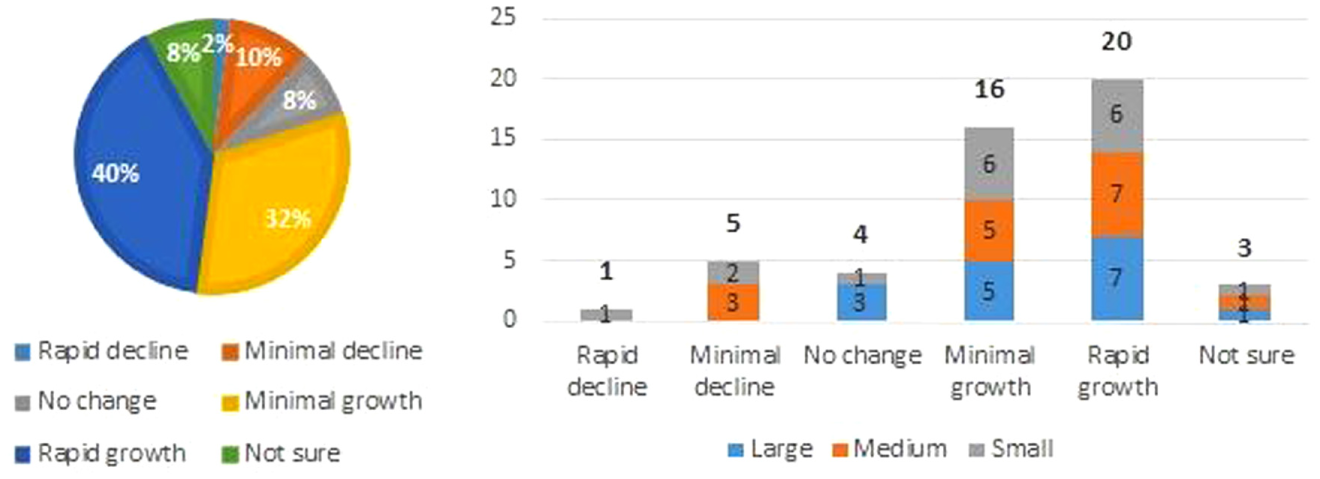
Forecasted TNC market share in 5 years.
Transit agencies are split concerning the net impact of TNCs on transit within the next 5 years. Figure 12a shows that 45% say TNCs will have a net negative impact on transit whereas 35% say they will have a positive impact. Smaller transit agencies are more likely to side with a “positive” impact, whereas medium to large agencies are more likely to side with a “negative” impact, although only marginally (Figure 12b). Recall that the smaller agencies were also more likely to report that TNCs will have “no impact” on their ridership or revenue when compared with medium and large agencies (Figure 10).
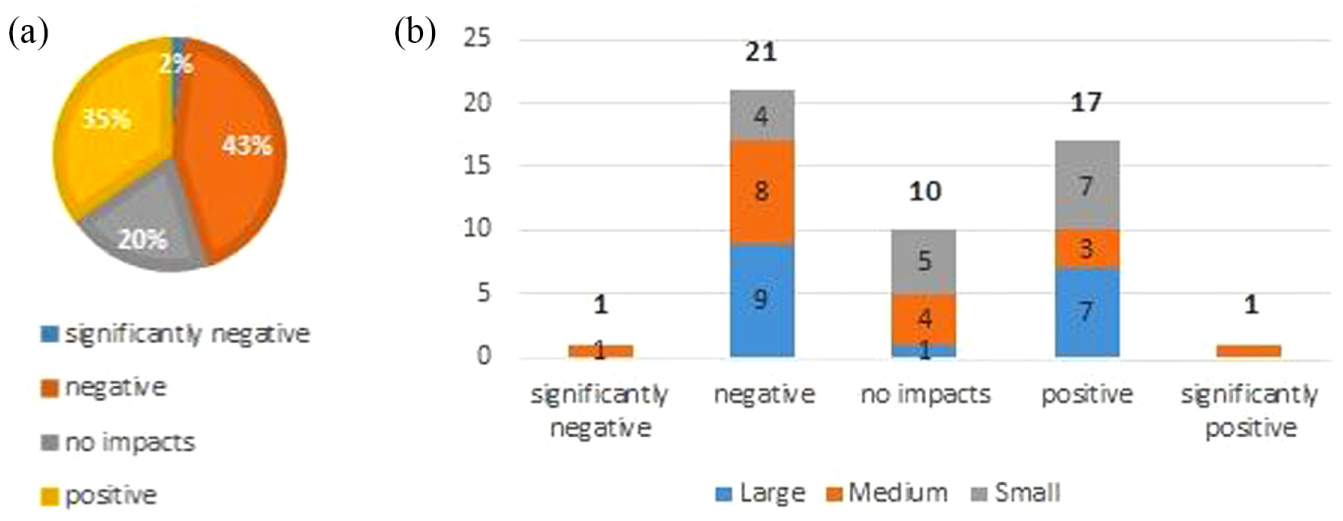
(a) Percent and (b) Count of TNC impact on transit in 5 years.
When asked to describe current strategies the agency has in dealing with TNCs, evaluating new technology and operation strategies, and/or monitoring trends and peer agencies were most commonly cited (Figure 13). Some transit agencies expressed concerns they are ill prepared as TNCs are not contributing tax revenue to public transit, and another mentioned the senior leadership is not properly considering TNC impacts. Additional feedback from two agencies suggests that transit agencies are evaluating how TNC service delivery standards and models best fit within the existing agency and service area.
Count of transit agency strategies in preparing for TNCs.
The SUMC report provides guidance for transit agencies to proactively engage with TNCs based on best practices from those with long-standing agreements with these companies and with innovative forms of shared mobility ( 9 ). The guidance is split into large, midsized, and small urban areas because each market presents unique opportunities and challenges. However, urban area and transit agency size are not always correlated, and some strategies can be applicable for some markets regardless of area size. According to the SUMC, large agencies should continue focusing on efficient transit in the urban core but transition toward a mobility broker/ manager model and using TNCs to provide the most expensive services. Agencies in large urban areas (n = 30, defined by having more than one million residents in the area) are meeting these guidelines:
A majority of agencies believe TNCs could benefit the agency by providing reduced paratransit services (20 out of 30) and night-time services (21 out of 30).
A majority of agencies have met with TNCs or have been directed by the governing board to work with them (22 out of 30) but most have not entered into data-sharing contracts (17 out of 30). However, six are receiving some data and seven are negotiating contracts. Yet one agency lamented that Uber and Lyft are not giving “complete data transparency” and one hopes the discussions result in an agreement aligning with their requirements for data-reporting purposes.
Some have explored an integration of mobility providers into one system. Three agencies stated mobile apps could integrate different providers into one user interface with payment and on-demand options.
The midsized area agencies should work with TNCs to fit within their vision, oftentimes by expanding the service area to fixed transit routes by providing first/last mile connections in partnership with TNCs ( 9 ). The SUMC defines midsized areas as having between 200,000 and one million residents and characterized by sprawling, low-density developments. The governing board of an agency is investing in mobility solutions that would serve many non-transit-dependent populations in these types of developments, thereby attracting new riders and alleviating urban congestion. Of the agencies meeting this criterion, 13 out of 15 believe TNCs could benefit the agency by providing first/last mile connections and five out of 15 believe they could be used for improving special events capacity on transit. One agency is partnering with a local university in providing alternative transportation options to students and staff.
Transit agencies in small urban areas (population between 50,000 and 200,000) are also likely to use TNCs to expand service coverage through first/last mile connections (three out of five).
Key Findings
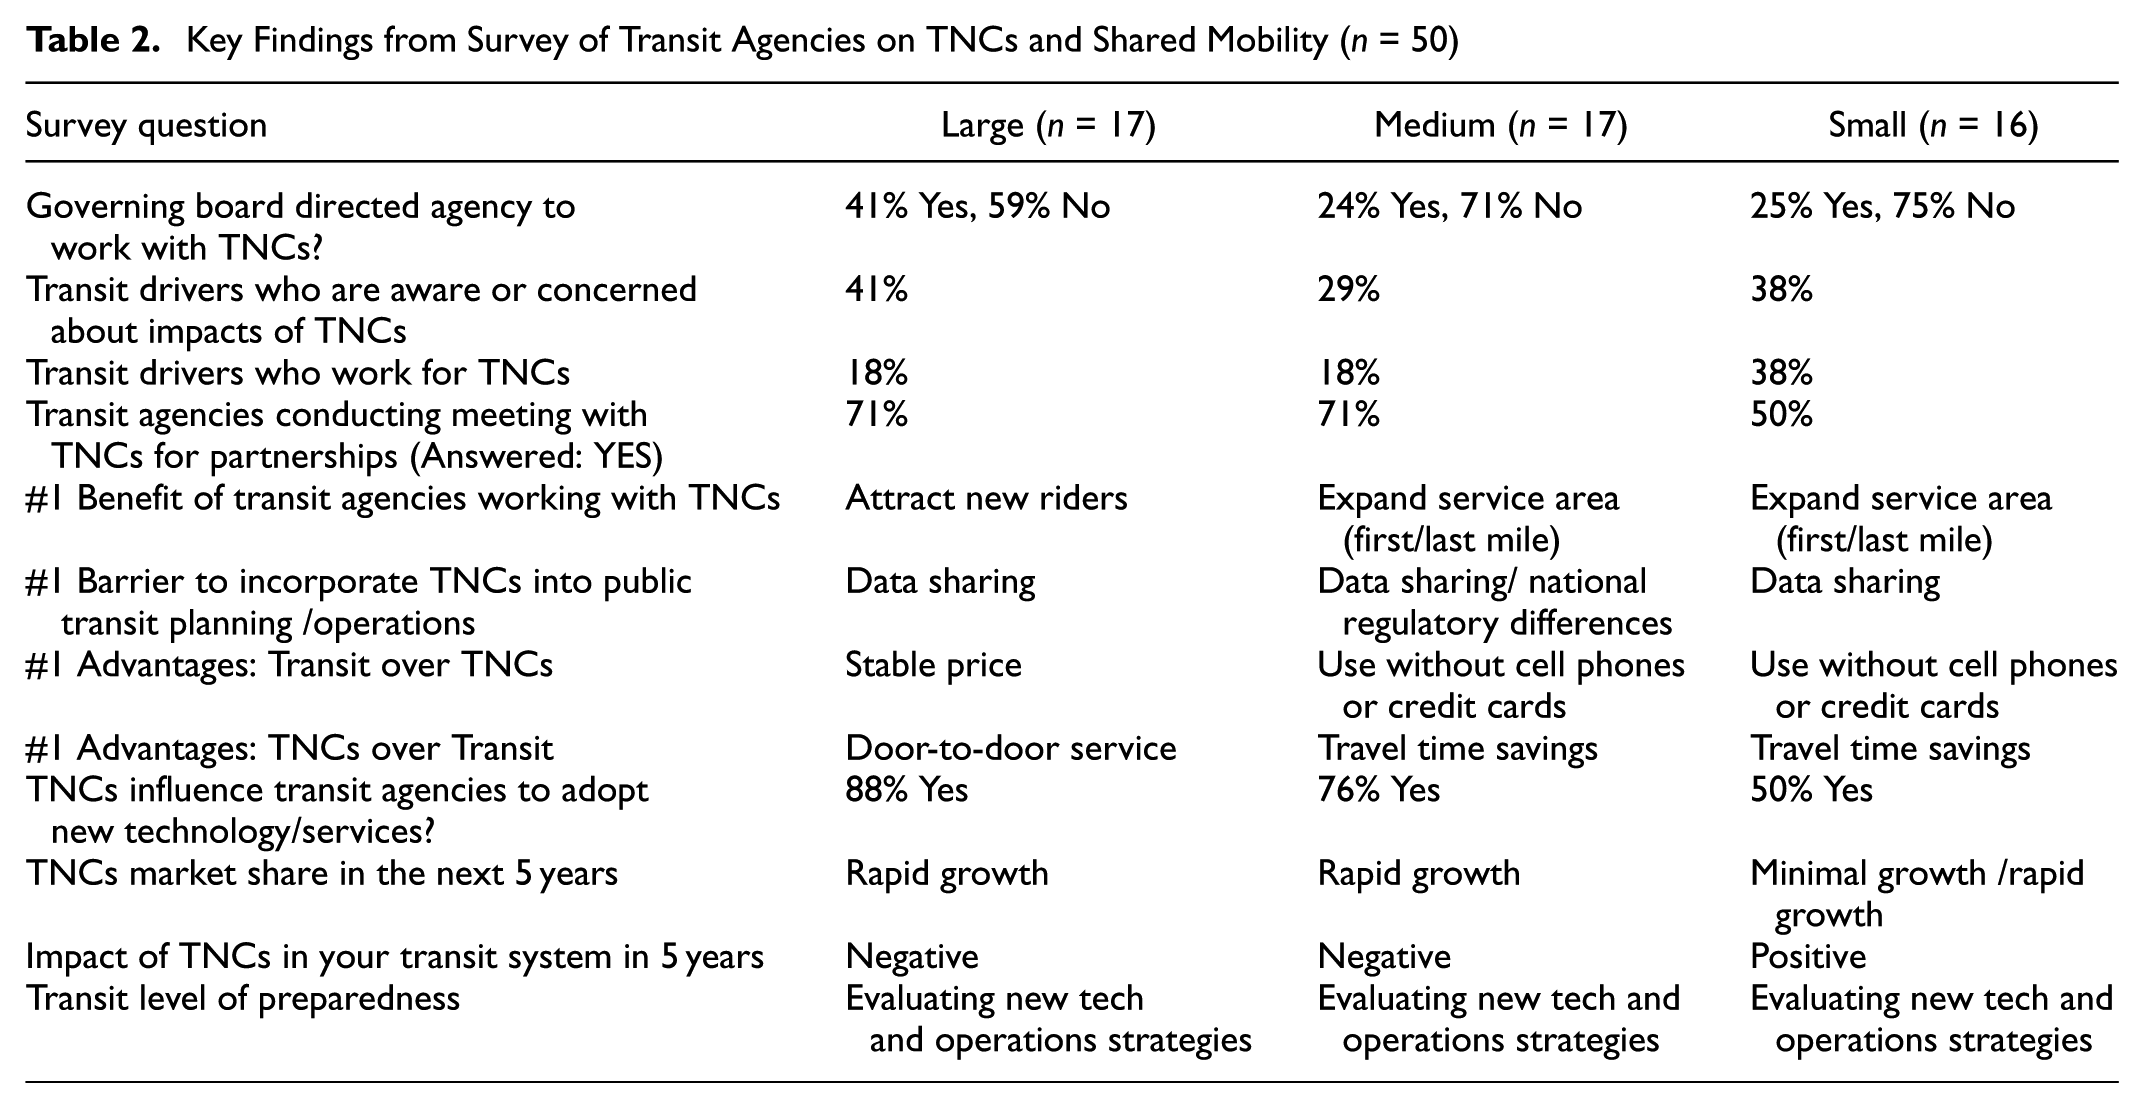
Table 2 captures the key findings for the TNC and shared mobility portion of the survey split by transit agency size.
Key Findings from Survey of Transit Agencies on TNCs and Shared Mobility (n = 50)
Survey Results: Autonomous Transit Systems
The survey included a total of nine questions about impacts of AT systems. The responses to these questions are discussed in this section and organized into four sub-sections: (1) stakeholder opinions, (2) anticipated AT impacts on transit agencies, (3) projections and preparedness, and (4) key findings.
Stakeholder Opinions
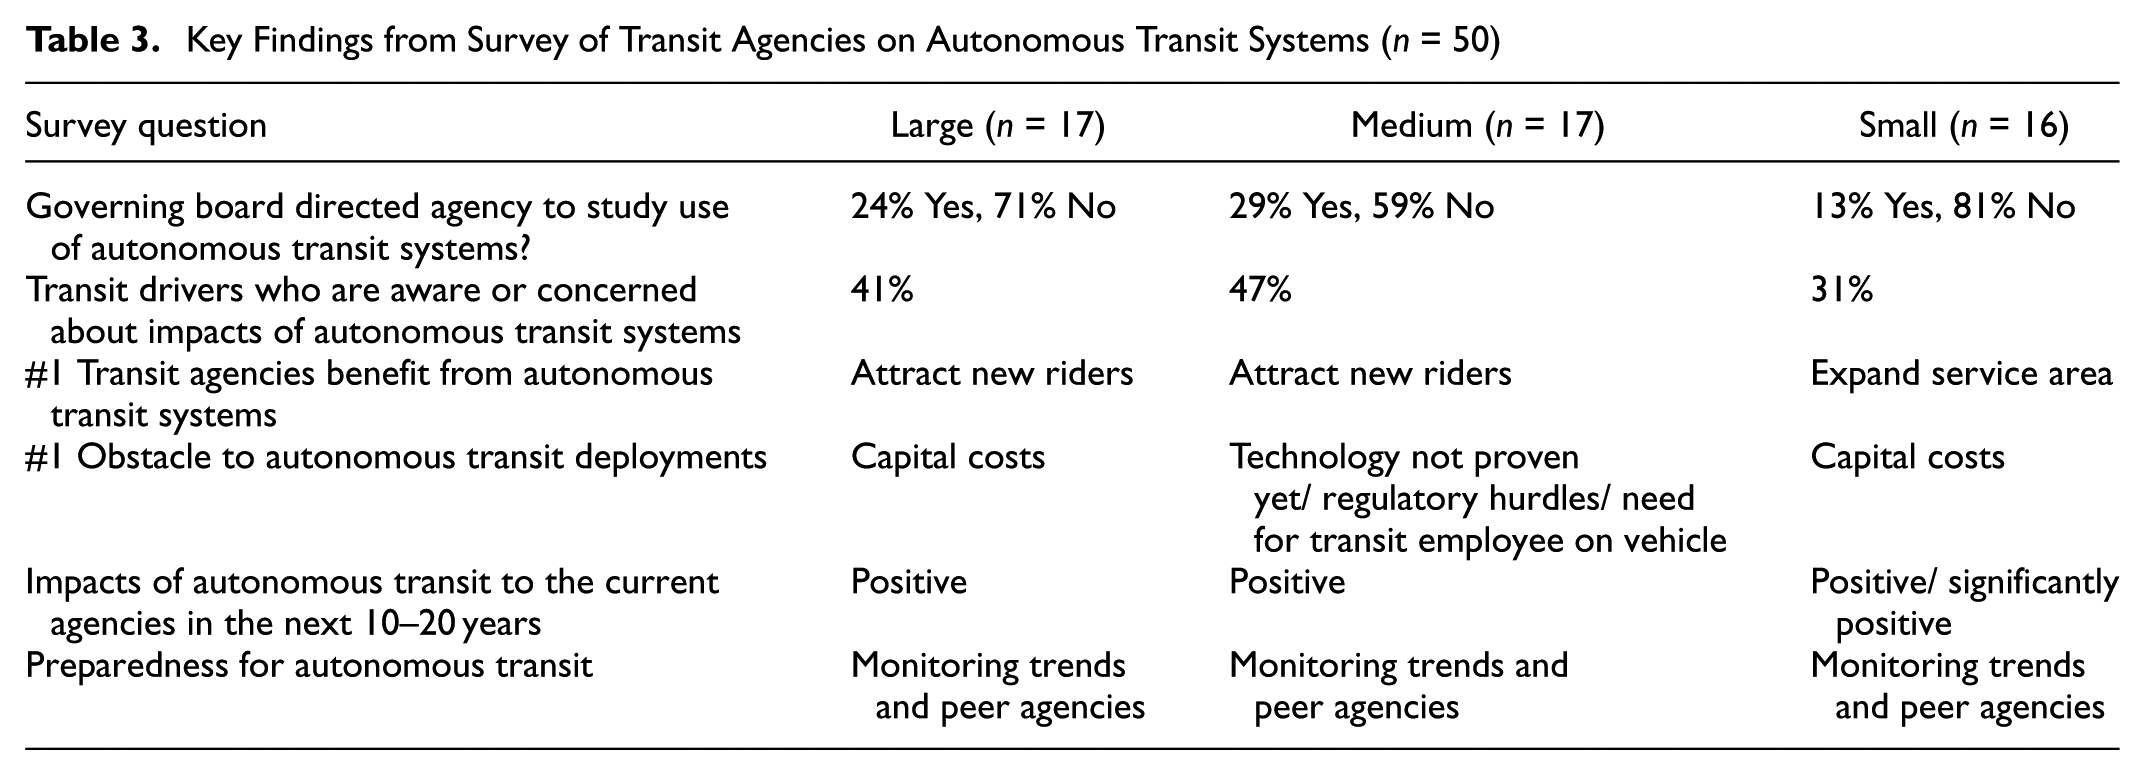
Transit agencies are overwhelmingly not studying the use of AT systems. Seventy percent of the governing boards have not directed the agency to investigate this technology, and just 22% have made this an objective. For small agencies, 81% of transit agency boards have not directed the agency to study the use of AT systems compared with 59% and 71% for medium and large agencies, respectively. Further, 68% of transit agencies have not received public pressure to study the impacts of AT systems. However, large agencies are more likely to have received public pressure (35% to 19% for small systems).
Some 42% percent of agencies are not aware if their drivers have expressed concern or are aware of the impacts of AT systems. However, 40% state their transit agency drivers are aware and concerned about these impacts, further suggesting a communication divide between transit agency administration and drivers (Figure 14a). Forty-six percent of transit agencies are unsure if transit unions have expressed concerns about the potential displacement of employees (Figure 14b). In relation to agency size, 65% of medium-sized transit agencies are unsure compared with 25% and 47% for small and large-sized agencies, respectively
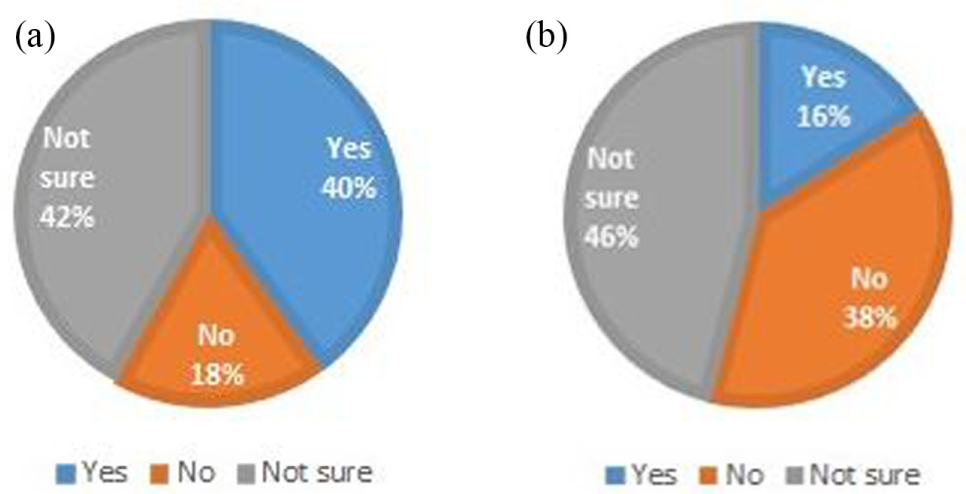
(a) Percent of agencies who believe that transit agency drivers are aware or concerned about impact of AT systems and (b) Percent of agencies who believe that transit unions have expressed concerns about potential issues (displacement of employees) related to AT systems.
Anticipated Autonomous Transit Impacts on Transit Agency Services
The largest benefit of implementing an AT system according to transit agencies is attracting new riders. This is followed by an expanded service area, improved peak hour service, and increased revenue. Only one transit agency did not perceive any benefit (Figure 15). One agency is set to deploy an AT vehicle, another already is testing its AV, and yet another agency in partnership with the host city won a grant to create an AT pilot. Transit agencies also considered other benefits that the research team did not explicitly list, including: reduced operating costs, first/last mile connections, improved environmental quality when instituted on a large-scale basis, and shift of employees from drivers to ambassadors.
Count of transit agency benefits from autonomous transit systems.
However, there are major obstacles to rapid AT deployment. The survey asked respondents to identify obstacles they face in deploying AT and top six categories were identified (Figure 16). As both questions were select-all-that-apply, the difference in counts is significant. The top six obstacles had counts equal to or above 24, whereas only two benefits were within this range, indicating transit agencies feel more comfortable listing obstacles than anticipating benefits. The option for other included low speeds of current shuttles, safety and ADA accessibility concerns, pilot projects have not shown success needed for widespread deployment, and training of former drivers to become a conductor/ambassador/customer service agent.
Count of major obstacles to autonomous transit system deployments.
A majority of agencies have not been spurred on to (consider) adopting new technologies because of the emergence of AT systems (54% say “no” whereas 38% say “yes”). Smaller agencies are more likely than larger agencies to say they have not planned or been pushed to plan to adopt new technology as a result of AT systems (19% versus 53% say they have been pushed).
Of the 11 agencies who were directed to study the use of AT systems, only two agencies reported that after planning for AT vehicles they did not feel pushed to adopt (or consider adopting) new technology or software. Although 35 agencies were not directed to study the use of AT systems by the governing board, nine agencies were pushed to adopt (or consider adopting) new technologies after planning for AT vehicles. A majority of these were larger agencies. Thus, a quarter of agencies may be considering new technologies related to AT vehicles while not having the blessing of studying AT systems by the governing board.
Projections and Preparedness
Figure 17 shows that 64% of transit agencies believe that AT will have at least a positive impact on their transit system over the next one to two decades. The next largest category is 16% with no impacts. The smallest perceptions are 6% percent with a net negative impact and 14% percent with an unsure opinion. Only small transit systems reported beliefs contained within the range of no impacts to significantly positive.
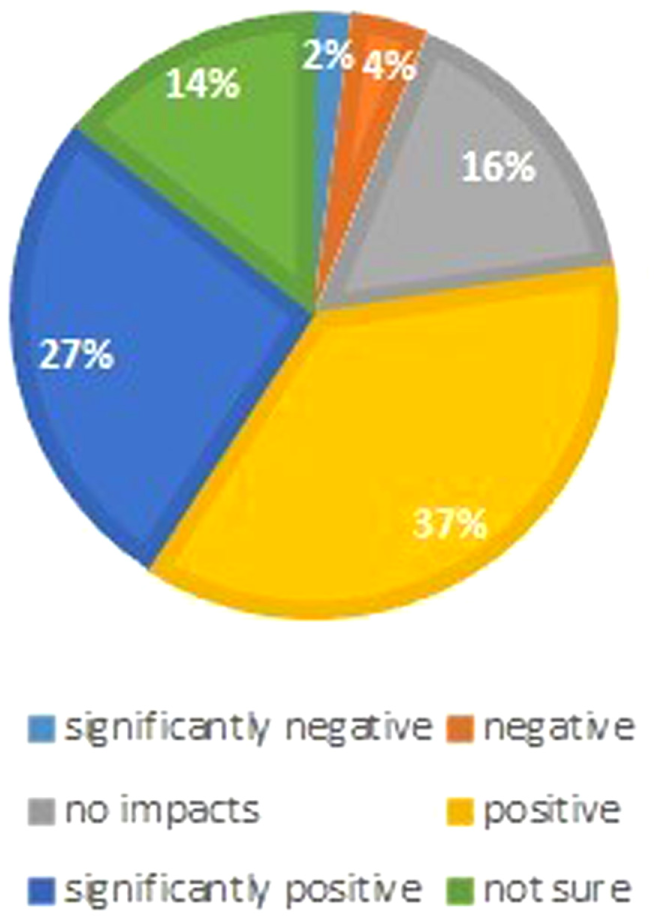
Impacts of autonomous transit on transit system over next 10 to 20 years.
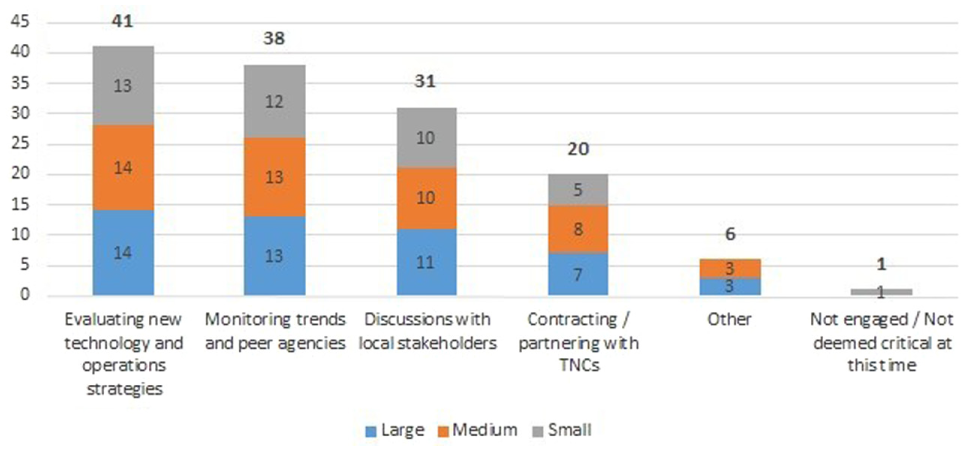
A large number of transit agencies (n = 14) have not deemed AT systems as a critical need at this time (Figure 18). Most transit agencies self-identified themselves as monitoring trends and other peer agencies; however, the research team did not explore how in depth this is for agencies. The most significant change relative to TNC preparedness was a drop in evaluating new technologies and operations strategies. This is attributed to a drop in transit agencies piloting or partnering with companies testing AT systems (only two agencies mentioned a pilot program). As there is little to no data coming in or experience with AT systems, most transit agencies could not have a reflection or shift toward this technology.
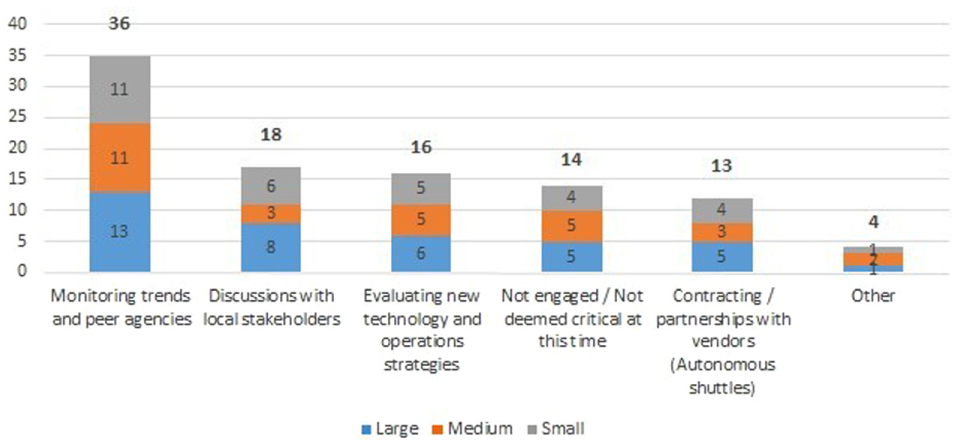
Count of transit agency strategies in dealing with autonomous transit.
Key Findings
Table 3 captures the key findings for the AT system portion of the survey split by transit agency size.
Key Findings from Survey of Transit Agencies on Autonomous Transit Systems (n = 50)
Summary and Conclusions
Transit is experiencing a turning point as the rise of technology-enabled TNCs are optimizing routing and either directly affecting transit agency ridership or forcing transit agencies to evaluate their current business model. Also, autonomous vehicle technology is advancing and, with the blessing of the FTA, transit agencies are now able to test out AT systems in their communities through partnerships with AV makers, researchers, and financial grants.
As these two technologies advance, transit agencies will need to continuously evaluate new technology and operations strategies and monitor trends and peer agencies, engage with their transit union and employees before and during partnering with third-parties, and adhere to existing regulations that were created during a time when these shared mobility technologies were not in mind. In spite of challenges, the literature documents two case studies of successful partnerships with TNCs and this survey identifies varying degrees of progress across the nation in adapting TNCs into a mobility broker model. More specifically:
A majority of stakeholders involved are not actively supporting TNC partnerships. Agency respondents self-reported that just 30% of governing boards, 28% of the public, and 0% of transit unions are in support of the transit agency partnering with TNCs.
There is a disconnect between transit agency administration and opinions of transit unions and drivers. For these questions, respondents were substantially unsure of these stakeholder positions.
Most transit agencies, especially large ones, have met with TNCs to discuss potential partnerships (64%, 71% respectively).
Transit agencies suggest the greatest benefit with a partnership is an expanded service area through first/last mile connections, but report data sharing as the greatest barrier to incorporating them into transit operations.
In addition, 72% expect to see TNC market share to grow within the next 5 years and 45% would rate the impacts from TNC as negative versus just 35% seeing it as positive.
Regardless of transit agency size, most agencies are preparing by evaluating new technologies and operation strategies or monitoring trends and peer agencies.
AT has not garnered the same attention of transit agencies as TNCs have—stakeholder opinions, barriers to implementation, and preparation strategies suggest AT systems are not on the forefront of agency’s minds:
Few governing boards have directed the agency to study AT systems (22%) and only three responding agencies are testing or working on bringing an AV to their locality. Further, only 24% of agencies have received public pressure to move toward automation.
Transit agencies are just as unsure about transit union and driver opinions with TNCs as AT. Only 16% and 40% of agencies are aware of concerns from these respective stakeholders.
Before the anticipated benefits like attracting new riders, expanding service area, or improving peak hour service with AT systems occurs, the agency must first wait for the technology to mature to prove reliability and safety performance and for costs of the technology to fall within an accepted range.
A lower percent of agencies believe AT will have a negative impact on their operations than TNCs (6% as compared with 45%).
Further, although 50% or more of all transit agencies, regardless of size, are considering adopting new technology because of influences of TNCs, only large agencies meet the same threshold when considering how planning for AT systems has influenced them to adopt or consider adopting new technology.
Current trends and guidance are proven true in this comprehensive survey of transit agency perceptions and behaviors. TNC partnerships are on the rise, TNCs appear to be increasing their data sharing with transit agencies, and confusion about compliance with Title VI and ADA requirements, echoing concerns documented in the literature ( 7 ), remains. It is unknown whether transit agencies are aware that the FTA maintains a set of frequently asked questions online to clarify requirements for shared mobility alternatives, or that FTA encourages transit agency to seek guidance on this topic ( 11 ). In addition, transit agencies believe the future of transit is autonomous but likely further down the road after technology is proven and capital costs fall. With the rise of these technologies, transit agencies appear to remain optimistic about attracting new riders, expanding first/last mile connections, and reducing paratransit costs even though attitudes toward TNCs impacts on transit remain negative—likely as a result of traditional transit models not maintaining or increasing ridership and revenue.
There are several avenues for further research. First, research is needed to examine the perceptions regarding connected vehicles and other important technologies that were not examined in this scoping study. Second, the study can be extended to elicit preferences of smaller transit agencies (this study focused on larger agencies which may already be looking into these issues) and transit agencies from other parts of the world. Third, technologies evolve rapidly and, therefore, having a panel study that tracks changes in perceptions systematically over time would be of great value. Finally, setting up of peer-exchange meetings which will allow agencies to collaborate on adapting their practices to the changing technology landscape would be of much practical benefit. For example, avenues for setting up a sustainable partnership with TNCs could be explored.
Footnotes
Acknowledgements
This study was supported by funding from Jacksonville Transportation Authority (JTA). We also acknowledge University of Florida’s Summer Undergraduate Research at Florida (SURF) program which allowed Matthew Dean and Parfait Masungi to contribute to this study. The authors would also like to thank Matthew Muller (formerly of the T2 center University of Florida) for his contributions to survey design and Sophia Semensky (undergraduate student, University of Florida) for her efforts in assembling a transit agency database.
Author Contributions
The authors confirm contribution to the paper as follows: Study conception and design: SS, RLS, PAM, MH, and KS; Data collection: MH, MDD, PM, and KS; Analysis and interpretation of results: MH, MDD, SS, and RLS; Draft manuscript preparation: SS, MH, MDD, and PAM. All authors reviewed the results and approved the final version of the manuscript.
The Standing Committee on Transit Management and Performance (AP010) peer-reviewed this paper (19-04295).