
Abstract
Signal retiming is one of the chief responsibilities of municipal transportation agencies, and is an important means of reducing congestion and improving transportation quality and reliability. Many agencies conduct signal retiming and adjustment in a schedule-based manner. However, leveraging a data-driven, need-based approach to signal retiming to prioritize operations could better optimize use of agency resources. Additionally, the growing availability of probe vehicle data has made it an increasingly popular tool for use in roadway performance measurement. This paper presents a methodology for using segment-level probe-based speed data to rank the performance of traffic signal corridors for retiming purposes. This methodology is then demonstrated in an analysis of 79 traffic signal corridors maintained by the City of Austin, Texas. The analysis considers 15-minute speed records for all weekdays in September 2016 and September 2017 to compute metrics and rank corridors based on their relative performance across time periods. The results show that the ranking methodology compares corridors equitably despite differences in road length, functional class, and traffic signal density. Additionally, the results indicate that the corridors prioritized by the ranking methodology represent a much greater potential for improving travel time than the corridors selected under the schedule-based approach.
Maintaining traffic signal timing plans is one of the most pressing responsibilities facing municipal transportation agencies. The National Traffic Signal Report Card has continually called for better signal maintenance and management across the country ( 1 ). Vehicle miles traveled in the U.S.A. have resumed a trend of steady increase following a decline associated with the economic recession of 2008 ( 2 ). Simple solutions, such as regularly retiming traffic signals, have been recommended to offset the effect of growing congestion ( 3 ). However, regularly retiming traffic signals requires agencies to continually revisit and update traffic signal timings to provide the best possible travel conditions for road users. The majority of agencies conduct signal retiming operations by following a rotating schedule determined by agency resources, or simply by responding to user feedback on a case-by-case basis ( 4 ). However, the proliferation of data in the transportation field has made quantitative assessment of roadway performance more realistic for many agencies. Probe vehicle data has become an increasingly popular tool for traffic assessment both in real time and over extended time periods. Available commercial products aggregate probe vehicle data to provide segment-level speed and travel time information. Such data is based on position and speed data collected from a user base through cellular phones or other mobile devices.
Applications for assessing roadway performance using probe vehicle data have thus far dealt with freeways or major arterials, and roadways with a lower density of traffic signals and often limited access points. However, most agencies maintain signals across a wide range of functional classifications, including a significant portion on low-speed and relatively low-volume local streets. There has yet to be a study which compares the performance of such a variety of roadways across a geographic area.
This paper presents a methodology for prioritizing corridors for signal retiming operations based on metrics computed using probe vehicle speed data. The proposed metrics assess the relative performance of corridors for selected time periods. This study was conducted on 79 corridors in Austin, Texas, consisting of 1,026 traffic signals spread over 300 square miles. The following sections detail the motivation behind the study, the data and methodology used, the resulting ranking of corridors, the calculated benefit of this ranking method, and the conclusions drawn from this study.
Background and Review of Literature
The City of Austin Transportation Department is charged with retiming one-third of the city’s approximately 1,000 traffic signals every year, with the goal of ensuring the signals are timed to optimize safety and performance. Currently, signals are selected for retiming based on a three-year fixed schedule. In this regard, the City of Austin currently conforms with the majority of U.S. agencies, which retime their signals on a three- to five-year cycle ( 4 ). The City of Austin developed its retiming schedule by grouping traffic signals into corridors. There are 90 City-defined corridors, divided into three groups to create a rotating three-year schedule for retiming. The three-year cycle was chosen to match the availability of agency resources and the capacity for signal retiming in a given year.
The “three-year rule” is generally considered the industry standard and rule-of-thumb. It dictates that signals should be retimed every three years to maintain an adequate standard of operation. However, there is little research to back it up ( 5 ). In fact, so many factors affect traffic signals that it is not productive to rely on a universal rule for retiming frequency. For instance, arterials benefit from frequent retiming, but downtown urban networks generally do not. Thus, certain traffic signal corridors may require retiming every one or two years, while others may only need adjustment every five years. The fairly strict schedule-based system used by the City of Austin and many other agencies cannot easily anticipate or adjust for these various factors.
In a given year, the City of Austin’s schedule may be adjusted because of unexpected changes in performance, resource availability, or other reasons, but the three-year schedule serves as a foundational plan for retiming. Surveys have been conducted to explore the factors that most often affect signal retiming and the triggers that may cause an agency to disrupt its retiming schedule ( 6 ). Primary triggers for retiming include requests from the public, significant changes in land use, changes in traffic volume or congestion patterns, and crash history, among others. The City of Austin takes many of these triggers into account, particularly citizen feedback, but the main motivation to retime is usually the three-year rule.
Surveys have also touched on methods for monitoring signal performance, indicating that the most common was citizen feedback, followed by anecdotal or video observation, floating car travel time runs, and level-of-service analysis. The City of Austin predominately uses floating vehicle travel time runs to assess the effectiveness of retiming. The City conducts such runs in a consistent manner, at carefully chosen times before and after retiming a corridor. The collected data is used to compute a percentage travel time reduction metric, the principal measure of effectiveness for the retiming of the corridor. However, this percentage travel time reduction is not used to prioritize corridors for retiming operations.
Use of probe vehicle traffic data has been on the rise in the last ten years, and has been increasingly employed by researchers and practicing engineers alike to explore traffic patterns, congestion, and mobility in a variety of applications. Many U.S. states have recently produced reports that leverage this sort of data to assess statewide mobility by examining congestion on major freeways ( 7 – 11 ). The body of research that has been conducted in this area has focused on small subsets of freeways and major arterials, as opposed to a cross-section of all road types in a given region. A smaller portion of this work has explored ranking these higher-volume roads based on their performance ( 12 , 13 ).
Given that the majority of transportation agencies conduct signal retiming operations with little-to-no quantitative prioritization, this project has the potential to significantly improve the efficiency of transportation operations. Current literature does not contain decisive research on using crowd-sourced probe vehicle data to compare a wide variety of corridors. The methodology developed in this study has the potential to significantly increase the quality of service that agencies can deliver to their stakeholders.
Methodology
Data
For the purpose of this study, it was important that the data cover the entire study area (in this case, all 90 traffic signal corridors in Austin). The City of Austin purchased a probe vehicle dataset from a third-party vendor for general transportation applications; this data was chosen for use in this study because it presented significantly better coverage than any of the alternatives. When the City of Austin initially purchased the data, its coverage was limited to major roads, and it did not cover every signalized corridor in the city. However, the City successfully requested an expansion of the coverage area from the data provider, which resulted in reliable coverage on 79 of the 90 City-defined corridors, or 87% data coverage (Figure 1). A major advantage of probe vehicle data, in addition to the flexible coverage, is that it does not require the installation or maintenance of sensors by the agency.
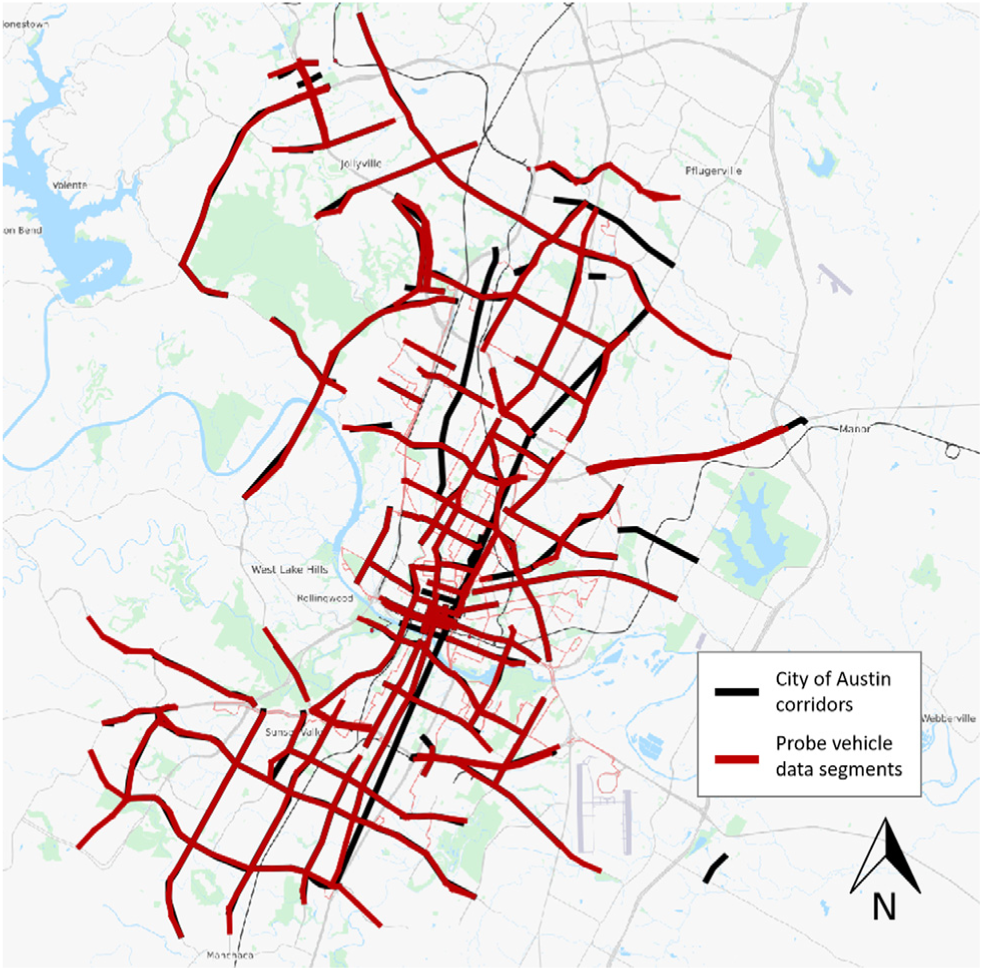
Map of probe vehicle data coverage for the City of Austin.
The probe vehicle data is collected by the third-party vendor through a network of participating users’ cellular phones, and is supplemented by other sensors. This data is delivered by the provider in records detailing the average vehicle speed over a given segment of roadway for a given period of time. Segments generally range from 0.1 to 0.5 miles in length, though they can be as short as 10 yards and as long as a mile. The finest data granularity is 1-minute speed averages, though the granularity can also range up to 1-hour averages. Since the data also logs the length of each predefined segment, a travel time can be calculated based on the measured speed. By stringing together consecutive segments, corridors can be defined and studied individually.
There are some concerns in using probe vehicle speed data, particularly in the context of an urban road network. The first is that this data only includes vehicle speeds, and does not contain information on the associated demand or vehicle volumes. Additionally, the data provider does not publish information on the specific data penetration rates for individual roads or regions. While these concerns were considered in assessing the effectiveness of the data source, ultimately the probe vehicle speed data was selected for use in this study, primarily because of the benefit of good data coverage.
Data Acquisition and Aggregation
Data was downloaded at 15-minute granularity for each study corridor. This was done as a compromise between computational speed and data granularity. Two years of data for the 79 corridors was acquired from the provider’s internet-based user interface and ingested into PostgreSQL, an open-source database management system, for ease of handling. The 79 corridors were made up of 1,759 roadway segments, and there were 116,278,732 speed records in total. This study utilized the portion of the data corresponding to weekdays in September 2016 and September 2017. This was done to avoid any issues that might arise because of seasonal variation. Furthermore, September is a good candidate month for a case study in Austin. In addition to school being in session (grade school as well as The University of Texas), September is free from major disruptive events that occur in other “school months.” These include the Austin City Limits Music Festival, the South by Southwest Conference and Festivals, and the Formula 1 U.S. Grand Prix. It should be noted that no major filtering was performed on the data set. This is because the vendor had already performed data cleaning measures to remove outliers. The data was inspected graphically to ensure that this was the case.
A significant challenge in developing meaningful metrics arose in choosing how to aggregate the data both spatially and temporally to best communicate the need for retiming. Through exploration of the data, it was determined that computing corridor-level metrics based on averaging values across all corresponding segments could lead to problematic sections being balanced out by other sections that were operating well. This was particularly an issue on the longer corridors, which were more likely to operate very differently at different points along the corridor. Therefore, the most effective way to communicate corridor performance given these concerns was to produce corridor-level metrics from segment-level analyses. In other words, it was desirable to avoid over-aggregating the data.
In a similar way, given that most roads experience volume approaching or exceeding capacity for only a handful of hours in a day, averaging values across an entire day tended to “wash out” some of the trends. However, leaving the data in 15-minute bins would make drawing clear conclusions across a lengthy study period difficult. For this reason, the 15-minute data was rolled into three time-of-day (TOD) periods: morning peak (7:00–9:00 a.m.), midday (11:00 a.m.–1:00 p.m.), and evening peak (4:00–6:00 p.m.). It was particularly important to analyze both morning and evening peaks because of the directional nature of traffic throughout the day on many urban streets.
It is entirely possible that certain performance issues may still be obscured by aggregating the 15-minute data into 2-hour bins. It may be more difficult to identify trouble spots or times on corridors that display more isolated congestion or exaggerated peaking than on corridors that are consistently congested across the 2-hour period. However, given the large scale of the data and the exploratory nature of this study, it was necessary to compromise somewhat on data granularity to compare many different corridors efficiently across different days and times of day. In response, it was desirable to identify a selection of metrics that would minimize this concern.
Development and Computation of Metrics
Given the desire to apply the ranking methodology as a tool for regular use by practicing signal timing engineers, the chief goal was to develop ranking metrics that were easy to understand and that communicated the underlying need for corridor retiming clearly and accurately. This simplicity of the ranking metrics is important because of the sheer volume of data, and also because transportation engineers must have ready means to explain and defend retiming decisions to City officials, the public, and other stakeholders.
Developing appropriate metrics involved many iterations of calculations, and a few challenges were noted. One problem was that travel time is not effective in comparing corridors of different lengths. Focusing on segment speed, as opposed to travel time, as the basis of the metrics allowed for comparison between corridors of differing lengths. Another issue was that absolute speed, particularly without any vehicle volume information, is not effective for comparing corridors with different functional classifications or speed limits. To compare roads with different speed limits or functional classifications, the methodology was built around calculating speed change on a corridor between two comparison periods. These comparison periods could represent weeks, months, or years which would be compared to assess whether corridor performance had improved or worsened between the comparison periods. In this study, September 2016 and September 2017 were used as the two comparison periods. A third challenge was in capturing the under-performance of one section of a corridor when another section (or even most of the rest of the corridor) was performing well. To account for this, the metrics focus on the portions of the corridor that experienced a decrease in speed between the two comparison periods.
The three metrics used in the final ranking process are: percentage of the corridor (by length) that experienced a decrease in speed between comparison periods; percentage of the corridor that experienced a decrease in speed of 3 mph or greater between comparison periods; and, the maximum speed decrease for any one segment on the corridor. The 3 mph threshold for speed reduction was chosen after testing with several values. It is important to note that this methodology is designed to analyze changes in performance over time as the major indicator of the need to retime a corridor. Further extensions to this work could consider the ideal threshold for minimum desirable speed or maximum allowable speed decrease. The third metric, maximum speed decrease for any one segment on the corridor, was designed to identify corridors with isolated spots or times of poor performance.
Each record in the data set is represented by

The average segment speed for each of the comparison periods

Finally, the speed difference on segment

This segment speed difference then forms the basis for the metrics used to rank corridors

The condition

It then follows that a similar metric could be computed for a certain threshold speed decrease, by calculating the mileage along the corridor that experienced a speed decrease greater than


The third and final metric used for ranking is the largest speed decrease among all segments on the corridor, given by Equation 8. It should be noted that this metric seeks to identify the largest negative speed change, which is why it is computed using a minimum. If every segment on a corridor actually experienced an increase in speed between comparison periods, then this metric would result in a positive number for that corridor:

Ranking of Corridors
The final prioritization of corridors combines the three metrics (percentage of corridor experiencing speed decrease,
Figure 2 summarizes the ranking process. All corridors were ranked by each of the three metrics for each of the three time-of-day periods to determine each corridor’s worst-performing direction. The practice of ranking corridors based on their worst-performing direction assumes that an agency would retime both directions of a corridor simultaneously. The final ranking for a corridor is then computed by taking the average of that corridor’s place (accounting for ties) in each of the preliminary rankings.
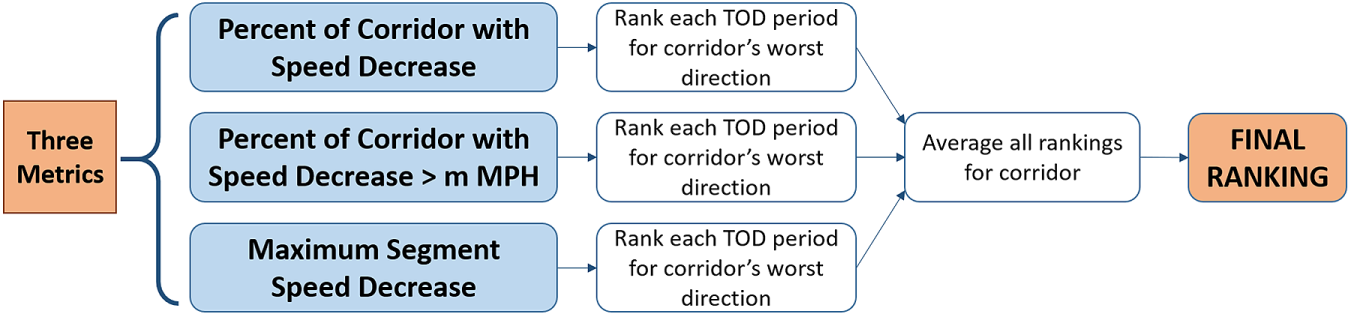
Ranking process.
Results
Table 1 presents an excerpt of the ranking and results of the different metrics. The average rank for each corridor is shown in addition to the final rank, to illustrate the process of averaging each individual metric ranking for each time-of-day period
Excerpt of Corridor Ranking Results
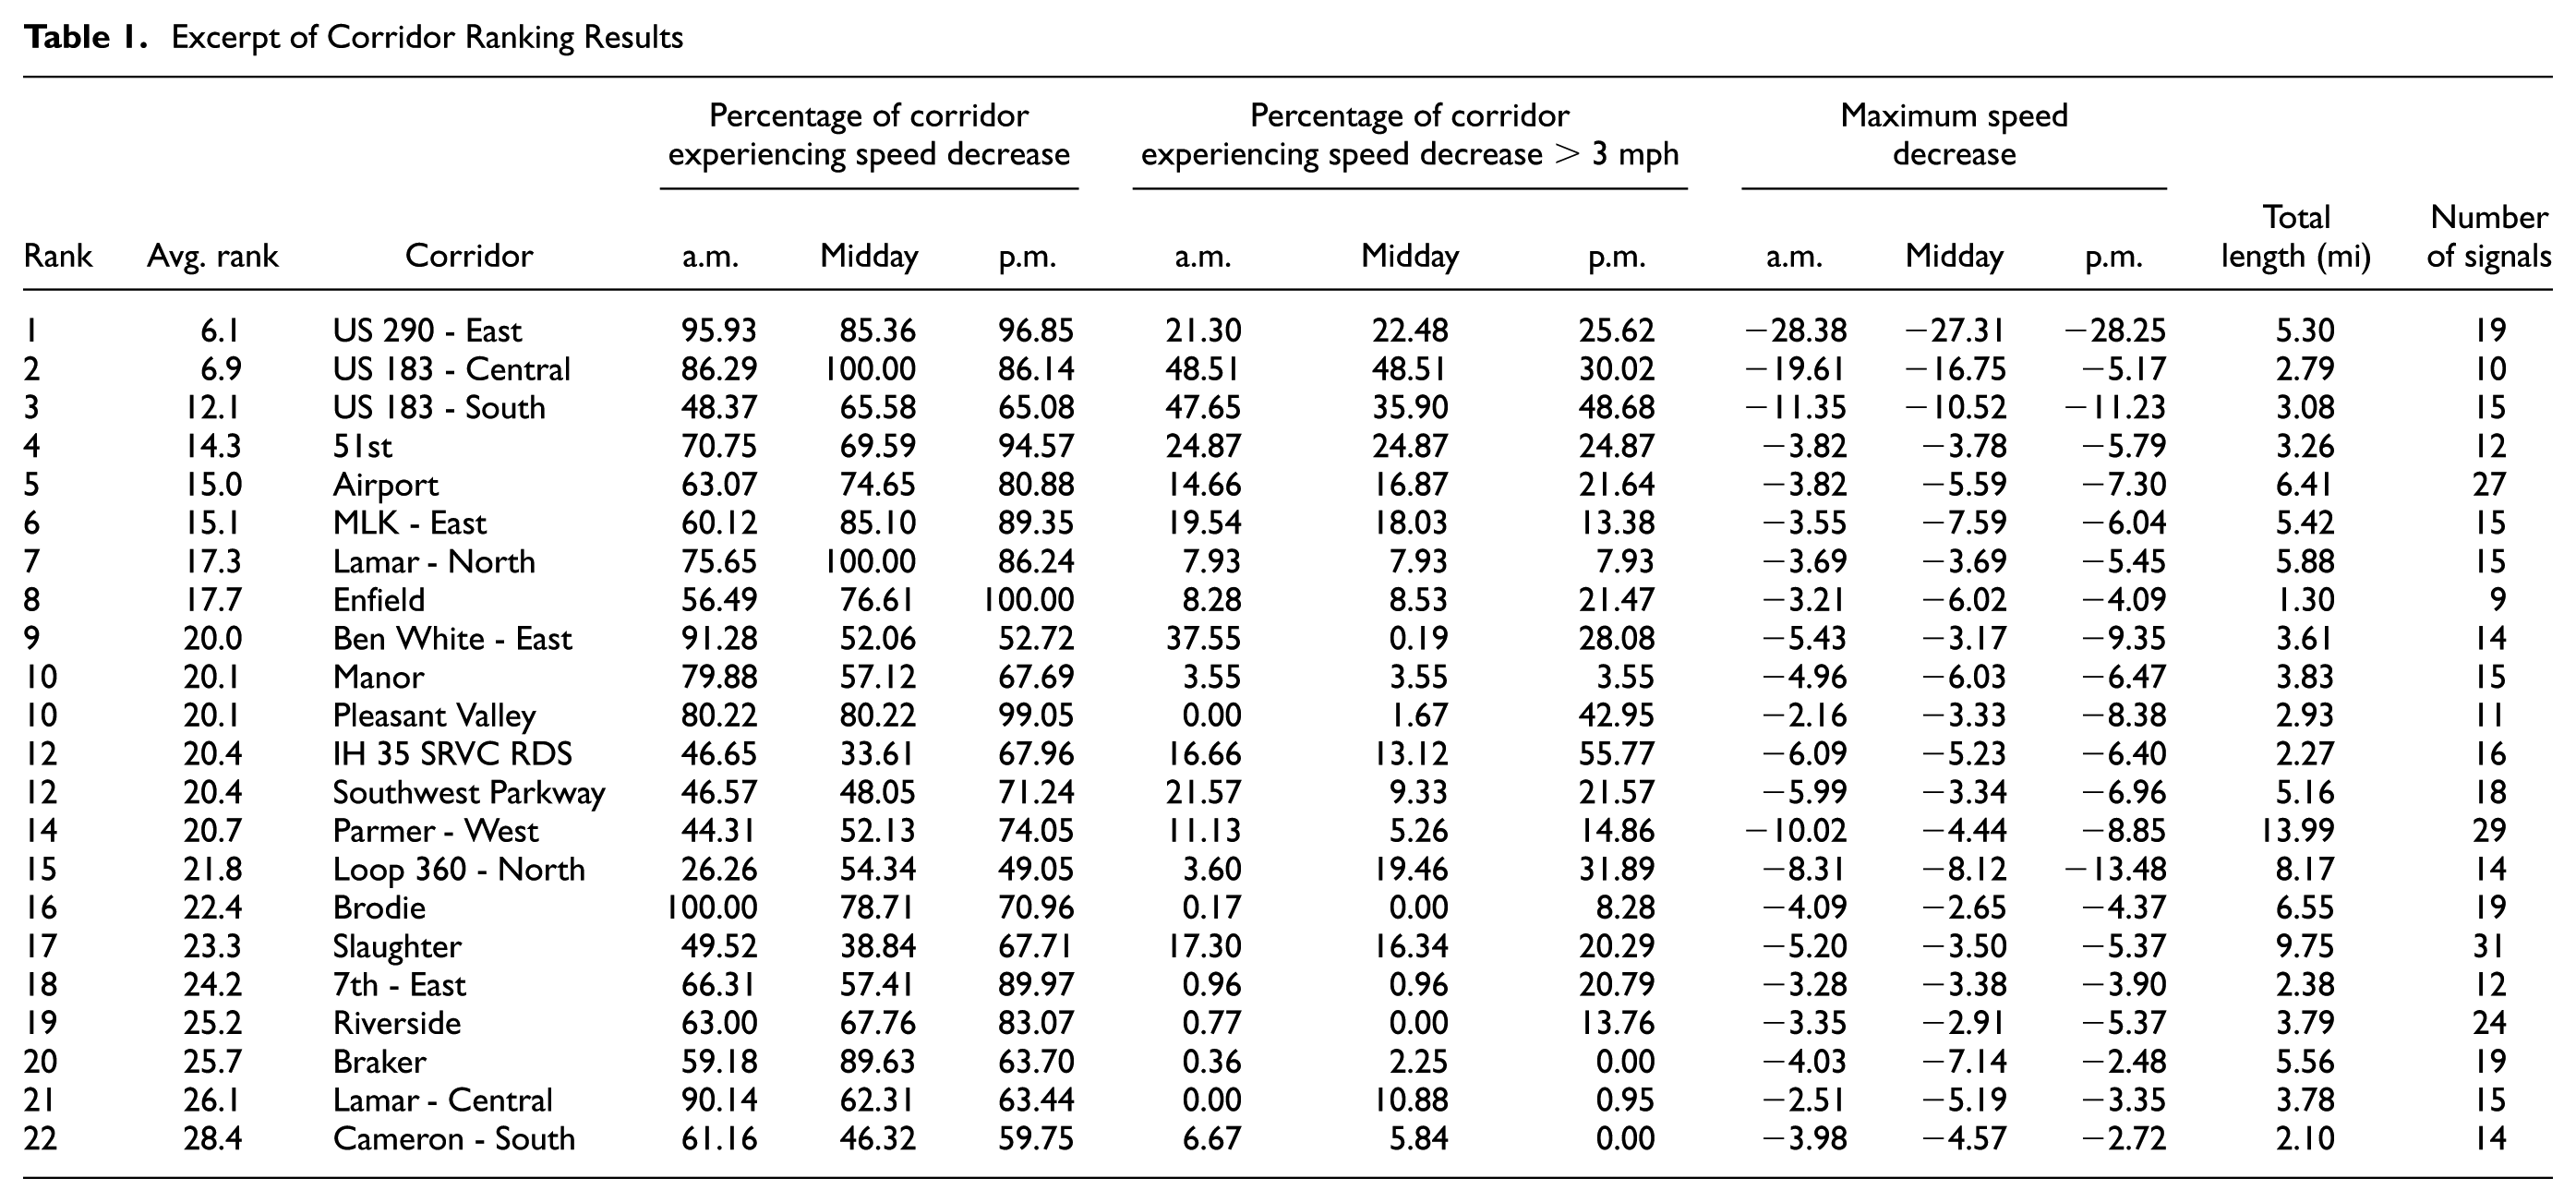
There are a few noteworthy results from the corridor ranking. Most significant is the ranking of three major frontage road systems in the first three places (US 290 - East, US 183 - Central, and US 183 - South). Signalized frontage roads along limited-access facilities are a common feature in Austin, and throughout Texas. Examining the results for these frontage roads reveals that each corridor exhibited a relatively high percentage of speed decrease and high maximum speed decrease values. However, significant roadway construction projects were ongoing throughout the latter half of 2017 on all three corridors, which significantly affected their performance. It is therefore important to note that knowledge of the local roadway network, ongoing and planned construction, special events, and other factors affecting traffic flow should be considered outside of the ranking methodology presented in this study.
One concern was that the ranking methodology might unnecessarily favor corridors based on length. This trend does appear, but there is significant unexplained variability, leading to a low R2 value which is not statistically significant (Figure 3). Additionally, results show that the methodology slightly favored corridors with lower traffic signal density (Figure 4). This is unsurprising, as corridors with lower signal density are often more difficult to coordinate. However, although there is once again a linear pattern, the unexplained variability is significant and the R2 for the linear relationship is not statistically significant.
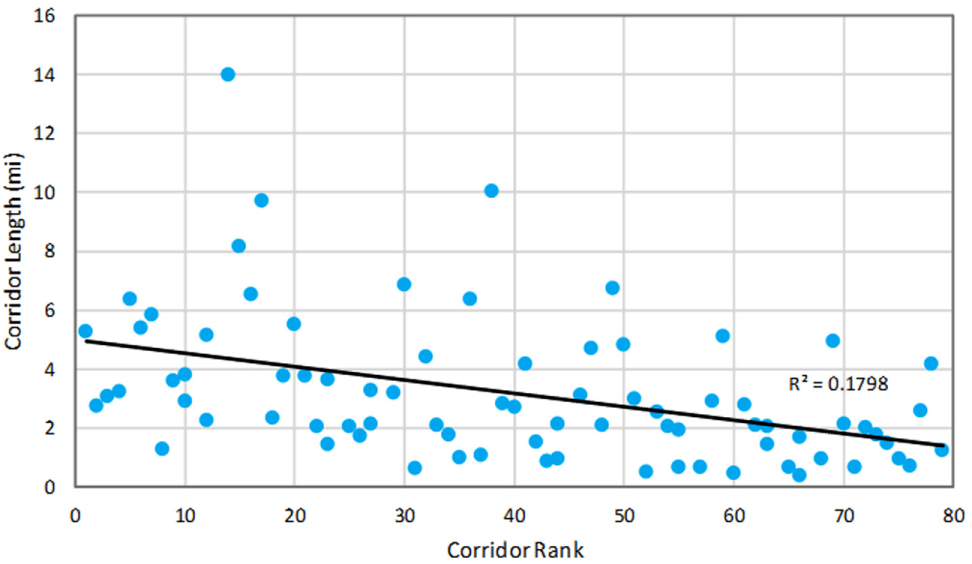
Corridor rank versus corridor length.
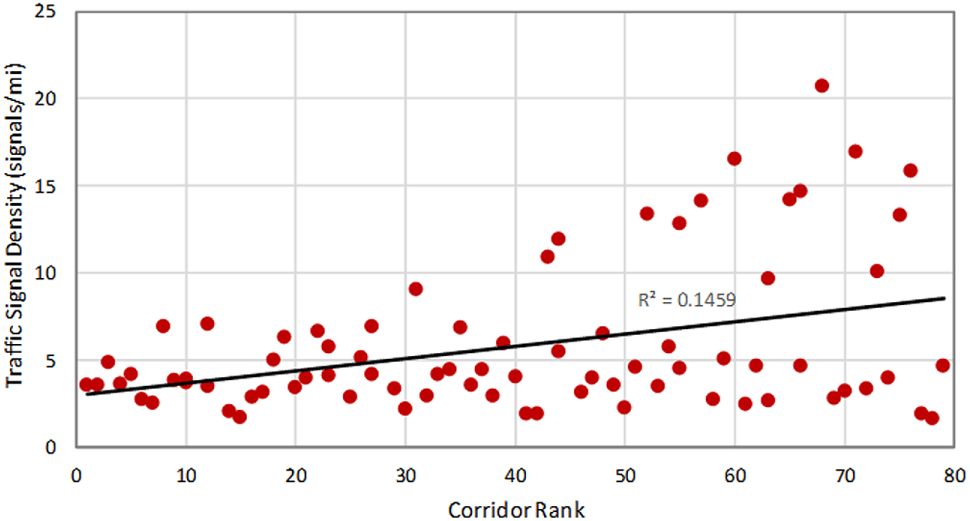
Corridor rank versus traffic signal density.
The distributions of the proposed ranking metrics provide additional insight into the meaning of the observed results and the operation of the ranking methodology (Figure 5). The metric for percentage of the corridor experiencing a speed decrease shows a distribution which appears fairly normal (Figure 5a–c). However, the distribution for the percentage of the corridor that experienced a speed decrease greater than 3 mph is skewed significantly to the left. This is because of the introduction of the 3 mph threshold, which allows for the clear identification of problematic corridors (shown by the points farthest to the right in the distribution in Figure 5d–f). Finally, the distribution for maximum segment speed decrease shows a narrow pattern with most corridors experiencing a maximum speed change between −5 and 0 mph (Figure 5g–i). However, there are a few corridors that are far to the left on the distribution, indicating a large speed decrease. The differing distribution of the metrics allows the ranking methodology to evenly assess the corridors and to easily identify particularly problematic cases.
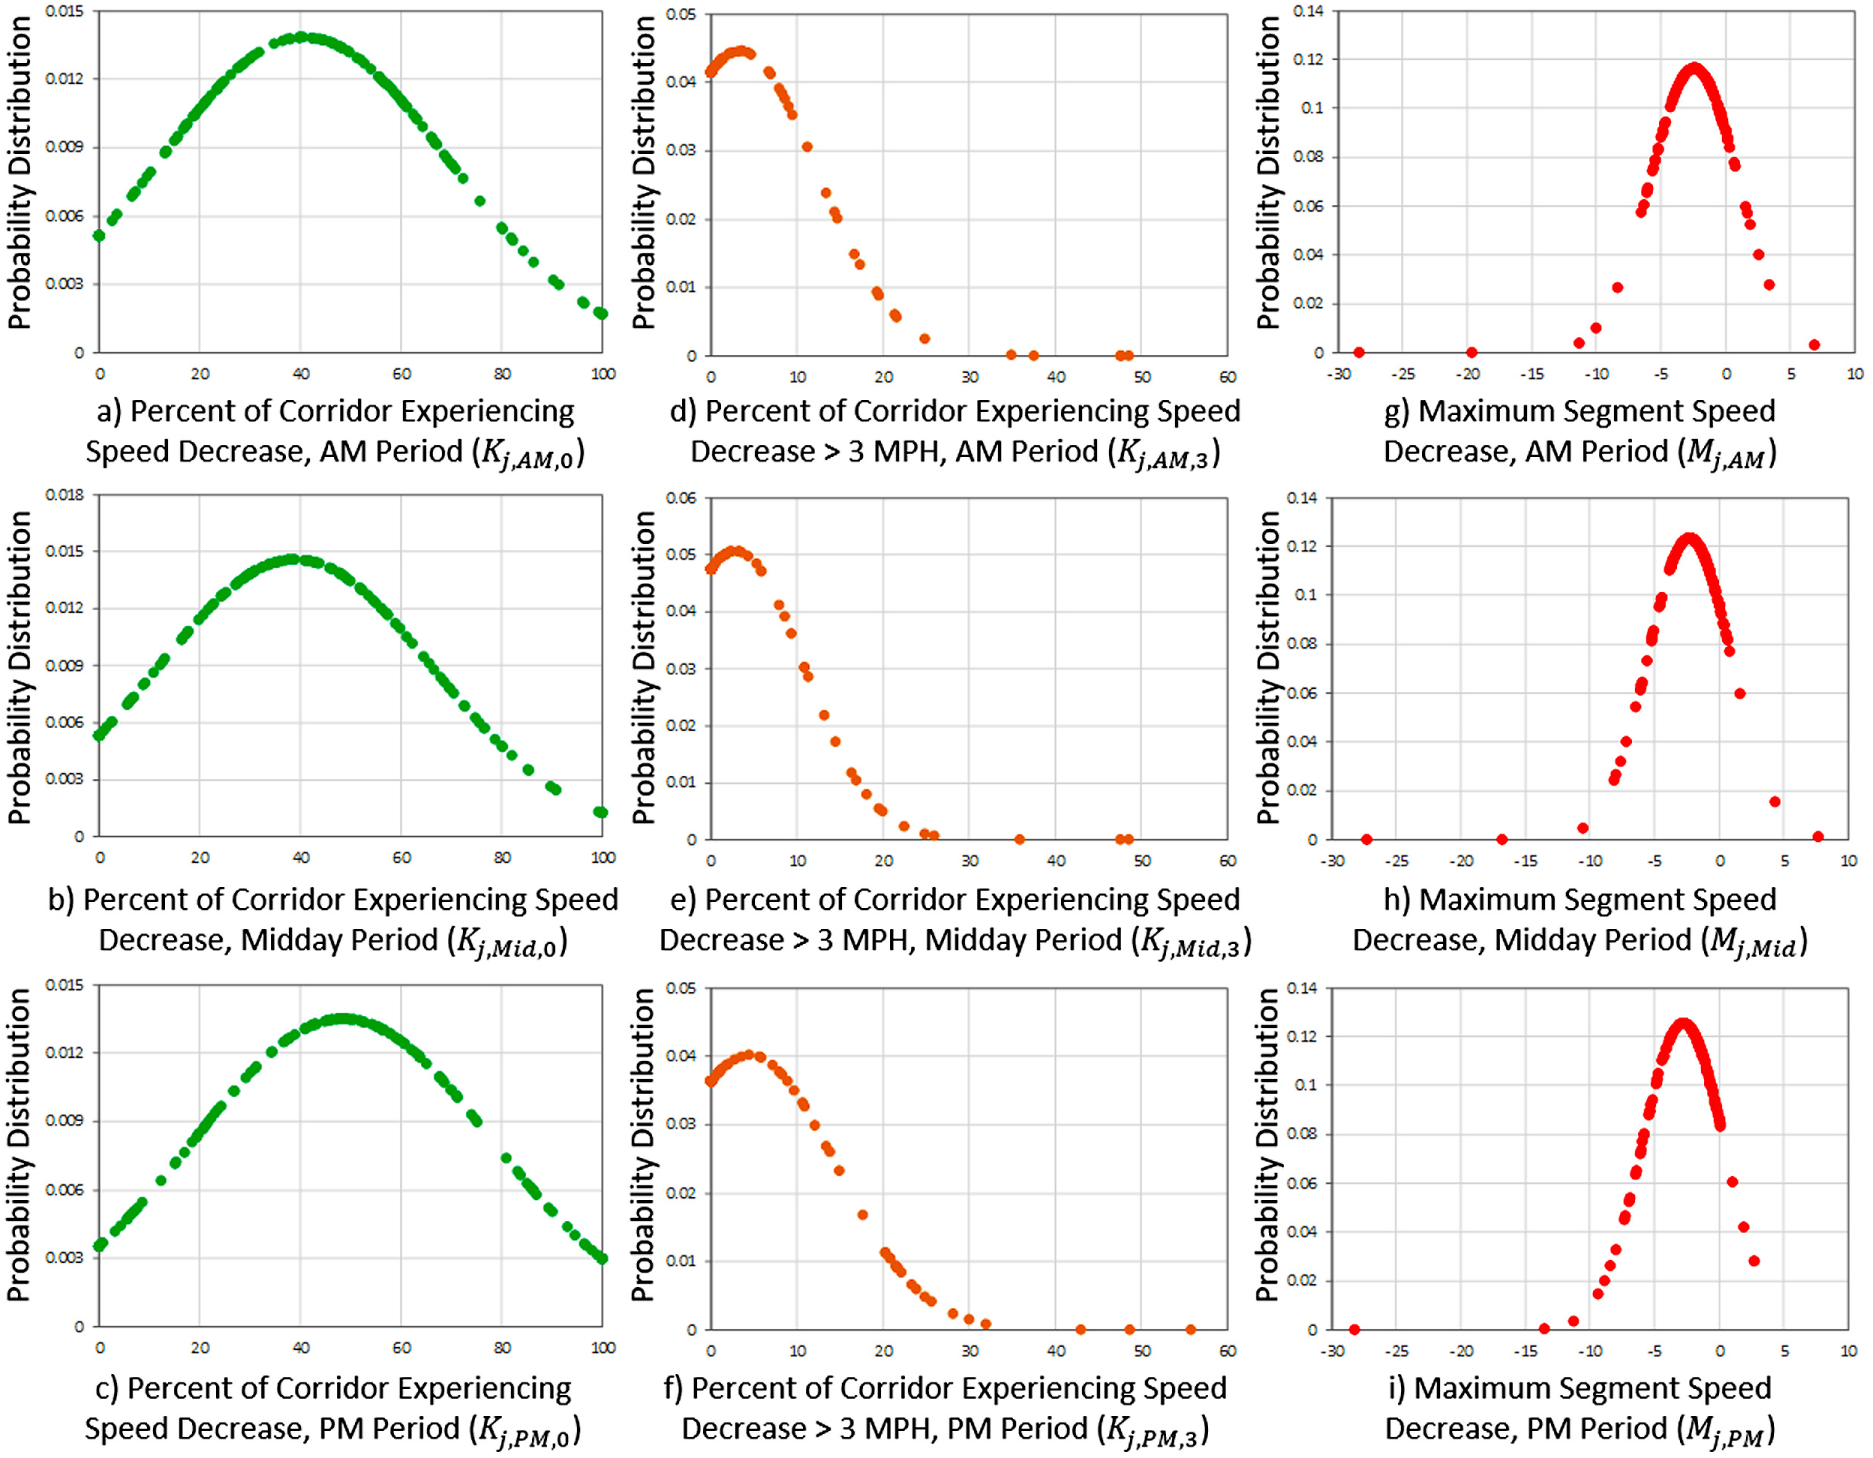
Distribution of metrics used for ranking.
Ranking Validation
Of the 27 corridors selected by the City of Austin for retiming in the 2017–2018 fiscal year, only seven appeared in the corridors selected by the ranking methodology. Of the 20 that did not, 16 were in the lowest-ranked third of the corridors, meaning they were not ideal candidates for retiming in the near future. Despite this fact, assigning a quantitative value to this ranking methodology is difficult, as it involves a “what if” scenario: What if the City of Austin had retimed the corridors selected by the ranking methodology instead of the ones they retimed based on their schedule? It is, however, possible to assess the potential for improvement of both sets of corridors. By assuming that retiming a corridor would result in improving the travel time along that corridor at least to what it had been in the previous comparison period, a measure of corridor travel time improvement potential

In this equation,

The travel time difference only contributes to the metric when a segment’s travel time has increased between the comparison periods, so that
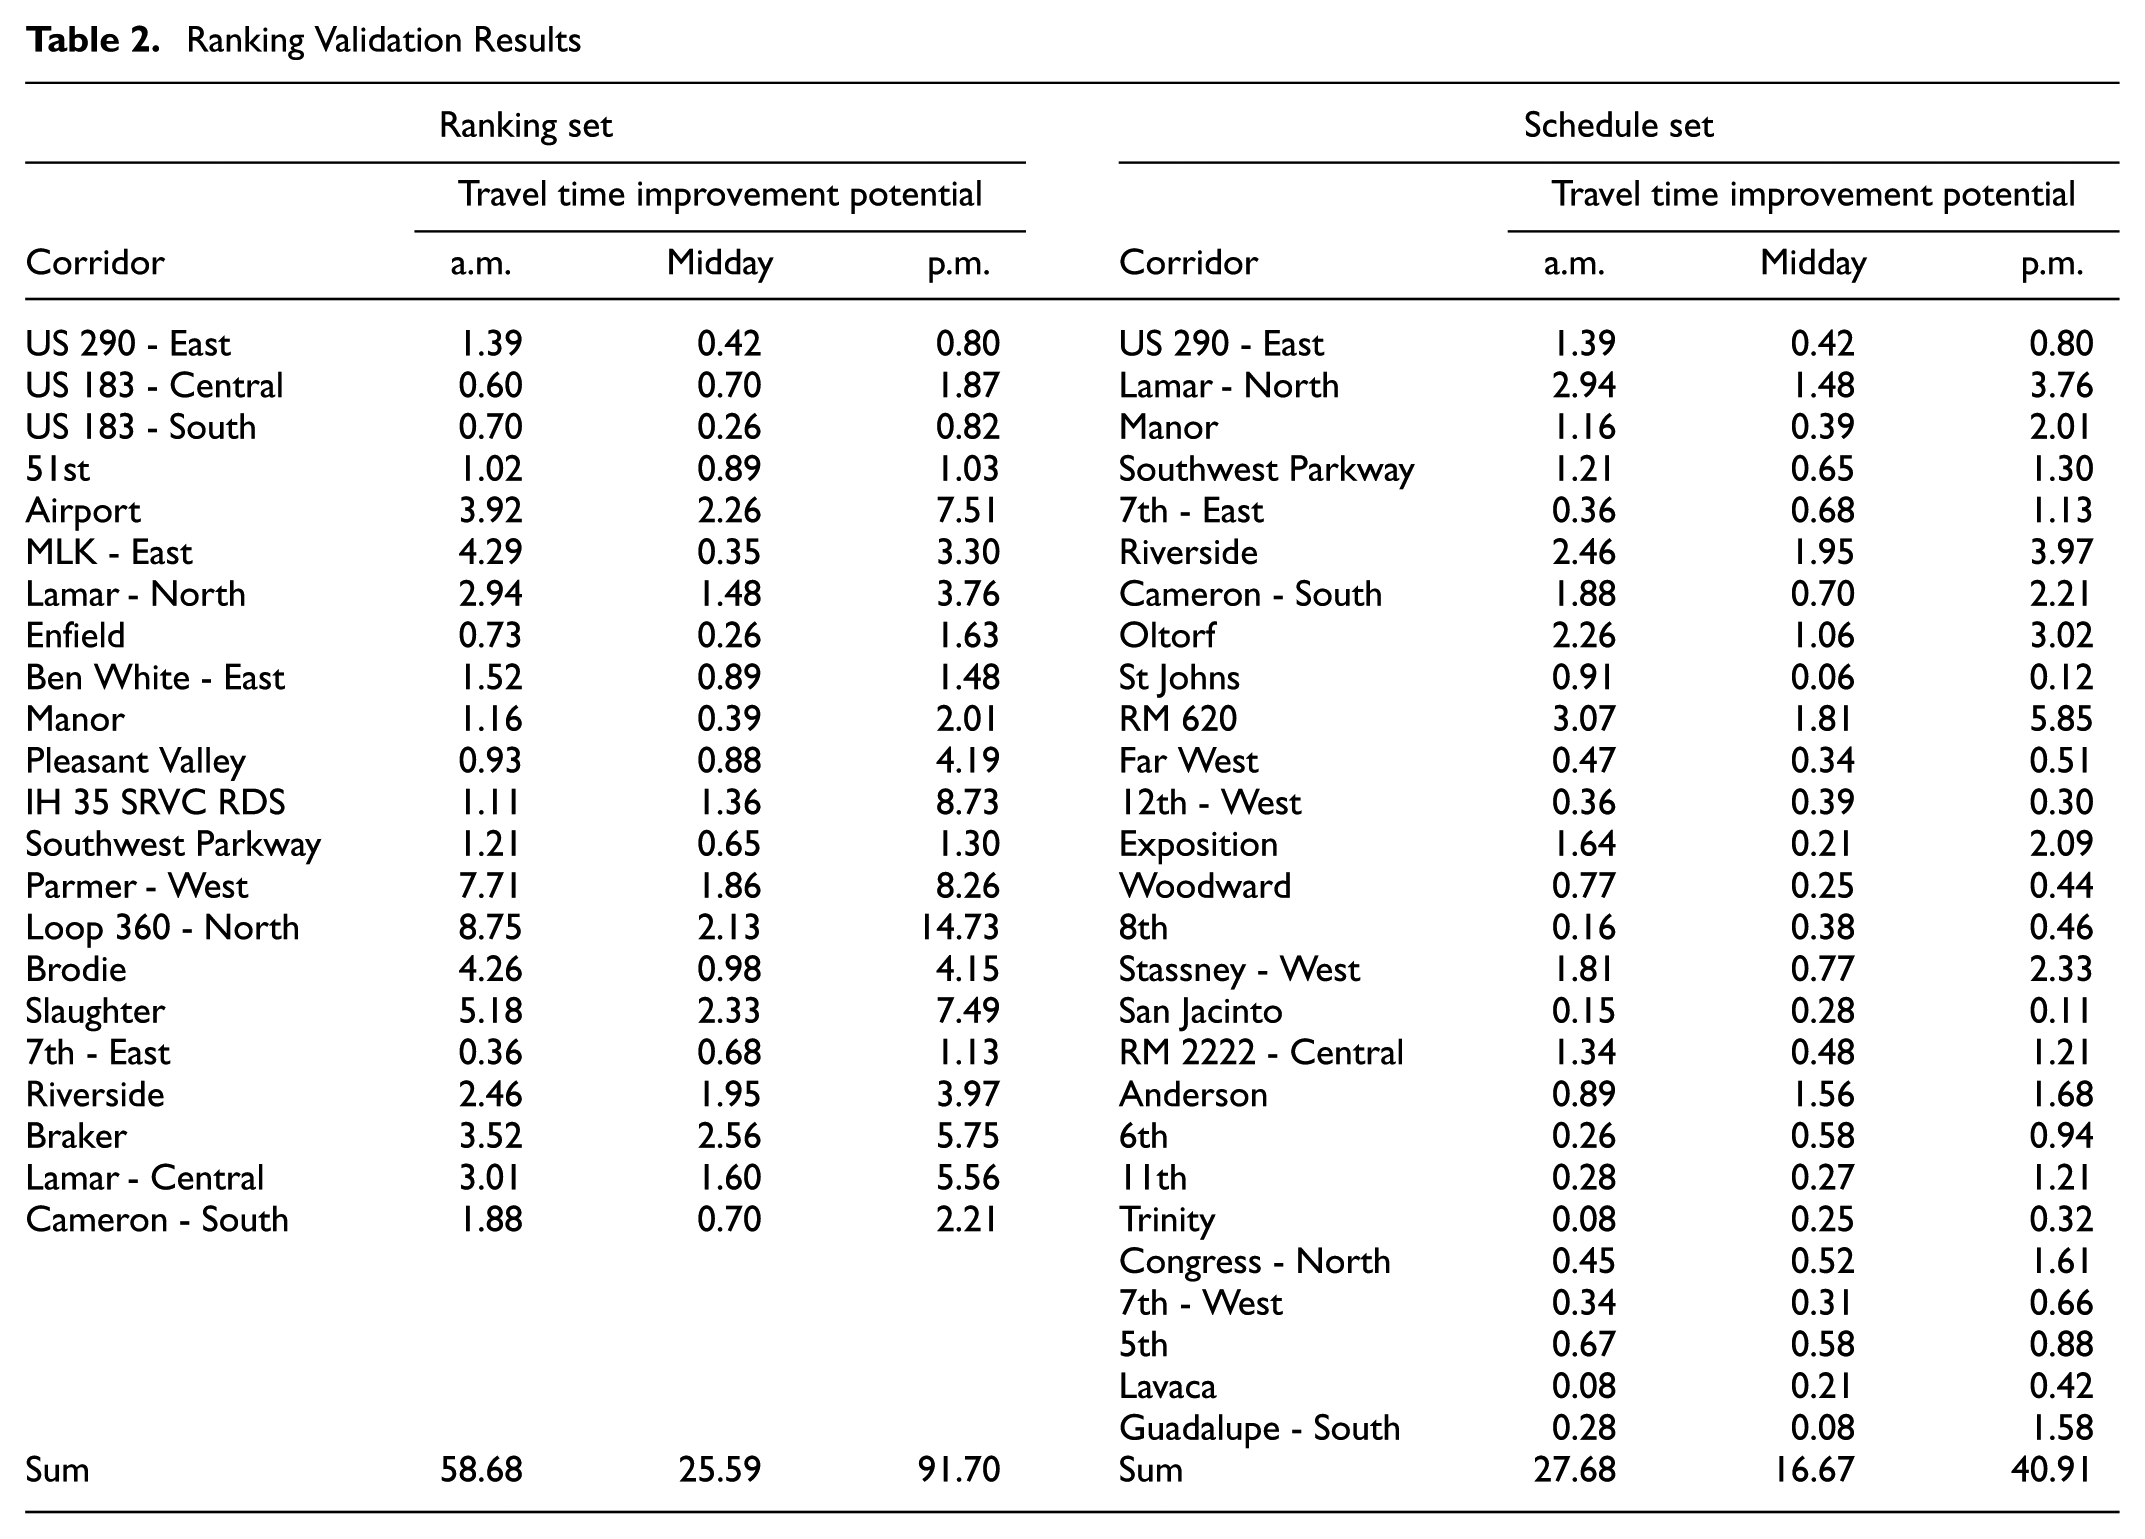
It follows then that improvement potential can be compared between the set of corridors chosen by the ranking methodology (the ranking set) and the set chosen for retiming by the City of Austin (the schedule set). The results clearly show that retiming the roads selected by the ranking methodology would address a larger performance deficit and thus present a greater potential for improvement (Table 2). The a.m. and p.m. periods show a significant difference in total travel time improvement potential between the ranking set and the schedule set. As expected, the midday period shows a more tempered improvement. This amounts to an average increase in travel time improvement potential of 96% across the three time-of-day periods. Note that the difference in size between the ranking set and the schedule set is because of the number of traffic signal each contains. As stated above, the City of Austin aims to retime around 375 signals each year, and the ranking set was chosen to fit that constraint. Additionally, the corridors in each set are ordered according to their placement using the ranking methodology.
Ranking Validation Results
Conclusions and Recommendations
This study explored a technique for utilizing probe vehicle speed data to rank the performance of traffic signal corridors for prioritizing signal retiming operations. A methodology for computing metrics and developing a corridor ranking system was presented, and an analysis was conducted on 79 traffic signal corridors in the City of Austin, Texas, utilizing 15-minute average speed data acquired from a probe vehicle data vendor. The data corresponded to roadway segments ranging in length from 10 yards to 1 mile, and the 79 corridors ranged in length from 0.4 to 14 miles.
Metrics were computed using data at the segment level for three time-of-day periods to address daily variation in traffic patterns and to avoid over-aggregating the data. The data used to compute the metrics were drawn from all weekdays in September 2016 and September 2017, and the two months were compared to generate three metrics based on speed change: percentage of the corridor that exhibited a decrease in speed between the comparison periods; percentage of the corridor that exhibited a decrease in speed greater than 3 mph between the comparison periods; and the maximum decrease in speed for any segment on the corridor. These metrics were chosen for their ability to compare across corridors of differing length and functional classification.
Results showed that the ranking methodology did not significantly favor corridors based on length or traffic signal density, indicating that the metrics equitably assessed corridor performance regardless of such factors, which varied widely across the corridors utilized in the study. Additionally, the corridors prioritized by the ranking methodology presented a significantly higher potential for travel time improvement than did those chosen in the schedule-based system.
There are numerous opportunities to extend this work in the future. As addressed in the discussion of data aggregation, future work might explore methods for examining the data on a more granular scale as opposed to rolling the 15-minute data into 2-hour time-of-day periods. The probe vehicle data utilized in this study did not include any measure of traffic volume or vehicle throughput, both of which are key components of roadway performance. At the time of the study, the City of Austin did not have access to comprehensive vehicle volume data across all study corridors. Simply reviewing travel speeds (or travel times) cannot fully depict how effectively a corridor is operating. For instance, the travel time on a cross-street might suffer if the signal is timed to favor a heavier vehicle volume on the main road. In this case, even though vehicles on the side-street are accruing delay while waiting at a red light, this is outweighed by the higher volume passing through the intersection on the main road.
This study utilized probe vehicle data because of its superb coverage over a wide area. However, future work might explore different or supplementary data sources which account for traffic volumes in an attempt to describe the operation of the signal corridors more fully. Similarly, these and other metrics could be computed from different data sources, such as high-resolution detector data, to gain a different perspective on various aspects of signal and corridor performance. Alternately, measures of travel time reliability could be developed and explored to augment the travel time and speed measures used here. The relationship between corridor length, traffic signal density, and performance (as referenced in Figures 3 and 4) could be further explored. Another factor that could affect corridor performance is seasonal variation, which was not addressed here.
Additionally, this study was limited to assessing signal performance from a corridor-based perspective. Organizing signals into length-wise corridors is effective for limited-access or isolated roads, or arterials that clearly take precedence over the surrounding local streets. However, this doesn’t translate cleanly to all signalized roadways within a city. There are often roads, such as in downtown grids, which operate more as elements in a network area than as separate corridors. Devising area-wide metrics could increase understanding of the performance of such signals.
A data-driven, needs-based methodology for prioritizing traffic signal retiming, such as the one presented here, represents an improvement from the schedule-based system that many transportation agencies use to organize retiming operations. Implementing a process that utilizes this corridor ranking methodology would increase an agency’s ability to provide the best possible transportation services to the public, by directing attention to signal corridors most in need of retiming. This then allows an agency to allocate resources in the most efficient way possible.
Footnotes
Acknowledgements
This work was supported by the City of Austin, Texas and conducted through the University of Texas Center for Transportation Research. Editorial expertise was provided by Brandy Savarese at the University of Texas at Austin Center for Transportation Research.
Author Contributions
The authors confirm contribution to the paper as follows: study conception, design, and direction: MRD, JL, JW, HWR, CB, JD, NRJ, RBM; analysis and interpretation of results: MRD, NRJ; draft manuscript preparation: MRD. All authors reviewed the results and approved the final version of the manuscript.
The Standing Committee on Traffic Signal Systems (AHB25) peer-reviewed this paper (19-03244).