
Abstract
The macroscopic fundamental diagram (MFD) measures network-level traffic performance of urban road networks. Large-scale networks are normally partitioned into homogeneous regions in relation to road network topology and traffic dynamics. Existing partitioning algorithms rely on unbiased data. Unfortunately, widely available stationary traffic sensors introduce a spatial bias and may fail to identify meaningful regions for MFD estimations. Thus, it is crucial to revisit and develop stationary-sensor-based partitioning algorithm. This paper proposes an alternative two-step partitioning algorithm for MFD estimations based on information collected solely from stationary sensors. In a first step, possible partitioning outcomes are generated in the road networks using random walks. In a second step, the regions’ MFDs are estimated under every possible partitioning outcome. Based on previous work, an indicator is proposed to evaluate the traffic heterogeneity in regions. The proposed partitioning approach is tested with an abstract grid network and empirical data from Zurich. In addition, the results are compared with an algorithm that disregards stationary detectors’ biases. The results demonstrate that the proposed approach performs well for obtaining the quasi-optimal network partitions yielding the lowest heterogeneity among all possible partition outcomes. The presented approach not only complements existing literature, but also offers practice-oriented solutions for transport authorities to estimate the MFDs with their available data.
Recent advances in traffic flow theory as well as an increasing number of field experiments show that the aggregation of traffic flow and density (or speed) can yield a well-defined relationship representing the macroscopic fundamental diagram (MFD) ( 1 – 6 ). The MFD captures the traffic dynamics of urban road transportation networks ( 7 – 9 ) and therefore allows to advance traffic performance monitoring and network-wide traffic control to optimize mobility and infrastructure use ( 10 – 15 ). However, heterogeneous traffic distributions and biased traffic sensors make it difficult to identify well-defined and reproducible MFDs ( 3 , 16 – 21 ).
Identifying regions that are homogeneous with respect to their traffic dynamics has become a promising path of research, attracting much attention and effort. Several benchmark studies have developed partitioning approaches toward static or dynamic homogeneity patterns. Most of these studies, however, assumed the availability of perfect information (on all or a sub-set of links) to identify temporal and spatial traffic patterns. In other words, the existing approaches partition networks into regions under the conditions that unbiased link speed, flow, or density measurements are available ( 17 , 22 – 25 ), or clustered measurements based on the distance to the city center ( 26 ). This, in the real world, is too idealistic, as the dominant data collection technology consists of limited, sparsely distributed and stationary sensors, such as loop detectors or induction radars ( 27 ). While GPS-like, high resolution data, for example, floating car data (FCD) from navigation service providers, are available for traffic state estimation, they remain often inaccessible to transport authorities and researchers. In addition, FCD can introduce a significant bias, as their spatial and temporal distribution cannot be assumed to be homogeneous ( 21 , 28 ). It is thus crucial to revisit and develop stationary-sensor-based approaches, which will remain the major data source in the foreseeable future.
An important problem that arises with stationary sensors is their potential bias resulting from their placement ( 3 , 4 , 29 ). This results in MFD estimates that are sensitive to the spatial distribution of the stationary sensors. For example, if all sensors are placed very close upstream of a traffic signal, the MFD’s density will be overestimated because of recurrent queues. Literature suggests two correction methods. Whereas one method corrects the individual measurements, using detailed traffic information, the other can correct for such bias only collectively using multiple sensors simultaneously, but without the need for detailed traffic signal data ( 3 , 27 ). Given that generally the access to traffic signal data is limited, the latter method was selected to account for the bias. Previous work introduced a correction method that can correct for such issue; however, only collectively ( 3 ). In other words, not every measurement is corrected, but the resulting MFD. A comparison of individual measurements (and their respective heterogeneity levels) is therefore meaningless—only aggregated and corrected measurements are valid. This significantly complicates the search for a suitable partitioning algorithm, whose aim might be to minimize traffic heterogeneity for the identified regions. Therefore, to be able to quantify a region’s traffic heterogeneity, the sensors’ placement distribution needs to be taken into account. In other words, the heterogeneity levels can only be determined for pre-defined regions—which is the inherent part of a partitioning algorithm.
Measurements from stationary sensors might not only be biased as a result of their location within the length of the link, but they usually do not cover all links in the network. Thus, it is not advisable to partition a network based solely on their location. To account for such complexity, the authors propose to first generate many potential partitions of the road network based only on its topology, as topology is considered indeed a determinant of the MFD shape and the distribution of traffic ( 8 , 30 , 31 ). In a second step, the heterogeneity of each partition and its regions is then evaluated. For the first step, community detection techniques that allow to group links in a road network are employed ( 25 , 32 ). Comparing to classical cluster algorithms where infinite number of possibilities can be generated and then selected (e.g., enumeration based), community detection attempts to discover “behavioral” similarities. Given that the correlation of traffic dynamics on links generally decreases with increasing distance, such techniques to generate potential network partitions were deemed suitable. By varying the inputs to the community detection algorithm slightly, many different partitions can be generated, whose corrected MFD and heterogeneity levels can be evaluated individually. The partitioning outcome that results in the lowest heterogeneity can then be chosen as the quasi-optimal solution. Note that the solution from the proposed algorithm is only quasi-optimal and of approximative character, because the shape of the homogeneous neighborhoods depends on the spatial coverage of the stationary sensors that are available and their distribution within the length of the links considered. Nevertheless, the proposed algorithm is the first to account for the complexity of stationary sensors and provides a practical and very useful answer to the network partitioning problem. This approach takes into account, on one side, the connectivity of the network by searching for suitable clusters using random walks, and on the other side, it corrects for potential placement biases of loop detectors. This allows generation of geographically contiguous clusters with a low heterogeneity. The proposed portioning algorithm is static, as the algorithms by Ji and Geroliminis ( 17 ) and Saeedmanesh and Geroliminis ( 22 ), but the day-scale heterogeneity is measured instead of a short period of time to obtain an aggregated 1-day insight into congestion propagation.
The remainder of this paper is organized as follows. The next section describes the partitioning algorithm in detail. Then, the proposed algorithm is applied to an abstract grid network and empirical data from Zurich, Switzerland, and its results compared with an algorithm not taking into account the loop detectors’ biases. This paper then ends with a discussion of the contribution of this methodology.
The Partitioning Algorithm
The proposed methodology consists of two parts: (i) the generation of partition outcomes, and (ii) the MFD estimation and evaluation of heterogeneity. In the following, the authors first focus on the estimation of the MFD from stationary sensors, before discussing the generation of partition outcomes.
MFD Estimation
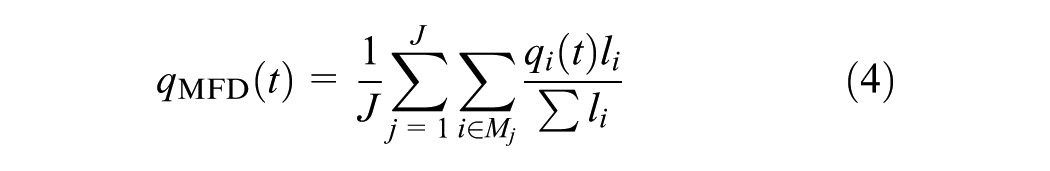
MFDs are estimated from stationary traffic sensors by averaging link flows


As mentioned before, an important issue with stationary traffic sensors is that

To then obtain an unbiased estimate of
Last, the space-mean speed in the MFD
Network Partitioning using Community Detection
The correction method introduced in the previous section requires a priori knowledge on the stationary sensor’s placement. Thus, a potential partitioning algorithm needs to take this into account. As it is generally impossible to know the influence of the placement bias before defining the region, the authors propose to generate and evaluate many potential partition outcomes first. A naive approach could be to repeatedly generate random clusters of the stationary sensors. This, however, would disregard additional information, which is given by the network layout. In urban road networks not all links are connected with all other links, making them similar to a small-world network ( 32 ). In the literature, identifying communities in such dynamic systems can be solved with community detection methods. The community detection algorithm used in this work was defined and implemented by Pons and Latapy ( 33 ). It essentially searches for dense subgraphs, the so-called communities, in a large graph. Such communities can be captured by random walks on the edges (i.e., links) of the directed graph. The intuition behind the algorithm is that communities are likely to cover dense areas of the graph. In other words, for road networks, such community-search can always ensure the connectivity within the communities, that is, the subgraph. Furthermore, the edge weights are the geographic distance between nodes and thus ensure that more distant nodes have a lower probability of being in the same community.
In this analysis, this type of approach is applied to find communities or, in relation to traffic, possible partitions of the network, using a random-walk search algorithm that results in boundaries derived from network topology ( 25 , 34 – 37 ). This is an intuitive approach because much of the MFD’s shape is attributed to the network topology and traffic control schemes ( 25 ). Thus, the objective is to ensure sufficient initial partitions generated with reasonable community features, so that small fluctuations in the generation of partition samples is ensured by varying the step size in the random-walk process. Furthermore, the targeted number of regions that should be retrieved from the community detection algorithm was also varied.
In total,
To demonstrate the approach, the partitioning algorithm is applied on a real-world example, the network of Zurich, Switzerland. Figure 1 shows the network used and three possible outcomes of random walks in the road network. First thing to note is that the regions are all contiguous. In addition, the three outcomes show that they differ in their number of regions and the way they split the city. In other words, when a large number of partitions are generated, some might differ substantially, with some outcomes potentially representing the optimal or quasi-optimal partition of the network.
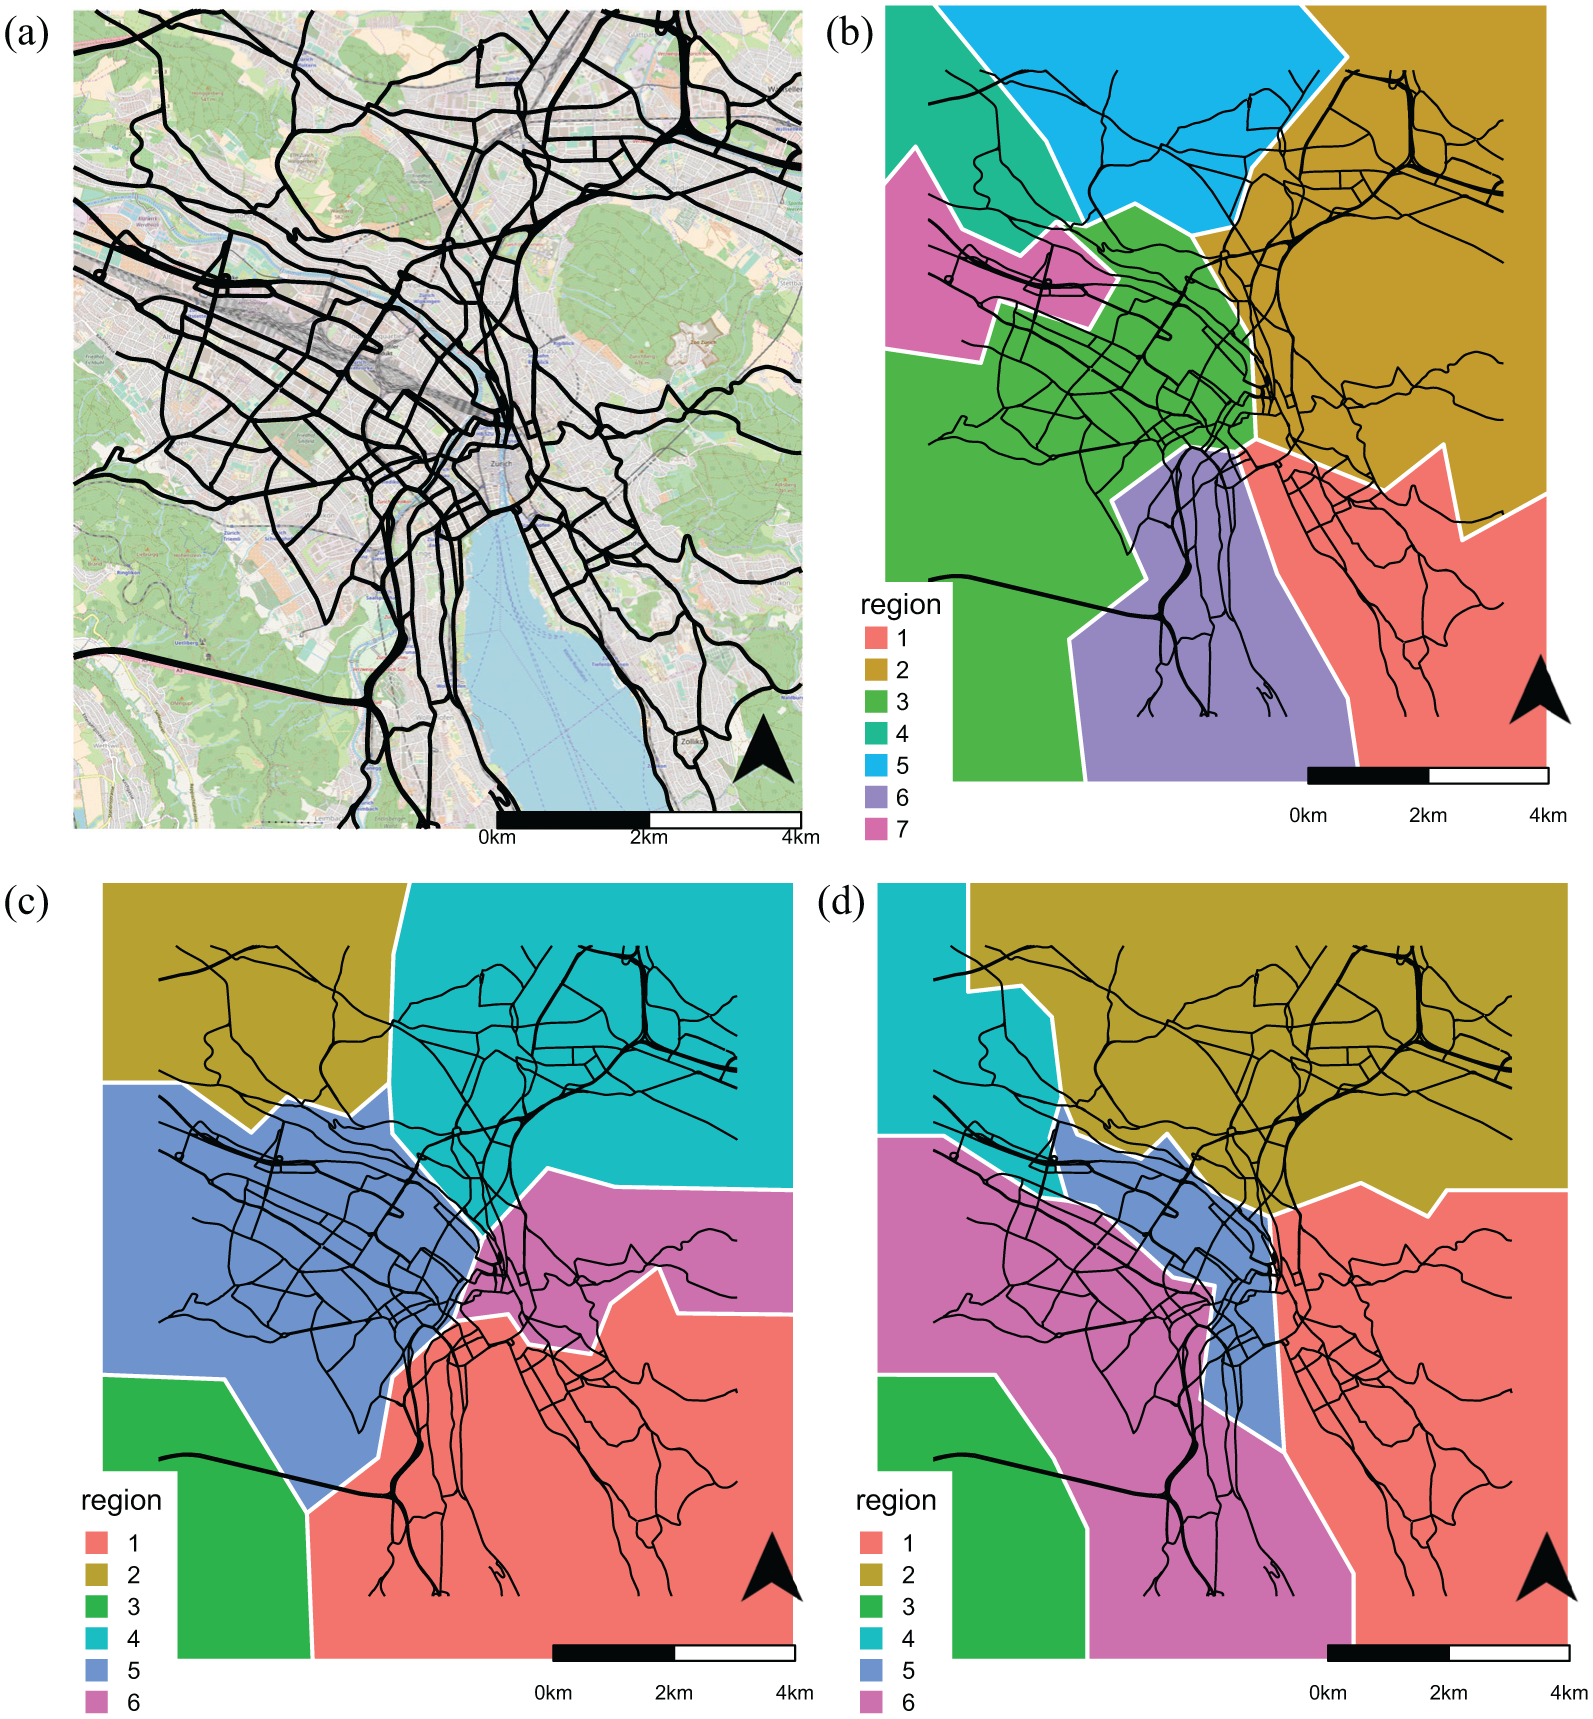
Examples of neighborhood detection with random walks using the road network of the City of Zurich. (a) A simplified graph representation of the considered road network. Background map from OpenStreetMap; (b) Example A of a neighborhood detection outcome, five regions; (c) Example B of a neighborhood detection outcome, six regions; and (d) Example C of a neighborhood detection outcome, six regions.
For the MFD estimation by region, the information from sensors located within each community or region is then used. Therefore, the sensors need to be assigned o their region. This task is, in particular, necessary for sensors that are located at the boundaries. To this end, the Voronoi polygons around the intersections were built and all polygons of the same community or region amalgamated together. The resulting polygons are then used to identify the region membership of the sensors.
Evaluation of Partitions
For all

Arguably, the more heterogeneous a region is, the more likely it is that a small number of sensors show large deviations from the mean estimated with all the measurements. The parameter
To illustrate this evaluation procedure, the partition methodology is applied to a grid network with two a priori known regions with very different MFDs: At any given moment in time, the left side of the grid network shown in Figure 2a (black points) has a three times lower flow per link than the right side of the grid (gray points). In both cases, the densities are identical. It is clear that an optimal partition would cluster the grid into these two regions. This is also the case when using the partition algorithm. As a matter of fact, when generating
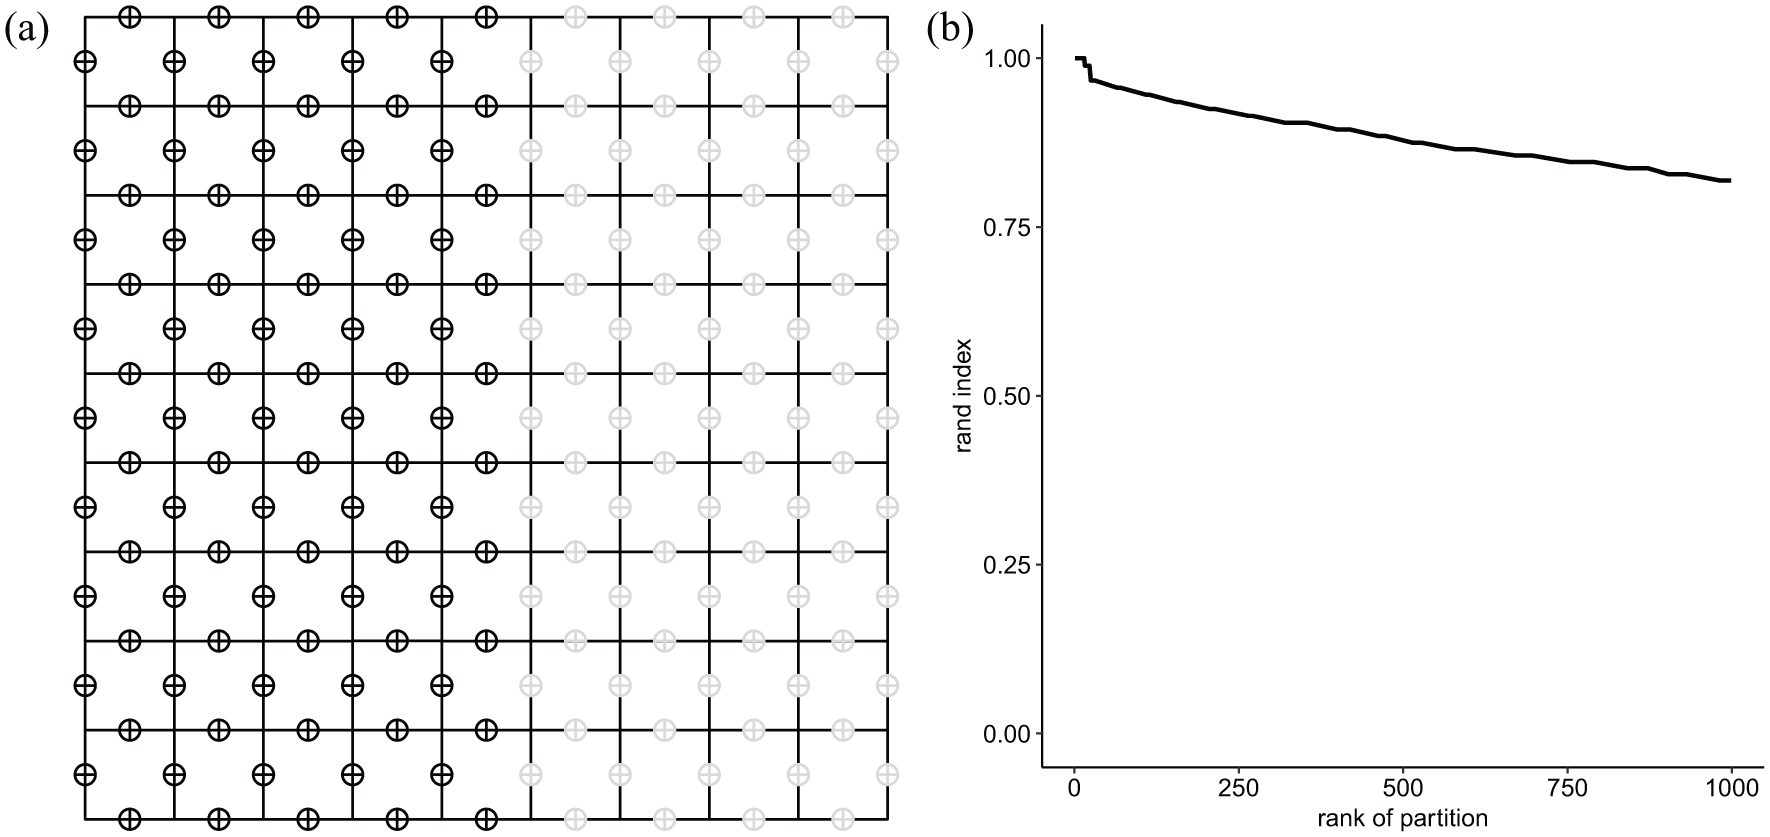
Example of an abstract grid network. (a) Abstract grid network with pre-defined regions. The back loops that measure a flow three times lower than the gray loops at any given time and (b) similarity of partitions based on the rand index. The rank of the partition is defined by its level of heterogeneity.
In summary, the proposed methodology consists of two parts: (i) the generation of meaningful and network-specific partition outcomes using random walks, and (ii) the estimation of an unbiased MFD and its heterogeneity. In the next section, the methodology will be applied to a real-world case.
Data
Before the proposed methodology is applied to a large-scale loop detector data set from Zurich, Switzerland, the empirical data set will be introduced. The preparation of the traffic data and then the road network graphs are briefly described.
Traffic Data
Loop detectors typically record flow
Road Networks
To identify communities, the focus is on roads with a connecting function and thus excludes all residential and service roads. In the context of OSM, the functional road class attributes of the chosen roads are tertiary, secondary, primary, and trunk roads (the same kind of roads are chosen for the traffic data). A directed graph from the road network is then created ( 39 ). In addition, the network’s connectivity and comprehensiveness is validated, link attributes partially updated, and intersections simplified so that a simple four-way intersection is represented by a single node. Last, street segments are amalgamated at pseudo-nodes, that is, a node with degree two if there is no signalized intersection.
Empirical Partitioning Results
Partitioning Based on Community Detection
For the presented data set 10,000 random partitions were generated. Given the city of Zurich’s size of around 80 km2, the number of regions per partition was chosen to range from 5 to 12, respectively, with a minimum region size of 2 km2, and the weekday data were resampled 1,000 times at a sample size of 0.5. The minimum number of loops required per cluster is 20. Figure 3 shows the best partitioning outcome, in which each color corresponds to one cluster. It can be seen that the partitioning outcome found has five regions. Interestingly, the partition identifies topographical boundaries, such as the lake of Zurich or the hill range to the north west of the city. Here the algorithm finds the correct topographical borders, without any additional information. Moreover, the five regions follow more or less the boundaries of the control regions that the city has defined for its traffic management strategy. This can be seen as a further confirmation of the algorithm. Figure 3b shows the previously introduced rand index comparing every partition outcome to the best partition shown in Figure 3a. It is shown as a function of the rank of the partition, in which a higher rank represents overall higher heterogeneity. Recall that the rand index measures how similar a partition outcome is, and higher values indicate higher similarity. Therefore, one would expect that comparing the best and one of the worst partitions in relation to heterogeneity yields very different regions, and thus a low rand index. Conversely, if the partition algorithm is robust, it is expected that the best partitions in relation to heterogeneity have a relatively high rand index. Compared with the abstract grid, the curve in Figure 3a exhibits higher variations and seems less smooth. The reasons for this behavior are twofold. First, the complexity and size of Zurich’s network is not comparable to a simple abstract grid, for example, one-way roads, and so forth. Second, the correction method has a non-linear effect on the partitioning. In other words, two partition outcomes, that partition the city almost identically, might result in relatively different MFDs (because of the correction method) and in turn different levels of heterogeneity. Nonetheless, a trend is apparent: with decreasing partition ranks, the difference to the best ranking partition also decreases, confirming thereby the quality of the partitioning algorithm. In addition, the relatively stable decrease observed in the moving average trend (in gray) indicates that 10,000 random partitions are enough to find a quasi-optimal solution.
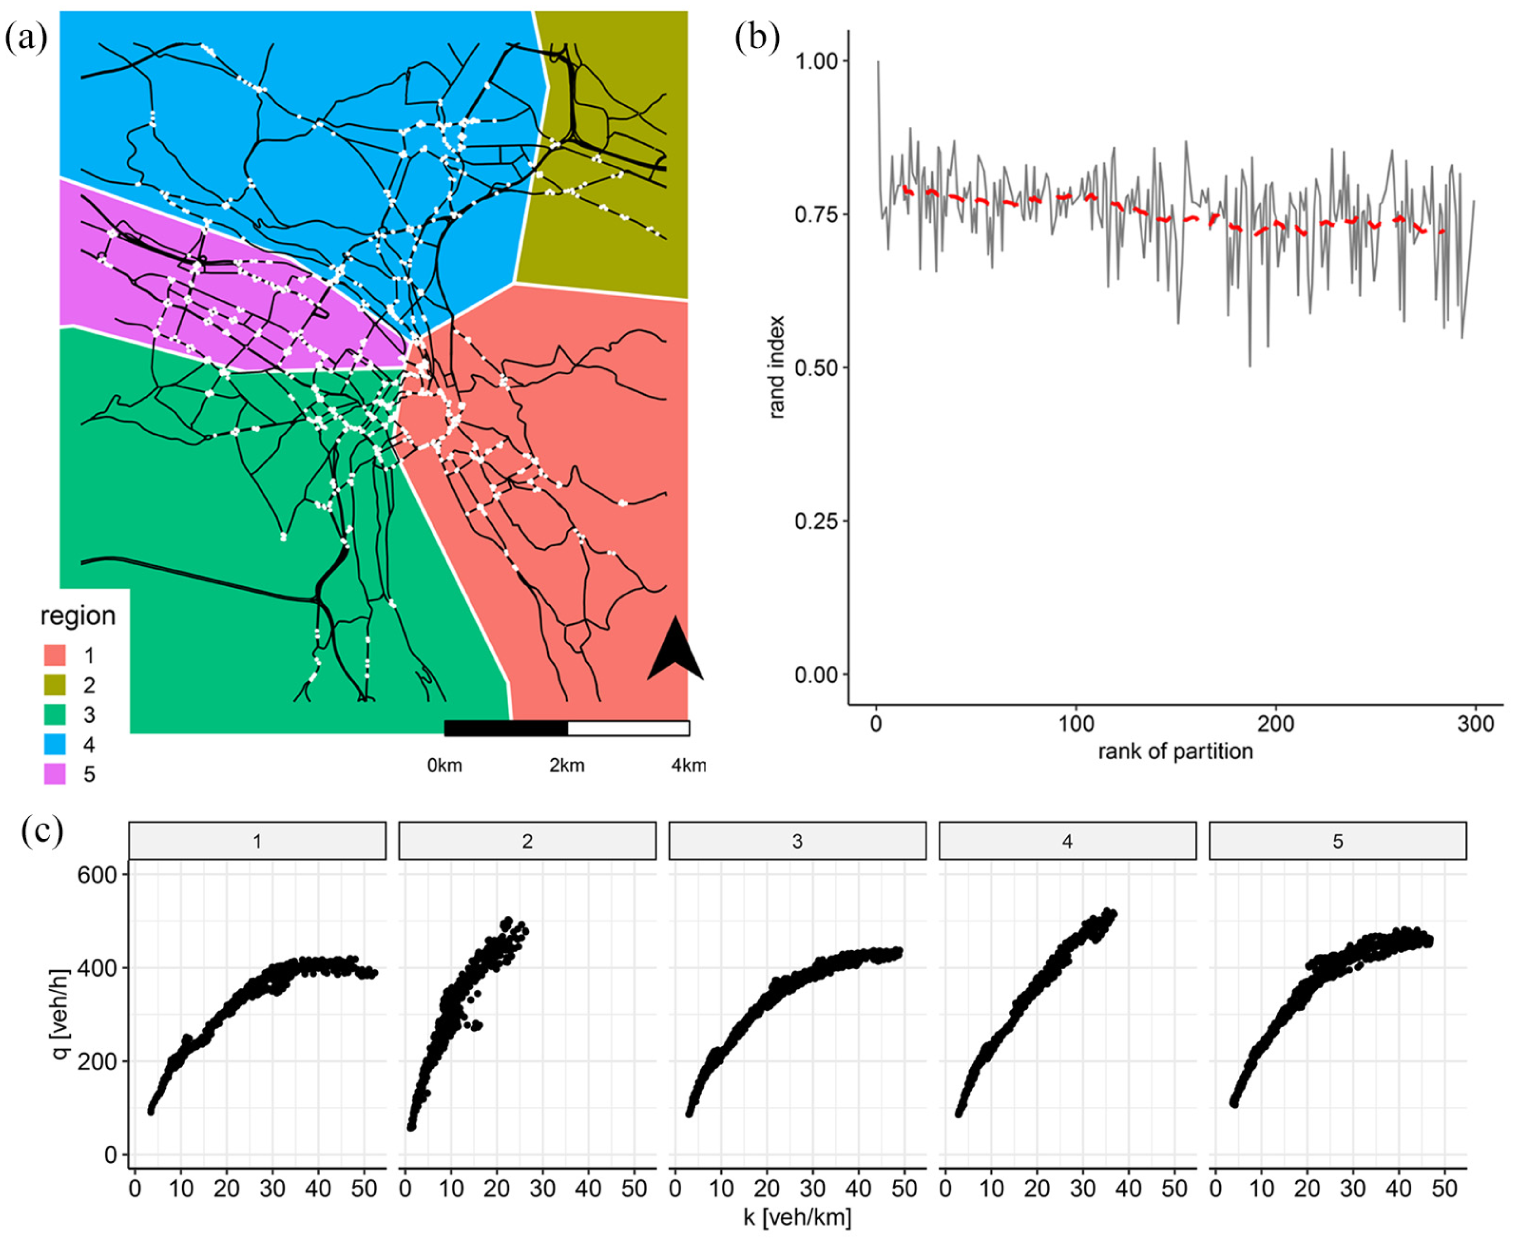
The best partitioning for the city of Zurich. The white dots represent the location of the loop detectors. The MFDs are shown for each of the regions of the best partition outcome. (a) Best partitioning for Zurich. Five regions can be identified. The regions are found to respect topographical boundaries, such as the lake of Zurich or the hill range to the north west of the city; (b) Rand index measuring the similarity of the partitions to the best partitioning for Zurich. The rank of the partition is defined by its level of heterogeneity. A moving average is added to the series as a dashed line; and (c) MFDs for the regions of the best partitioning for Zurich. Data from five weekdays, each point represents a 3 min interval.
Figure 3c shows the resulting MFDs for 5 days for each cluster found by the best partitioning for Zurich. All MFDs are well defined and show an uncongested branch, with regions 1, 3, and 5 being the only ones reaching saturation. This is not surprising as regions 1 and 2 represent the right and left side of the lake and include the city center. Region 3, on the other hand, covers the inflow from the highway to the city. In addition, the city’s perimeter control affects these three regions. By extending red times at certain intersections, it aims at reducing congestion in the city center ( 40 ).
Comparison with an Algorithm that Disregards Stationary Detectors’ Biases
In the following, the obtained results are compared with an algorithm that disregards the placement biases from stationary detectors. Based on the methodology given in Ji and Geroliminis (
17
), the dissimilarity matrix
It is important to note that in this case
Figure 4a shows the clusters found for an average evening peak hour during the analyzed week, if the spatial constraint is completely relaxed. Thus, the clusters are based only on the dissimilarity matrix
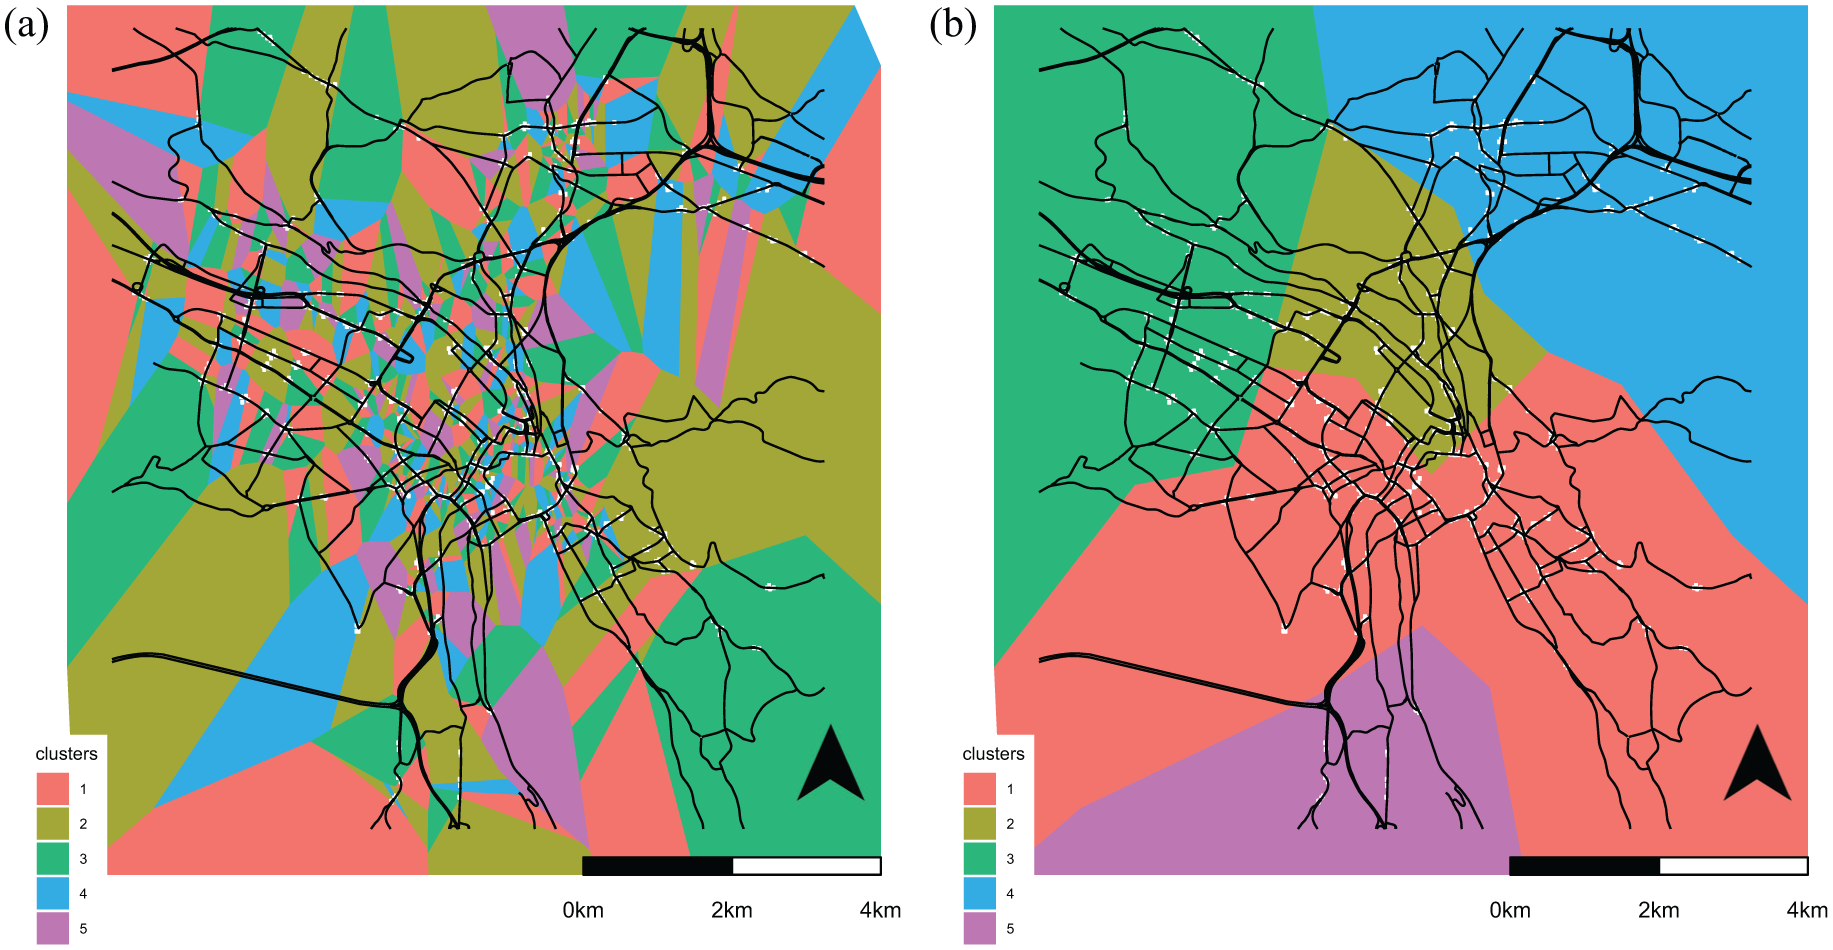
(a) Partitioning based on biased loop detector measurements without geographical constraints. (b) Partitioning based on biased loop detector measurements with geographical constraints.
In Figure 4b, we then cluster
Conclusion
In this paper, the authors propose a novel network partitioning approach for MFD estimation, especially for data from stationary sensors in which the estimations of network-level densities are usually biased.
The methodology is a suitable alternative for network partitioning for three main reasons. First, given the biases of stationary detectors, a partitioning based on their data alone would lead to a sub-optimal partitioning. Second, it is reasonably argued that an uneven distribution of traffic is also a reflection of certain features of the road network topology. Third, the authors make use of the fact that the network topology affects the shape of the MFD. Thus, the proposed approach does not replace current approaches on network partitioning, but extends this important field to empirical data from stationary detectors—a data source that is still predominantly used in traffic management and control. The proposed approach identifies homogeneous regions using a two-step procedure. In a first step, possible partitioning outcomes are generated based on community detection in the road networks using random walks. In a second step, MFDs are estimated for every possible partitioning outcome and corrected for potential placement biases. In the end, the partitioning outcome with the lowest average heterogeneity is chosen.
The applicability of the proposed method using an abstract grid network was shown. The authors then demonstrated, using empirical data from Zurich, that the method is capable of finding homogeneous regions in a large city. The results are promising, as they showed how the partitioning reduces heterogeneity. In fact, the partition outcome with the lowest heterogeneity value, as defined by the heterogeneity index, is reliable and not very sensitive to partition settings. The proposed method is flexible and pragmatic to apply, as it only requires a graph representation as an input for the generation of potential regions that are contiguous regions and contain a connected road network by the very design of the algorithm. Moreover, it is the first network partition algorithm that accounts for the biases from stationary sensors. Nonetheless, it is worth mentioning that the spatial distribution of the stationary sensors limits to some extent the MFD’s accuracy. The proposed approach is valuable for networks in which the distribution of the loop detectors positions with respect to the length of the links covers a certain range, that is, some are placed in front of a signal, some in the middle of a link, and others far upstream. If, for example, loop detectors are distributed in a very similar way, for example, all loops are located in front of the traffic signal, there is no need to correct for the bias in the context of a partitioning algorithm. Given that in such case all loop measurements are biased in the same way, we can partition on the biased measures with the existing partitioning. Future research will investigate potential improvements to the method, when using the network’s dual graph and other community detection algorithms, such as Lévy flight. In addition, future research will address a time-dynamic partitioning. For example, for a given time slice and density we could use as a criterion the variance in observed flows. Another approach would be to quantify the MFD shape with a functional form in each analyzed partition to finally select that partitioning outcome where all MFDs are well defined with low heterogeneity ( 5 ).
Footnotes
Acknowledgements
This work was supported by ETH Research Grants ETH-04 15-1 and ETH-27 16-1. This research was also supported by the National Science Foundation Grants #KG12017301. We wish to acknowledge the support by Gian Dönier, Urs Birchmeier and Karl Weberruss from Zurich.
Author Contributions
The authors confirm contribution to the paper as follows: study conception and design: LA, AL; data collection: LA, AL; analysis and interpretation of results: LA, AL, NZ, MM; draft manuscript preparation: AL, LA, NZ, MM, KWA. All authors reviewed the results and approved the final version of the manuscript.
The Standing Committee on Traffic Flow Theory and Characteristics (AHB45) peer-reviewed this paper (19-02327).