
Abstract
This paper explores the propagation effect of flight delays among airports in the aviation system and proposes a new measure, the propagation index, to effectively analyze the interrelationship among airports in relation to flight delays. This index quantifies the effect of delay propagation by measuring the causality among delay time series. To assess the effectiveness of the proposed index on airport delays, three neural network-based regression models are built. The comparative experiments demonstrate that the propagation index proposed is highly correlated with observed airport delays.
Delay propagation causes increasing operational disturbance and worsens the performance of air transport systems ( 1 ). As a single aircraft is normally assigned to a sequence of stages/flights among many cities, the arrival delay of a former segment tends to affect the departure of the aircraft for the next segment, causing further arrival delays. Sometimes the turnaround time scheduled at an airport is long enough to absorb the arrival delay; however, this could still result in passenger delays, as connecting passengers may miss their connections because of the arrival delay. Moreover, given that flights of the same airline serving the airport share ground crew teams, the arrival delay of one flight may affect other flights of this airline. Further, flights share ground facilities such as runways and gates, so the arrival delay of one flight will also affect many flights of other airlines serving the airport. As a consequence, delays may accumulate from early morning to late night, exacerbating the operational problems for the airport over the day ( 2 ).
The research community has paid extensive attention to delay propagation. The research on delay propagation can be traced back to the 1990s, when Boswell and Evans developed an analytical model to estimate the delays for successive flights and found that the downstream delay was approximately 1.8 times the initial delay ( 3 ). Beatty et al. defined the delay multiplier (DM) and analyzed the relationship between the potential downline delay and initial delay ( 4 ). Inspired by these reports, several recent studies have investigated the cascading effect of flight delays. Liu et al. established a flight delay propagation model based on Bayesian networks (BN), which showed evident propagation from arrival delays to departure delays ( 5 ). AhmadBeygi et al. introduced the quantitative tool for assessing the ramifications of an individual flight delay throughout the network ( 6 ). In addition, Laskey et al. applied BN in a stochastic model and identified the departure delay as the major factor driving the final arrival delay at the destination airport ( 7 ). Kondo created a new DM to assess the repercussion of the initial delay on all subsequent flights and adopted it to demonstrate how the reduction of the initial delay helped lead to a higher reduction in the propagated delays ( 8 ). Furthermore, Belkoura et al. ameliorated the DM by integrating linear and nonlinear indicators to differentiate various situations, revealing the relationship between the inbound and outbound delays ( 9 ).
Despite these previous efforts, gaps still remain in the understanding of the propagation effect in flight delays. The studies mentioned above can effectively model how an initial delay affects the subsequent entire-system delays. However, there are fewer studies by far proposing an index to clearly quantify the propagation effect among different airports. A proper index is hard to compute because detailed dynamics behind the diffusion of propagation are still difficult to characterize, in particular because of the overlap of connected sources, that is, aircraft, crew, passengers, buffers built into flight schedules, and so forth (10–12). In this study, the delay propagation index (PI) for a pair of airports is proposed from a new perspective. Transfer entropy is used to perform causality tests on the delay time series of two airports and then to explore the dynamics of delay propagation, revealing the combined effects of all the visible and latent factors that lead to delay propagation. The properties of delay propagation are further examined at the system level and an estimation model similar to the one described in ( 13 ) developed to demonstrate the effectiveness of the PI in the air transport system.
The remainder of the paper is organized as follows. The next section describes the methodology, including the concept of transfer entropy-based causality tests and the definition of the proposed PI. The third section presents an empirical analysis and estimation model based on the data set of the air transport system of China. The final section concludes this study and provides some further discussions.
Methodology
In this section, a PI to quantify the delays propagated within the air transport system is introduced. The overall approach is based on the fundamental observation that the delays in some airports have structural dependencies caused by the delays propagated from other airports. To capture this kind of dependency, the time series X is constructed to capture the arrival delays of flights from Airport A to Airport B, and the time series Y to characterize the departure delays of all flights departing from B. The selected time-series analyzing tool should be able to (a) measure the amount of directed transfer information from time series X to time series Y and (b) generalize the property of the air transportation system, that is, non-linearity ( 9 ). With these two features taken into consideration, the study chooses a causality test approach, transfer entropy, to perform the individual test between each pair of airports.
Delay Time Series
To capture the structural dependencies of different airports, two types of delay time series are developed in this step. Here, the focus is on daily time series because daily interactions are the finest temporal resolution in the flight data set. The 24-h period is divided into 96 15-min time intervals ( 14 ). For Airports A and B, the departure delay time series X is constructed (15–17). The component value d_dep (t) of X represents the total departure delay of flights taking off from Airport A during (t, t+ 1), t∈{0, 1, 2 …… 95}. The arrival delay time series Y is also constructed, and the component value d_arr (t) of each interval represents the total arrival delays of flights from Airport A to B during (t, t+ 1), t∈{0, 1, 2 …… 95}.
Transfer Entropy
Definition and Application of Transfer Entropy
Transfer entropy can measure the amount of directed (time-asymmetric) transfer of information between two random processes ( 18 ). In detail, a signal Y is said to partly cause a signal X when the future of signal X is better predicted by adding knowledge from the past of signal Y than by using the past of signal X alone.
X and Y are the associated time series. Assuming that

where
Equation 1 will be fully satisfied if the past of the arrival delay time series of flights departing from Airport A to Airport B cannot add any information to the prediction of the departure delay time series of Airport B. In other words, there is no causality from Y to X.
To measure the deviation from this condition (i.e., the presence of causality), Schreiber used the expected Kullback–Leibler divergence between the two probability distributions at each side of Equation 1 and defined the transfer entropy (TE) from Y to X as
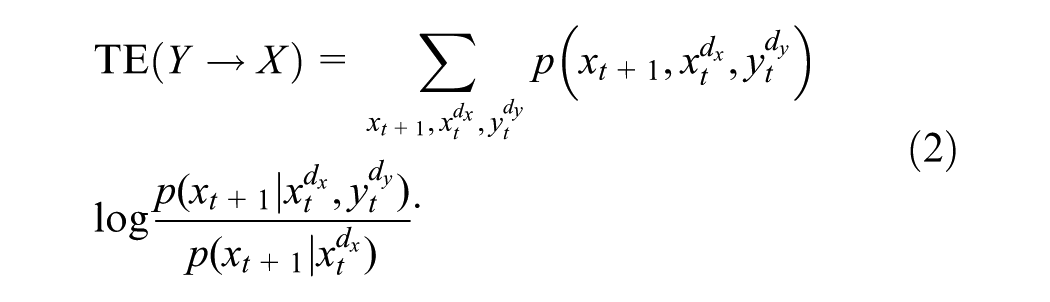
The deviation from the generalized Markov condition caused by delay propagation implies the presence of causality from Y to X, which can also be measured by transfer entropy.
Applying Transfer Entropy
For parameter selection,
In this work, exploring a proper value for
Propagation Index
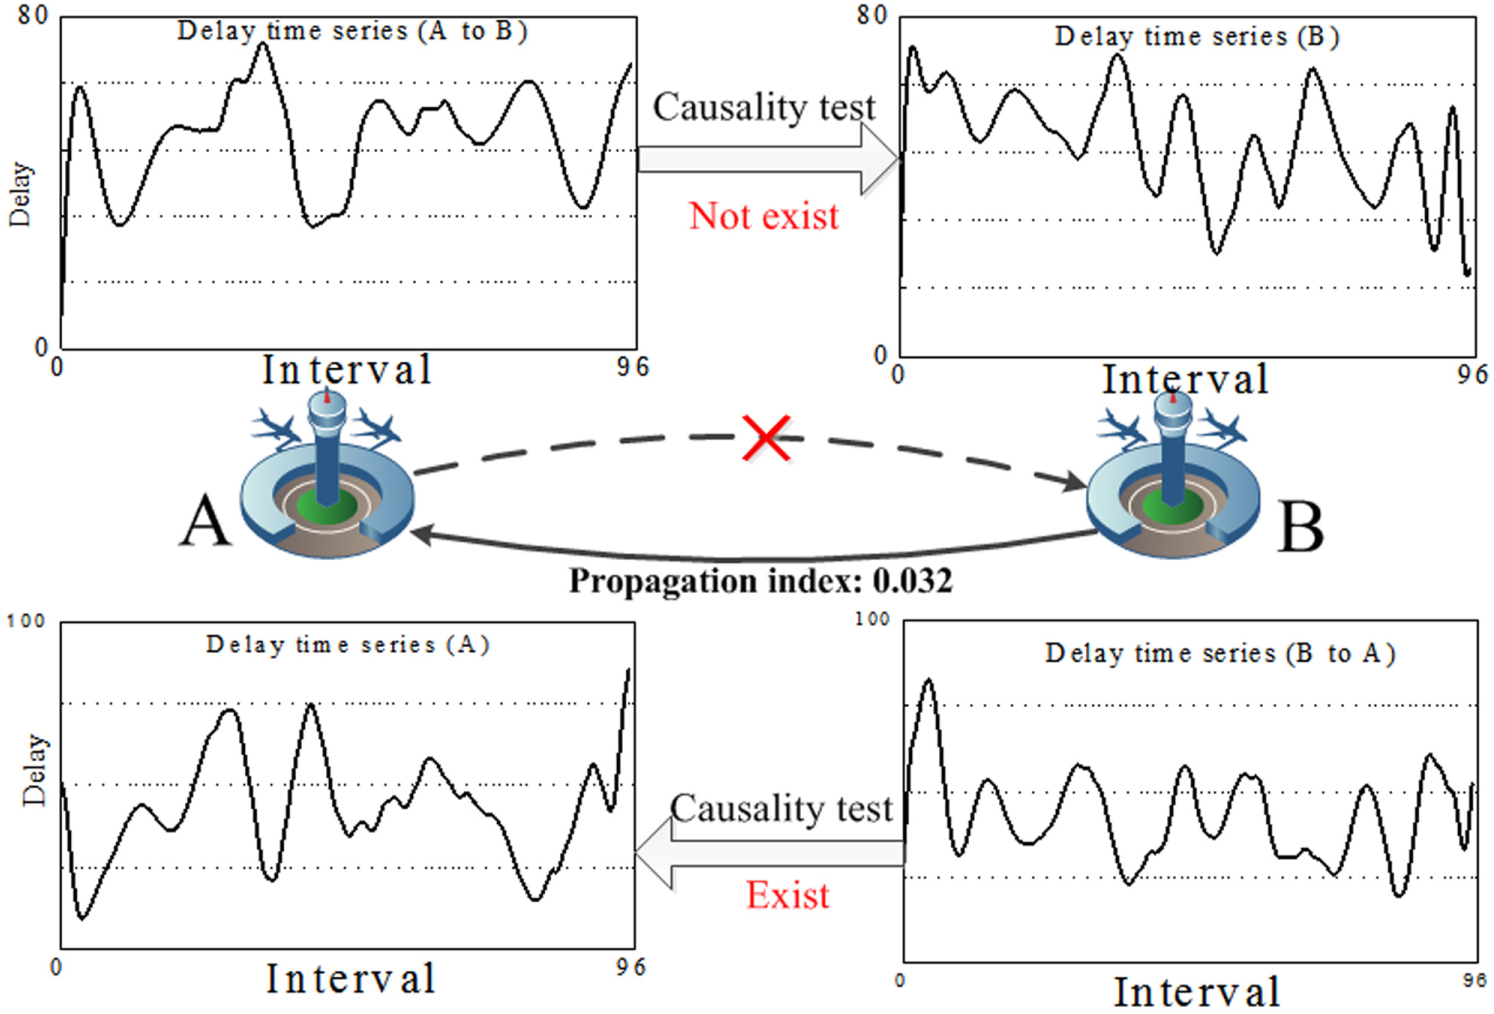
The causality relationship between Airports A and B represents the interactions caused by delay propagation. A P-value of less than 5% indicates a divergence between
Transfer Entropy Results
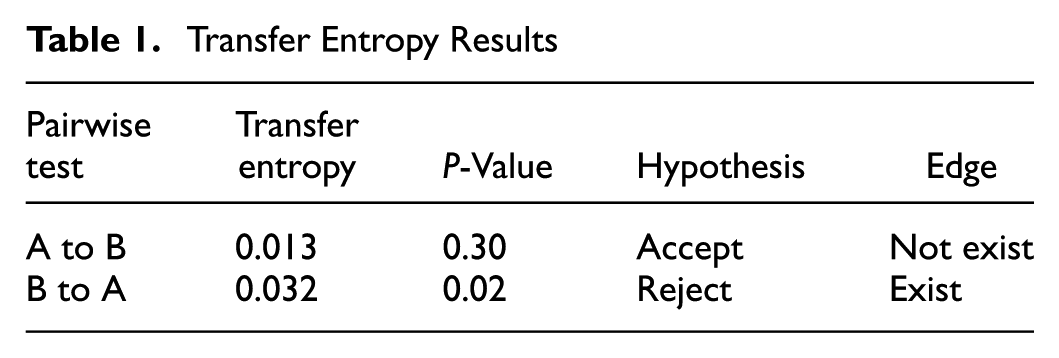
Similar information is presented in Figure 1, in which the influence within the airport pair is represented by a directed edge from Airport B to A. The solid edge indicates that there is causality from the airport at the start node to the airport at the end node, and the dotted edge indicates that no causality exists. The edge weight reflects the amount of information flow from B to A, which is the PI proposed in this paper.
A simple PI.
Case Study on Air Transport System of China
Data Description
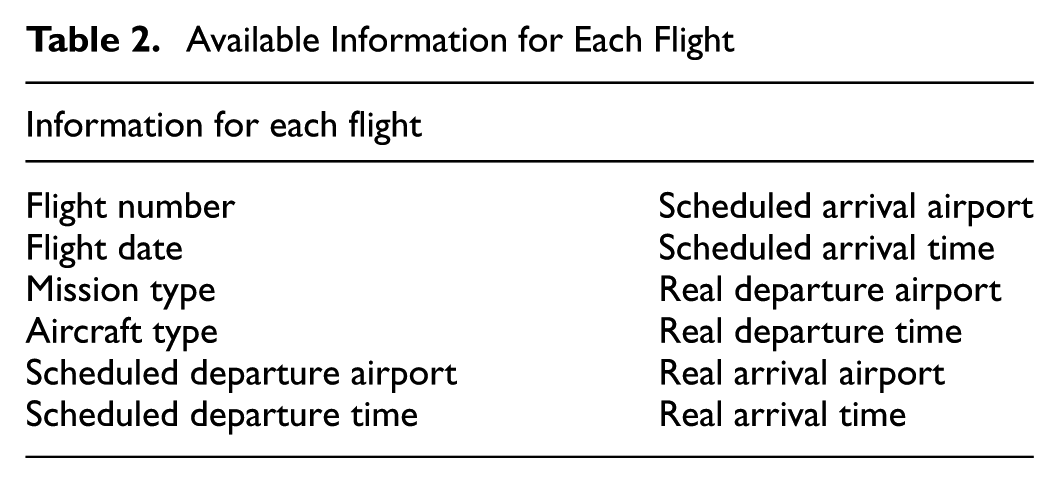
The data set of the case study, comprising all flight information in 2017 in China, was provided by the Civil Aviation Administration of China (CAAC). The database contains 2,638,140 domestic scheduled flights connecting 224 airports. The fields of this data set are provided in Table 2. Additional information is also registered in the data set, such as the cause of each delayed flight. Delay against schedule (DAS) is the most common delay concept in the transport literature and this metric is employed to calculate the arrival and departure delays used in this study ( 23 ).
Available Information for Each Flight
Delay Propagation Analysis
Given the definition of PI, the system-level performance of the propagation effect among airports can be readily explored. Pairwise causality tests to all the airport pairs are performed for each day and a daily weighted delay causality network built for January 2017. Figure 2 shows the network of a typical day (January 3) when there was precipitation in southern China, with nodes representing the airports and edges the directed influence among airports. A higher value of PI (the thicker edge in the figure) means a close dependency between the airport pair because of delay propagation. Among all the 224 airports, 102 airports are connected with other airports according to the delay propagation analysis.
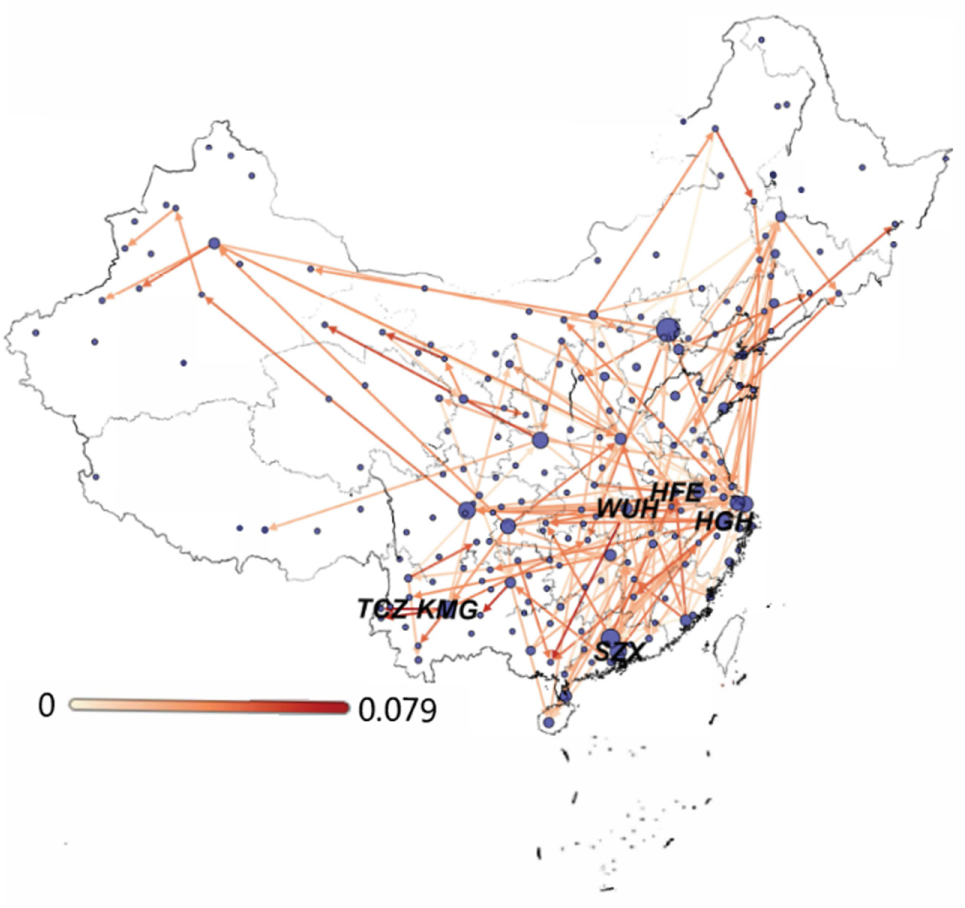
Weighted delay causality network for January 3, 2017.
Table 3 summarizes the network properties. It can be seen that on average each airport is affected by 1.43 upstream airports and affects 1.43 downstream airports. As one of the biggest airports, SZX (Shenzhen Bao’an International Airport) affects seven airports, whereas HGH (Hangzhou Xiaoshan International Airport) has the most influence on downstream airports. WUH (Wuhan Tianhe International Airport) is affected by seven airports and HFE (Hefei Xinqiao International Airport) is the airport most affected by upstream airports. Both WUH and HFE are located in the center of the airline/air route network ( 24 ) and they can be easily affected by other airports because of their higher connectivity.
The Network Properties
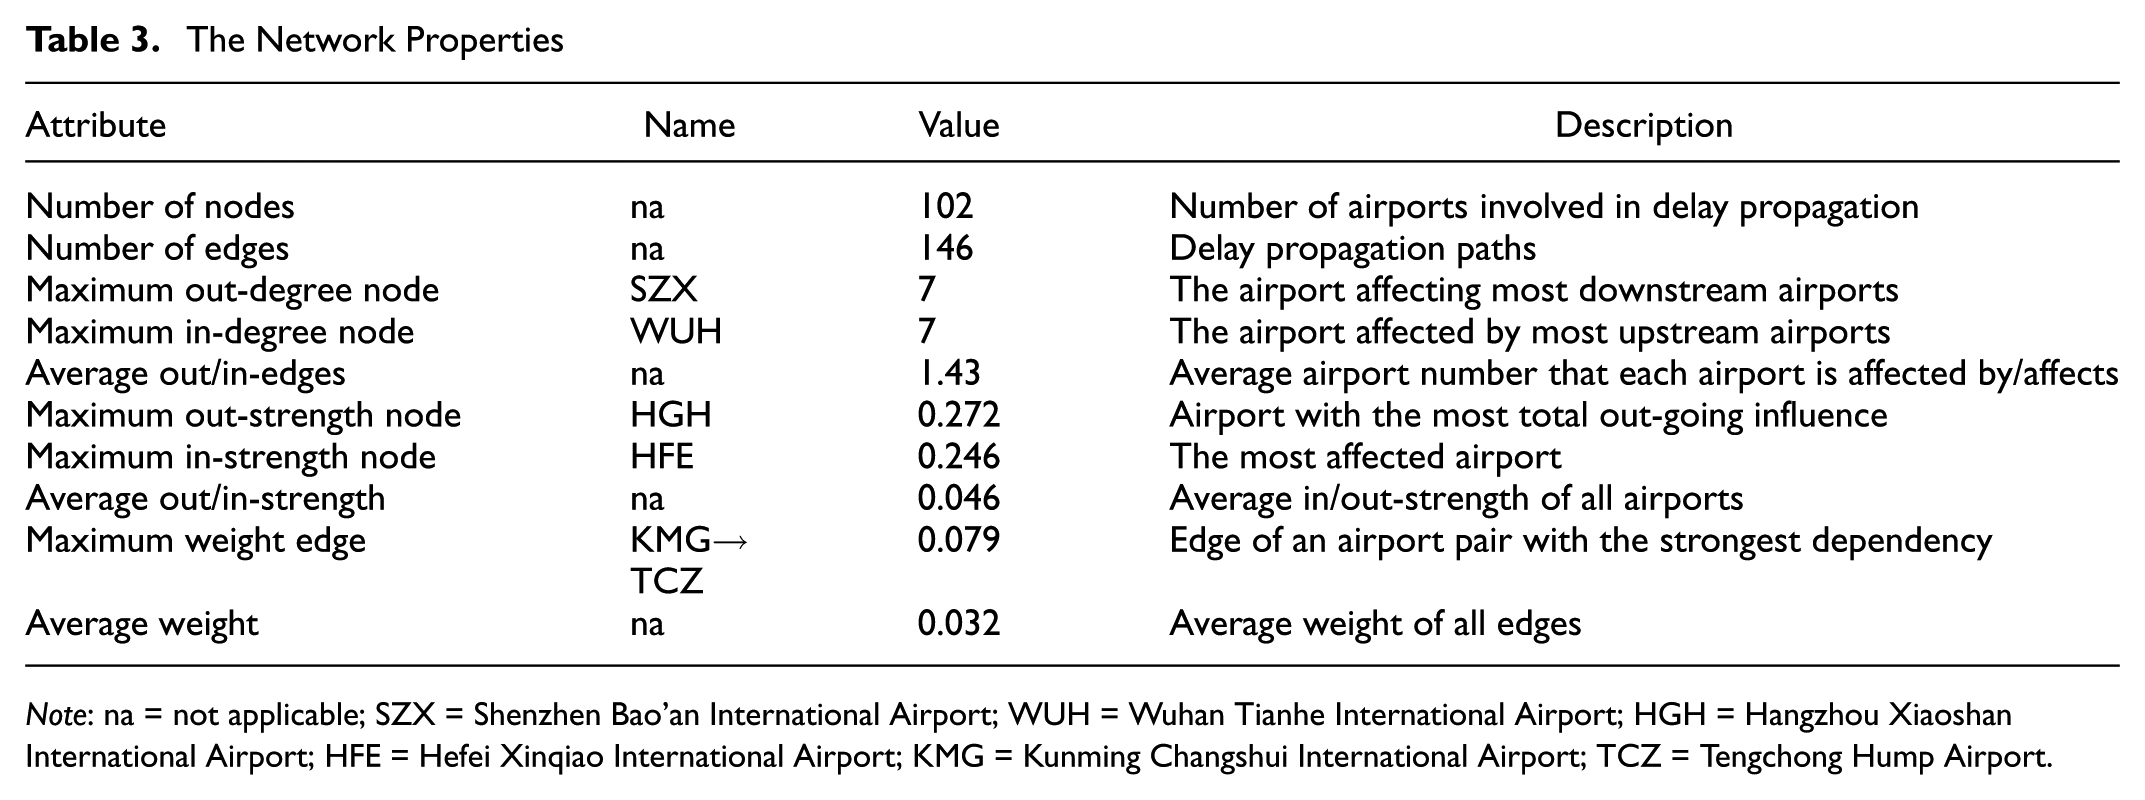
Note: na = not applicable; SZX = Shenzhen Bao’an International Airport; WUH = Wuhan Tianhe International Airport; HGH = Hangzhou Xiaoshan International Airport; HFE = Hefei Xinqiao International Airport; KMG = Kunming Changshui International Airport; TCZ = Tengchong Hump Airport.
The maximum weight edge is from the regional hub airport KMG (Kunming Changshui International Airport) to the branch line airport TCZ (Tengchong Hump Airport). The propagation path from KMG to TCZ appears 116 times during the year of 2017. Three typical days are further investigated (Table 4) to understand the delay propagation between these two airports. On January 3, seven flights from KMG arrived at TCZ with an average delay of 34.1 min, whereas five flights from other airports arrived at TCZ with an average delay of only 2.6 min. Thus, the edge weight of KMG to TCZ is rather large. On January 7, eight flights from KMG arrived at TCZ with an average delay of 23.8 min whereas five flights from other airports arrived at TCZ with an average delay of 16.0 min, so the edge weight is much smaller. Lastly, on January 10, flights from KMG to TCZ encountered shorter average delay than those from other airports. Therefore, the edge weight is zero, which means that the delayed flights from KMG to TCZ have no impact on the departure delay at TCZ. Because most arrival flights of TCZ are from KMG, the propagation path appears at a high frequency (up to 116 times).
Specific Cases
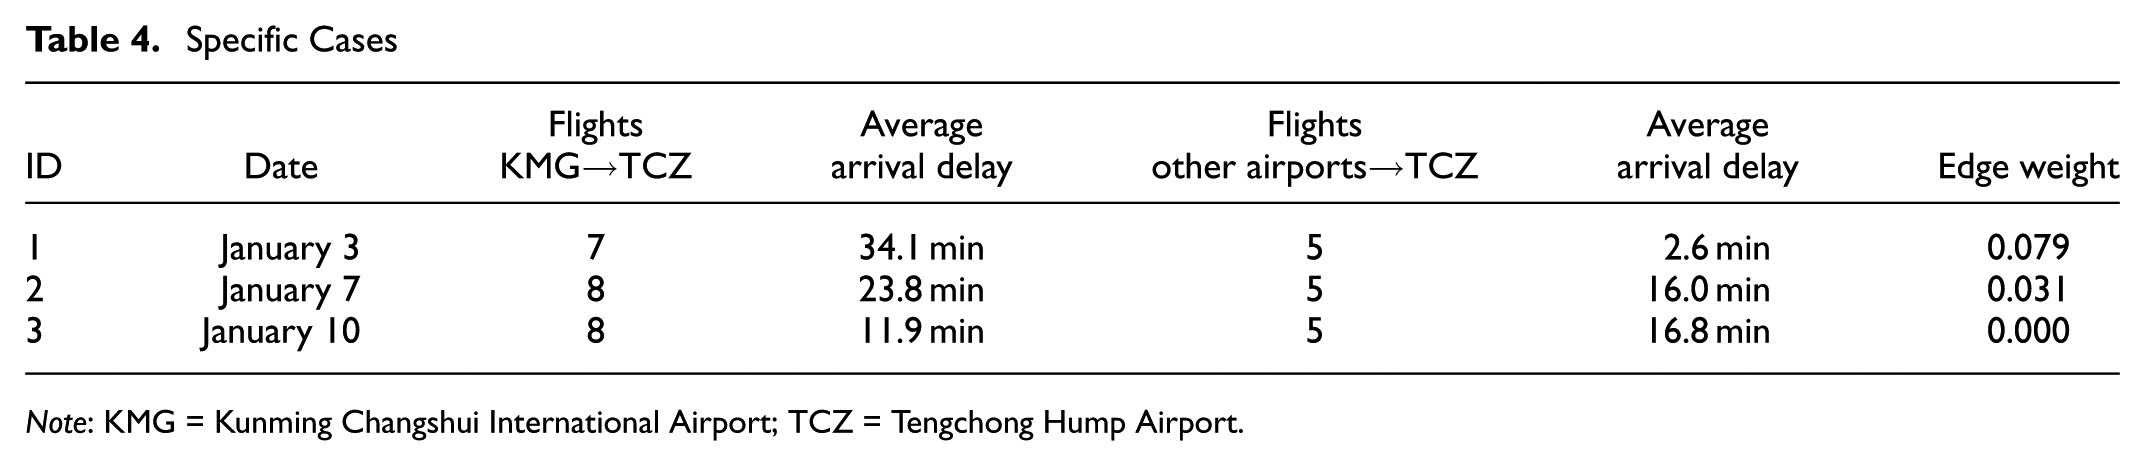
Note: KMG = Kunming Changshui International Airport; TCZ = Tengchong Hump Airport.
Model Estimation
Estimation models are developed based on neural network models, stacking together multiple neurons in layers to produce a final output. The main objective of this analysis is exploring what role PI plays in airport delays. The full model for an individual airport decomposes daily average departure delays into two parts: one is related to the propagation effect and the other is related to the delay generation factors. Components of the first part represent the influence of upstream airports. It would be better to use the PIs from different airports as separate features. However, because of the high dimensions of features, total PIs are summarized from large airports, medium airports, and small airports as three features to represent the propagation effect of upstream airports. It should be noted that this is a simplified method and it would be possible to improve the model in the future by incorporating more of the data. In the second part, airport delays result from many other factors, which has been mentioned and discussed extensively in the previous literature (25–28) (see ID #1 to #7 in Table 5). Therefore, the full model contains all the features listed in Table 5 along with the PI (ID #1 in Table 5).
Variables in the Delay Estimation Model
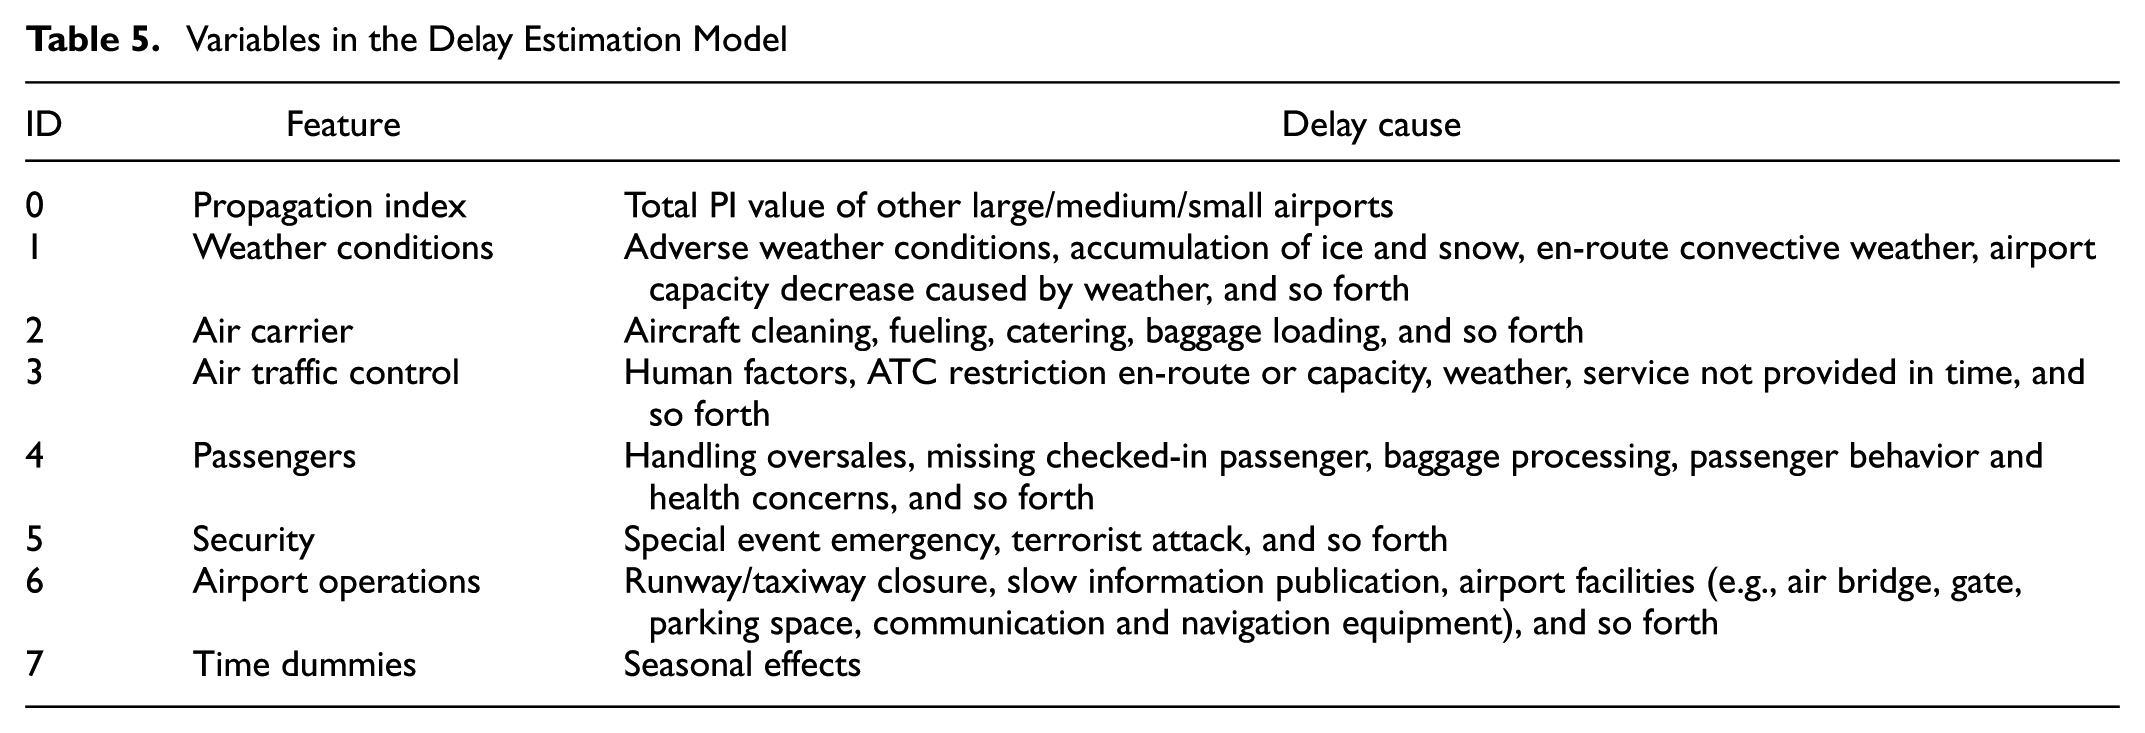
The data set of China air transport systems in 2017 is used to extract the features and train and test the models. To demonstrate the effect of considering PI, for each airport, three models are built. The full model uses all the features (0∼7 in Table 5) and Comparison Model 1 uses only the generation factors (1∼7 in Table 5). Comparison Model 2 uses the generation factors and the modified propagation feature, that is, the average PI value from the large, medium, and small airports in 2017.
Moreover, 365 samples are used to train and test each airport model with the recommended 80–20 splits. To better make use of these data, k-fold cross validation is performed to test the effect of the algorithm. The steps of k-fold cross validation are as follows:
Step 1: Divide the data set into five batches randomly.
Step 2: Assign the test set to one batch and the train sets to the other four batches.
Step 3: Repeat step 2; assign the test set to each batch once.
Figure 3 shows the neural network used in the model. The first layer is the input layer and the last is the output layer. All the layers in the middle are called hidden layers, with 100 neurons in this study. Each neuron has an activation function


The mean squared error loss function is

where
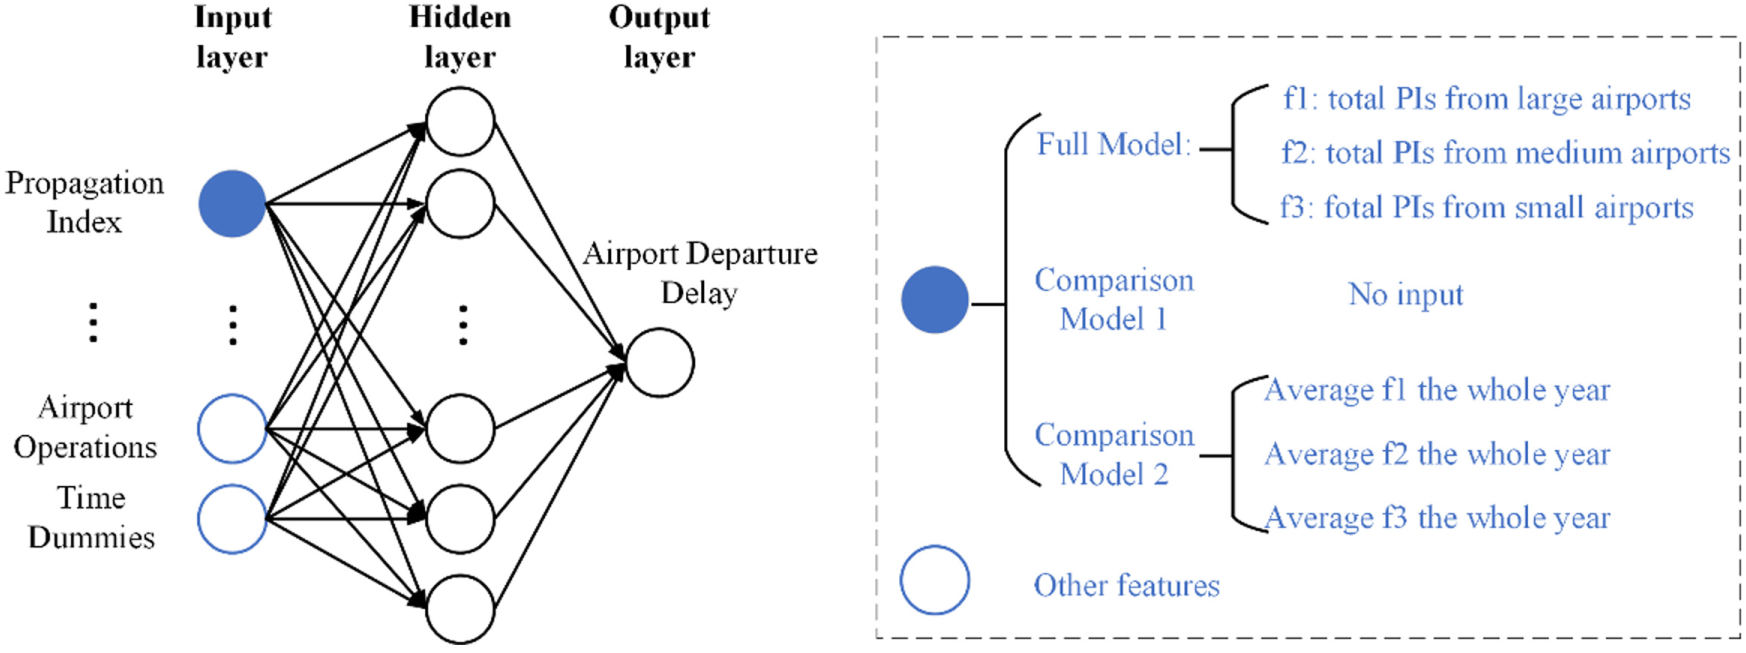
Estimation network based on neural network.
Estimation Results
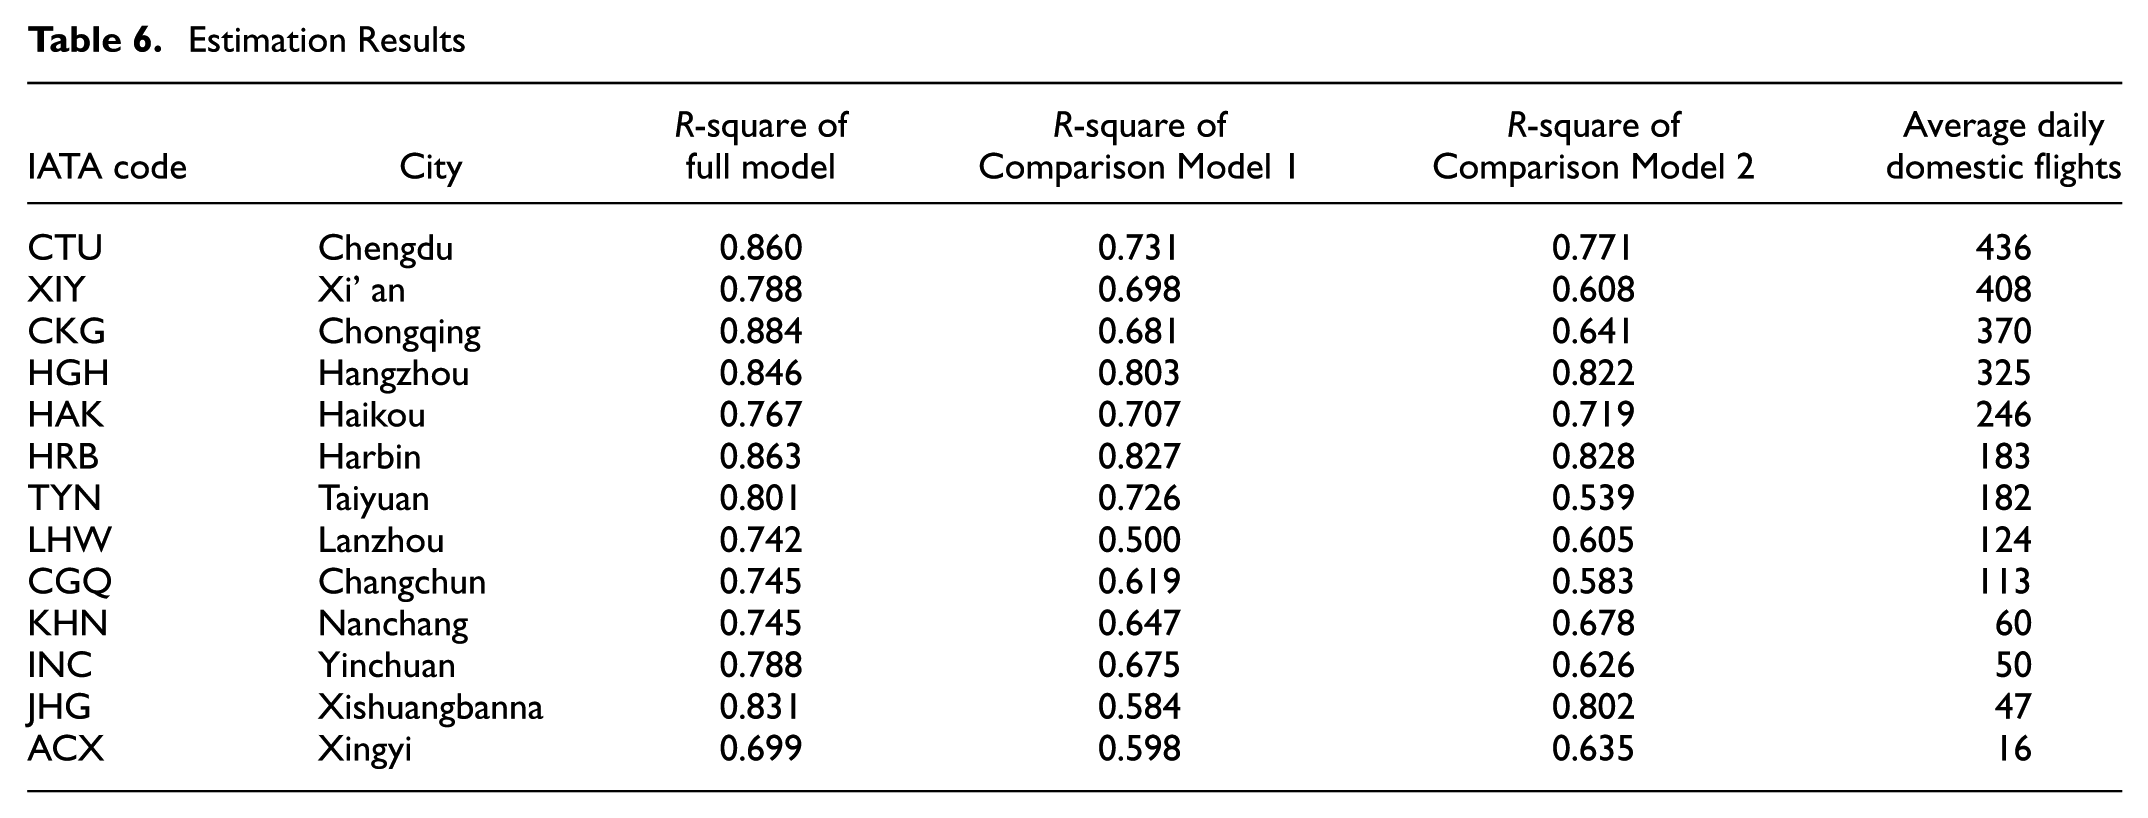
As discussed above, the three models are trained and tested for each airport to understand the impact of the PI. The results show that the performances of these models are desirable, yet there is a difference between the three models for most airports. The modeling outcomes of a subset of airports are listed in Table 6. An R-square score (from 0 to 1) is usually used as a metric for measuring the goodness of fit. The closer the value of R-square to 1, the better the fit of the regression line to observations. The average R-square score of all airports by the full model reaches 0.590, which is 7.0% higher than that of Comparison Model 1 and 10.0% higher than that of Comparison Model 2. It can clearly be seen that the prediction of the full model is better than that of the other models. The results indicate a positive influence of the PI.
Estimation Results
Conclusion
This paper proposes a systematic framework to examine the interrelationship among different airports with respect to air traffic delays. The results contribute to the literature by capturing the mechanism of delay propagation with the method that has not been used in the existing literature, and by demonstrating significant impact of PI on airport delays. The PI is defined and it is applied to quantify the directed influence among airports. The basis of the method is detecting the interdependency of delay time series of different airports with transfer entropy. Although transfer entropy estimation suffers from noisy observations in real-world data, the method still yields new insights into the analysis of the interaction patterns in dynamical air transport systems. The analysis can effectively reveal the degree of delay propagation, and the results can be used to further study the network effect (29–31).
To investigate the impact of the propagation index on flight delays, the PIs are incorporated into a neural network regression model to estimate the average departure delay. As input features, the PI and other delay generation factors are used to train the full model. For the sake of comparison, only delay generation factors are used to train Comparison Model 1. Then, the generation factors and the modified PI are used to train Comparison Model 2. The test results show that the full model is substantially superior. Future research may consider and incorporate some missing elements of this study, for example, passenger loads.
Footnotes
Acknowledgements
This paper is supported by the National Key Research and Development Program of China (Grant No. 2016YFB1200100), the National Natural Science Foundation of China (Grant Nos. 61425014, 61521091, 91538204, 61671031, and 61722102).
Author Contributions
X. C., W. D., and M. Z. designed the research; M. Z., X. Z., and M. D. Mpreformed the research; Y. Z. and L. S. wrote the paper.
The Standing Committee on Airfield and Airspace Capacity and Delay (AV060) peer-reviewed this paper (19-04856).