
Abstract
Project-level particulate matter (PM) analysis, also known as hot-spot analysis, is required in non-attainment and maintenance areas for transportation projects that are identified as projects of air quality concern (POAQC). The only PM non-attainment area in Texas is El Paso which is currently designated as non-attainment for PM10. This paper presents an analytical methodology that was developed to determine the thresholds for highway activity parameters that would streamline the identification of projects that are not POAQCs, and minimize the risk that the project is misclassified. Researchers used the example provided by EPA, that is, 125,000 annual average daily traffic (AADT) and 8% heavy-duty trucks, as the baseline for the analysis. They then established combinations of AADT and truck percentage that would result in the same amount of PM10 emissions as the baseline scenario. Researchers used a set of conservative assumptions to achieve a very conservative/low-risk determination. The most important assumption among them was to not use a fixed baseline analysis year. Researchers used the proposed methodology to establish traffic activity thresholds for highway projects in El Paso, TX. Researchers established a baseline traffic activity (AADT and truck percentage) threshold curve which is a conservative representative of the lower boundary of POAQCs. Any combination of truck percentage and AADT that falls below this curve can be confidently excluded from POAQC consideration. Researchers developed an easy-to-use spreadsheet tool that would use user-provided AADT and truck percentages to identify whether a project could be confidently classified as not of air quality concern.
The 1970 Clean Air Act (CAA) was the initial comprehensive federal law in the United States that regulated air emissions from area, stationary, and mobile sources. The CAA requires the Environmental Protection Agency (EPA) to set and update the National Ambient Air Quality Standards (NAAQS) for chemical compounds considered harmful to public health and the environment. Currently, NAAQS are established for six principal chemical compounds referred to as criteria pollutants. These have been based on studies that have shown a relationship between pollutant emissions and adverse health ( 1 ). The air quality data collected by state air agencies are compared with NAAQS. Based on this comparison, EPA designates areas that do not meet NAAQS limits as non-attainment.
Traffic-related air pollution is well established as a major risk to human health ( 2 – 4 ). In particular, increased exposure to fine particulate matter (PM) has been linked to cardiovascular and respiratory problems, and infant mortality ( 5 , ( 6 ). The current NAAQS for PM10 (PM of size 10 µm or less) is 150 μg/m3 over a 24-hour averaging period. In areas that are designated as non-attainment, a planning process known as transportation conformity is required per CAA requirements to ensure that federally supported highway and transit project activities will not cause new air quality violations, worsen existing violations, or delay timely attainment of the relevant NAAQS.
In response to increased evidence of the potential adverse health impact of near-road air pollution exposure, transportation conformity includes a requirement for determining the likely localized concentrations of pollutants that are known to have localized impacts, that is, PM and carbon monoxide (CO). This localized analysis is known as hot-spot analysis as defined in 40 CFR Part 93.101 ( 7 ). In 2010, the EPA introduced the “quantitative analysis” of PM hot-spots which requires the estimation of localized project-level emission concentrations using the regulatory approved models. These models include the MOtor Vehicle Emission Simulator (MOVES) emission estimation model and CAL3QHCR or AERMOD air dispersion models ( 8 ). Additional measures or control strategies may be required if the project is found in violation of NAAQS.
Hot-spot analyses are generally required for projects that are identified as a project of air quality concern (POAQC). Depending on the type of project, different parameters may influence whether a project is of air quality concern (Table 1). The EPA guidance on PM hot-spot analyses does not prescribe specific levels of these parameters to help in the determination of POAQC. However, the guidance established examples of projects that would require PM hot-spot analyses as covered by 40 CFR 93.123(b) ( 1 ).
Key Parameters for Identifying Projects of Air Quality Concern
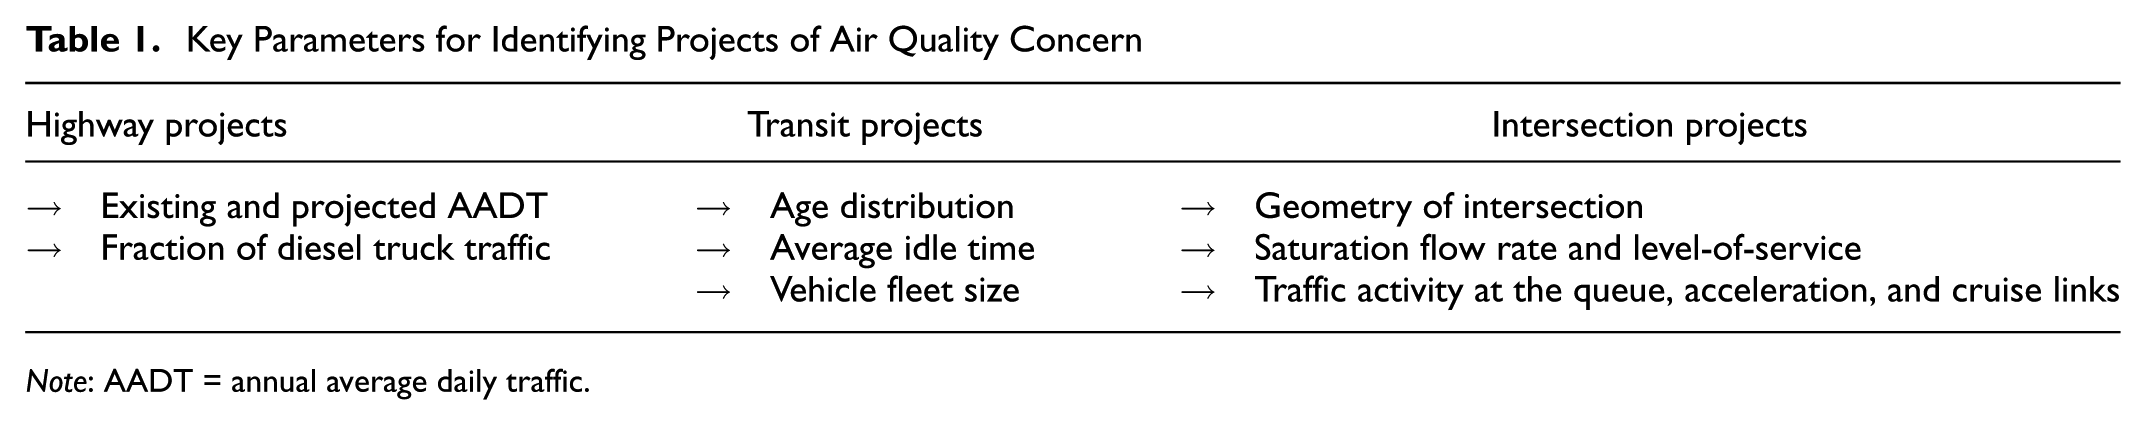
Note: AADT = annual average daily traffic.
Examples of highway projects as covered in section (i) of 40 CFR 93.123(b) ( 1 ) are as follows:
– “A project on a new highway or expressway that serves a significant volume of diesel truck traffic, such as facilities with greater than 125,000 annual average daily traffic (AADT) and 8% or more of such AADT is diesel truck traffic.”
– “New exit ramps and other highway facility improvements to connect a highway or expressway to a major freight, bus, or intermodal terminal.”
– “Expansion of an existing highway or other facility that affects a congested intersection (operated at Level-of-Service (LOS) D, E, or F) that has a significant increase in the number of diesel trucks.”
– “Similar highway projects that involve a significant increase in the number of diesel transit buses and/or diesel trucks.”
Examples of transit projects as covered by sections (iii) and (iv) of 40CFR 93.123(b) ( 1 ) include:
– “A major new bus or intermodal terminal that is considered to be a regionally significant project under 40 CFR 93.1012.”
– “An existing bus or intermodal terminal that has a large vehicle fleet where the number of diesel buses increases by 50% or more, as measured by bus arrivals.”
The EPA hot-spot rule states that an interagency consultation process among departments of transportation (DOTs), the EPA, and state and local agencies should be used to identify POAQCs ( 9 ). A quantitative hot-spot analysis involves an extensive complex modeling process that may take several months to complete. Because of the extensive time and resources needed for conducting a hot-spot analysis, state DOTs and MPOs need quantitative methods to identify the projects that are clearly not POAQC ( 10 ). A survey conducted by the American Association of State Highway and Transportation Officials (AASHTO) on the state-of-the-practice for PM hot-spot analysis ( 11 ), state DOTs and MPOs have stated that the hot-spot process requires a considerable amount of time to implement with a substantial amount of technical detail to be determined for each project.
Reid et al. ( 10 ) used MOVES and EMission FACtors model (EMFAC) to identify key project parameters that can be used to reasonably exclude the project from consideration as a POAQC. They developed various scenarios for a hypothetical highway project. Using an 8% truck fraction and 125,000 AADT for the baseline analysis year of 2006, they used MOVES and EMFAC to characterize PM10 and PM2.5 emissions for the other analysis years compared with the baseline year. They found that fleet turnover results in reduced project-level PM emissions over time. Their MOVES-based result indicated that for the 125,000 AADT and 8% truck fraction, the total daily PM10 emissions in 2020 and 2035 would be respectively 30% and 37% lower than in 2006. They noticed that PM10 has a smaller reduction than PM2.5, which could be attributed to the fact that while the tailpipe PM10 will continue to decrease, the re-entrained road dust, tire wear, and brake wear emissions are not projected to vary by analysis year. Caltrans ( 12 ), developed a Best Practices Guidebook for PM hot-spot analysis based on real-world case studies and provided guidance on best practices to streamline the process, QA/QC, and a discussion of potential project features that may help reduce PM impacts.
This paper provides an overview of a study that was conducted for the Texas DOT to identify projects that are clearly not POAQC in El Paso, Texas. El Paso is currently in non-attainment for PM10 for the 24 h averaging period. The goal of the study was to develop a series of quantitative vehicle activity thresholds to identify highway and transit terminal projects that are clearly not POAQCs. These thresholds were developed to determine the traffic activity parameters for highway projects that would minimize the chance that the project would be incorrectly classified as a non-POAQC project. In this context, the effort presented in this paper focused on identifying projects for which the risk of misclassification is very low. It is worth mentioning that although the study focused on El Paso, the methodology developed is transferable and when combined with local-specific data it can be applied to any area being considered for PM hot-spot analysis. The rest of the paper is organized as follows. The next section gives an overview of the methodology, this is followed by a summary of the results and conclusions.
Methodology
Figure 1 shows the conceptual design of the process to develop activity threshold values for highway/freeway facilities. The term highway projects in this paper refer to highways, freeways, expressways, and entry and exit ramps connected to highways/freeways. The methodology is based on a quantitative emission calculation with reasonable assumptions for highway projects that would result in minimizing the risk of misclassifying the projects that are clearly not POAQC. Activity threshold values are developed based on the quantitative example values reported in 40 CFR 93.123(b) ( 1 ) (i); that is, 125,000 AADT and 8% of diesel truck traffic ( 13 ). All the applicable sources of PM10 (tailpipe, crankcase, brake wear, tire wear, and re-entrained road dust) were included in the analysis.
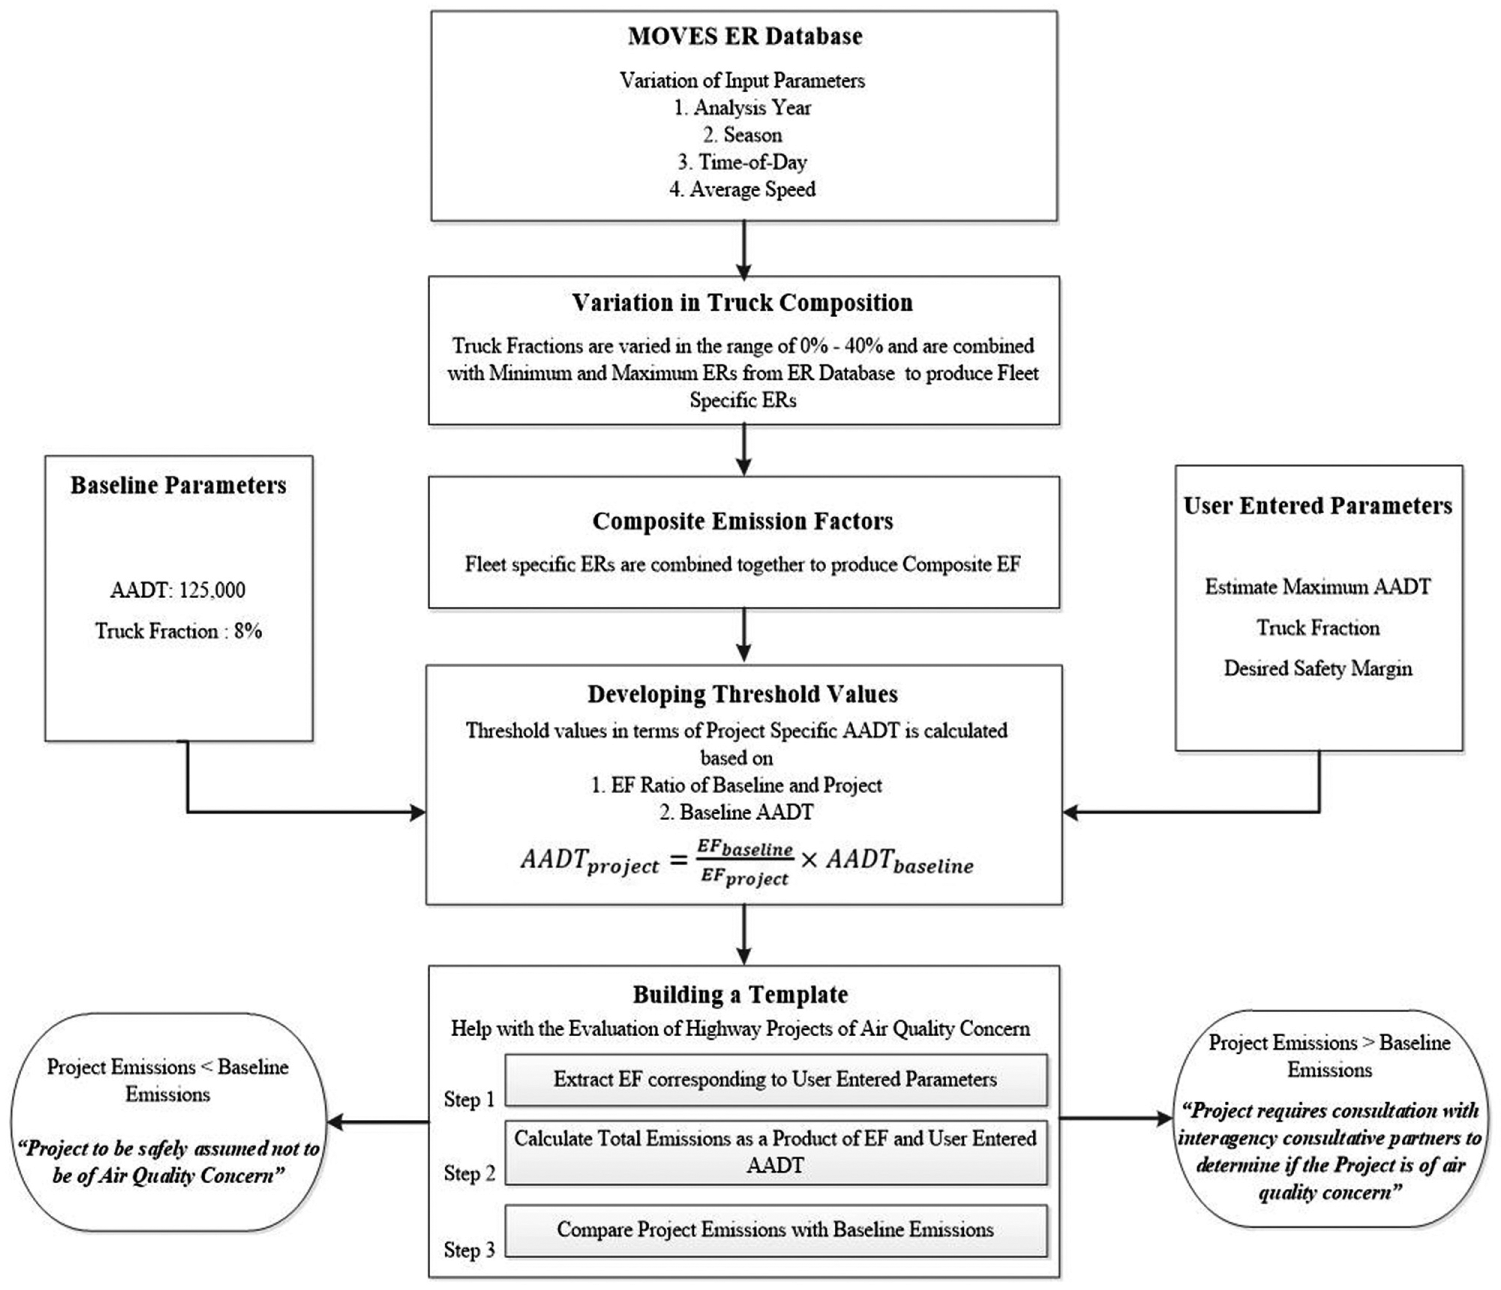
Establishing POAQC activity thresholds for highway projects.
Researchers established a baseline scenario corresponding to 125,000 AADT and 8% diesel truck traffic. To be consistent with the example AADT values listed in the EPA guidance ( 9 ), the threshold values and baseline curves are developed in relation to AADT by assuming a link length of 1 mi. However, the methodology developed is transferable and could be applied in situations where vehicle miles traveled (VMT) is available instead of AADT.
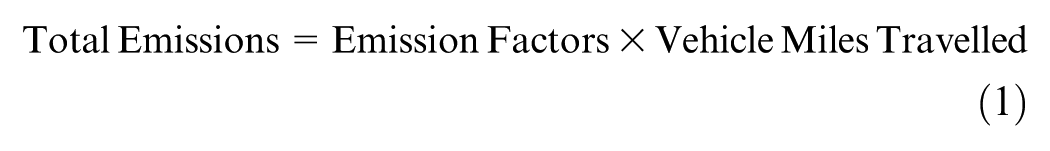
To estimate emissions from running exhaust as required for highway projects, total emissions are calculated as shown in Equation 1. VMT is calculated using Equation 2.

A range of scenarios were constructed based on the variation of key input parameters that are found to affect emission factors (EFs). These input parameters correspond to the analysis year, AADT, fleet composition, speed distribution, and meteorological conditions. A baseline curve was built by either varying the EF (as a surrogate for varying truck percentages), or AADT such that the total emissions are the same as the baseline emissions for the same analysis year. In other words, the baseline curve is built by identifying all combinations of AADT and truck percentages that produce equivalent emissions to the baseline case (i.e., 125,000 AADT and 8% diesel truck traffic). For example, a combination of 100,000 AADT and 10% diesel truck traffic or 36,000 AADT and 30% diesel truck traffic produces emissions equivalent to 125,000 AADT and 8% diesel truck traffic. These scenarios would, therefore, be a part of the baseline curve.
The process of developing the threshold values consisted of a series of steps, which are described as follows:
Step 1: Identify Critical Input Parameters
The first step consisted of identifying critical input parameters that are found to affect emission rates (ER). An ER database was developed for all possible combinations of these critical input parameters from the MOVES emission model. MOVES requires inputs from two broad categorie: vehicle activity inputs corresponding to traffic activity, fleet composition, and roadway link characteristics; and local-specific inputs that correspond to meteorology, fuel supply, vehicle age distribution, and inspection/maintenance (I/M) parameters.
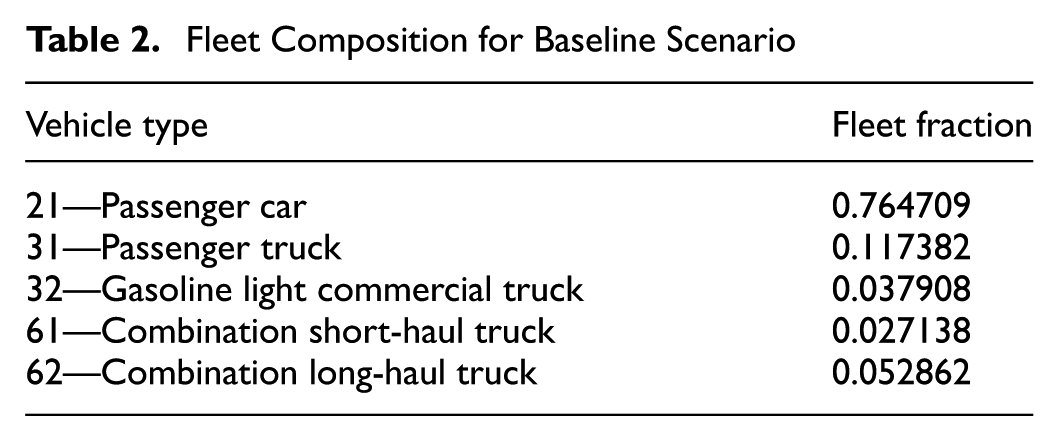
Researchers obtained the El Paso-specific fleet composition from the regional conformity analysis. Based on the emission calculation by vehicle type, passenger car (vehicle type 21), passenger truck (vehicle type 31), gasoline light commercial vehicle (vehicle type 32), combination short-haul truck (vehicle type 61), and combination long-haul truck (vehicle type 62) were found to account for more than 97% of the total PM emissions. Accordingly, the remaining vehicle types that accounted for a negligible portion of total emissions were not directly considered for purposes of the baseline scenario; instead, the representative fleet mix was normalized to account for 100% of the total VMT. The normalization of the vehicle population resulted in assigning all the diesel vehicles to vehicle types 61 and 62 which have the largest engines and highest weights. In addition, the local heavy-duty truck (vehicle types 61 and 62) fraction was increased from 7% to 8% to match the example in the EPA guidance. The resulting fleet composition for the baseline scenario is shown in Table 2.
Fleet Composition for Baseline Scenario
Researchers isolated the impact of the input parameters and found that in the case of highway/freeway projects, fleet composition and AADT have a much higher impact on the total emissions. Accordingly, the 2014 analysis year age distribution specific to El Paso was utilized and incorporated to model all years between 2014 and 2035. A range of scenarios was constructed based on variation of several input parameters found to affect ERs. These input parameters correspond to the analysis year, AADT, fleet composition, speed distribution, and meteorological conditions. The range of scenarios utilized in developing the ER database is shown in Table 3.
Summary of Critical Input Parameters for ER Database for Highway Projects

Note: ER = emission rates; HDD = heavy-duty diesel.
Among all vehicle types, diesel trucks are found to contribute to a majority of PM emissions. The truck fraction is varied from 0% to 8% at 1% increments and from 10% to 40% at 5% increments. Analysis year sensitivity is evaluated in one-year increments from 2014 to 2020 and five-year increments from 2020 to 2035. 2035 was the statewide long-range transportation planning year at the time of analysis. Studies have shown that PM ERs to be higher during winter months and lower during summer months for gasoline vehicles ( 14 , ( 15 ). Seasonal variation was captured by modeling ERs for winter and summer. MOVES ERs for diesel vehicles were found not to be sensitive to the season. Researchers conducted a time-of-day sensitivity analysis to compare ERs produced at different time periods for the same travel activity. The time-of-day sensitivity analysis exhibited a difference of 2–5% in ERs between different time periods. An additional sensitivity test was performed with average daily temperature and humidity values. The difference in ERs between daily averages at different time periods were found to be in the range of 0.2–3%. Based on the sensitivity analysis, it was assumed that daily average values were a good representation for all time periods. Accordingly, MOVES runs were constructed with average temperature and humidity values.
Typical speed values for the El Paso region were found to vary between 15 and 75 mph based on traffic maps ( 16 ) prepared by Texas DOT. MOVES runs were prepared for speeds between 15 and 75 mph at 5 mph increments.
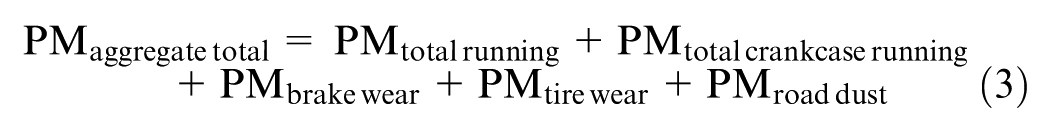
In cases of highway projects, emission processes modeled for PM10 include vehicle exhaust that includes running exhaust and crankcase running exhaust, crankcase running emission, brake and tire wear from MOVES emission runs, and road dust emissions from AP-42 emission factor calculations. The aggregated total PM10 EF is calculated according to Equation 3.
Local-specific data corresponding to meteorology, fuel supply, and age distribution were obtained from the El Paso regional conformity analysis for the 2014 analysis year and incorporated to model for all analysis years with no predictions of fleet change for future years. This assumption is consistent with the EPA’s guidance on hot-spot analysis. Project-scale MOVES runs were executed using all possible combinations of the input parameters listed in Table 3.
Step 2: ER Database Development
A running emission rate database was developed for all possible combinations of input parameters identified in Step 1. The objective of this analysis is to establish activity thresholds. Minimum and maximum ERs can be used to identify the boundaries of possible values and therefore only the minimum and maximum ERs were extracted. In all cases (i.e., combinations of vehicle type and analysis year), the maximum ER is for a speed of 15 mph on a summer day while the minimum ER is for a speed of 75 mph on a winter day.
Step 3: Capture Variation in Fleet Composition
To account for potential variations in fleet composition, the heavy-duty combination truck percentage representing vehicle types 61 and 62 were varied in the range from 0% to 8% at 1% increments and from 10% to 40% at 5% increments with the fractions of other vehicle types normalized accordingly to add up to 100%. Composite PM10 emission rates corresponding to one VMT were then calculated by combining the above adjusted fleet mix fractions with their corresponding minimum and maximum ERs from Step 2. The resulting maximum and minimum composite EFs over different analysis years are shown in Figure 2. Percentages shown in the figure are the heavy-duty truck percentages. Each line represents the composite emission factor for a certain truck percentage over the 2014–2035 period. The figure shows an example of the ranges of composite EFs as a function of analysis year and trucks percentage (for truck percentages equal to or higher than 8%). A similar graph was also produced for truck percentages lower than 8% (not shown in this paper).
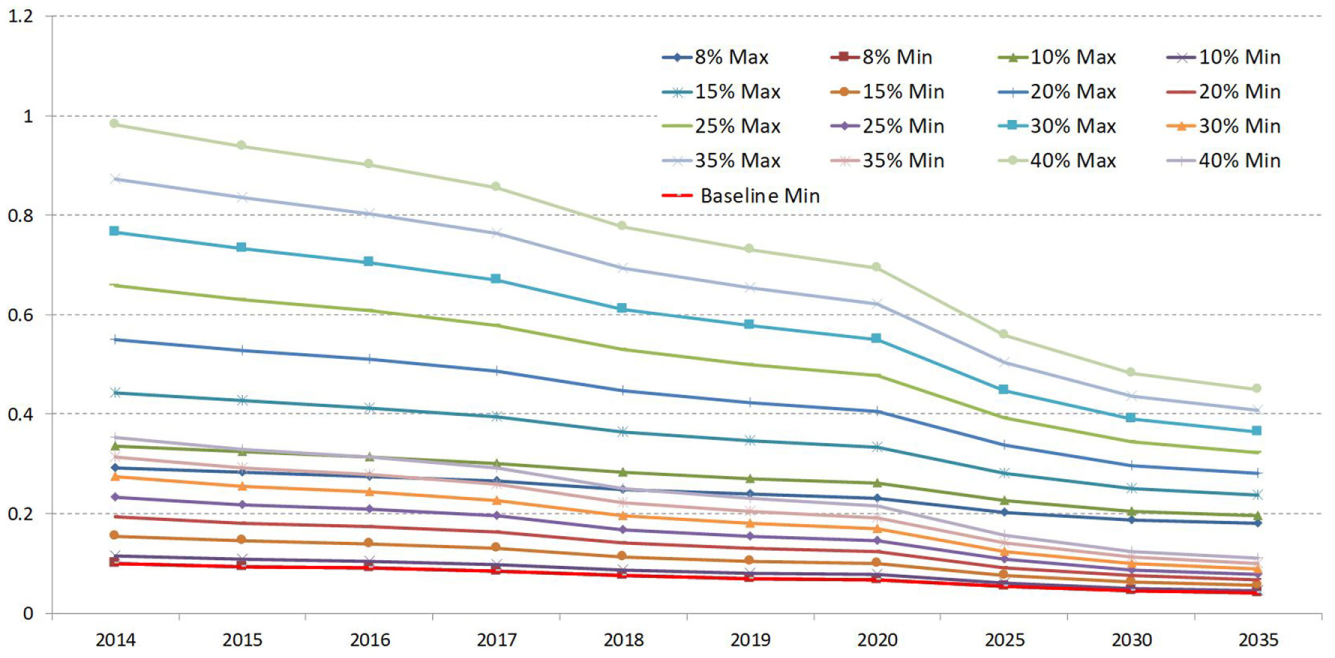
Variation of maximum and minimum composite EFs.
Step 4: Establish the Baseline Curve
As outlined in the methodology section, the motivation behind developing the baseline curve was to identify all combinations of AADT and diesel truck fractions that produce the same total emissions as the baseline scenario of 125,000 AADT and 8% diesel truck traffic. The baseline curve was developed using Equation 4 that relates the EF ratio of baseline (corresponding to 8% truck fraction) to a project-specific truck percentage and the ratio of baseline AADT to project-specific AADT.
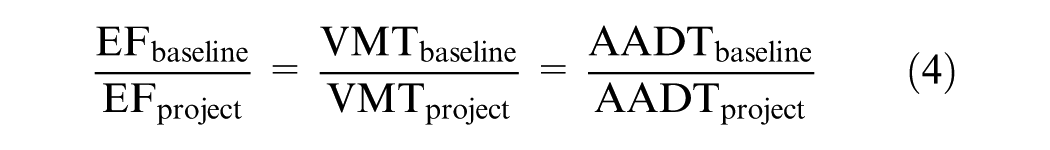
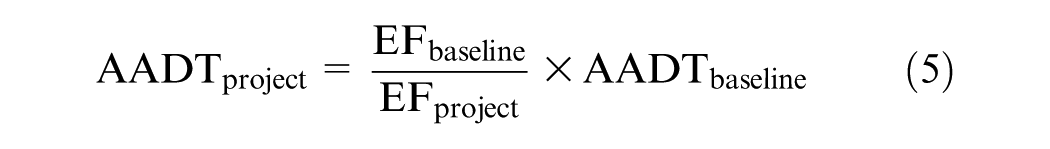
Using the maximum and minimum composite EFs from Step 3, two sets of baseline-to-project ratios were developed. Equation 5 was used to estimate the project AADTs that result in the same total emissions as the baseline scenario.
The results are two sets of AADTs corresponding to maximum and minimum baseline-to-project ratios, as shown in Table 4. For each combination of analysis year and truck percentage, the smallest AADT between the two tables were selected as a conservative POAQC boundary. These threshold AADT values were rounded down to the nearest 5,000 for AADTs greater than 60,000 and to the nearest 1,000 for AADTs smaller than 60,000. This rounding down makes the POAQC threshold more conservative. Table 5 shows the resulting AADT boundary values for each truck percentage.
AADTs That Produce the Same Amount of PM10 as Baseline
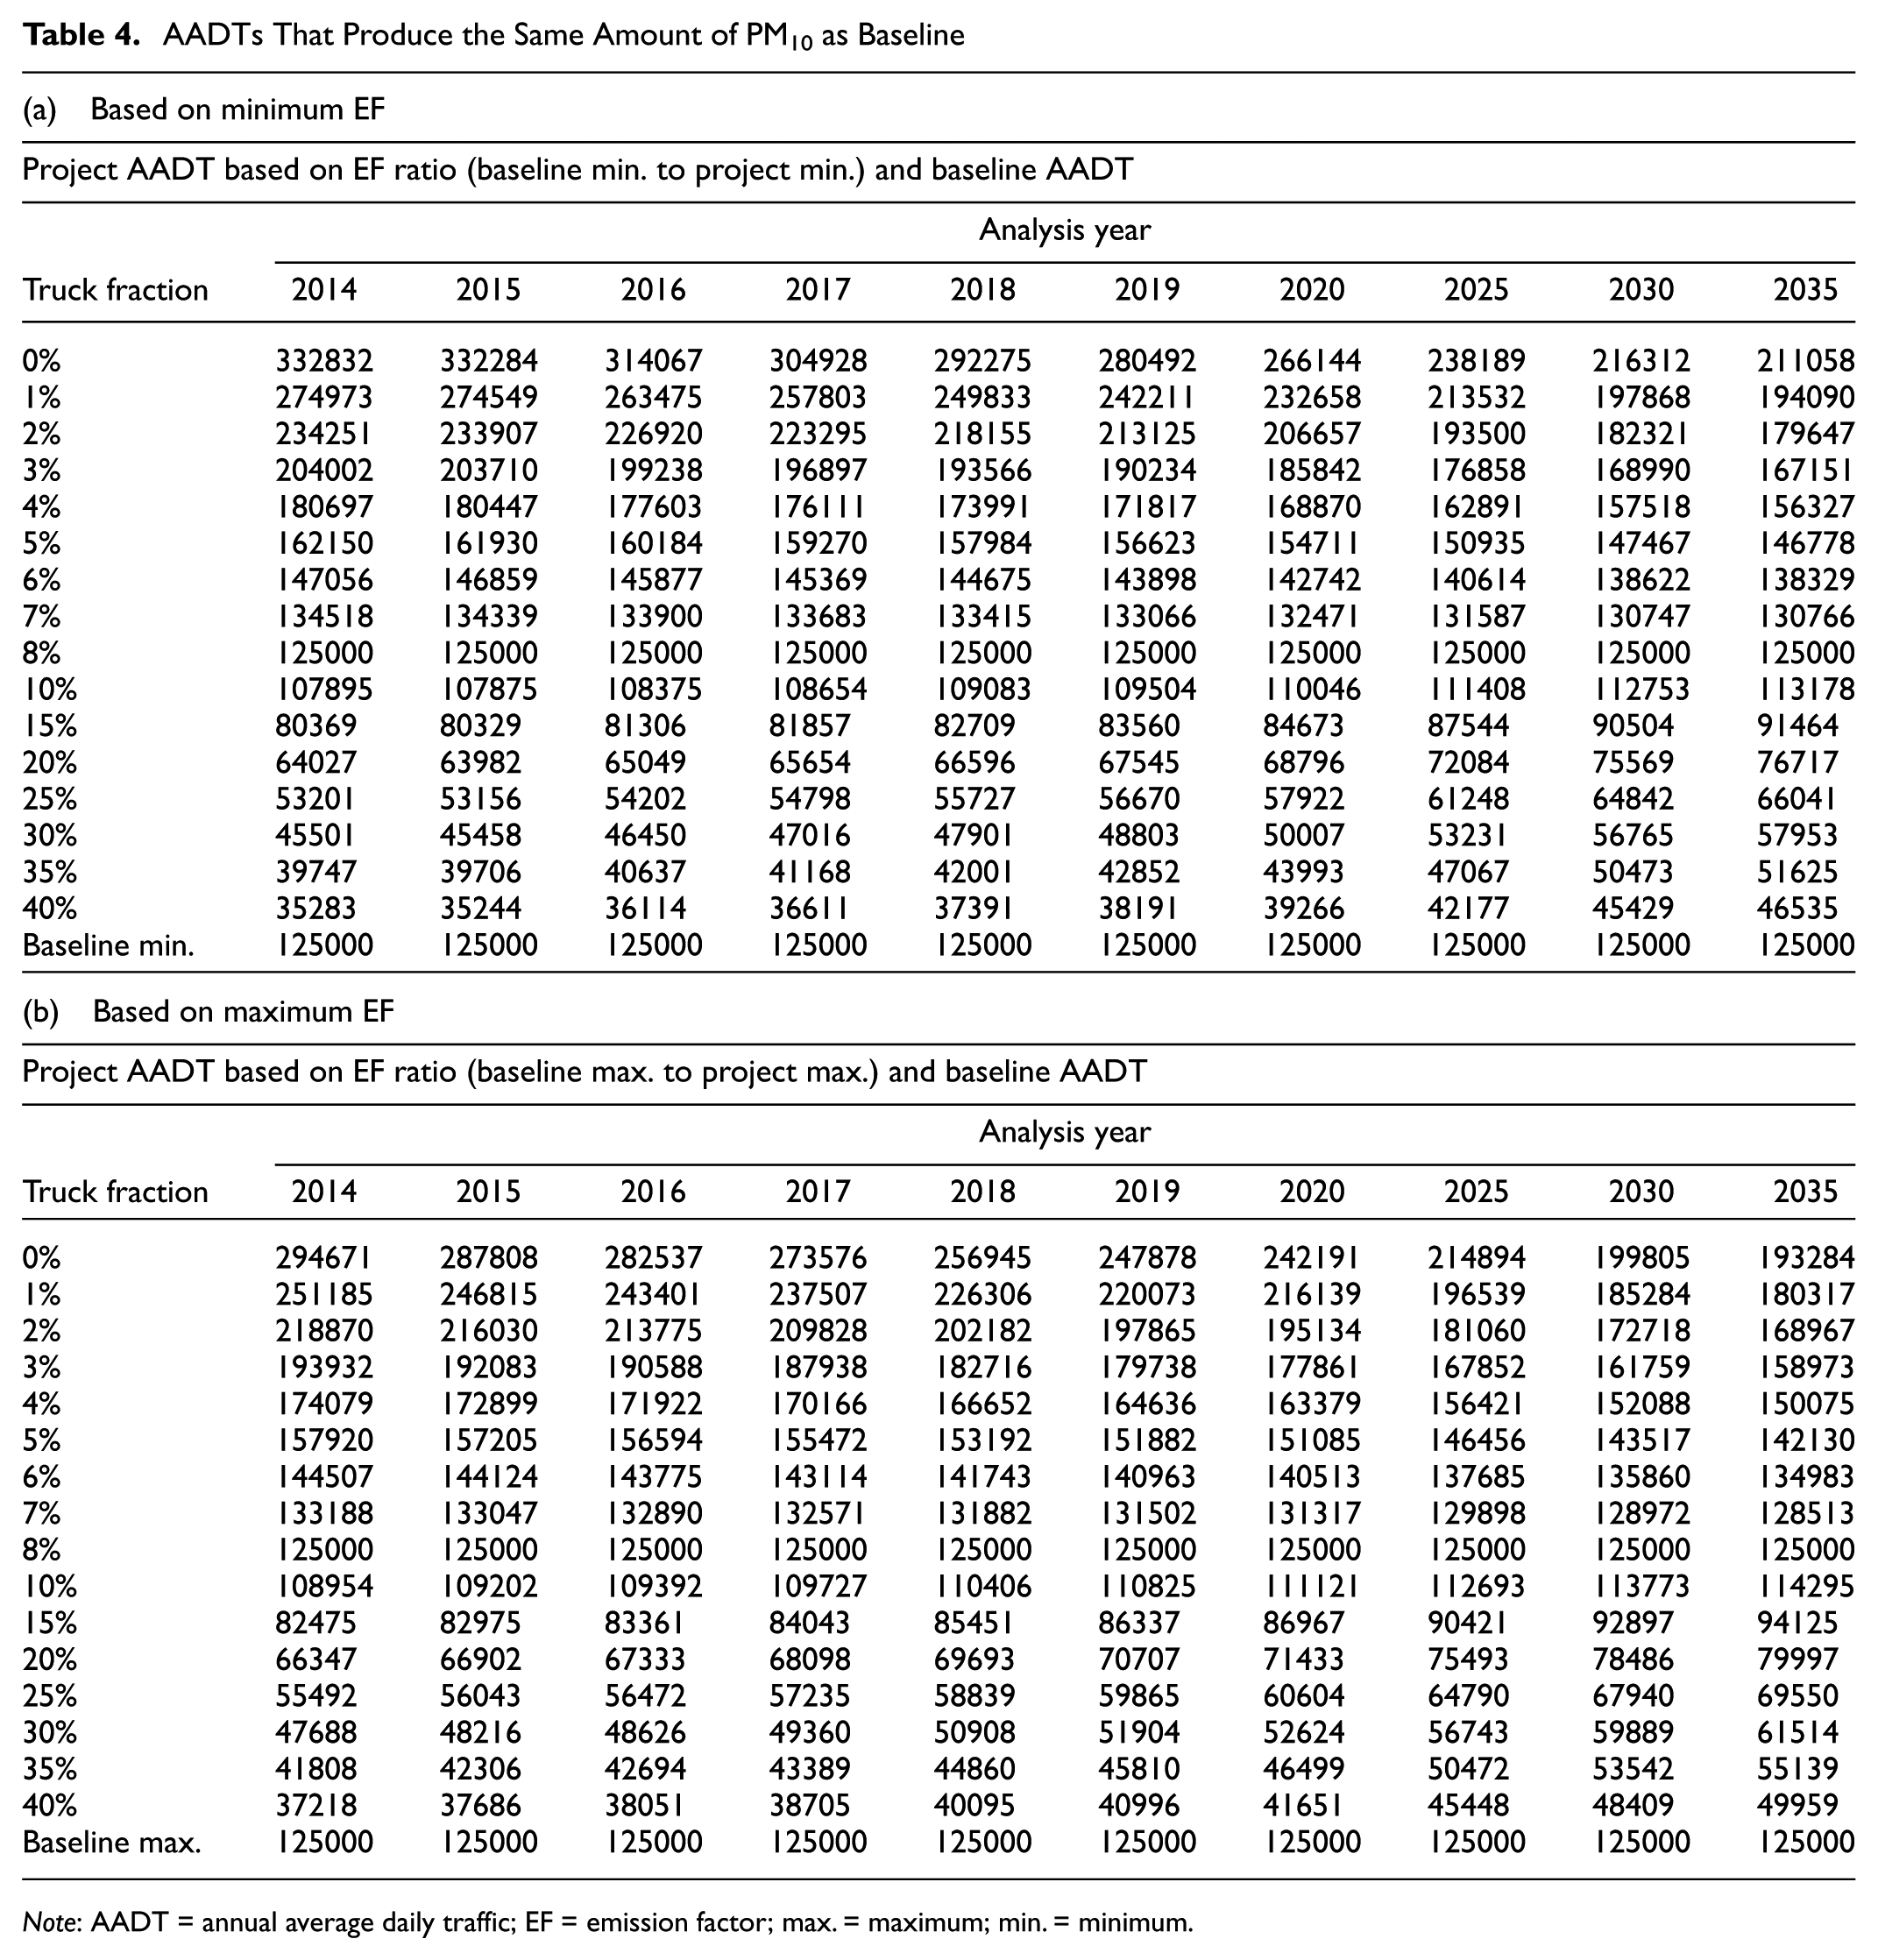
Note: AADT = annual average daily traffic; EF = emission factor; max. = maximum; min. = minimum.
Boundary AADT Values for POAQCs
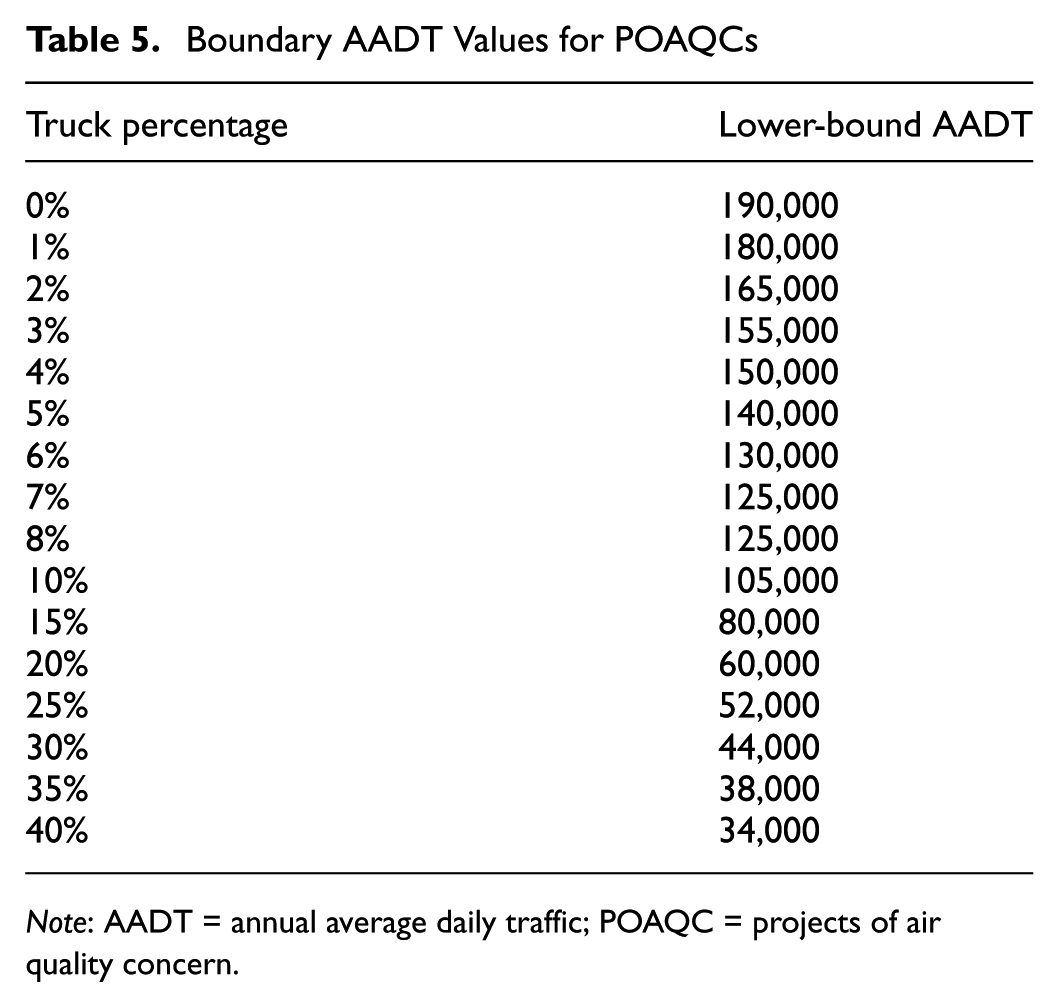
Note: AADT = annual average daily traffic; POAQC = projects of air quality concern.
Results
The truck percentage and AADT pairs representing the POAQC boundary are shown in Table 5. These values were developed based on multiple conservative assumptions as follows:
– Each analysis year was included independently; that is, it did not include the impact of cleaner vehicles over time.
– The threshold AADTs were established based on the minimum of all analysis years, and the smallest values between the minimum and maximum ERs.
– The final AADT boundary values were rounded down to the nearest 5,000 AADT for AADTs above 60,000.
Although the threshold shown in Table 5 is already a conservative estimate, one can further apply a safety margin to the AADT values to identify the projects that are not a POAQC with a high level of confidence. Figure 3 shows the baseline curve corresponding to Table 5 as well as the threshold curve representing a 10% margin of safety.
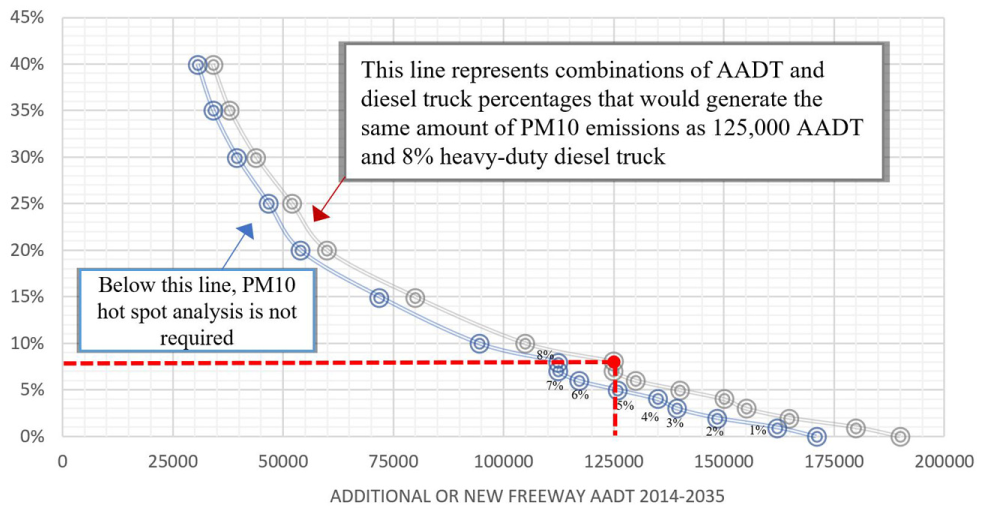
Baseline and adjusted activity boundary using a 10% safety margin.
The baseline curve in Figure 3 is a conservative boundary for highway projects. The baseline point, highlighted in red, represents the baseline scenario of 125,000 AADT and 8% truck traffic. Any combinations of AADT and truck percentage on the baseline curve will have at most the same amount of PM10 emissions as the baseline scenario. Any combination of AADT and heavy-duty diesel truck percentage that falls to the right of the baseline curve means that consultation with interagency consultative partners is recommended to determine if the project is of air quality concern. Falling in this “greater than baseline” zone only implies that more project-specific information is needed to determine if there is a need for hot-spot analysis.
In addition to the baseline curve, Figure 3 shows an activity threshold level corresponding to a safety margin of 10%. The 10% safety margin shown in this figure is just an example demonstrating how the application of a safety margin would work and is not intended to recommend this value in the application. Adopting a safety margin greater than 0% results in a lower AADT or truck percentage as the upper boundary of projects that are clearly not POAQCs. For example, if a safety margin of 10% is chosen for 30% diesel truck traffic, the AADT threshold below which the project can be safely assumed not to be of air quality concern will be 32,400 (equivalent to (100–10%) × baseline AADT of 36,000). Thus, adopting a higher safety margin increases the level of confidence in the threshold values to identify projects that can be safely assumed to not be of air quality concern.
The research team implemented the resulting thresholds into an easy-to-use spreadsheet tool to quickly determine if a project is not of air quality concern with a high level of confidence. A snapshot of the tool is shown in Figure 4. The tool also shows the maximum AADT for a given truck percentage and selected safety margin to be safely considered a project that is not of air quality concern. User inputs include truck percentage, expected AADT, and desired safety margin. The tool compares the combination of user-entered parameters with built-in threshold values and classifies the project into two categories:
– projects that can safely be assumed as not of air quality concern; and
– projects that require consultation with interagency consultative partners to determine if it is of air quality concern
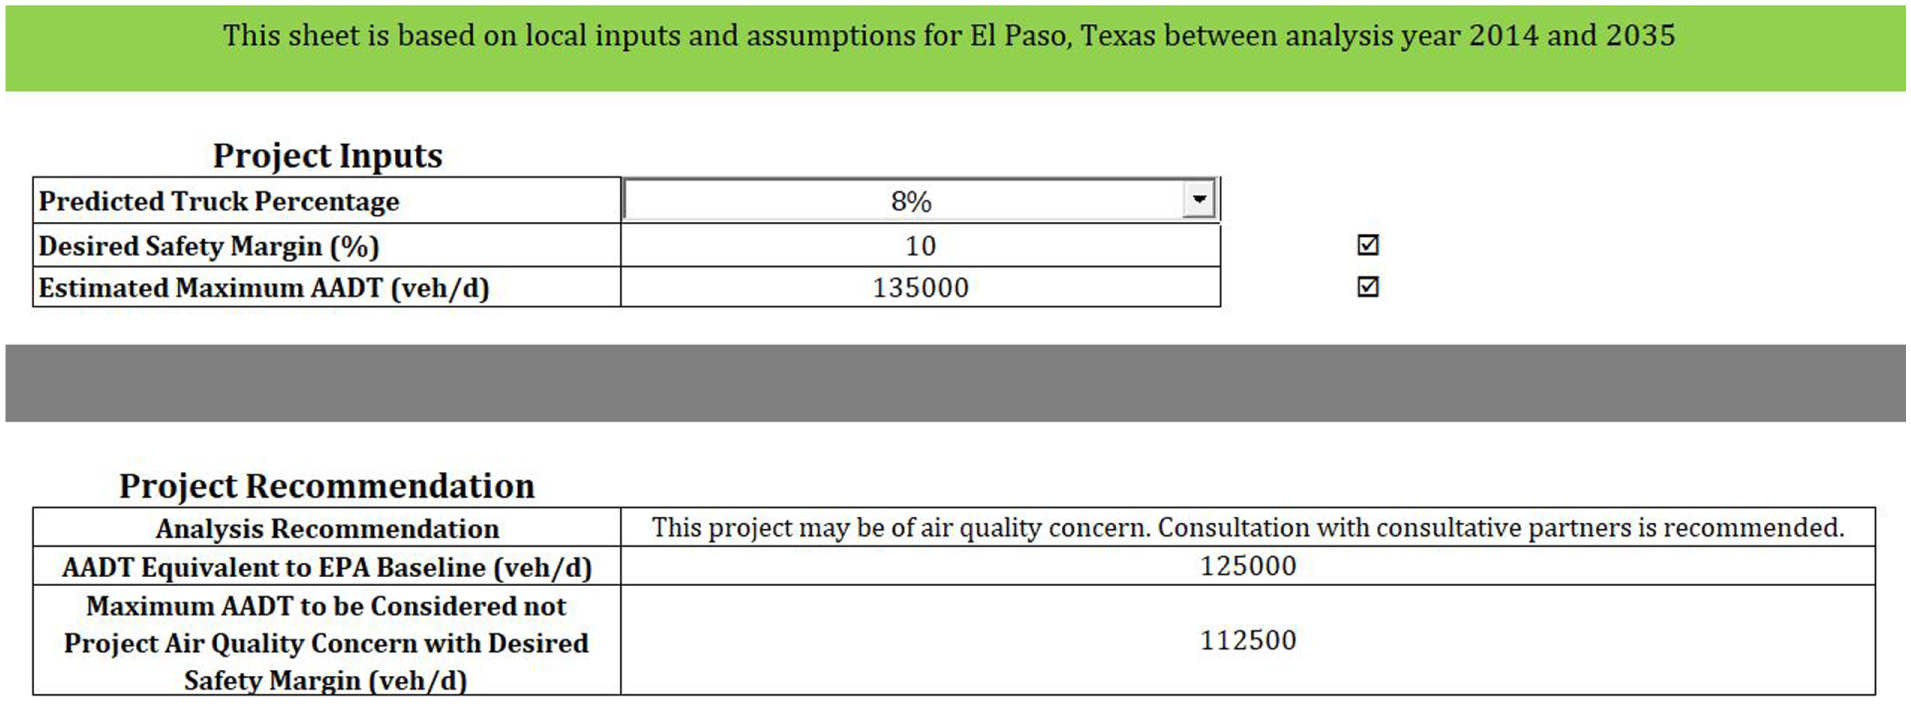
Spreadsheet tool for evaluation of highway projects for PM10 hot-spot analysis.
The conservative assumptions made at each step of the process were selected to minimize the chance of misclassifying a highway project as one that is clearly not a POAQC. Each of these assumptions essentially increases the distance between the established boundary and the one implied by the EPA’s example published in 2006 and therefore lowers the risk of misclassifying projects that are not POAQC. For example, by not fixing the baseline to 2006, the process intentionally does not consider the reduction of emissions since 2006. Reid et al. ( 10 ) estimated that the reduction of PM10 emissions from 2006 levels would be approximately 30% for the analysis year 2020. The reduction of emissions between 2006 and 2020 means more than 125,000 AADT would be needed in 2020 to make the same amount of emissions as 125,000 AADT and 8% truck in 2006. Instead, we assumed that the EPA example is directly applicable to each analysis year regardless of the changes in emissions rates. This assumption alone puts the resulting total emissions for 2020 approximately 30% lower than the EPA’s example published in 2006. Applying a safety margin, as suggested above, further reduces the risk of project misclassification based on the total amount of emissions.
The methodology presented in this paper is transferable and can be applied to any area being considered for PM hot-spot analysis. The main obstacle to applying this method to other regions is the availability of local-specific ERs. The results presented in Figure 3 are based on emissions rates that are specific to El Paso. The authors hypothesize that because of the conservative assumptions made at each step of the process, especially the disregarding of the reduction in exhaust emissions in future years, the results would be potentially applicable to other areas with similar climates. The authors, however, recognize that this assumption must first be examined and verified before applying the result in other locations.
Conclusions
This paper presents a streamlining analytical methodology developed to determine the boundary limits for highway activity parameters, AADT, and truck percentage, to identify the projects that can be confidently identified as not needing a PM10 hot-spot analysis. Researchers used the example first provided by EPA in its 2006 rulemaking, that is, 125,000 AADT and 8% heavy-duty truck, as the baseline for the analysis. They then established all combination of AADT and truck percentage that would result in the same amount of PM10 emissions as the baseline scenario.
The developed methodology uses minimum and maximum ERs to represent the potential levels of uncertainty in the analysis. Because the goal is to identify the projects that are clearly not of air quality concern, it is important that the determination is based on assumptions that minimize the risk and increase the level of confidence. In addition to using the minimum and maximum emissions rates, researchers used a set of risk-minimizing assumptions to achieve a very conservative determination. The most important assumption among them was to not use a fixed baseline analysis year (i.e., 2006). By adopting this assumption, each analysis year is analyzed independently, that is, disregarding the fact that since 2006 the exhaust ERs have been declining dramatically as shown by Reid et al. ( 10 ). Therefore, the impact of declining tailpipe emissions is excluded from the analysis.
The proposed methodology uses representative ERs for major vehicle types. Researchers used the proposed methodology to establish traffic activity thresholds for highway projects in El Paso, TX. The team performed a sensitivity analysis to identify the MOVES inputs that have the highest impact on the ERs. The ERs used in this effort were generated by running MOVES with local-specific inputs adopted from the regional conformity analysis. Researchers established a baseline traffic activity (AADT and truck percentage) curve which is a conservative representative of the lower boundary of POAQCs. Any combination of truck percentage and AADT that falls below this curve can be confidently excluded from POAQC consideration. The projects that exceed the proposed threshold values would require further assessment and consultation with interagency consultative partners to determine if there is a need for quantitative hot-spot analysis. The results for El Paso were incorporated into an easy-to-use spreadsheet tool that was made available to Texas DOT staff. The outcome of the work presented in this paper is a streamlining procedure that was developed based on a series of conservative assumptions. Dispersion modeling validation on a sample of projects for which this method was used would be a valuable validation effort, especially to assess whether the assumptions may be overly conservative.
Footnotes
Acknowledgements
This study conducted as part of a technical support task for Texas DOT. The authors would like to thank Jackie Ploch and Marty Boyd of Texas DOT for their continued support and leadership.
Author Contributions
The authors confirm contribution to the paper as follow: study conception and design: RF, CG; data collection and analysis: CG, MV; interpretation of results: CG, SV; draft manuscript preparation: SV, RF, MV. All authors reviewed the results and approved the final version of the manuscript.
The Standing Committee on Transportation and Air Quality (ADC20) peer-reviewed this paper (19-05620).
The findings and conclusions included in this paper are those of the authors and do not necessarily reflect the requirements or position of any governmental agency.