
Abstract
Deer–vehicle crashes (DVCs) continue to be a problem in the United States, with 1.2 million such crashes occurring annually. DVCs are a particular issue on two-lane rural highways in Michigan, accounting for more than 60% of crashes. Such a high proportion of DVCs limits the transferability of existing safety models, including those found in the Highway Safety Manual (HSM), that are often based on data from states with considerably lower proportions of deer crashes. To counter this, a cross-sectional analysis of deer crashes was performed using data from Michigan. The data were analyzed across four categories of rural two-lane roadways, including: state highways, federal aid county roadways, non-federal aid county roadways, and unpaved (gravel) county roadways. Mixed effects negative binomial regression models utilizing spatial and temporal random effects were generated separately for each of the rural two-lane roadway types. Results showed speed-related factors, including lane width, shoulder width, horizontal curvature, and peak level of service, had a significant effect on DVC occurrence for most types of rural two-lane roadways in Michigan. Wider lanes were associated with a greater occurrence of deer crashes, perhaps because of higher prevailing travel speeds. Conversely, horizontal curves with design speeds lower than the statutory speed limit were associated with fewer deer crashes, perhaps because of lower travel speeds through curves. Wider shoulders, which afford greater separation between the travel lanes and the roadside, were found to have significantly lower deer crash occurrence. The number of available hunting licenses did not have a consistent effect on DVCs.
Deer–vehicle crashes (DVCs) continue to be a roadway safety issue in Michigan and many other areas across the United States (U.S.). In 2017, of the 314,921 reported crashes occurring in Michigan, 50,949 (16.1%) involved deer, although this number is understood to be significantly underreported as a high proportion fall below the legal crash reporting threshold ( 1 ). While the majority of these crashes do not involve serious injury, deer collisions cost more than $200,000,000 in damage in Michigan annually when considering average direct insurance claim costs ( 2 ). Clearly, any improvements towards reducing deer crashes can have a significant contribution to reducing crashes, injuries, and associated costs in Michigan and elsewhere.
The first edition of the Highway Safety Manual (HSM) includes safety performance functions (SPFs) to estimate annual crash occurrence for rural two-lane/two-way roads and rural multilane highways ( 3 ). However, because the SPFs contained in the HSM were developed based on a limited sample of data collected from state highways in select states, direct application of the SPFs and crash modification factors (CMFs) in states with high deer crash proportions can give inaccurate results. This is especially true in Michigan, where, depending on the type of road, nearly 70% of crashes are DVCs ( 1 ). Furthermore, county roadways account for approximately 57% of all rural traffic crashes and 62% of all deer crashes in Michigan ( 3 ). Previous research has found SPFs developed for county-owned roads have a different model shape than SPFs developed for state-owned roads ( 4 – 6 ). In rural portions of Michigan, deer crashes account for approximately 1/3 of all crashes on unpaved roads and 2/3 of all crashes on paved two-lane roads, each of which greatly exceeds the deer crash proportion (0.121) for the data from Washington state that were used to develop the HSM’s rural two-lane/two-way model ( 3 ). Additionally, although the HSM provides details related to local calibration of the models, the fact remains that the HSM’s original SPFs were generated based on data obtained from state highways from a small number of states, and may provide inaccurate results when estimating the safety performance of rural highways in states with high DVC frequency.
Collectively, these issues have significant implications on the transferability of the HSM rural segment models and associated CMFs for use in Michigan, even if calibration is performed. Furthermore, while Michigan-specific SPFs and CMFs have been developed for rural county and state highways, DVCs were categorically excluded from these models to improve the prediction capabilities of the roadway-related factors ( 4 , 5 ). Thus, there is a clear need for further research on the impacts that roadway characteristics have on deer crash occurrence across the primary classes of rural roadways, including county roadways and unpaved roadways. To that end, the primary objective of this research was to determine relationships between roadway characteristics and DVCs across all classes of two-lane rural roadways in Michigan, including both paved and unpaved roadway surfaces. To accomplish this objective, data from statewide rural state highways and a 30-county sample of county-owned roads were collected and subsequently analyzed. The methods and results of this analysis are described in the sections that follow.
Literature Summary
There is currently limited conclusive evidence regarding roadway factors or countermeasures that influence DVCs, which is largely because of difficulties in obtaining accurate data on deer populations and roadway crossing frequency, along with substantial underreporting. Many strategies to mitigate or prevent DVCs have not proven to be effective, including reflective lighting to frighten deer and increased mowing frequency to reduce the roadside cover for deer ( 7 – 9 ). The size of the deer harvest was also not found to have an impact on DVC rates, suggesting that hunting may not be an effective crash reduction strategy ( 8 ). Animal crossing warning signs have shown some evidence of reducing animal-vehicle collisions, although these findings were only supported by crash counts without accounting for differences in mileage or traffic volume between locations with signs versus locations without signs. However, the number of signs per segment was taken into account ( 10 ).
An evaluation of DVC data and deer carcass salvage data from Iowa found that DVCs in urban areas increased when the speed limit was 50 mph or higher, when the adjacent land cover was grassland, and when the right shoulder was a gravel shoulder (as opposed to a paved shoulder). Furthermore, deer crashes were found to be less common on two-lane roads than on multilane ( 11 ).
Odor repellants to deter deer from roadways have shown some promise as a potential countermeasure to mitigate DVCs. Researchers in the Czech Republic found that the use of odor repellants applied to closely-spaced short wooden posts in locations where these crashes are most common could reduce deer crashes by 26–46% assuming the repellant is re-applied every 3 months ( 12 ). However, a study conducted in Ontario found that using various odor-based repellants did not have an impact on which pathways wildlife chose to travel along ( 13 ). Other studies have shown that that, while odor repellants may be effective in reducing DVCs in the short term, wildlife become habituated and therefore the treatments lose effectiveness over time ( 14 , 15 ).
A primary issue with deer crash mitigation strategies is identification of primary deer crossing areas for installation of the treatments. Research has demonstrated that animal crossing events can be detected with over 90% accuracy using a buried sensing cable along the roadside ( 16 ). Although somewhat costly and difficult to maintain, a detection system such as this could provide researchers with data regarding animal crossing locations to determine the appropriate locations for mitigation strategies and could also serve as an activation trigger for certain countermeasures, such as active warning devices. Other research has found that roadkill data can be used to locate potential hot-spots ( 17 ).
Methods
To provide a better understanding of the relationship between various roadway characteristics and DVCs, a comprehensive analysis was performed using data obtained from rural two-lane roadway segments in Michigan. DVC data, traffic volume data, and data for various other roadway characteristics were obtained from a variety of sources for the five-year period of 2011–2015. To provide adequate representation across all classes of rural two-lane roadways, data were collected for both state- and county-owned road segments, including federal aid and non-federal aid roadways, and paved and unpaved surfaces. However, because only 30 Michigan counties were identified to contain an adequate sample of non-federal aid county roadways with available traffic count data, these 30 counties represented the sample frame for all county roads, regardless of federal aid designation. Figure 1 displays a map of all rural state highway study segments, while Figure 2 displays a map of all rural county highway study segments. Details pertaining to the identification of highway segments and collection of the relevant data are provided in the sections that follow.
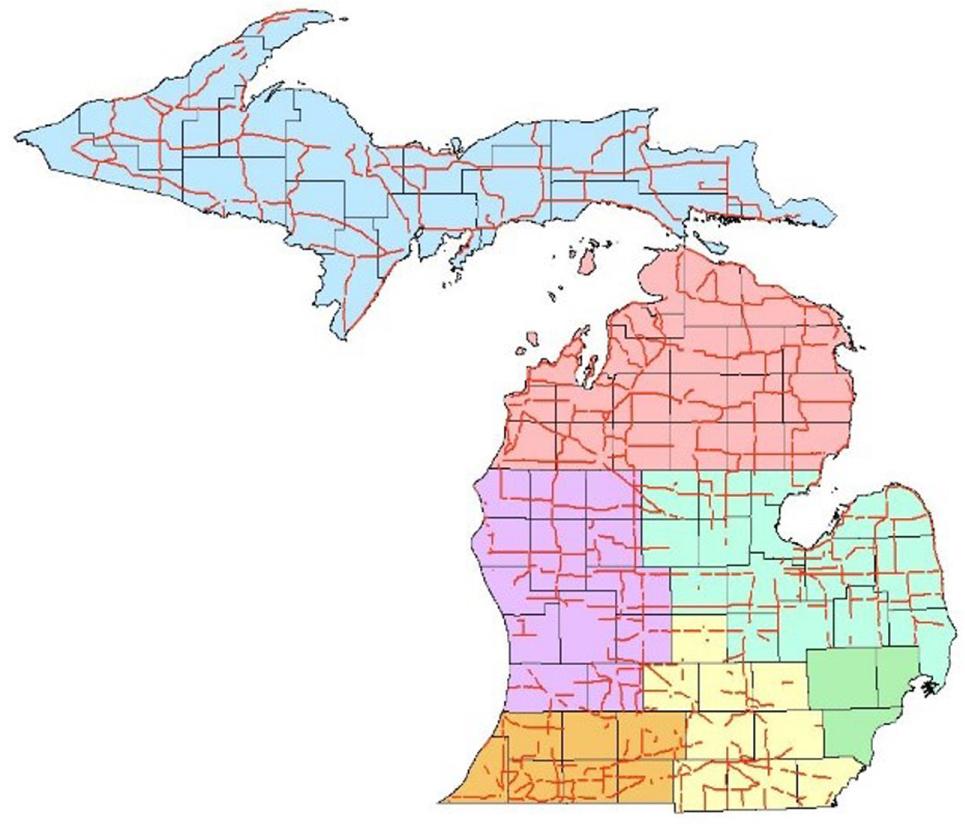
Map of rural state highway study segments.
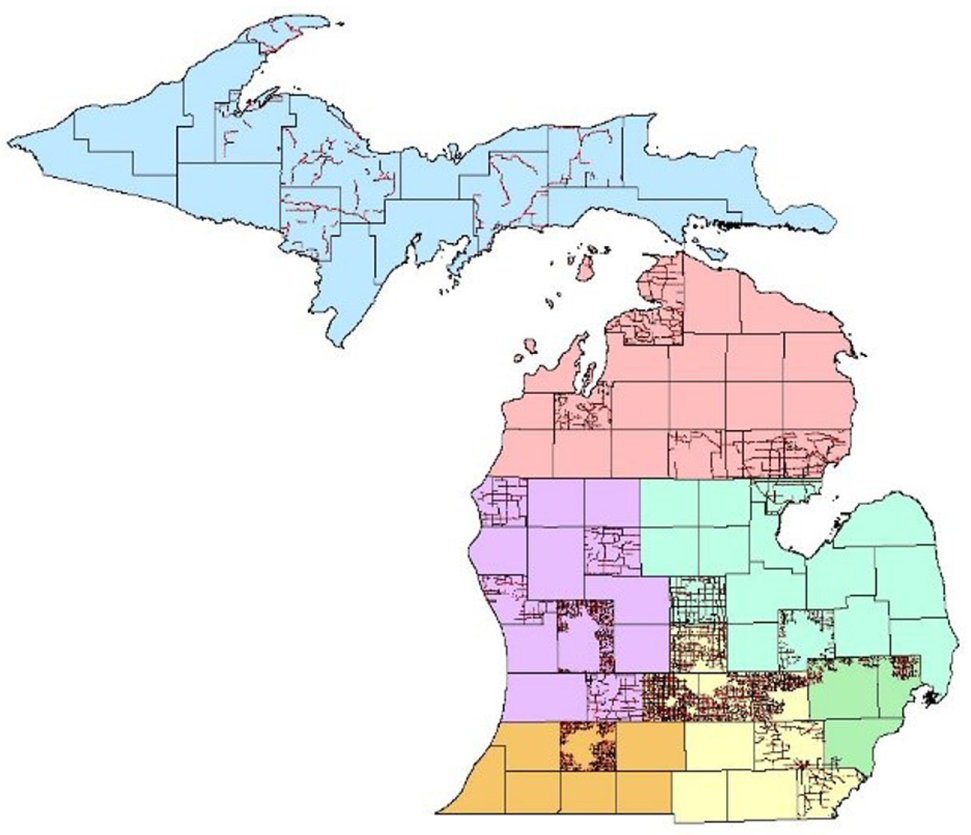
Map of rural county highway study segments.
Roadway Segmentation
The Michigan Geographic Framework (MGF) “All Roads” shapefile was used to provide the spatial basis for collection of the necessary roadway and traffic related attributes ( 18 ). The file represents a digital base map for the state, consisting of all public road segments, in addition to census boundaries and other relevant geographic boundaries and other spatial characteristics across the state. The All Roads shapefile utilizes a linear referencing system (LRS) to divide roadways into homogeneous segments. Begin/end milepoints for each segment are based on a change in one or more primary characteristics, including pavement surface, annual average daily traffic (AADT), major junction, jurisdictional boundary, and numerous other features, and provided the roadway segmentation basis for data collected during this study.
The U.S. Census boundaries were then used to further isolate rural segments for the analysis ( 19 – 22 ). Rural areas are typically defined as locations with populations of fewer than 5,000, consistent with rural SPF research performed in Michigan ( 4 , 5 , 23 , 24 ). However, this research sought to isolate high-speed segments where the statutory rural speed limit of 55 mph would apply. Thus, in addition to rural road segments, any segment residing in an incorporated area (i.e., city or village) or unincorporated census designated place was excluded, regardless of population. This step was important, as speed limit signs are not required on county roadways utilizing the statutory speed limit, making speed limit verification difficult.
It was also necessary to define a minimum segment length for the analysis to lessen the effects of segmentation bias because of features like freeway interchanges bridges, offset intersections, and other features that would result in short segmentation and atypical crash occurrence or injury severity. In accordance with guidance from the HSM, a minimum segment length of 0.1 miles was selected ( 25 ).
Data Collection
Traffic Volumes
Traffic volume data were assembled from a variety of sources depending on the jurisdiction and federal aid designation of the roadway. AADT volume data for all federal aid roadways (state and county) system wide were readily available from the Michigan Department of Transportation (MDOT). Traffic volume data for non-federal aid county roadways were obtained directly from the 30 county road commissions or regional planning commissions for which data were available. In all cases, the traffic volume data collected represented actual counts taken along the particular highway segment, and were not estimated based on data from other roadways. Annual traffic growth factors based on regional and road-type factors were obtained from MDOT and applied to the traffic volumes to adjust to the appropriate analysis year, where necessary. The AADT values were then spatially matched to the appropriate segments via LRS. Level of service (LOS) for the design hour was also available for all state-owned highway segments based on the Highway Capacity Manual’s methodology. GIS software was used to associate the various roadway data, including traffic crashes, traffic volumes, and geometric information, with the respective road segments.
Horizontal Curves
The radius and length of all horizontal curves with radii less than 1008 ft were extracted from the All Roads shapefile. This radius corresponds to a design speed of 55 mph at a 7% superelevation, which was selected because 55 mph was the statutory speed limit for rural highways in Michigan during the analysis period. Curves below 55 mph would generally be considered of a substandard design speed and require curve warning signage. To account for segment breaks across curves, the curve data were aggregated for each segment based both on the length and proportion segment with curvature, in addition to the number of such curves on each segment.
Manual Data Collection
Each segment was reviewed using Google Earth and the following data were collected manually based on the LRS for each segment: number of driveways, surface type (i.e., paved or unpaved), surface width, lane width, number of lanes, shoulder width, and the presence of centerlines, edgelines, or both. Cross-sectional characteristics, including surface width, lane width, and shoulder width were measured using the measurement tool. The precision of this measurement method was validated by comparison with known lane and shoulder width measurements for a sample of segments. Lane and paved shoulder width were recorded to the nearest 0.5 ft. Shoulder width was only recorded if edgelines were present, as a distinction between the lane and shoulder could not otherwise be made. For locations without edgelines, including unpaved roadways, only the overall surface width was recorded. Gravel or earthen shoulders were not recorded because of difficulties in measurement. To account for the overabundance and relatively low utilization of field access points, driveways were only counted if connected to a structure. On state highway segments, lane width, shoulder width, and number of lanes were provided in the state’s master database and verified manually.
Crash Data
DVC data were collected from the annual statewide crash databases maintained by the Michigan State Police for the highway segments included in the analysis. Data were obtained from 2011 through 2015, which was the most recent five-year period available at the time of the study. Only crashes with a roadway area type coded as “midblock segment,” which excluded crashes occurring at a public road intersection, were included. The crash data were aggregated annually and merged with the roadway inventory data for each segment. All relevant crash related fields (i.e., severity, crash type, etc.) were retained within the crash database.
Deer License Data
The state of Michigan does not maintain estimates of deer population for all counties or regions, and as such, a surrogate variable for deer population was needed. The Michigan Department of Natural Resources (DNR) uses a quota system by county to control the number of antlerless deer licenses offered in each county or deer management unit (DMU) for wildlife management purposes. DVCs are among the data used by DNR to determine such quotas. Thus, deer license quotas were favored over bag count or number of licenses purchases as the most compatible proxy factor associated with wildlife management practices ( 26 – 28 ). As the DNR does not maintain a location-specific quota system for antlered deer licenses, antlerless deer license quotas were selected. Annual data for the number of antlerless licenses available per county were normalized on a per square mile basis, and each road segment was associated with the appropriate license density data based on the county and year. The DNR offers a separate quota of licenses for hunting on private land and public land, each of which was considered separately during the analysis.
Descriptive Statistics
A total of 17,285 segments comprising of 12,746 miles of rural two-lane highways in Michigan were analyzed. Of this mileage, 42% were state highways, 35% were paved county federal aid, 11% were paved county non-federal aid, and 12% were unpaved. Tables 1 through 4 show summary statistics for state, county federal aid, county non-federal aid, and unpaved (i.e., gravel) rural roadway segments. Particularly noteworthy is the proportion of deer crashes to total crashes, which is above 0.6 across all roadway types, with the exception of unpaved roads. AADT values ranged from an average of more than 4,000 vehicles per day on state highway segments, to an average of 217 vehicles per day on unpaved segments. All sites across all jurisdictional categories were two-lane roads.
Descriptive Statistics for State Highway Segments (1,556 Segments)
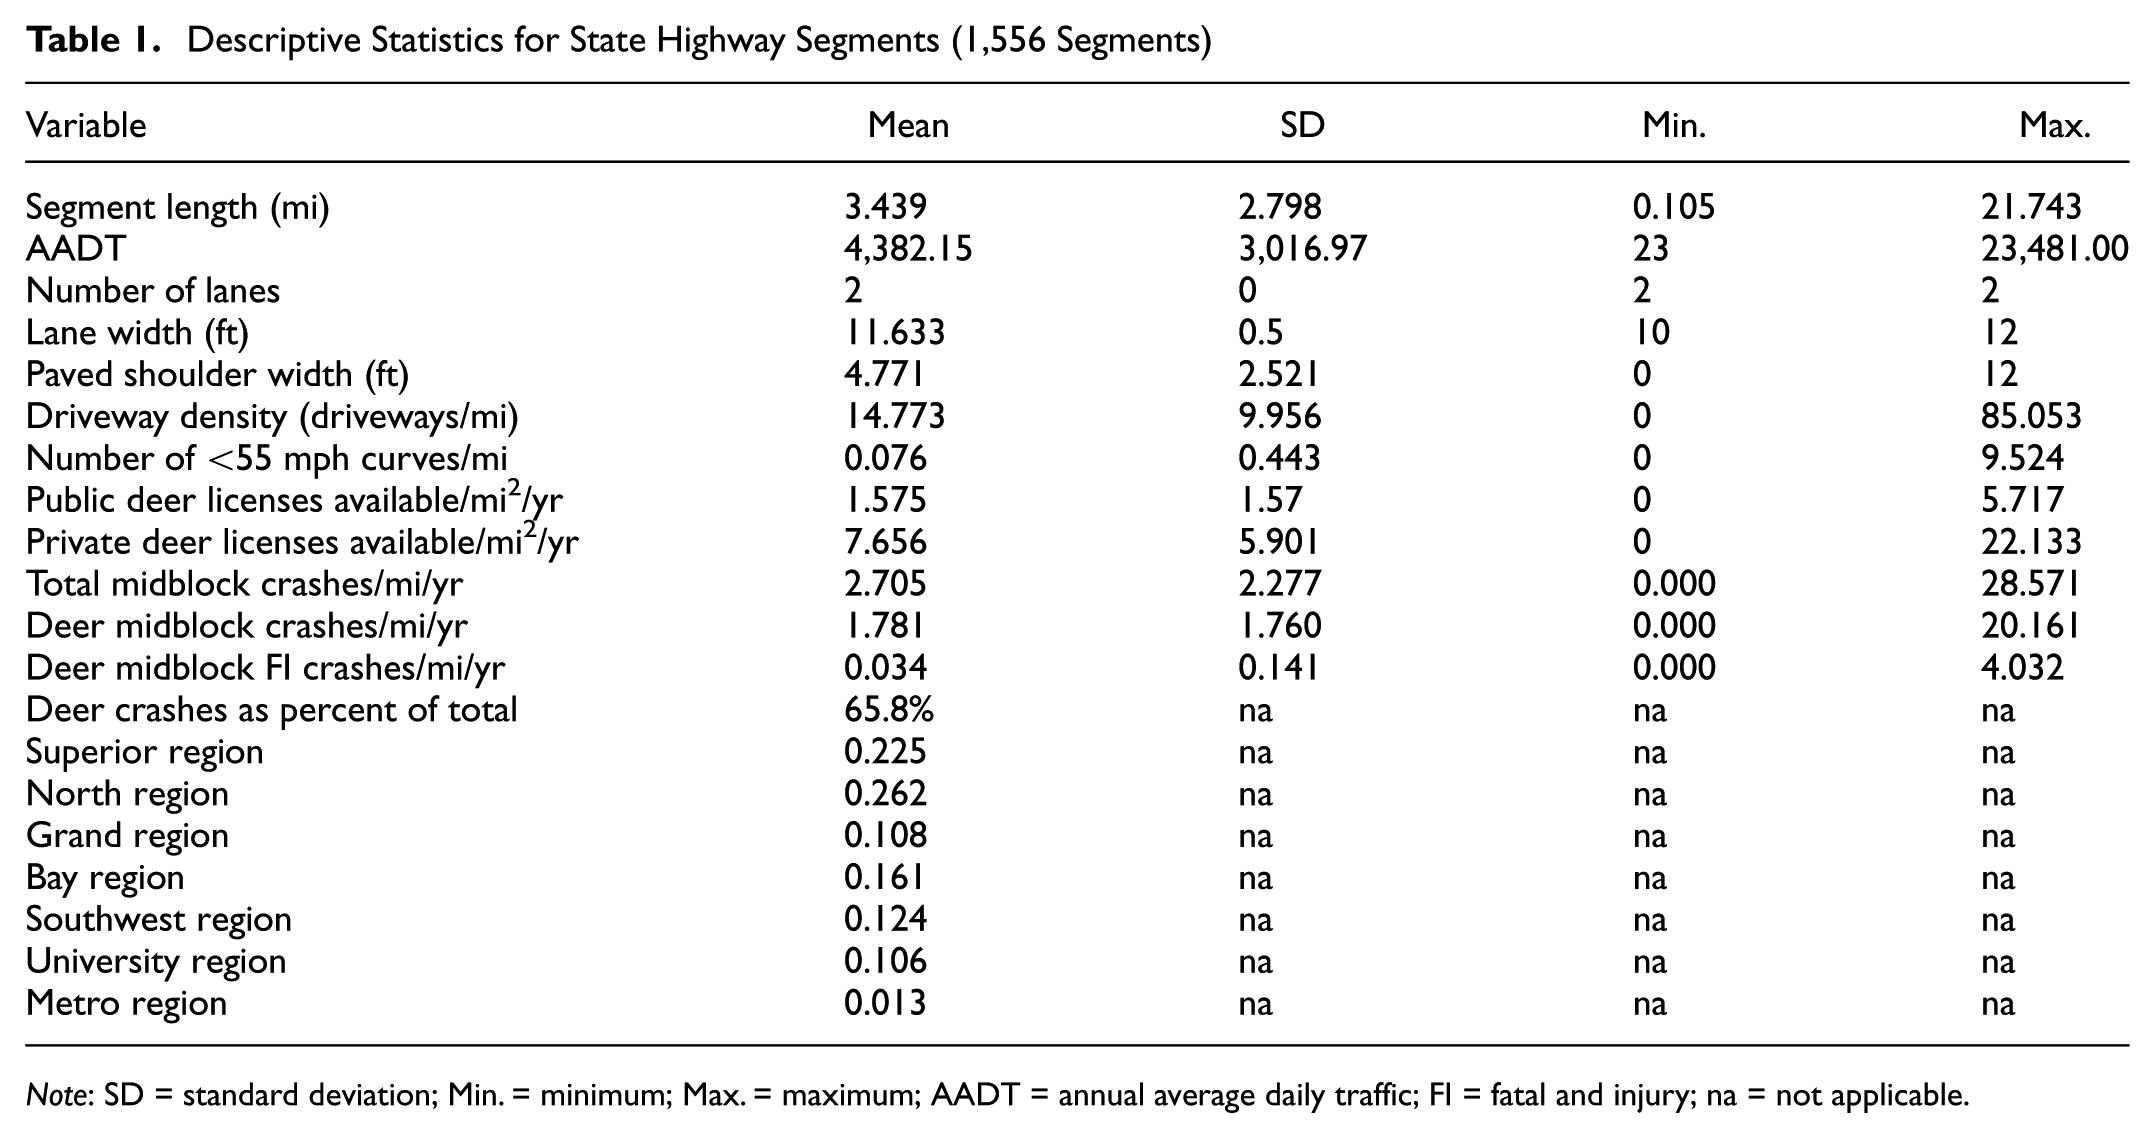
Note: SD = standard deviation; Min. = minimum; Max. = maximum; AADT = annual average daily traffic; FI = fatal and injury; na = not applicable.
Descriptive Statistics for County Federal Aid Segments (9,847 Segments)
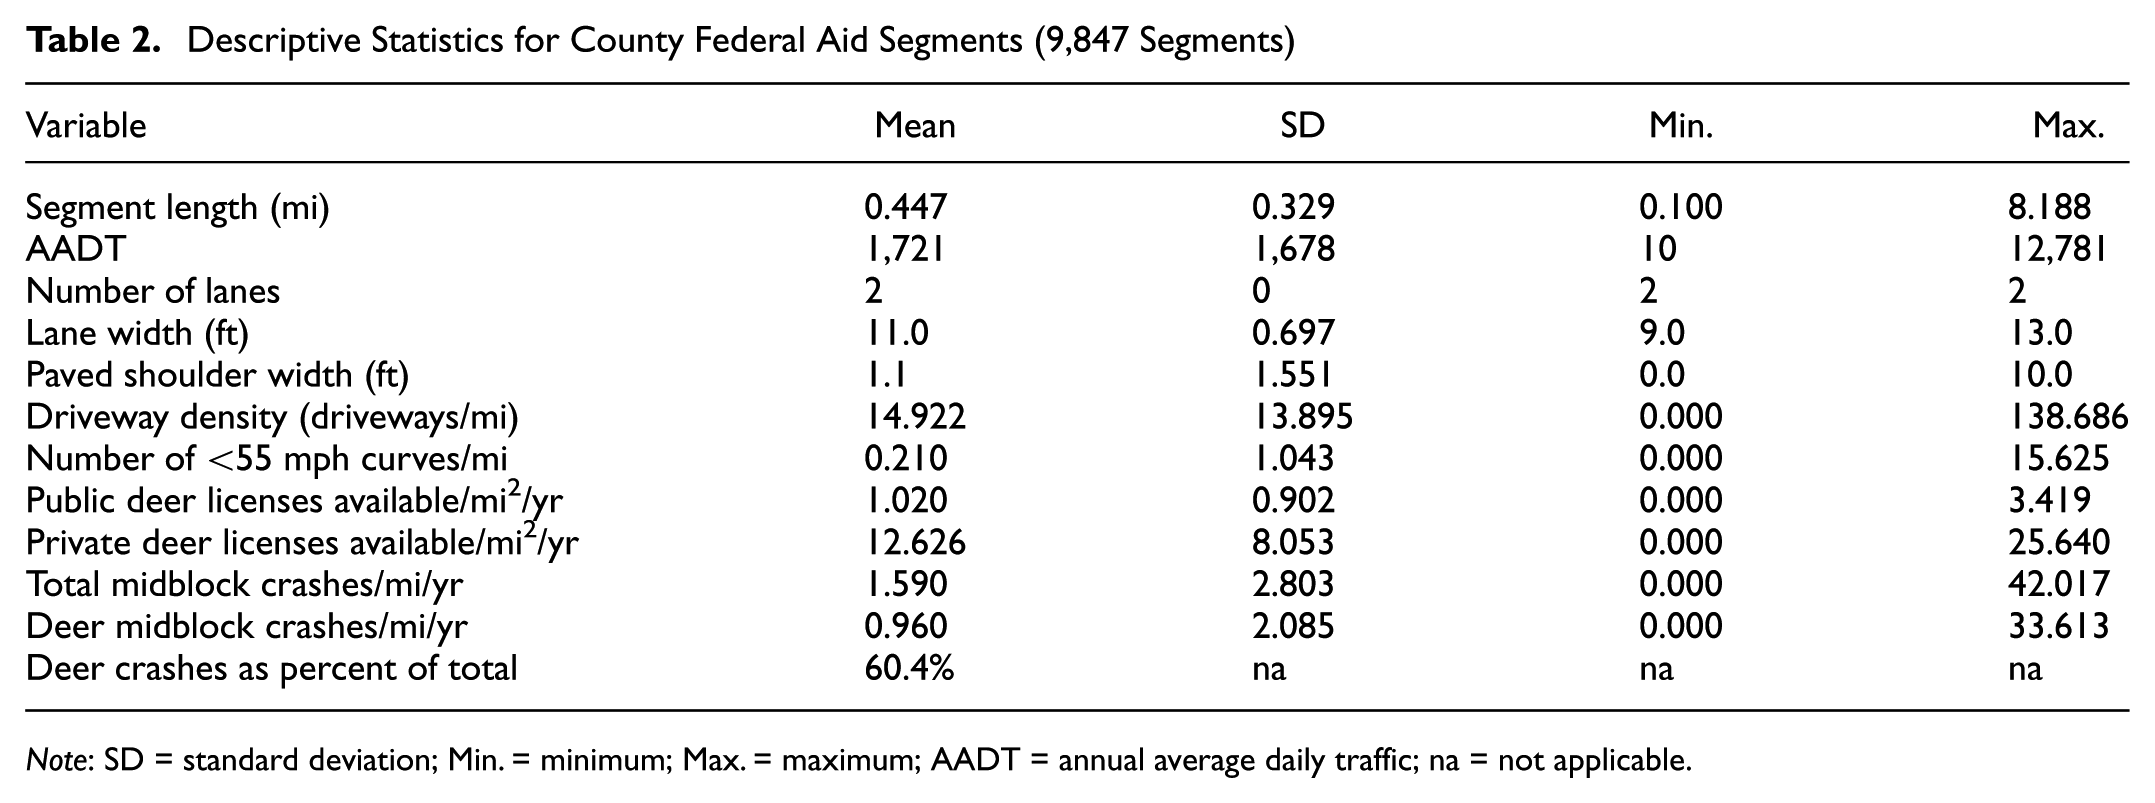
Note: SD = standard deviation; Min. = minimum; Max. = maximum; AADT = annual average daily traffic; na = not applicable.
Descriptive Statistics for County Non-Federal Aid Segments (2,856 Segments)

Note: SD = standard deviation; Min. = minimum; Max. = maximum; AADT = annual average daily traffic; na = not applicable.
Descriptive Statistics for County Unpaved Segments (3,026 Segments)
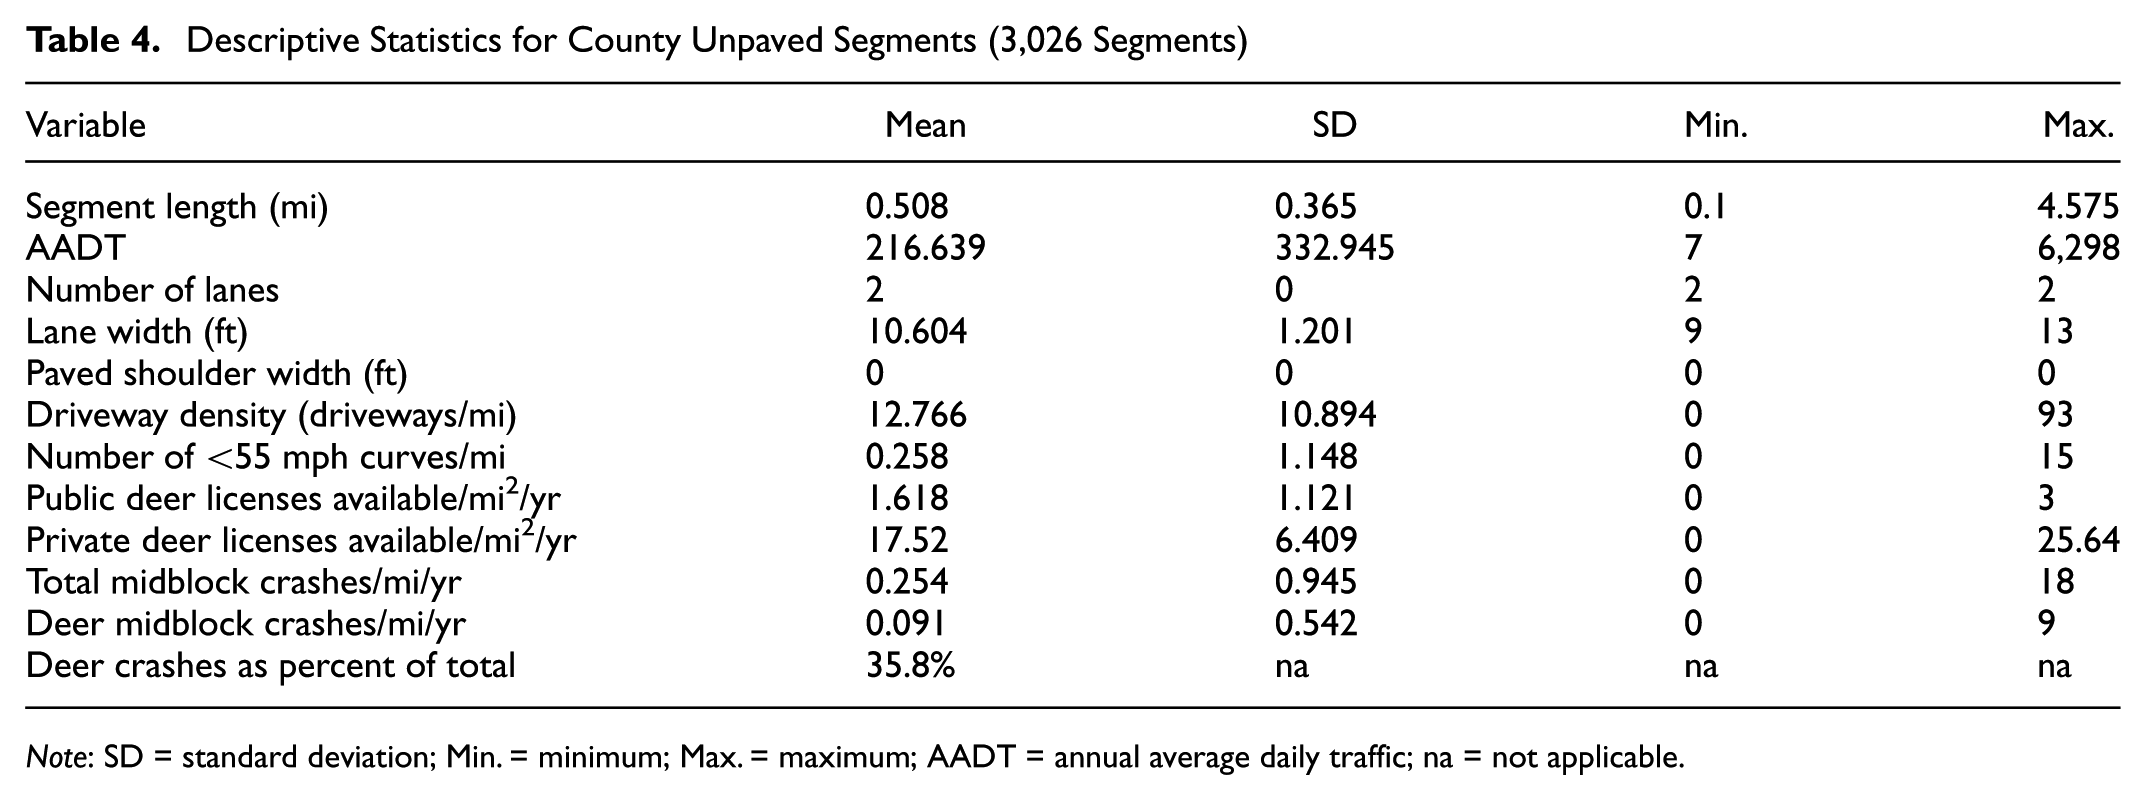
Note: SD = standard deviation; Min. = minimum; Max. = maximum; AADT = annual average daily traffic; na = not applicable.
Segments were constrained to those with lane widths between 9 ft and 13 ft for all analyses, which accounts for 100% of state-owned segments, 99.3% of county federal aid segments, 99.4% of county non-federal aid segments, and 84.4% of unpaved segments. Lane widths were rounded to the nearest foot (i.e., 10.5 ft was rounded to 11 ft), as suggested by the HSM.
Analysis
As crash data are comprised of non-negative integers, traditional regression techniques (e.g., ordinary least-squares) are generally not appropriate. Given the nature of such data, the Poisson distribution has been shown to provide a better fit and has been used widely to model crash frequency data. In the Poisson model, the probability of segment i experiencing yi crashes during a one-year period is given by Equation 1:

where P(yi) is probability of segment i experiencing yi crashes and
A limitation of this model is the underlying assumption of the Poisson distribution that the variance is equal to the mean. As such, the model cannot handle overdispersion wherein the variance is greater than the mean. Overdispersion is common in crash data and may be caused by data clustering, unaccounted temporal correlation, model misspecification, or ultimately by the nature of the crash data, which are the product of Bernoulli trials with unequal probability of events ( 26 ). Overdispersion is generally accommodated through the use of negative binomial models (also referred to as Poisson–gamma models), as recommended by the HSM for development of SPFs ( 25 ).
The negative binomial model is derived by rewriting the Poisson parameter for each segment as
This dataset encompassed the entire state of Michigan, which has varying weather patterns by region, as well as differences in deer populations not captured within the license quota data. Additionally, many of the road segments contained in the dataset are under the jurisdiction of county road commissions, with varying design standards and maintenance practice. In line with previous research (
4
), to account for these unobservable differences, a region-specific random effect was included in the model. Furthermore, to account for temporal variation across the five-year study period, the crash year was also included as a random effect. Random effects incorporate into the model an error term,
Results and Discussion
Separate mixed effects models were generated for each of the roadway types (state, county federal aid, county non-federal aid paved, and county unpaved) and across various crash severity classes. The mixed effects negative binomial regression models yielded several interesting results. The full model results for state highways, county federal aid, county non-federal aid, and unpaved segments are presented in Tables 5–8, respectively.
Mixed Effects Negative Binomial Model for Deer Crashes on State Highway Segments
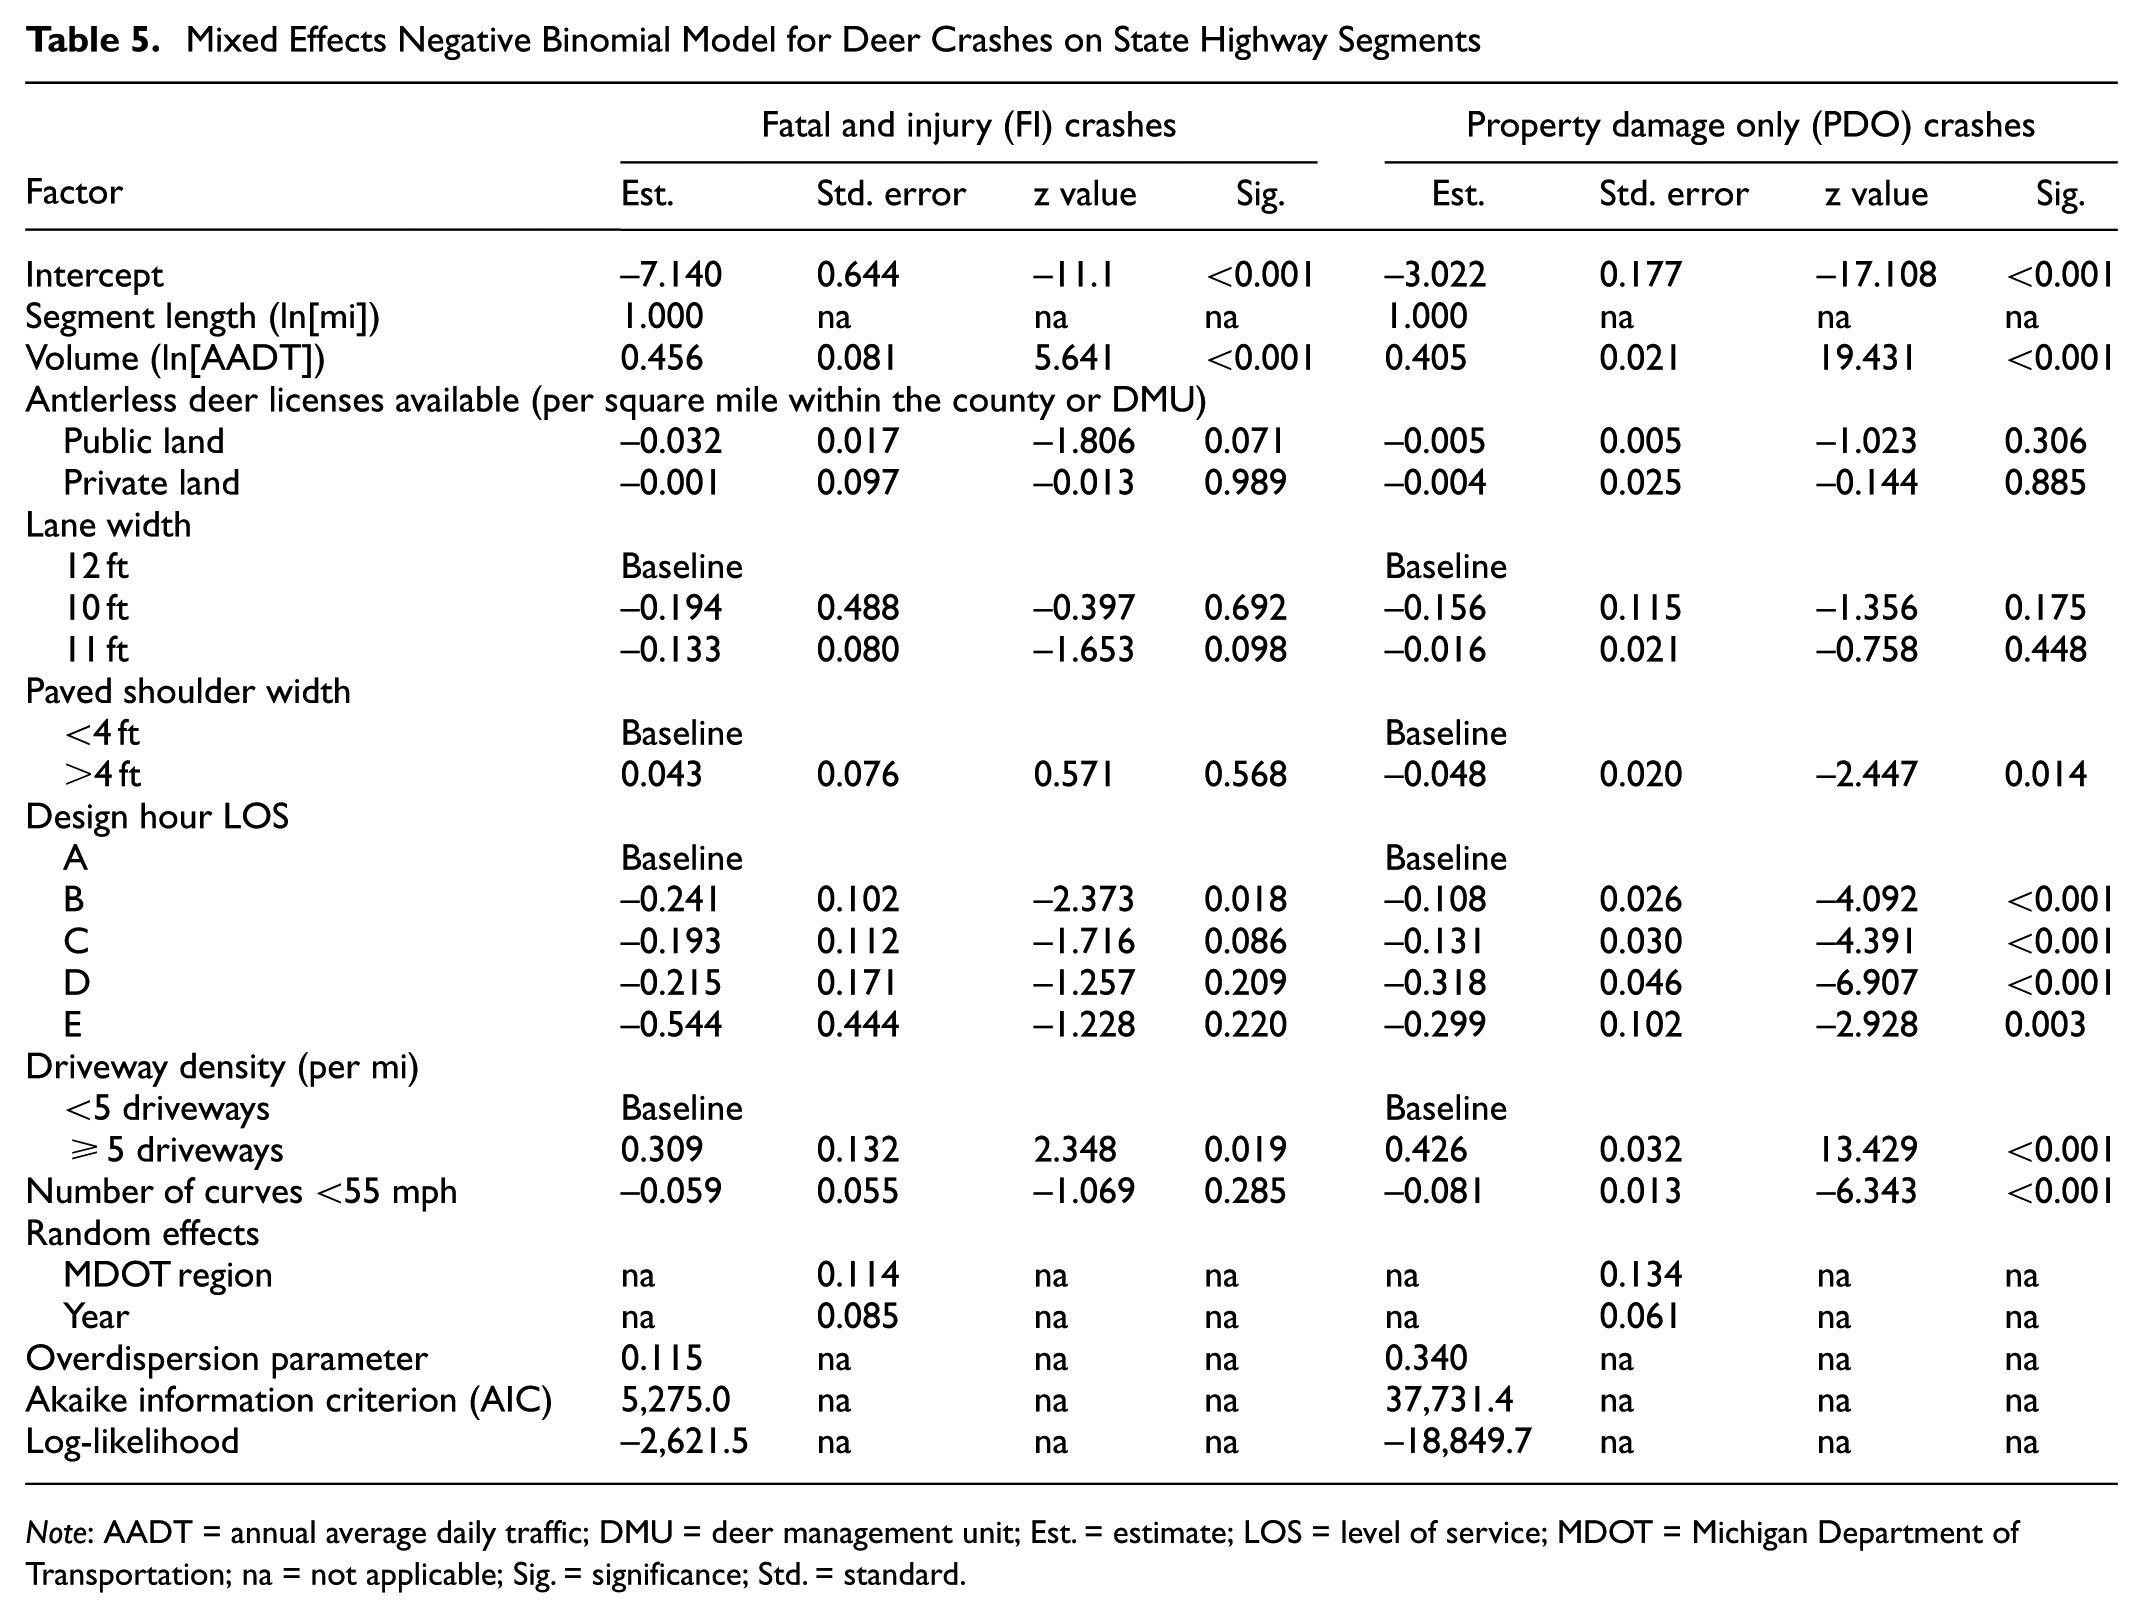
Note: AADT = annual average daily traffic; DMU = deer management unit; Est. = estimate; LOS = level of service; MDOT = Michigan Department of Transportation; na = not applicable; Sig. = significance; Std. = standard.
Mixed Effects Negative Binomial Model for Deer Crashes on County Federal Aid Segments
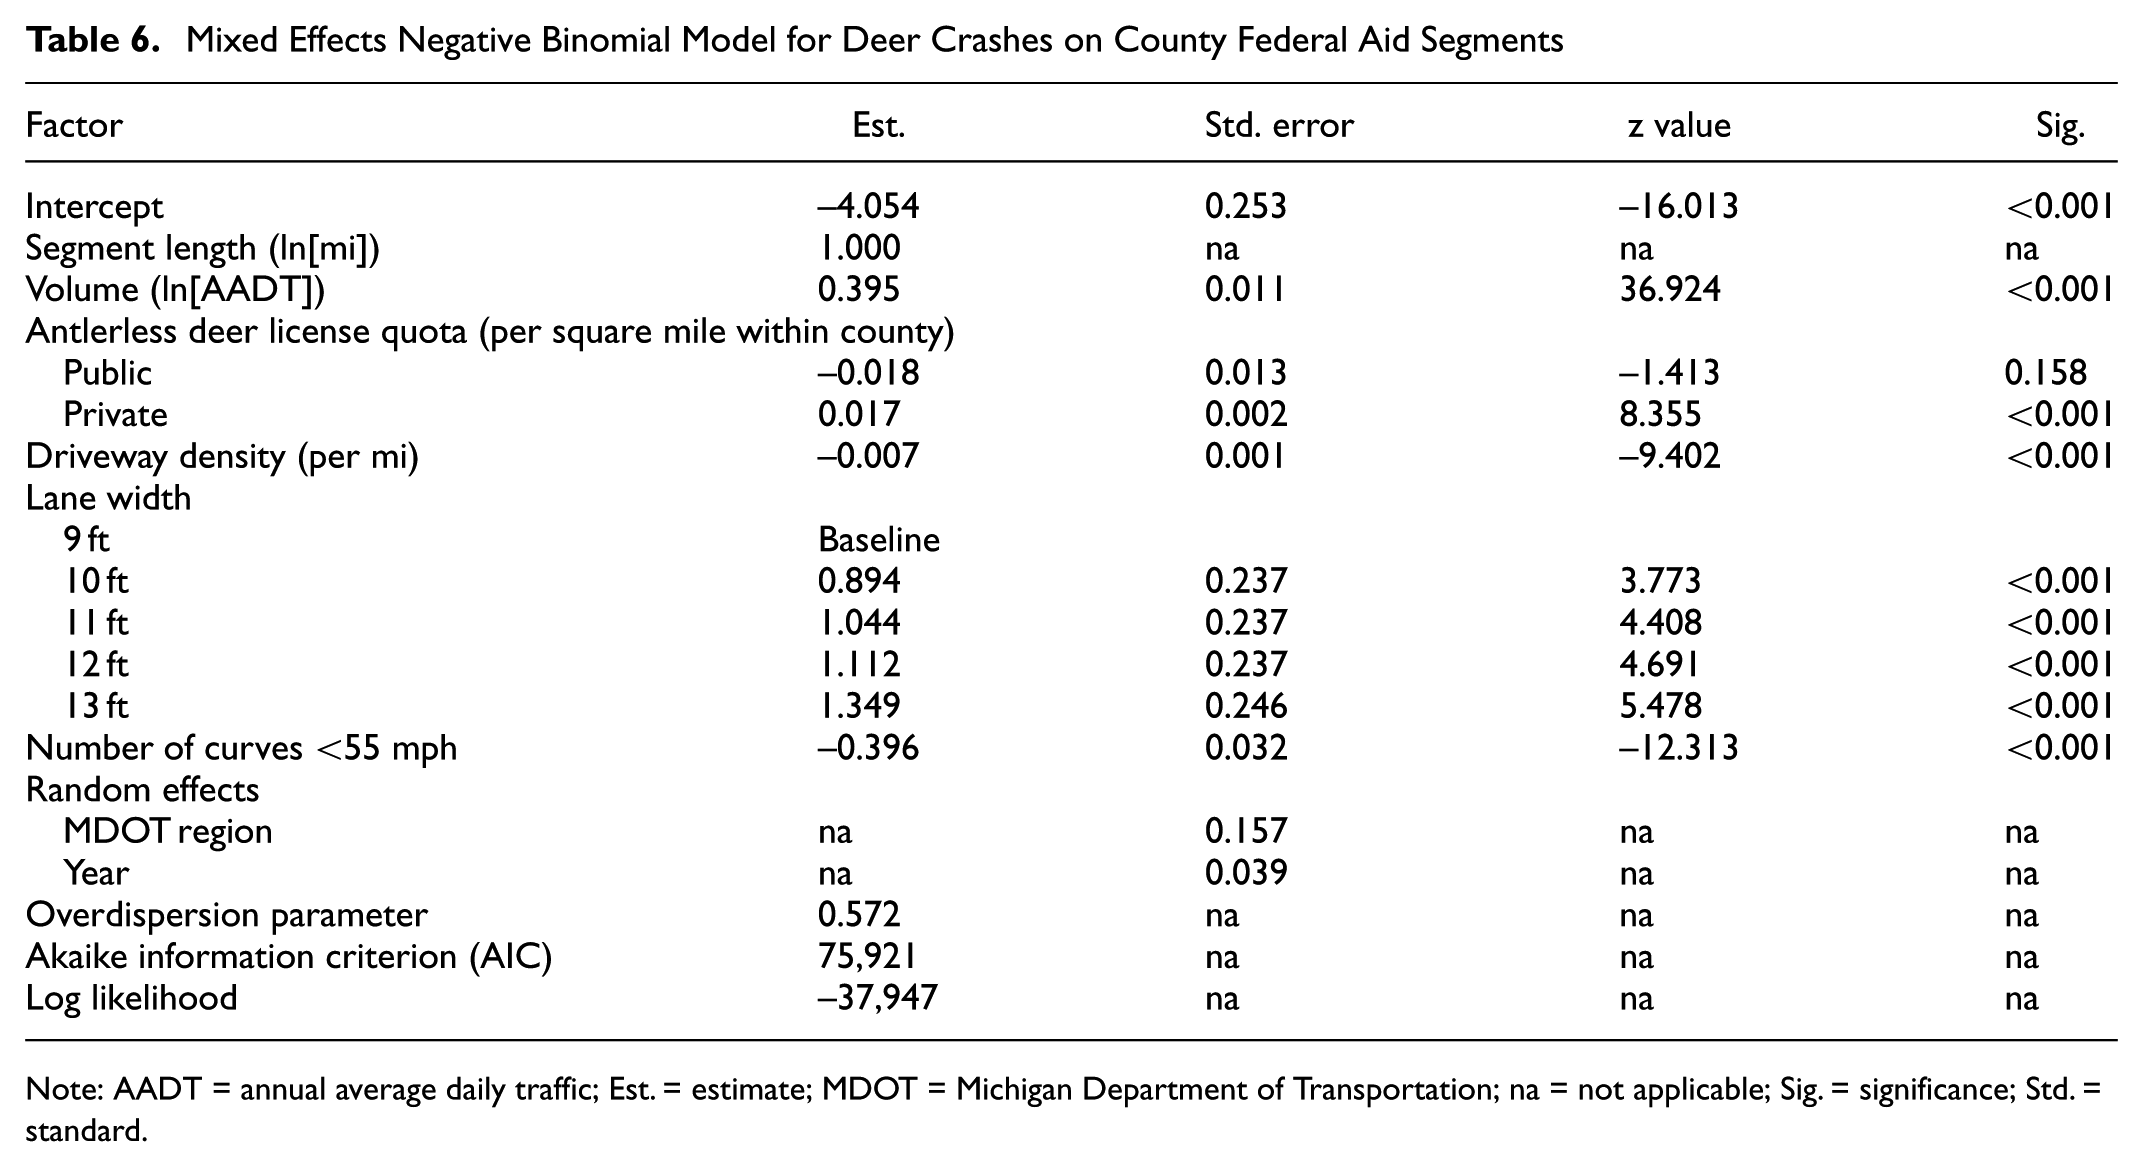
Note: AADT = annual average daily traffic; Est. = estimate; MDOT = Michigan Department of Transportation; na = not applicable; Sig. = significance; Std. = standard.
Mixed Effects Negative Binomial Model for Deer Crashes on County Non-Federal Aid Segments
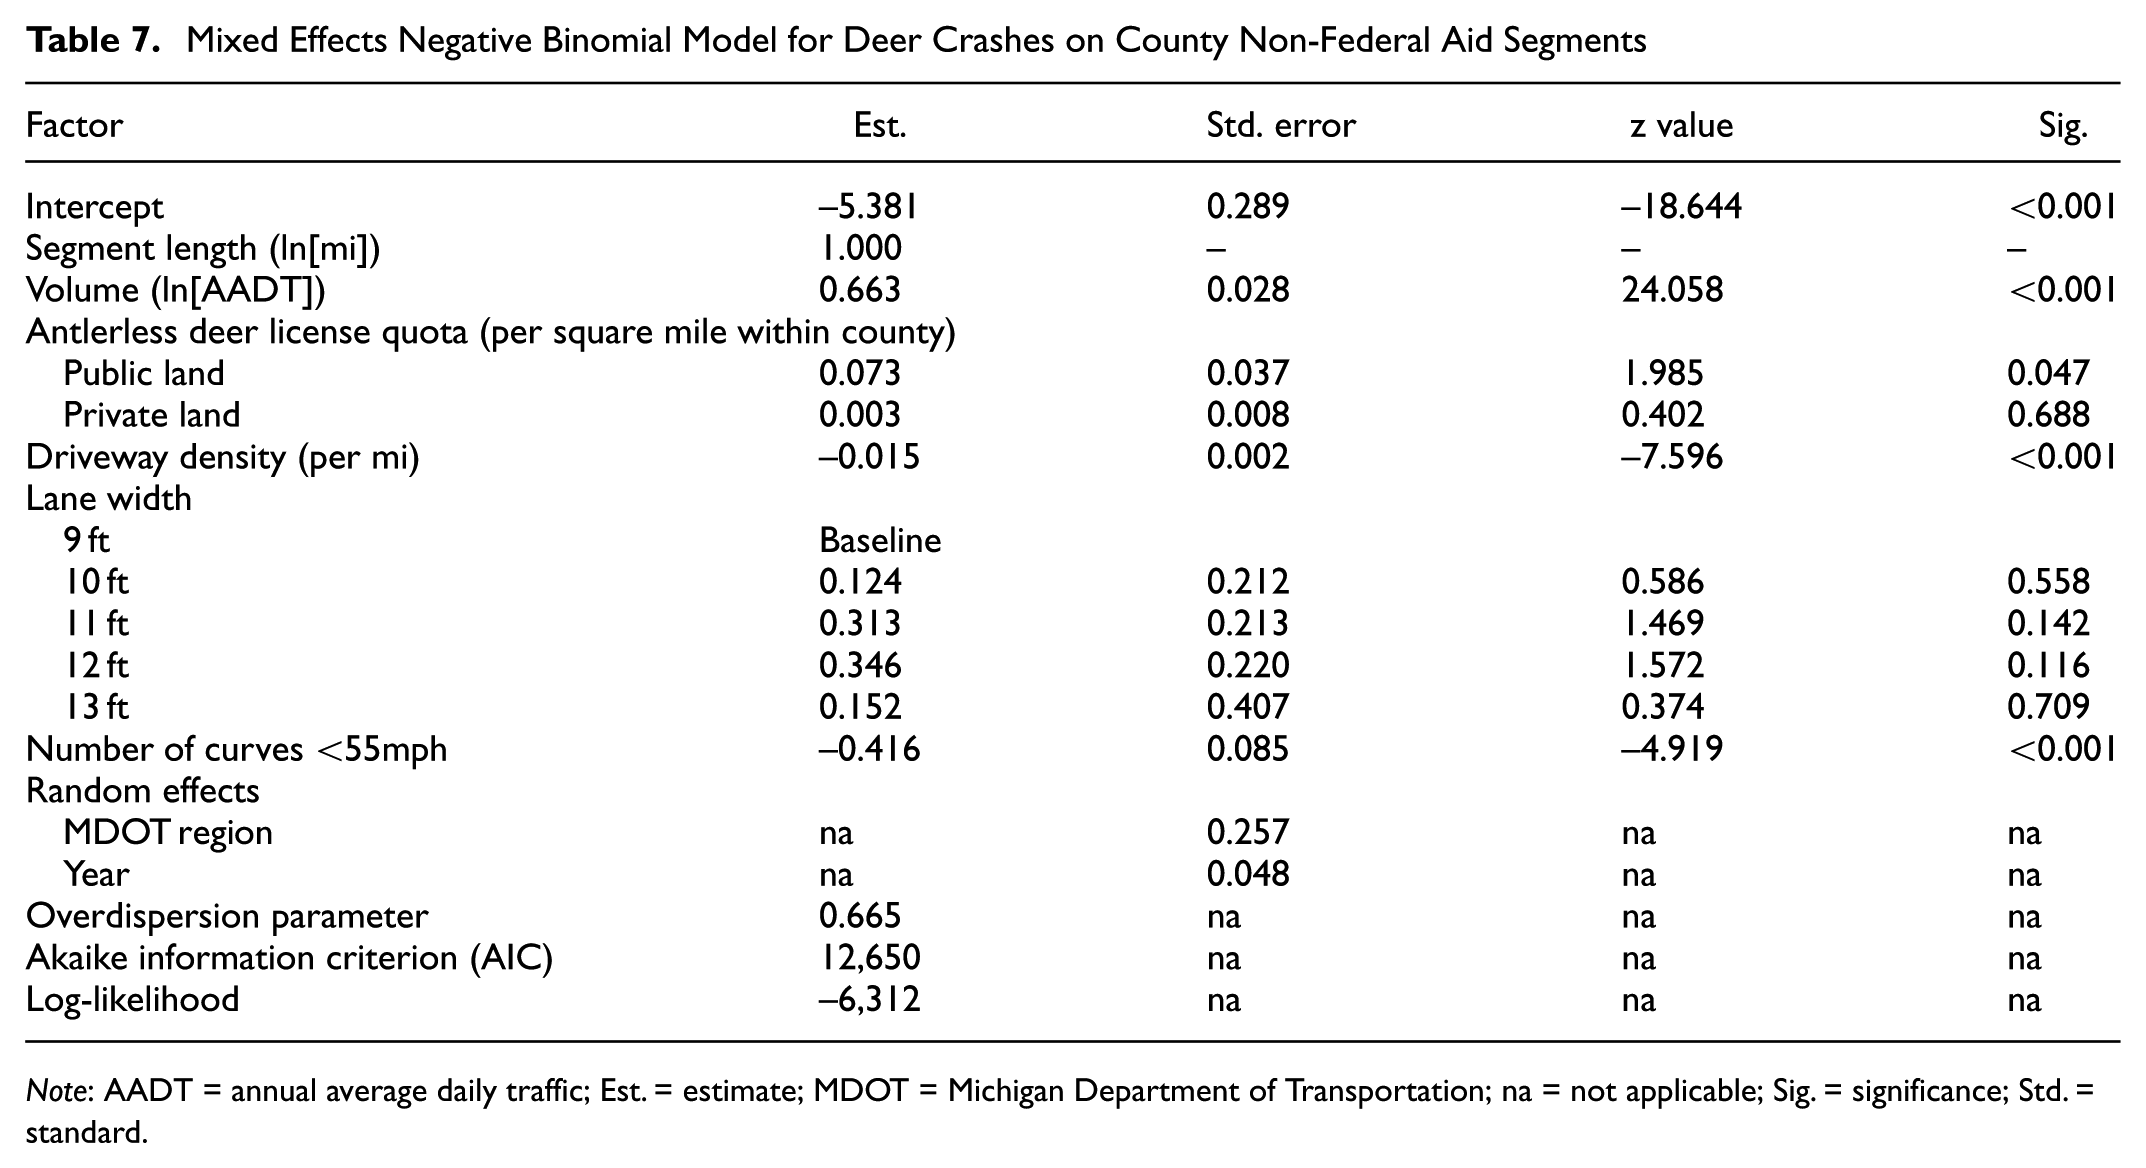
Note: AADT = annual average daily traffic; Est. = estimate; MDOT = Michigan Department of Transportation; na = not applicable; Sig. = significance; Std. = standard.
Mixed Effects Negative Binomial Model for Deer Crashes on Unpaved Segments
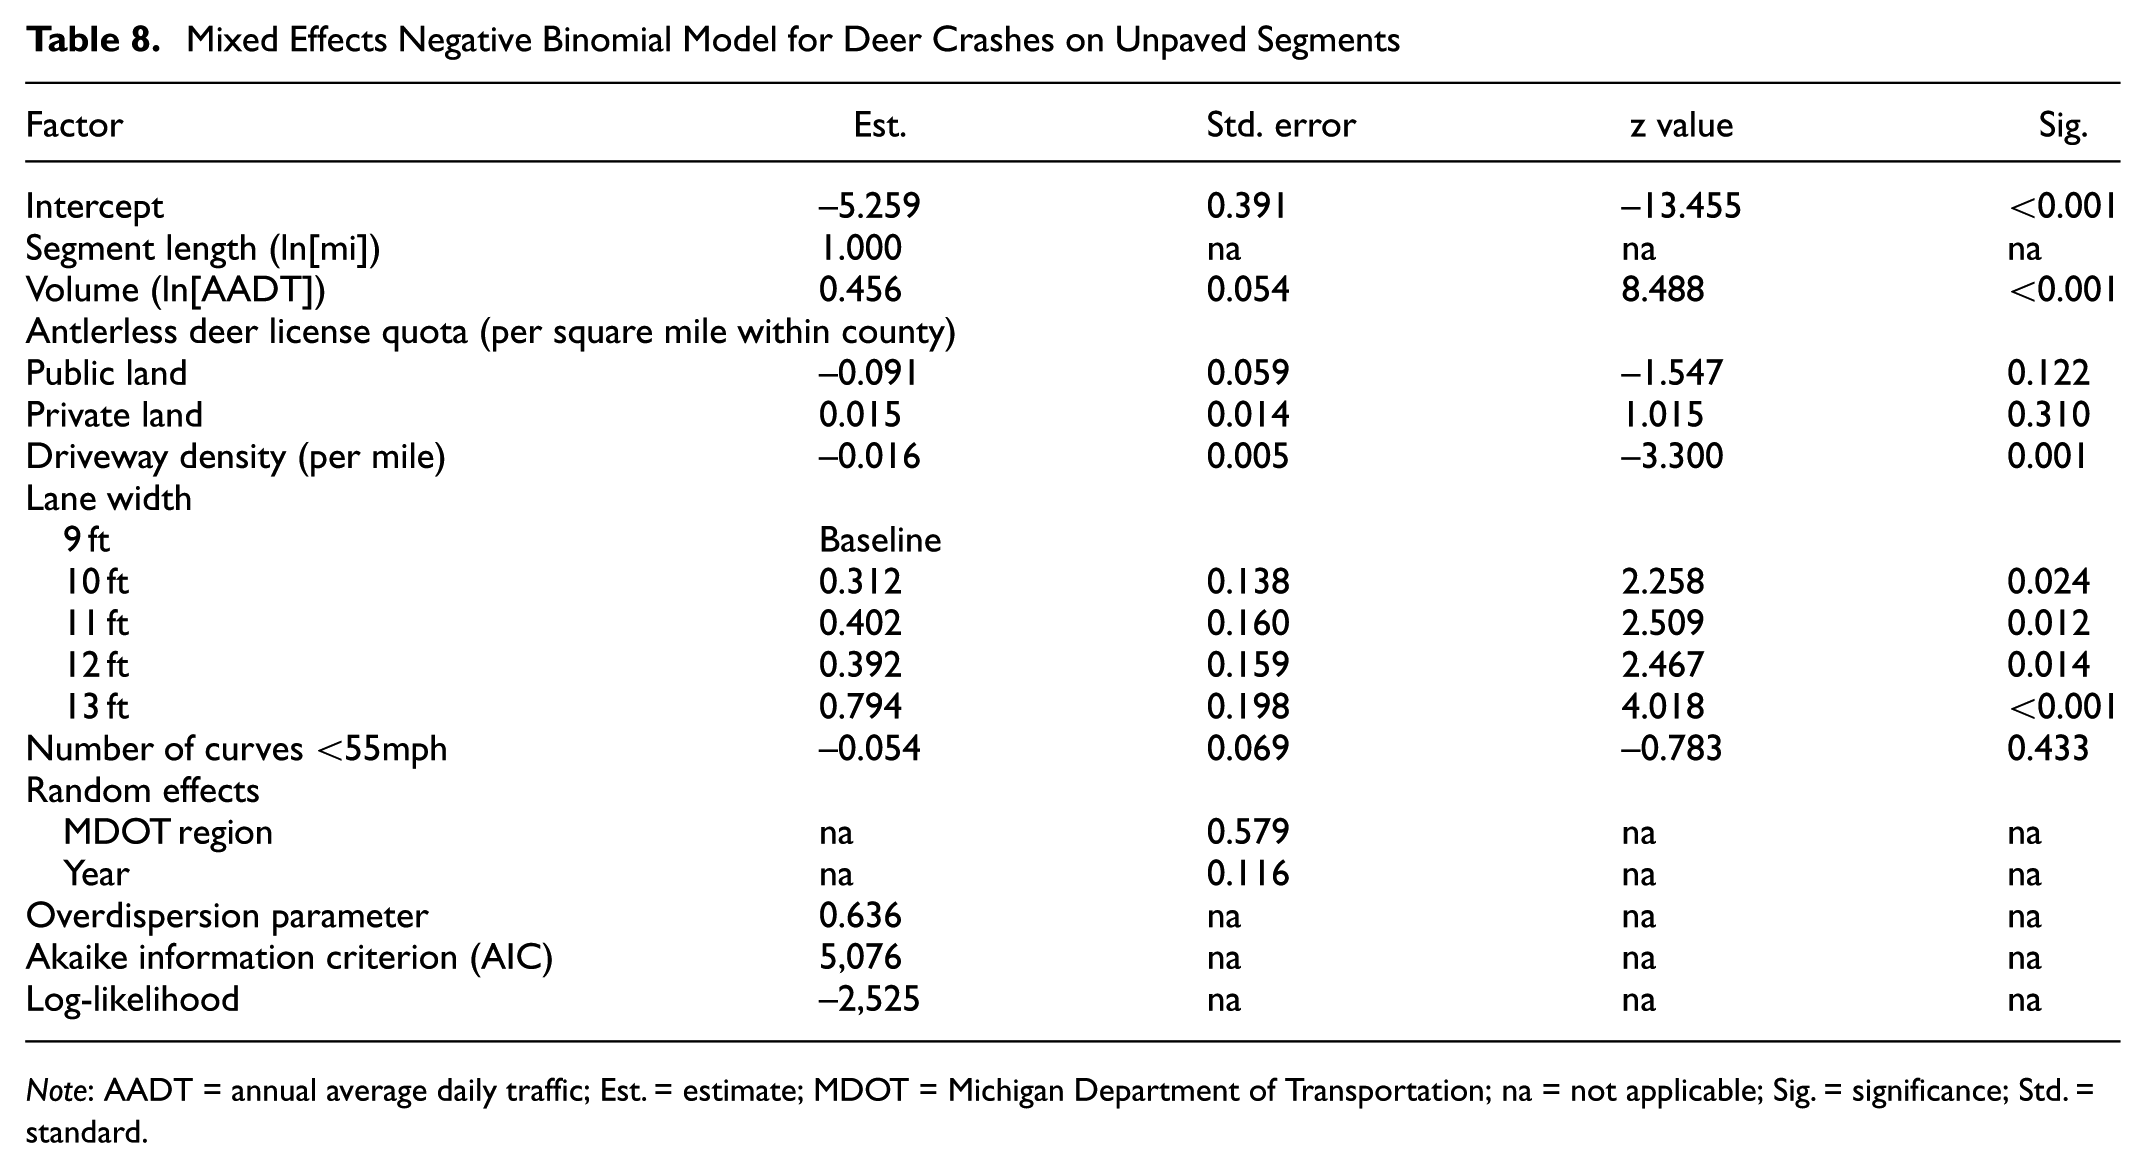
Note: AADT = annual average daily traffic; Est. = estimate; MDOT = Michigan Department of Transportation; na = not applicable; Sig. = significance; Std. = standard.
Speed-Related Factors
In all cases, factors related to operating speed were found to be a significant predictor variable for deer crashes. This is an intuitive finding, as faster speeds give drivers less time to react to deer, increasing the likelihood of collision. For example, wider lanes were associated with increased crashes in the case of county federal aid, county non-federal aid, and unpaved segments, although this relationship was not significant on county non-federal aid segments. In particular, on county federal aid segments, a 12-ft lane was associated with 24% greater deer crashes than a 10-ft lane, while on unpaved segments, it was associated with 8% greater crashes. These results were consistent on state highways as well, where 12-ft lanes were associated with 14% greater fatal and injury (FI) deer crashes relative to 11-ft lanes. The effect of lane width was not significant for 10-ft lanes, or property damage only (PDO) crashes on state highway segments. While lane width was not significant for county non-federal aid segments, the results still suggested increased crashes with wider lanes, consistent with all other segment type categories. These findings are consistent with the notion that wider lanes are associated with faster speeds, perhaps contributing to greater crash occurrence, particularly those involving injury ( 31 ).
On the other hand, wider shoulders were associated with fewer PDO crashes, perhaps because of the increased separation between the roadside and traveled way along with the additional recovery area when evasive maneuvers are necessary for collision avoidance. Prior research supports the notion that wider roadside cross-sections, which wider shoulders imply, decrease the likelihood of deer entering the travel lanes ( 11 ).
Analysis of segment LOS provided perhaps another indication of the association between faster speeds and increased deer crashes. MDOT’s roadway inventory file includes design hour (i.e., peak period) LOS ratings for all state highway segments, which was subsequently included in the state highway model. Relative to the highest LOS, A, all other LOS showed a significant decrease in deer crashes, including decreases in fatal and injury crashes. With PDO crashes, where all categories of LOS were statistically significant, each decline in LOS was associated with a further decline in deer crashes. These findings further indicate that free-flow traffic conditions contribute to greater deer crash occurrence.
A greater number of curves with design speeds below the 55 mph speed limit was also associated with a decrease in deer crashes on paved roads across all jurisdictional categories, again indicating a relationship between speed and deer crashes. However, the number of curves was not a significant factor on unpaved roads. This could be because of drivers generally traveling more slowly on unpaved roads, providing additional reaction time. This hypothesis is supported by the lack of deer crashes in relation to total crashes on unpaved roads (36%) compared with state highways, county federal aid, and county non-federal aid roadways (66%, 60%, and 60%, respectively).
These results are shown graphically in Figure 3, which shows the estimated number of annual crashes for each road type category (under the following base conditions: no paved shoulder, 12-ft lanes, no driveways, no substandard curves) compared with the same road classification and conditions, but assuming one <55 mph curve on the segment.
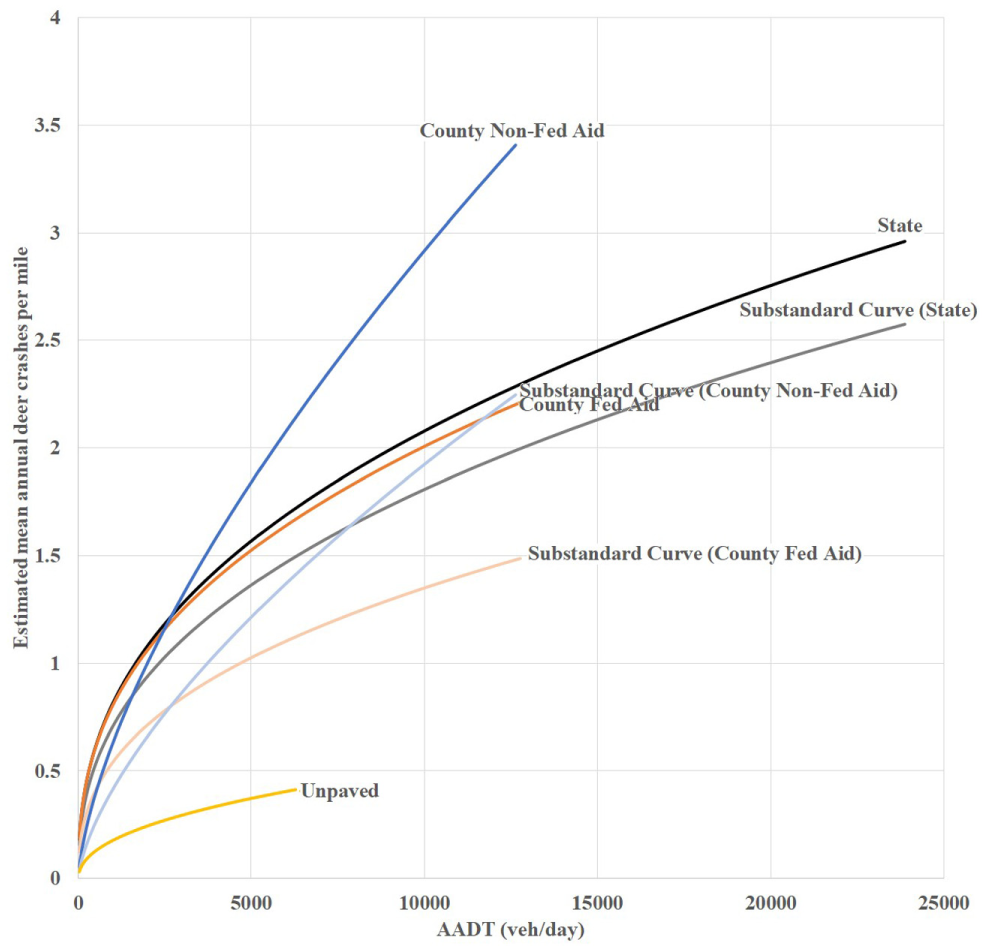
Deer crash model results for segments with and without a substandard curve.
Other Factors
Driveway density was also a significant factor in deer crashes across all categories, although this result differed between the state and county segments. On state highway segments, driveway density was associated with an increase in deer crashes. Anecdotally, hunters will modify and manipulate trails and access roads to direct deer to them, as wildlife will often use human-made paths ( 32 , 33 ). However, this trend did not hold for county segments, where driveway density was associated with a small decline in deer crashes, perhaps because of the increased human presence associated with greater driveway density. Further research is needed to more completely investigate the relationship between driveway density and deer crashes.
Lastly, the quotas of antlerless deer licenses offered (public and private separately) by the Michigan DNR were included as variables. This variable was intended to serve as a surrogate for area-specific deer management practices, as antlerless deer licenses are the only type of deer hunting license offered in Michigan possessing geographic restrictions to incentivize hunting in specific areas. Unfortunately, the results for the deer quota variable were inconsistent in relation to significance and sign, and very small in magnitude. This could indicate several conclusions, the most obvious of which is that incentivizing deer hunting in specific locations does not significantly influence the occurrence of DVCs on rural highways. However, there are several limitations certainly leading to the statistical uncertainty that readers should be aware of. This variable measures the density of antlerless deer licenses available in the county or DMU where the particular road segment lies. This is geographically imprecise, and some DMUs span several counties, making this even less precise. Further, there is no geographic licensing system for antlered deer (bucks) and, even more problematic, a lack of deer population estimates by county or region.
Summary, Conclusions, and Recommendations
The primary objective of this research was to determine relationships between deer crashes and roadway characteristics across all classes of two-lane rural roadways in Michigan, including both paved and unpaved roadway surfaces. To accomplish this objective, roadway segment data, including deer crashes, traffic volumes, and various roadway characteristics, were collected both for a statewide sample of rural state highways and a 30-county sample of rural county roads. The data were subsequently analyzed using mixed effect negative binomial modeling techniques.
The results showed that speed-related roadway factors, including lane width, shoulder width, horizontal curvature, and peak LOS, had a significant effect on DVCs across most classes of rural two-lane roadway segments in the state of Michigan. Wider lanes were associated with a greater occurrence of deer crashes, perhaps because of higher prevailing travel speeds. Conversely, horizontal curves with design speeds lower than the statutory speed limit were associated with fewer deer crashes, perhaps because of lower travel speeds on curved segments. Wider shoulders, which afford greater separation between the travel lanes and the roadside, were found to significantly reduce deer crash occurrence, furthering the hypothesis that wider clear zones are associated with a decrease in deer activity. The speed-related factors had less of an effect on unpaved rural roads, which, because of the nature of the roadway surface, generally experience lower travel speeds, which likely contributes to a lower occurrence of deer crashes. The number of available hunting licenses, a potentially useful predictor, did not have a consistent influence on DVCs.
Policymakers and practitioners can use this information in several ways. Primarily, decision-makers should be aware of the impact speed-related geometric features have on deer crashes, particularly as the state continues its trend of raising speed limits on highways and freeways in rural areas. For instance, the conventional wisdom is that wider lanes are safer, but this may not be the case in locations with high deer populations because of higher travel speeds and subsequent reduced reaction times. Adding or widening paved shoulders and widening the clear-zone may also help mitigate DVCs in problem areas. Further research needs to be conducted to determine a more precise relationship between vehicle speeds, speed limit policy, or both, and DVCs, as well as the relationship between the roadside conditions and these crashes. Such research would also be aided by deer population estimates at the county level.
Footnotes
Acknowledgements
Funding for this research was provided by MDOT.
Author Contributions
The authors confirm contribution to the paper as follows—study concept and design: TJG; data collection: AI; analysis and interpretation of results: SYS; draft manuscript preparation: SYS. All authors reviewed the results and approved the final version of the manuscript.
The Standing Committee on Safety Data, Analysis and Evaluation (ANB20) peer-reviewed this paper (19-02361).
This publication is disseminated in the interest of information exchange. MDOT expressly disclaims any liability, of any kind, or for any reason, that might otherwise arise out of any use of this publication or the information or data provided in the publication. MDOT further disclaims any responsibility for typographical errors or accuracy of the information provided or contained within this publication. MDOT makes no warranties or representations whatsoever regarding the quality, content, completeness, suitability, adequacy, sequence, accuracy, or timeliness of the information and data provided, or that the contents represent standards, specifications, or regulations.