
Abstract
Origin–destination (O–D) demand is a critical component in both online and offline dynamic traffic assignment (DTA) systems. Recent advances in real-time DTA applications in large networks call for robust and efficient methodologies for online O–D demand estimation and prediction. This study presents a day-to-day learning framework for a priori O–D demand, along with a predictive data-driven O–D correction approach for online consistency between predicted and observed (sensor) values. When deviations between simulation and real world are observed, a consistency-checking module initiates O–D demand correction for the given prediction horizon. Two predictive correction methods are suggested: 1) simple gradient method, and 2) Taylor approximation method. New O–D demand matrices, corrected for 24 simulation hours by the correction module, are used as the updated a priori demand for the next day simulation. The methodology is tested in a real-world network, Kansas City, MO, for a 3-day period. Actual tests in real-world networks of online DTA systems have been very limited in the literature and in actual practice. The test results are analyzed in time and space dimensions. The overall performance of observed links is assessed. To measure the impact of O–D correction and daily O–D updates, traffic prediction performance with the new modules is compared with the base case. Predictive O–D correction improves prediction performance in a long prediction window. Also, daily updated O–D demand provides better initial states for traffic prediction, enhancing prediction in short prediction windows. The two modules collectively improve traffic prediction performance of the real-time DTA system.
Origin–destination (O–D) trip demand plays a critical role in operational planning and real-time traffic management. It consists of estimates of trip demand distributed over time and space. Together with an underlying traveler behavioral model and trip assignment rules, O–D trip demand is a fundamental component in both online and offline dynamic traffic assignment (DTA) systems, which predict how trip makers are distributed over time and space in a given network. Recent advances in DTA research highlight the deployment of this approach for large-scale real-time applications ( 1 ). To tackle the inherent complexity and intractability of the problem, simulation-based DTA models such as DYNASMART ( 2 ) and DynaMIT ( 3 ), and other mesoscopic DTA simulators, have been developed and implemented in real-time large-network problems for the past two decades. Accordingly, research on obtaining accurate time-varying O–D demand matrices for large networks has attracted more attention.
Notwithstanding the importance of accurate O–D demand, solving time-varying O–D demand estimation problems for large networks is not trivial. Related studies in the literature can be categorized into “minimum information” (entropy maximizing) models and statistical inference approaches such as generalized least squares ( 4 ), maximum likelihood models, and Bayesian inference models. In the former approach, an estimate of the O–D demand can be directly obtained by the solution (entropy measure). The latter estimates the parameters of a probabilistic distribution of a target O–D matrix. Readers can find a detailed literature review in Ben-Akiva et al. ( 5 ). These approaches are inappropriate for use in a real-time DTA system for several reasons. First, these approaches rely on (outdated) historical data. O–D demand matrices obtained from historical data at system initialization may become inaccurate—or even obsolete—as traffic and the network evolve in a continuous manner ( 6 ). Furthermore, gaining O–D demand matrices even from state-of-the-art offline O–D demand estimation methodologies is computationally expensive and time-demanding ( 7 ). Consequently, it is essential to develop a robust and computationally efficient methodology for online O–D estimation and prediction for a real-time DTA system.
Whereas offline O–D estimation aims to obtain an O–D demand matrix that best fits network performance measures that are fully defined for the time period of interest, the main purpose of the online methodology is to update a priori demand by utilizing the data available up to the moment. Therefore, the principal objective is to find efficient and systematic procedures to amalgamate real-time observation into a priori to acquire more accurate O–D demand. With increasing availability of rich datasets and improved computing power, new strategies have emerged through recent studies that incorporate various forms of input data: sensor data obtained from traffic surveillance systems such as loop detectors, video camera ( 8 ) or automatic vehicle identification ( 9 , 10 ), and digital footprints from individual travelers ( 11 , 12 ). The Kalman filter approach is the natural direction to take in the methodologies that use a series of measurements over time for producing estimates of unknown variables of interest ( 13 ). Ashok and Ben-Akiva modified this approach by defining deviations in O–D flow as a state-vector in their formulation ( 14 ). In this study, autoregressive (AR) models are used to estimate and predict time-varying O–D flows to capture the spatio-temporal demand pattern with the covariance matrix. AR model-based methods assume the given problem follows a stationary random process with constant mean and variance. However, this assumption is invalid if the target O–D demand is structurally different from a priori O–D demand. Zhou and Mahmassani used Kalman filtering framework to distinguish structural deviations of demand from the regular pattern and random fluctuations ( 15 ). In the study, Taylor’s theorem, which captures local variation trends with a quadratic approximation, is applied to predict the subsequent states within a rolling horizon. These studies utilize the link flow and the traffic assignment matrix to calculate the deviation and estimate unobservable O–D demand. This approach ignores two important facts: (1) incorrect traffic assignment matrix is another possible error source, and (2) congestion, which is not accurately captured by a DTA simulation, could also be an underlying reason for link flow deviation. This calls for improvement in online O–D estimation and prediction methodology.
The performance of real-time traffic estimation and prediction applications is determined by the learning capacity of DTA systems in representing traffic states in the real world. For this purpose, it is necessary to apply appropriate adjustments of input and model parameters based on the unfolding real-time traffic condition. Several papers have made contributions toward this end. Doan et al. designed the general framework for an online monitoring system for real-time DTA applications and corresponding periodic adjustments to narrow the bandwidth of estimated deviations of the predicted time-varying traffic states from real-time observation ( 16 ). Mahmassani et al. proposed real-time and offline modules for consistency checking ( 17 ). Kang designed a feedback controller for a real-time long-term consistency checking module ( 18 ). This module is designed as a proportional-integral-derivative (PID) controller, which continuously calculates an error between estimation and measurement and applies a correction based on, as named, proportional, integral and derivative terms. The authors proposed an algorithm that periodically updates O–D demand and flow propagation based on density discrepancy, which measures the difference of congestion level in simulation from the real-world network. Zhou and Mahmassani validated the online consistency checking and O–D updating module in a real-world network ( 19 ).
Although applying online monitoring and correction, these works rely on offline estimation for the time-consuming process of prior O–D demand estimation with full information. However, traffic management systems that run 24/7 require an on-going adaptive process to obtain O–D demand matrices that reflect day-by-day traffic evolution. In this context, the importance of gaining time-varying O–D demand that reflects unfolding real-world traffic state on a daily basis has been underscored as a vital research need. This work is aimed at addressing that need through the implementation of two main features: 1) online O–D correction, utilizing the consistency checking record and 2) daily update of a priori O–D demand. The case study that runs the suggested approach for a multiple-day period in real-world is presented below.
Framework
This paper proposes and tests a framework for predictive O–D demand correction based on consistency checking and day-to-day a priori O–D updating. Figure 1 illustrates input and output data flow in the proposed online O–D estimation methodology, which is designed as a PID controller. As described, flow and density deviations initiate the O–D demand adjustment. At part (1) in Figure 1, a priori input from the O–D demand library enters the O–D estimation module. In this step, flow deviation measured on observed links is converted to the structural deviation of O–D demand and this parameter is fed to the O–D demand prediction module to adjust the O–D demand matrix. In part (2), the input of O–D demand over the traffic prediction horizon is prepared. The limitation of O–D prediction is that the observation period is too short in comparison to the prediction horizon and the adjustment parameter remains constant in the prediction period. To devise a time-varying and trend-sensitive intervention in O–D prediction, the predictive O–D adjustment module was designed as follows. The long-term consistency checking module (LTCC) adjusts input demand to keep the estimated state comparable to the unfolding real-world state based on density discrepancy in simulation from the observation. In part (3), the O–D adjustment module takes the time series of this adjustment for a rolling horizon from the LTCC module. Then, a time-varying O–D correction is applied during the prediction period. Two methods to determind the time-varying adjustment factor are discussed later in detail. The set of O–D demand matrices, corrected for 24 simulation hours in the running system, is archived in the O–D demand library as an updated a priori demand in part (4). It is designed to learn the most recent demand pattern and use it for next day simulation in a continuous manner.
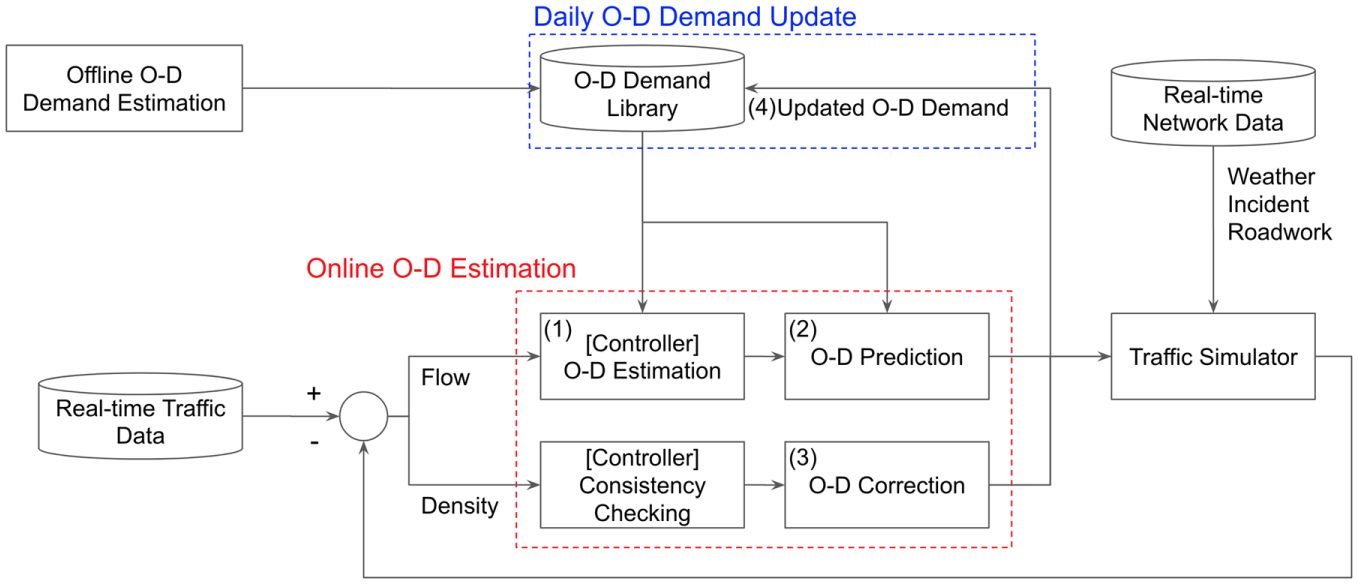
Input/output flow in the suggested real-time DTA system.
Notation
Long-Term Consistency Checking and Reactive Demand Correction
The main purpose of LTCC is to keep the estimated traffic state as close as possible to the observed real-world state by adjusting the input demand. The basic assumption in LTCC is that the contribution of O–D pair


where


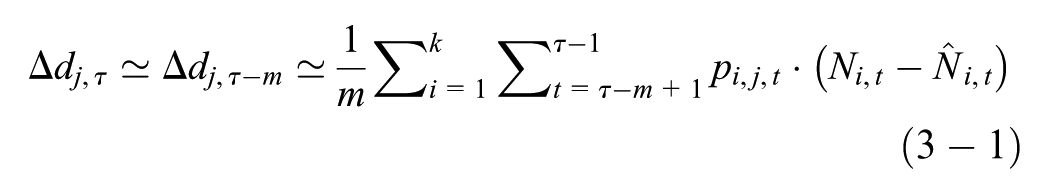
Predictive Demand Correction
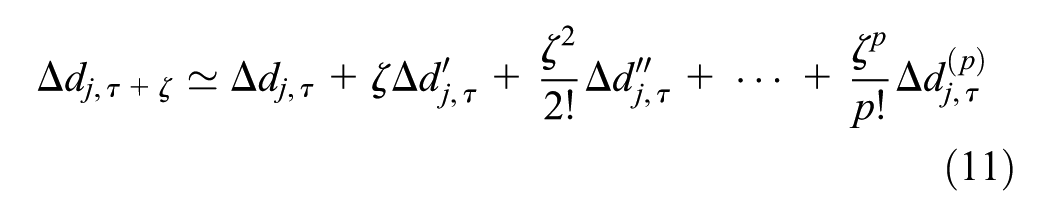
When the prediction horizon of a traffic state is much longer than the observation period for O–D correction, the most recent correction factor,
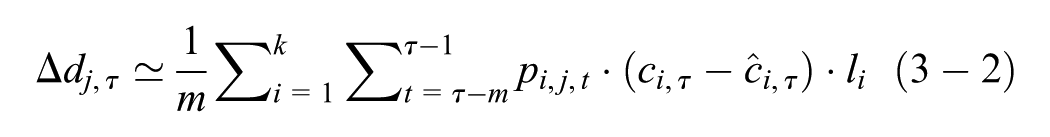
Illustrative examples of two predictive demand correction methods.
Simple Gradient Method


where
Taylor Approximation
where
Common


Case Study
Study Area and Data Description
A southern portion of Kansas City, Missouri was selected as the case study region. This is also the testbed for the Integrated Modeling for Road Condition Prediction (IMRCP) project, initiated by FHWA. It includes a congested interstate corridor and neighboring arterials. Specifically, the I-435 corridor carries heavy commuter traffic in an east–west orientation. The depicted network in Figure 3 consists of 2,006 links (purple lines), 870 nodes (green dots), and 69 zones. The real-time traffic measurements (speed, volume, and occupancy) are livestreamed from 150 detectors (red dots) implemented in the area. Also, the road condition information, including roadwork, incident, and weather forecast, is used and taken into account in the real-time Traffic Estimation and Prediction System (TrEPS). For the a priori O–D estimation, 24 h detector input data from September 7, 2016 were selected to represent normal weekday traffic. Since July 2017, the system has been working 24/7. Among 150 detectors along I-435, U.S. Route 69 and I-49, 33 detectors were selected for real-time observation after data quality checking.
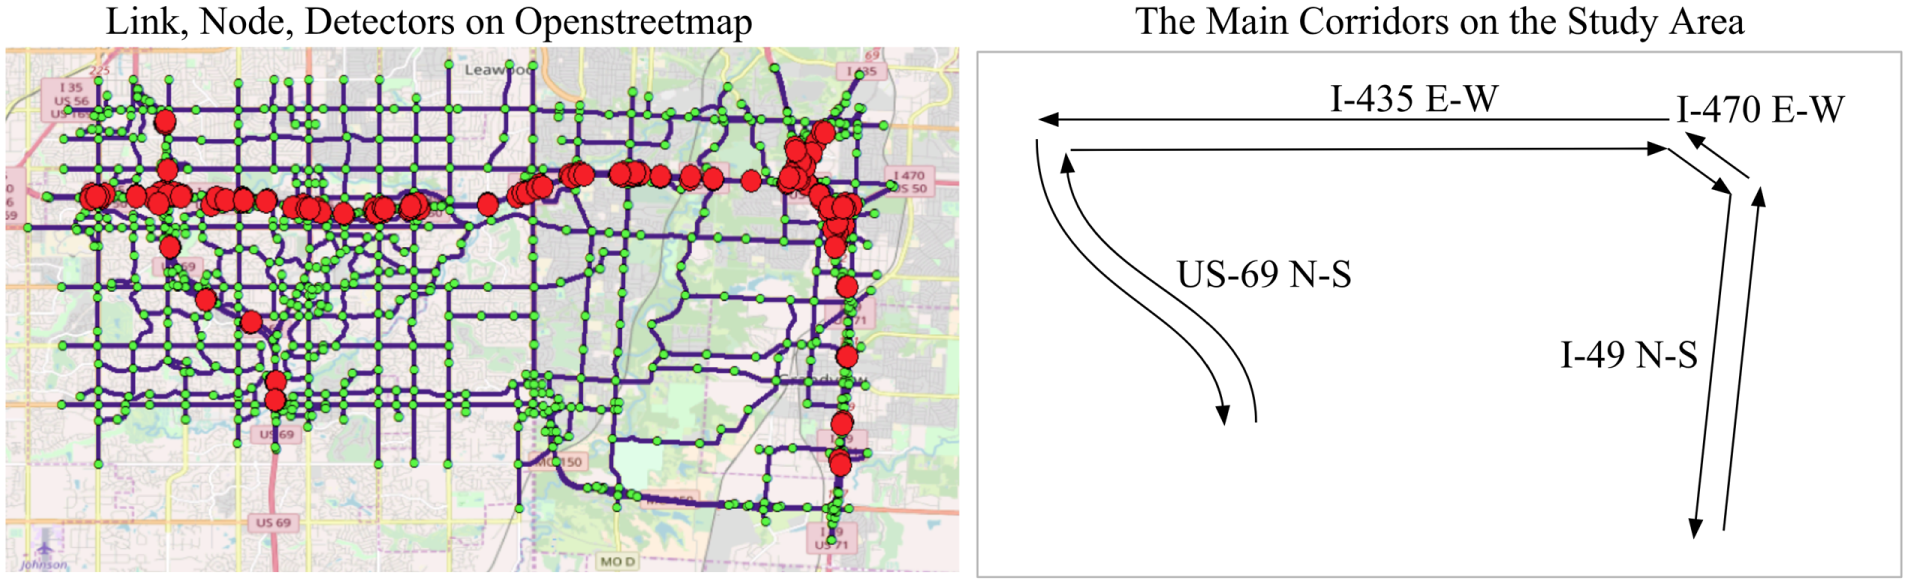
Study Network. Kansas City.
The proposed online O–D correction and daily learning were tested for a consecutive 3-day period, July 10th to 12th, 2018. The traffic prediction results of the second and third day were evaluated and are presented in this paper to assess the impact of the suggested methodology. To observe the accuracy of congestion prediction in peak hours, simulation results and detector data from 5 a.m. to 9 p.m. for each day were used for prediction error calculation. For O–D estimation, nine intervals of different 5 min period measurements were used as input, whereas consistency checking required a single 5 min observation. The O–D demand correction was applied for 2 h-long prediction horizons and new prediction starts every 15 min based on updated estimated network traffic states that function as new initial states. Naturally, for one timestamp, there are eight different prediction results (see Figure 4). To examine the spatio-temporal impact of the suggested methodology, prediction results are evaluated for these different prediction windows, for seven main corridors and the 33 observed links that lie along seven different corridors.
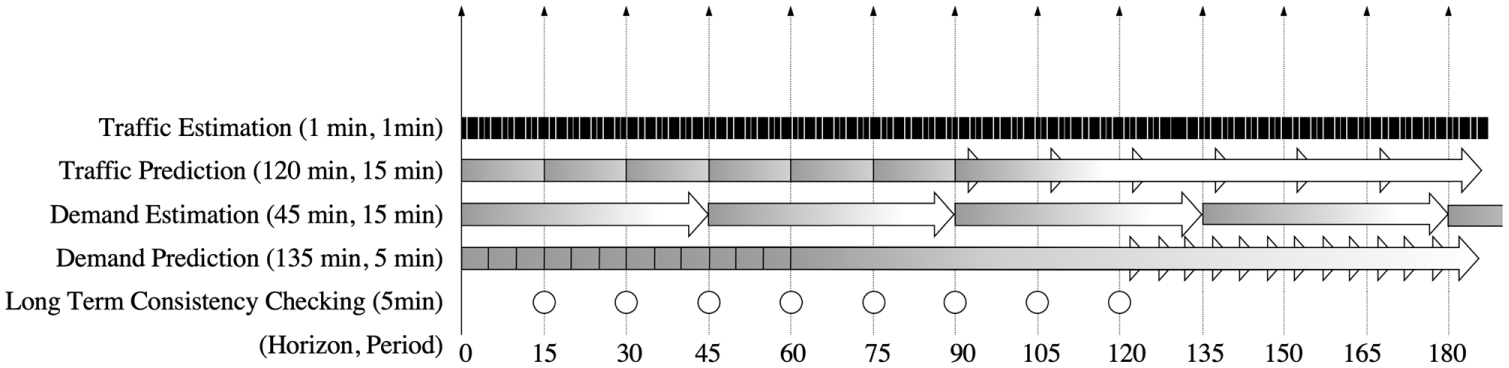
Execution schedule of Traffic Estimation and Prediction (TrEPS) modules.
Analysis Results of Demand Correction and Updating
To validate the effect of the predictive online O–D correction and daily updates of a priori O–D demand, five different strategies were implemented: 1) Base case, no O–D correction on prediction and no daily a priori O–D demand updates; 2) O–D correction on prediction with simple gradient method without daily a priori O–D demand updates; 3) O–D correction on prediction with Taylor approximation method without daily a priori O–D demand updates; 4) O–D correction with simple gradient and daily a priori O–D demand updates; and 5) O–D correction with Taylor approximation and daily a priori O–D demand updates (as described in Table 1).
Description of Five Cases Tested in Kansas City Network
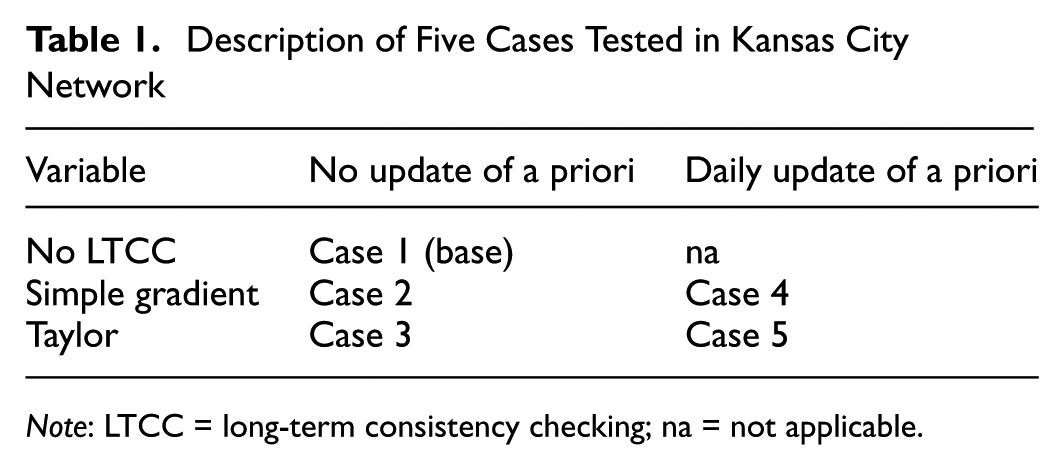
Note: LTCC = long-term consistency checking; na = not applicable.
The Effect of Online O–D Correction—Comparison of Case 2 and 3 with Case 1
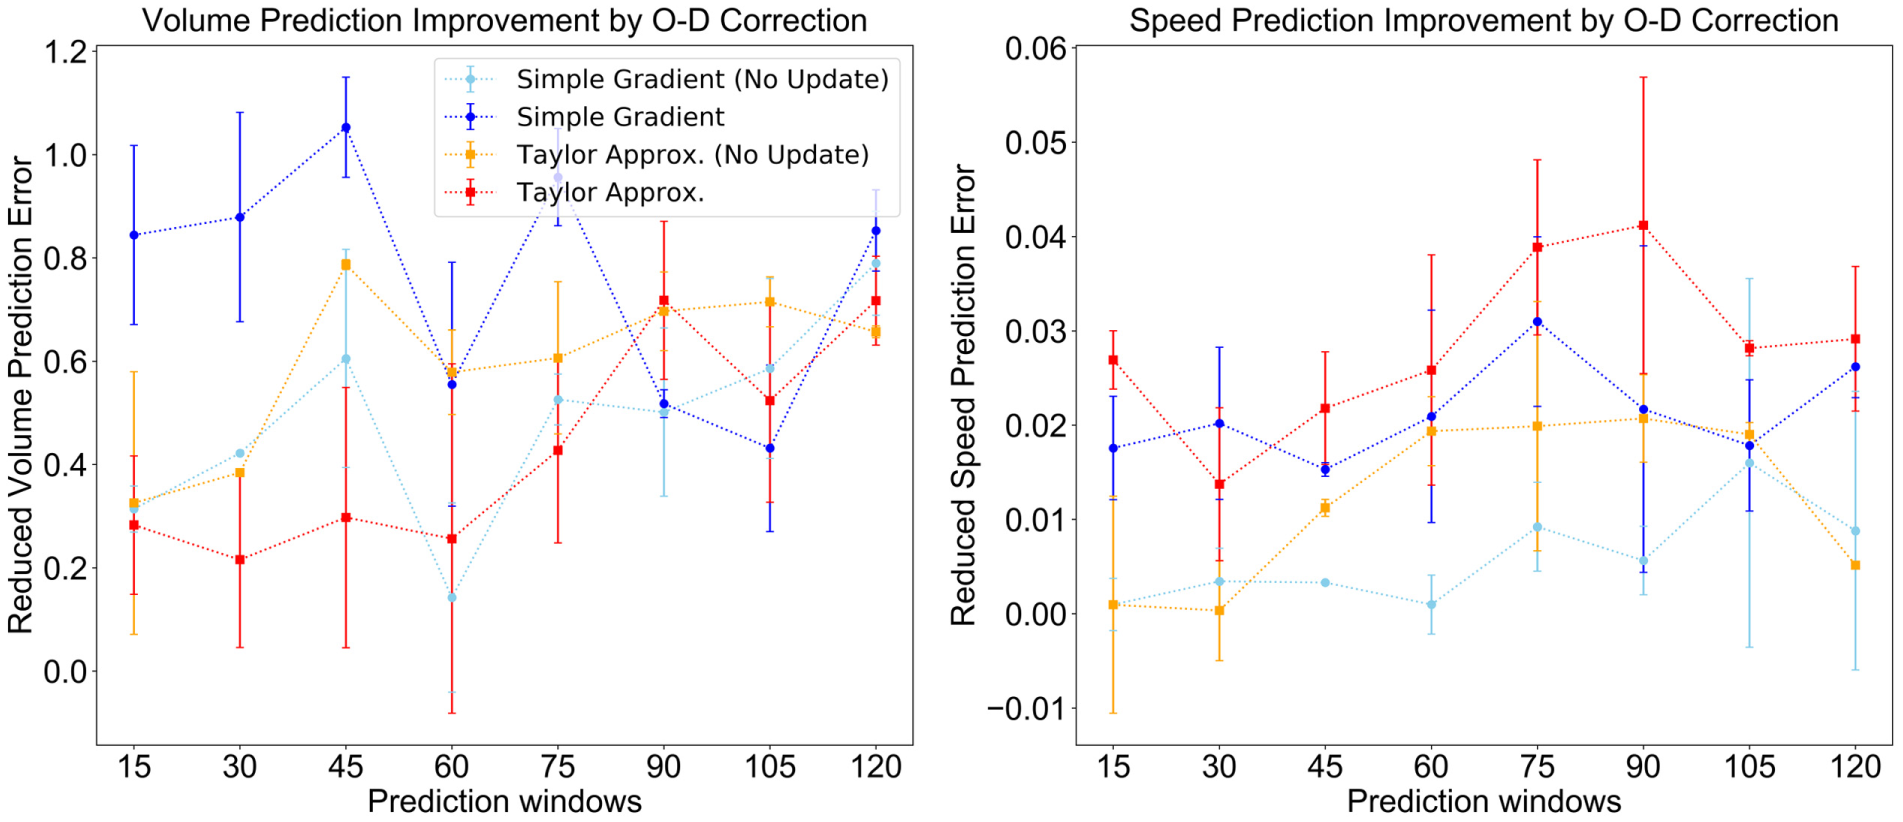
The impacts of the two O–D correction strategies on traffic prediction were examined for eight prediction windows (from 2 h ahead to 15 min with 15-min interval) and between days (from the second to third days). The prediction results from different cases were compared by two traffic measures of volume and speed. The volume prediction accuracy is measured by absolute error (veh/min) and speed by relative error (%). By doing so, the unit of the volume prediction improvement would be vehicles per minute, and the unit of speed prediction improvement is the percentage point. To observe prediction accuracy over the period of interest, the 90th percentile of error was chosen as the performance measure. To clarify, when prediction results have
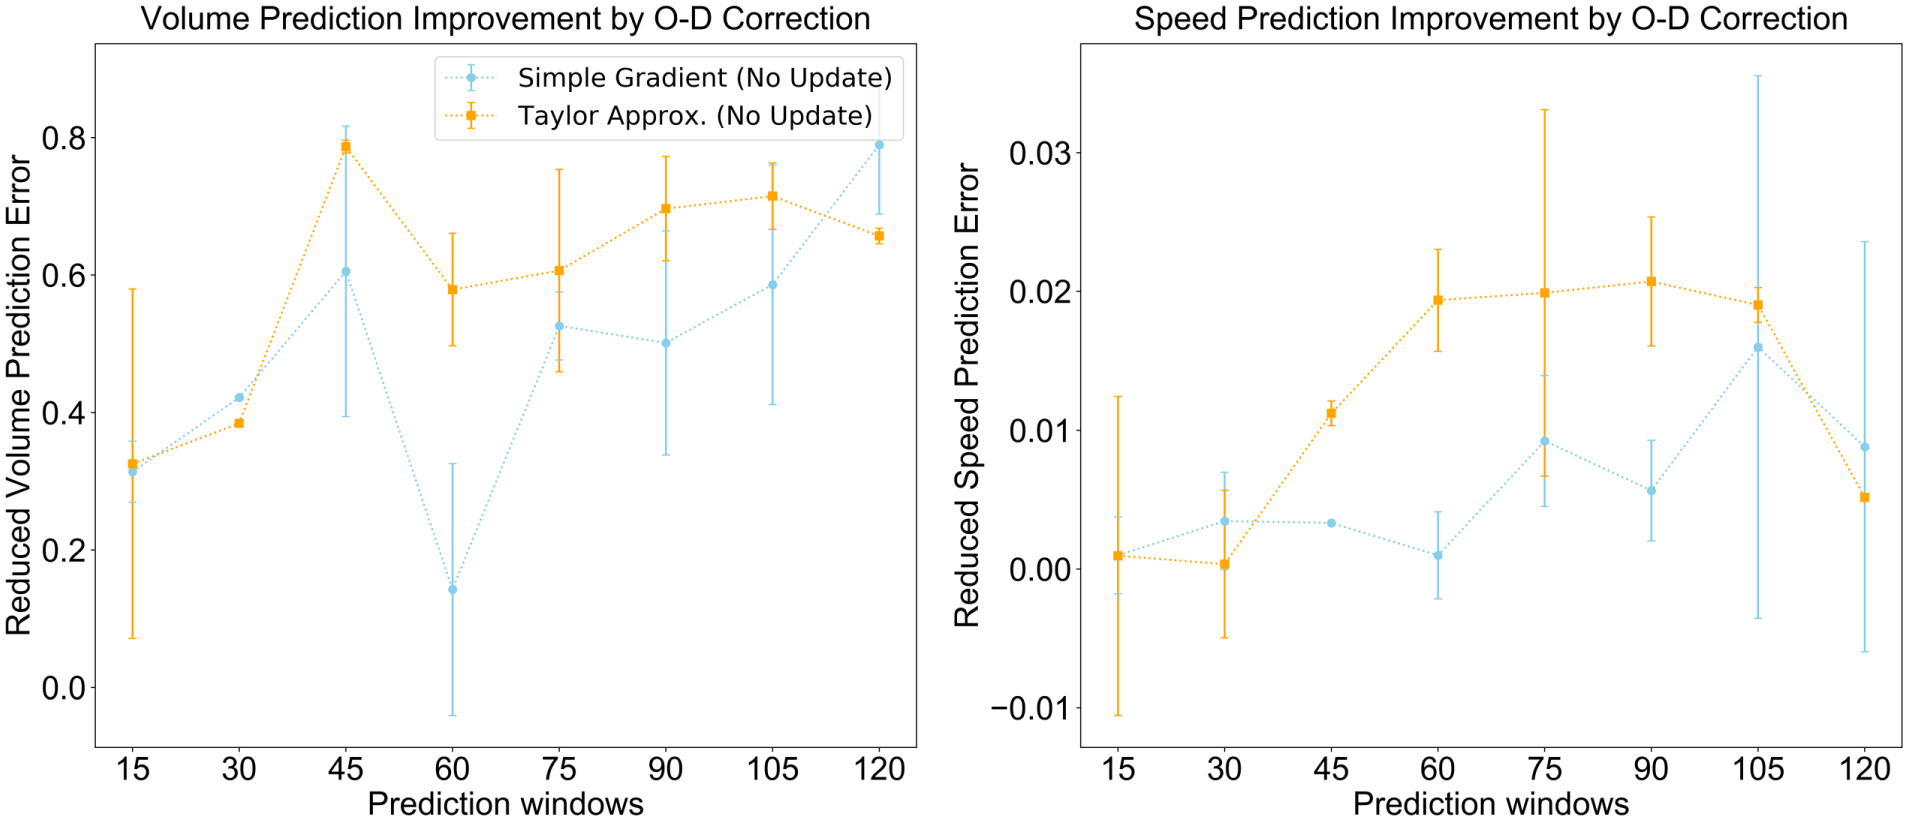
The improvement of traffic prediction overall by online O–D correction. The improvement is measured by the reduction of average 90th quantile of (relative) error of traffic prediction. The error bars represent the difference of the prediction error between two testing days.
When each O–D demand correction method is applied without a priori O–D update, the improvement of close-window ([0,15], [15,30]) predictions is minimal or inconsistent in both volume and speed prediction. This shows that a predictive O–D correction triggered by a reactive consistency checking is not effective in short speed prediction windows. Also, in both cases, the Taylor approximation approach exhibits larger improvement than the simple gradient method overall. For the traffic volume prediction, both methods outperform the base case overall, thus reducing the 90th percentile of the absolute error up to 0.8 vehicles per minute on average. Also, the improvement tends to be higher at the longer prediction window than the shorter one. For instance, the [105,120] minute-window prediction error reduction is greater than [0,15] minute result. This implies that the O–D correction can enhance the performance of TrEPS with respect to the long-run prediction horizon. On the other hand, the speed prediction improvement is highest in the middle of window range from [30, 45] to [90, 105] in the Taylor approximation case. Even though the simple gradient method improves speed prediction up to 3.5 percentage points in the best case, the rest of the results are mere minimal or oscillating.
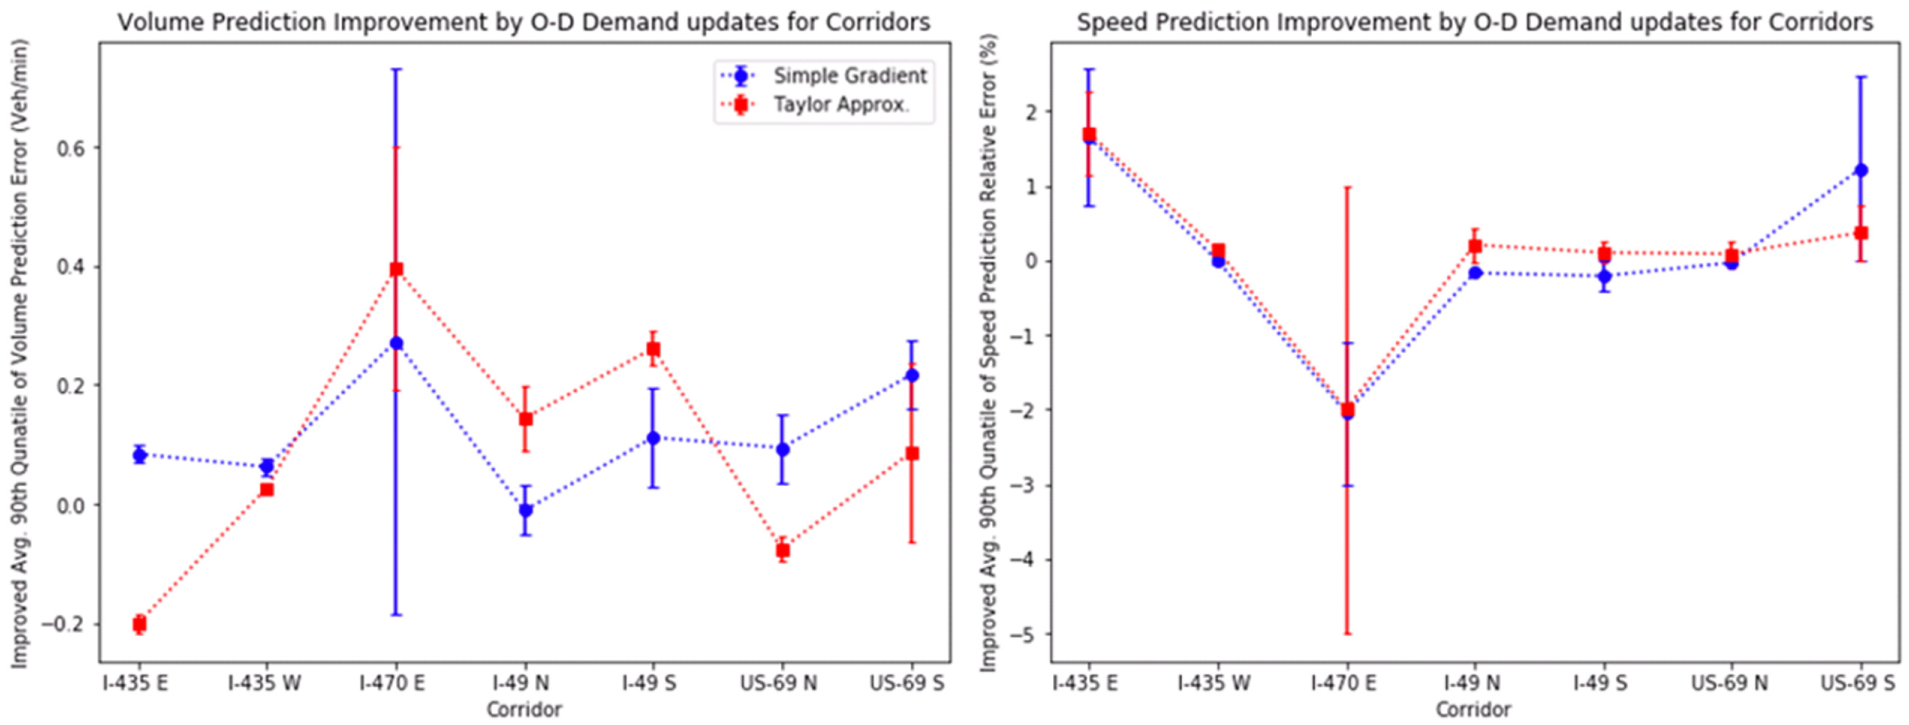
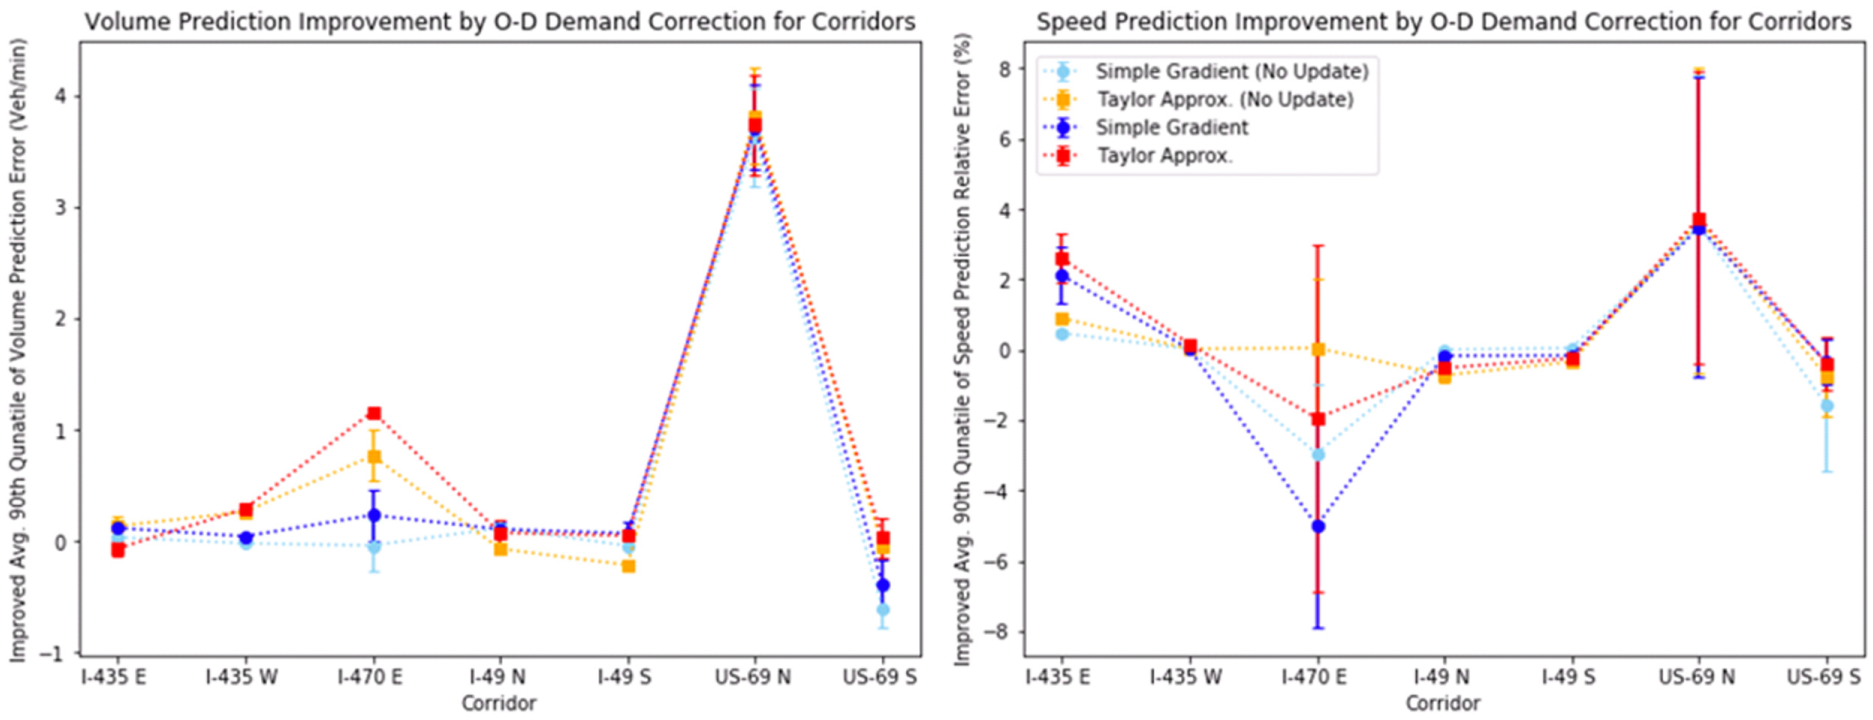
Secondly, the spatial performance is evaluated by aggregating prediction results for each corridor and travel direction. The prediction error of a link is weighted by the ratio of its length to total length of observed links in the corresponding corridor. The O–D correction effect varies corridor by corridor. Compared with all other corridors, the O–D demand impact stands out in US-69 N. It proves the beneficial correction effect of the suggested methodology, in that this part of the network shows a noticeable traffic deviation in the base case. In spatial analysis, the subtle predominance of the Taylor approximation approach is observable. At five of seven corridors in the network, the Taylor approximation approach outperforms the simple gradient method in traffic prediction overall (Figure 6).
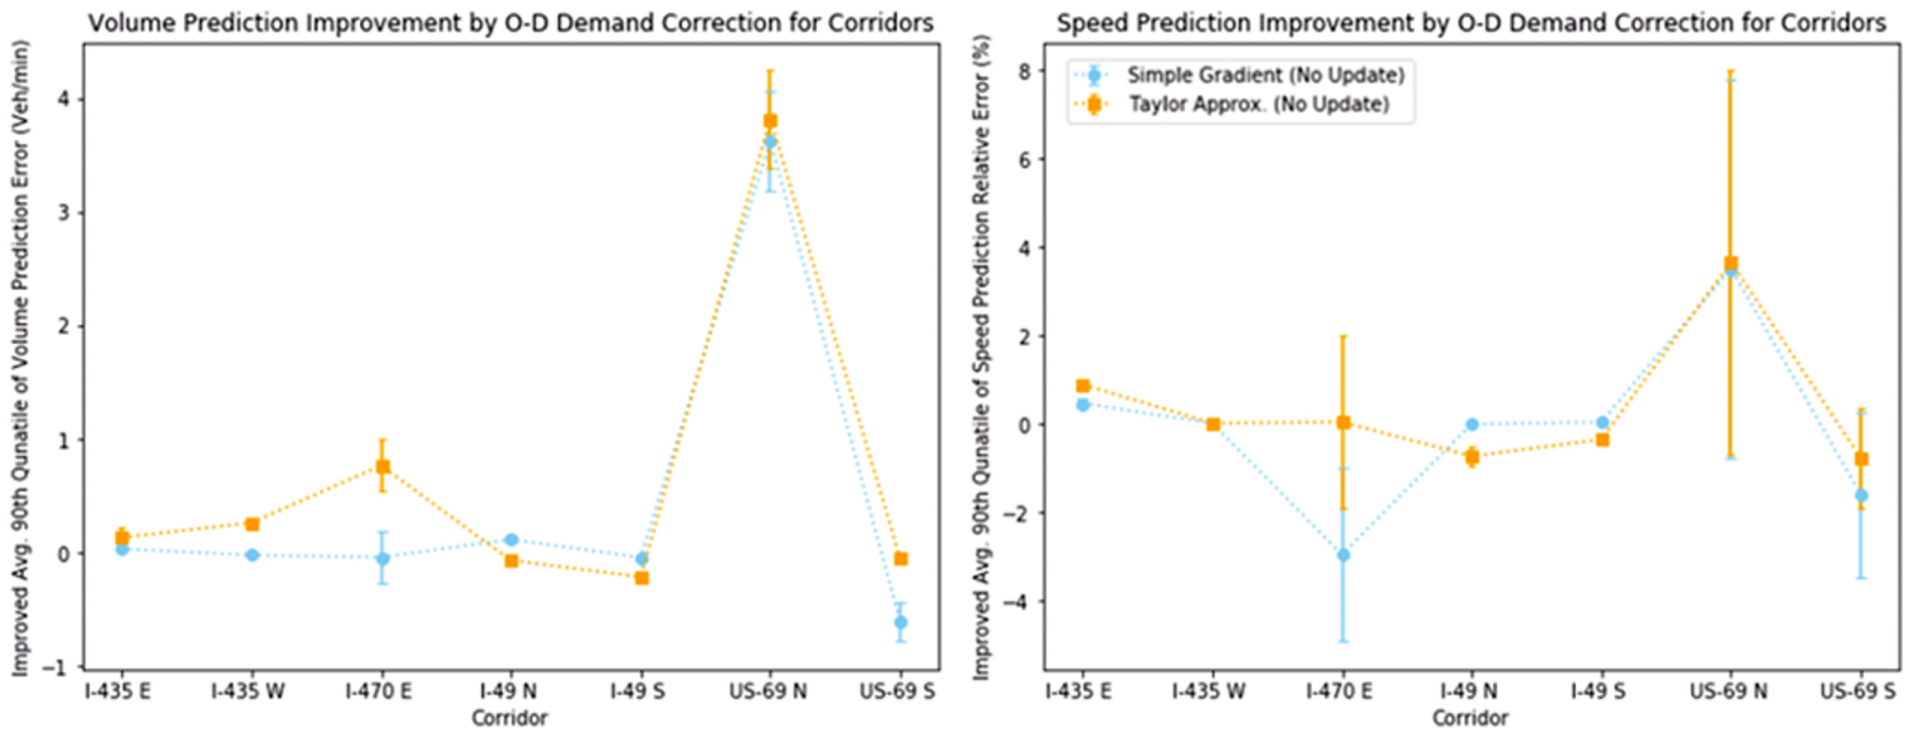
Improvement of traffic prediction for the individual link. The links are clustered by the corridor and the travel direction that that they serve.
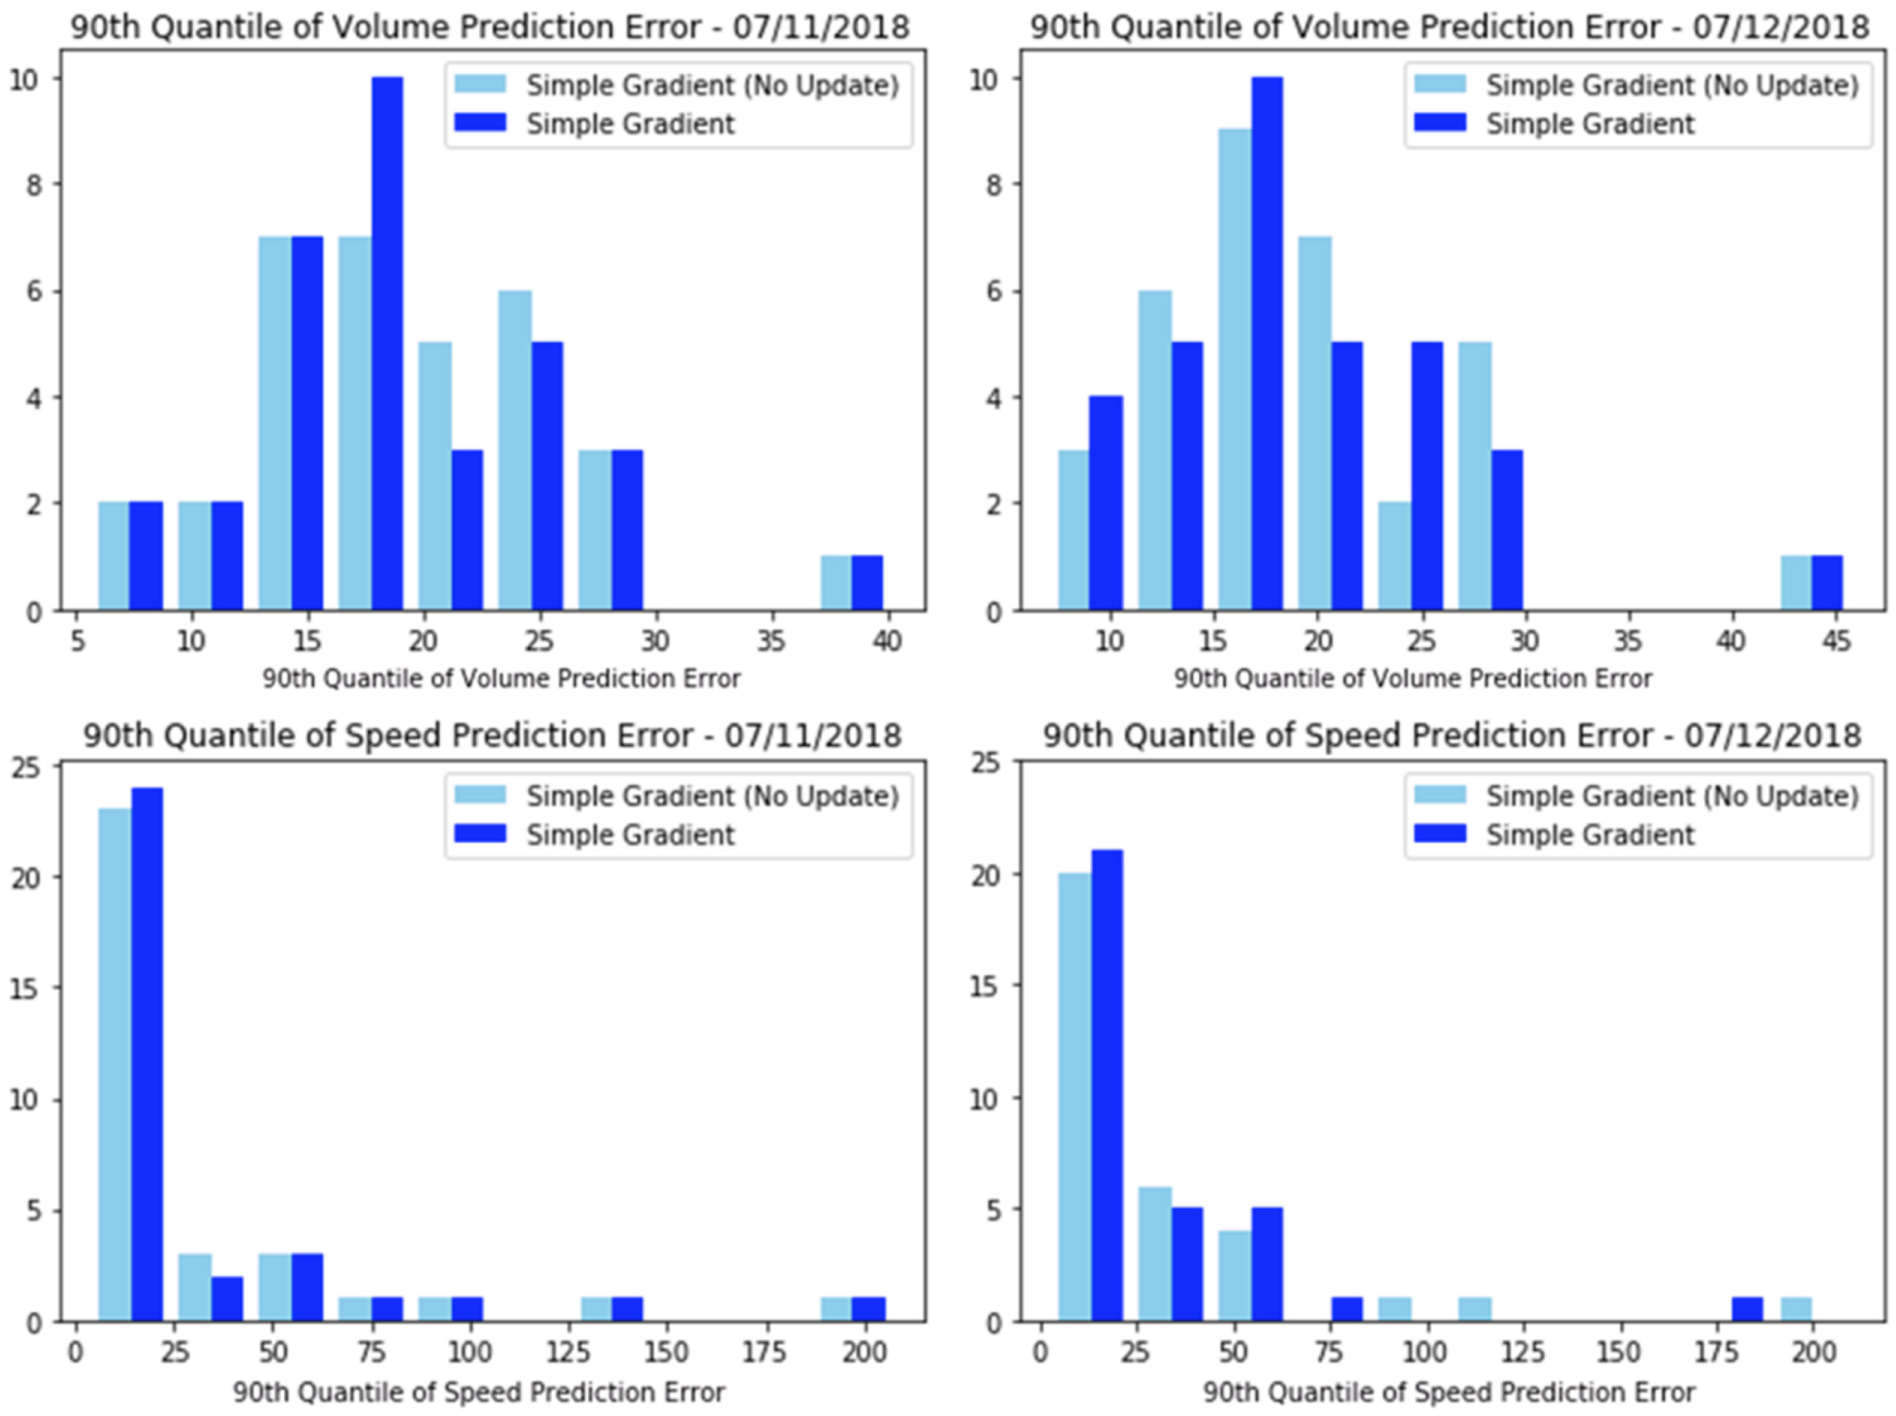
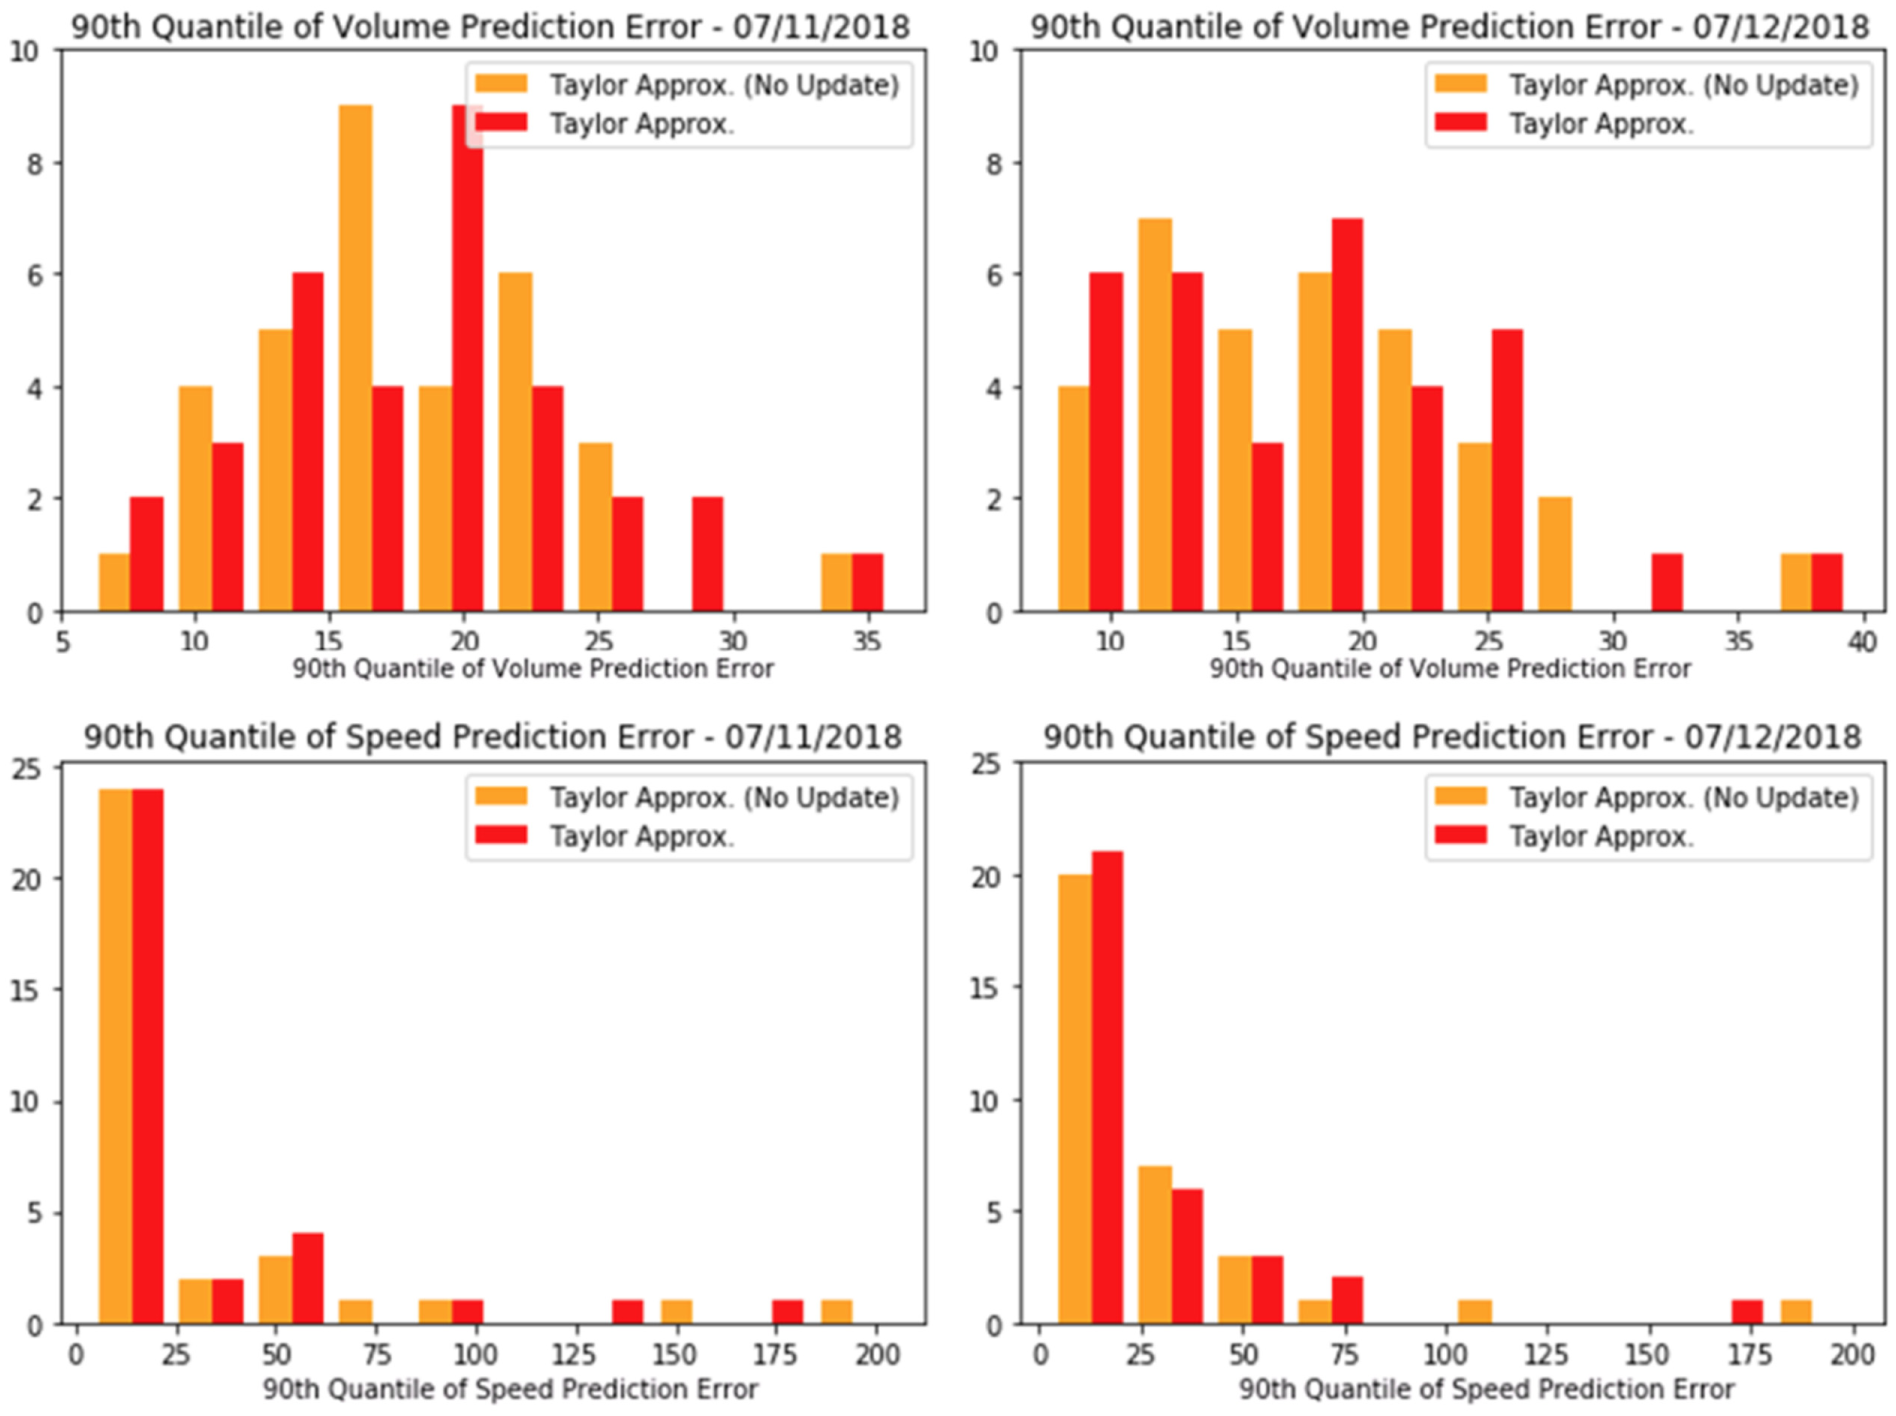
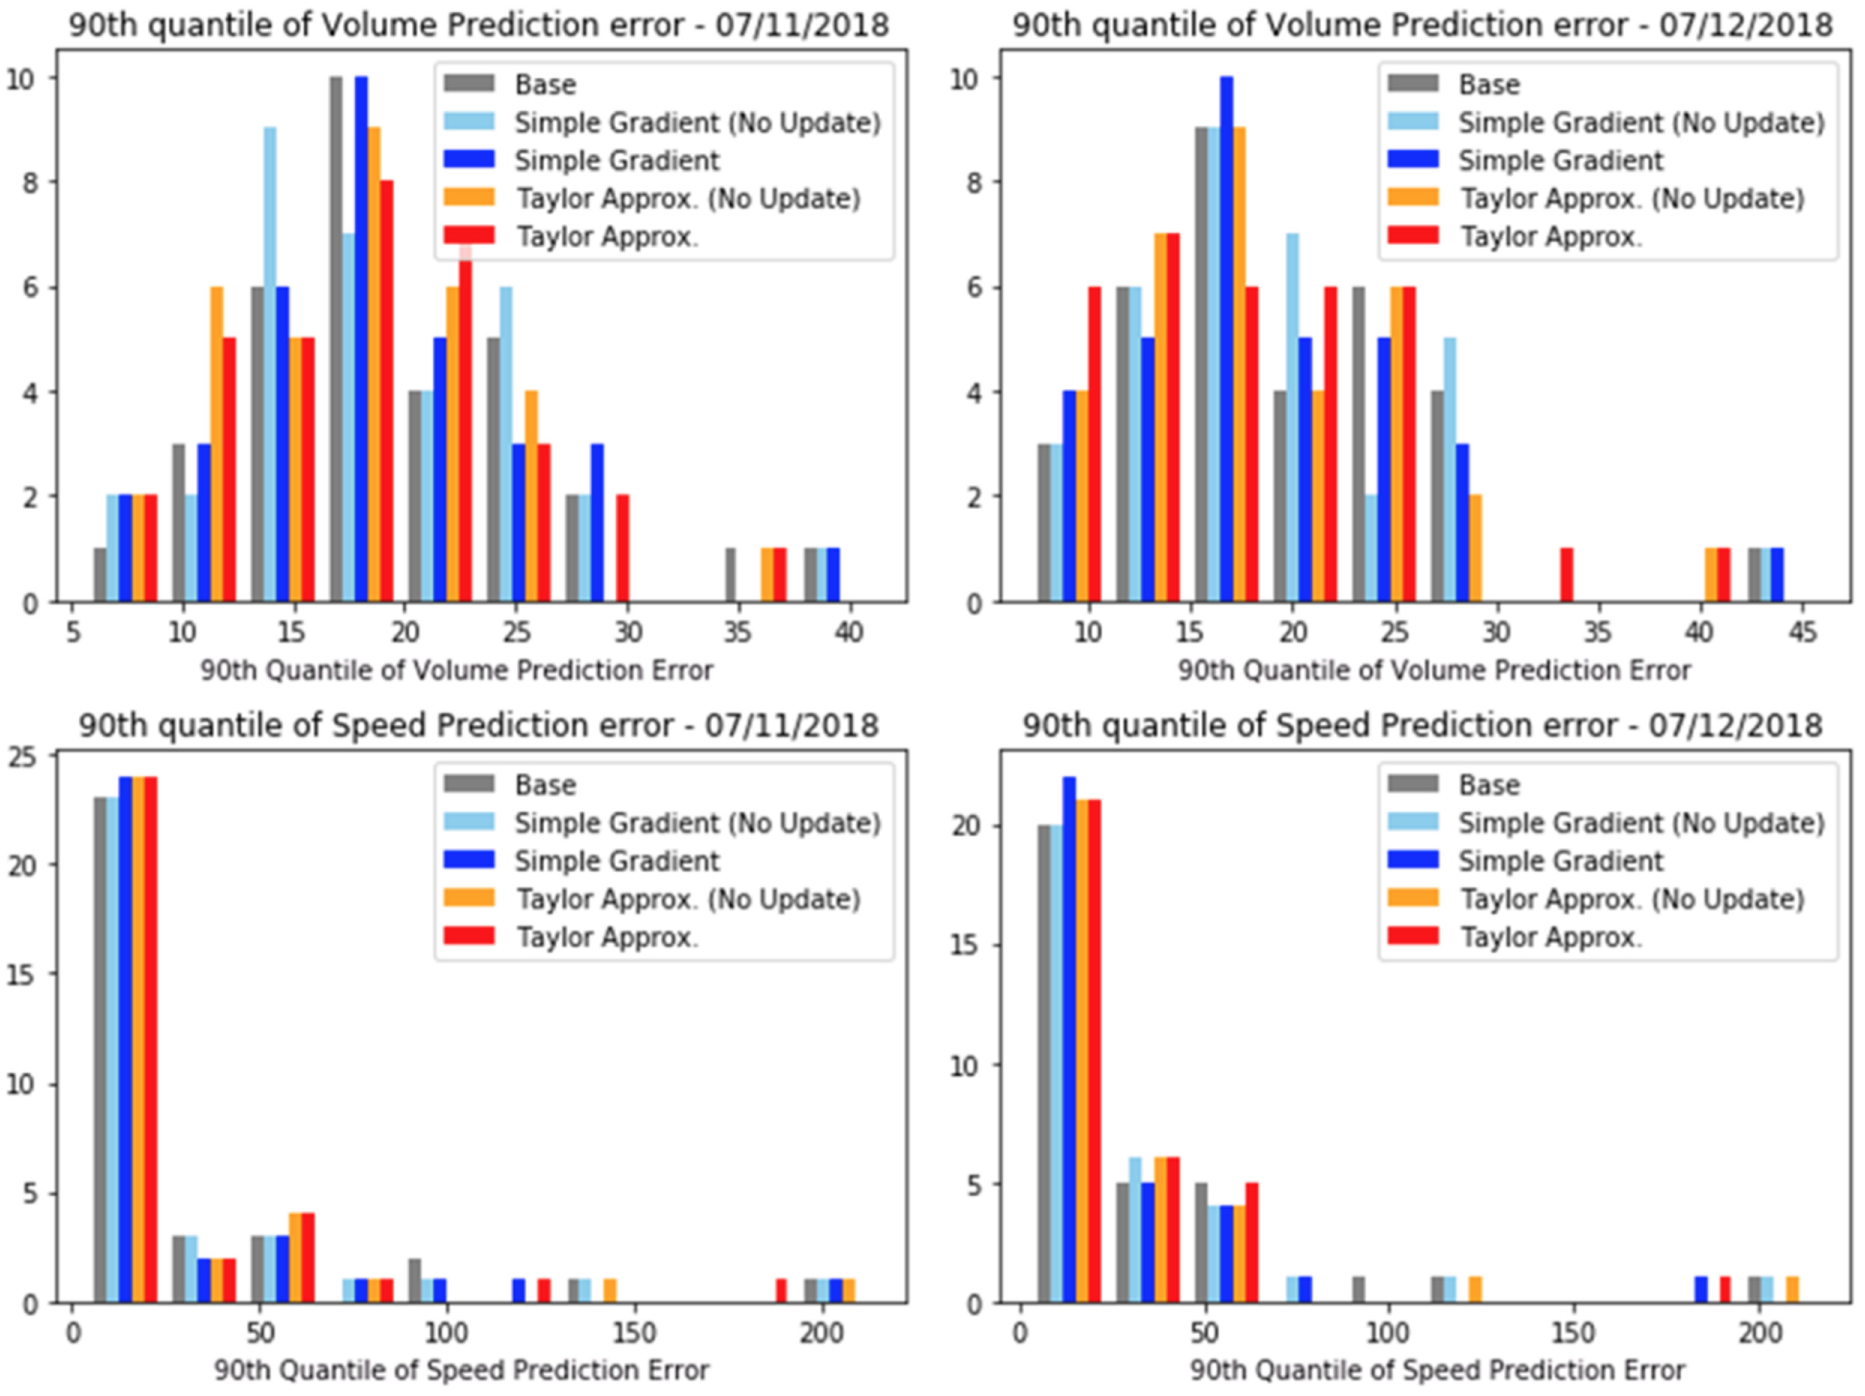
To demonstrate the improvement result overall, the distribution of individual link results is presented (Figure 7). The histogram of 90th quantile of volume prediction error for individual links shows that the Taylor approximation approach increases the number of vehicles belonging to the low-error bins, so that the histogram of individual link prediction results gets more positively skewed than the base case result. Also, the histogram of speed prediction by both correction methods shows a minor but evident improvement from the base case. It is worthy to note that speed prediction at link level is less sensitive to O–D correction. For speed, nine out of 33 evaluated links were not affected at all by any O–D correction methods over the two testing days. It is confirmed that the speed of these links tends to be independent of O–D correction because they retain free flow all day long. This may be one of the reasons that the improvement of volume prediction is not necessarily proportional to that of speed prediction (Figure 5).
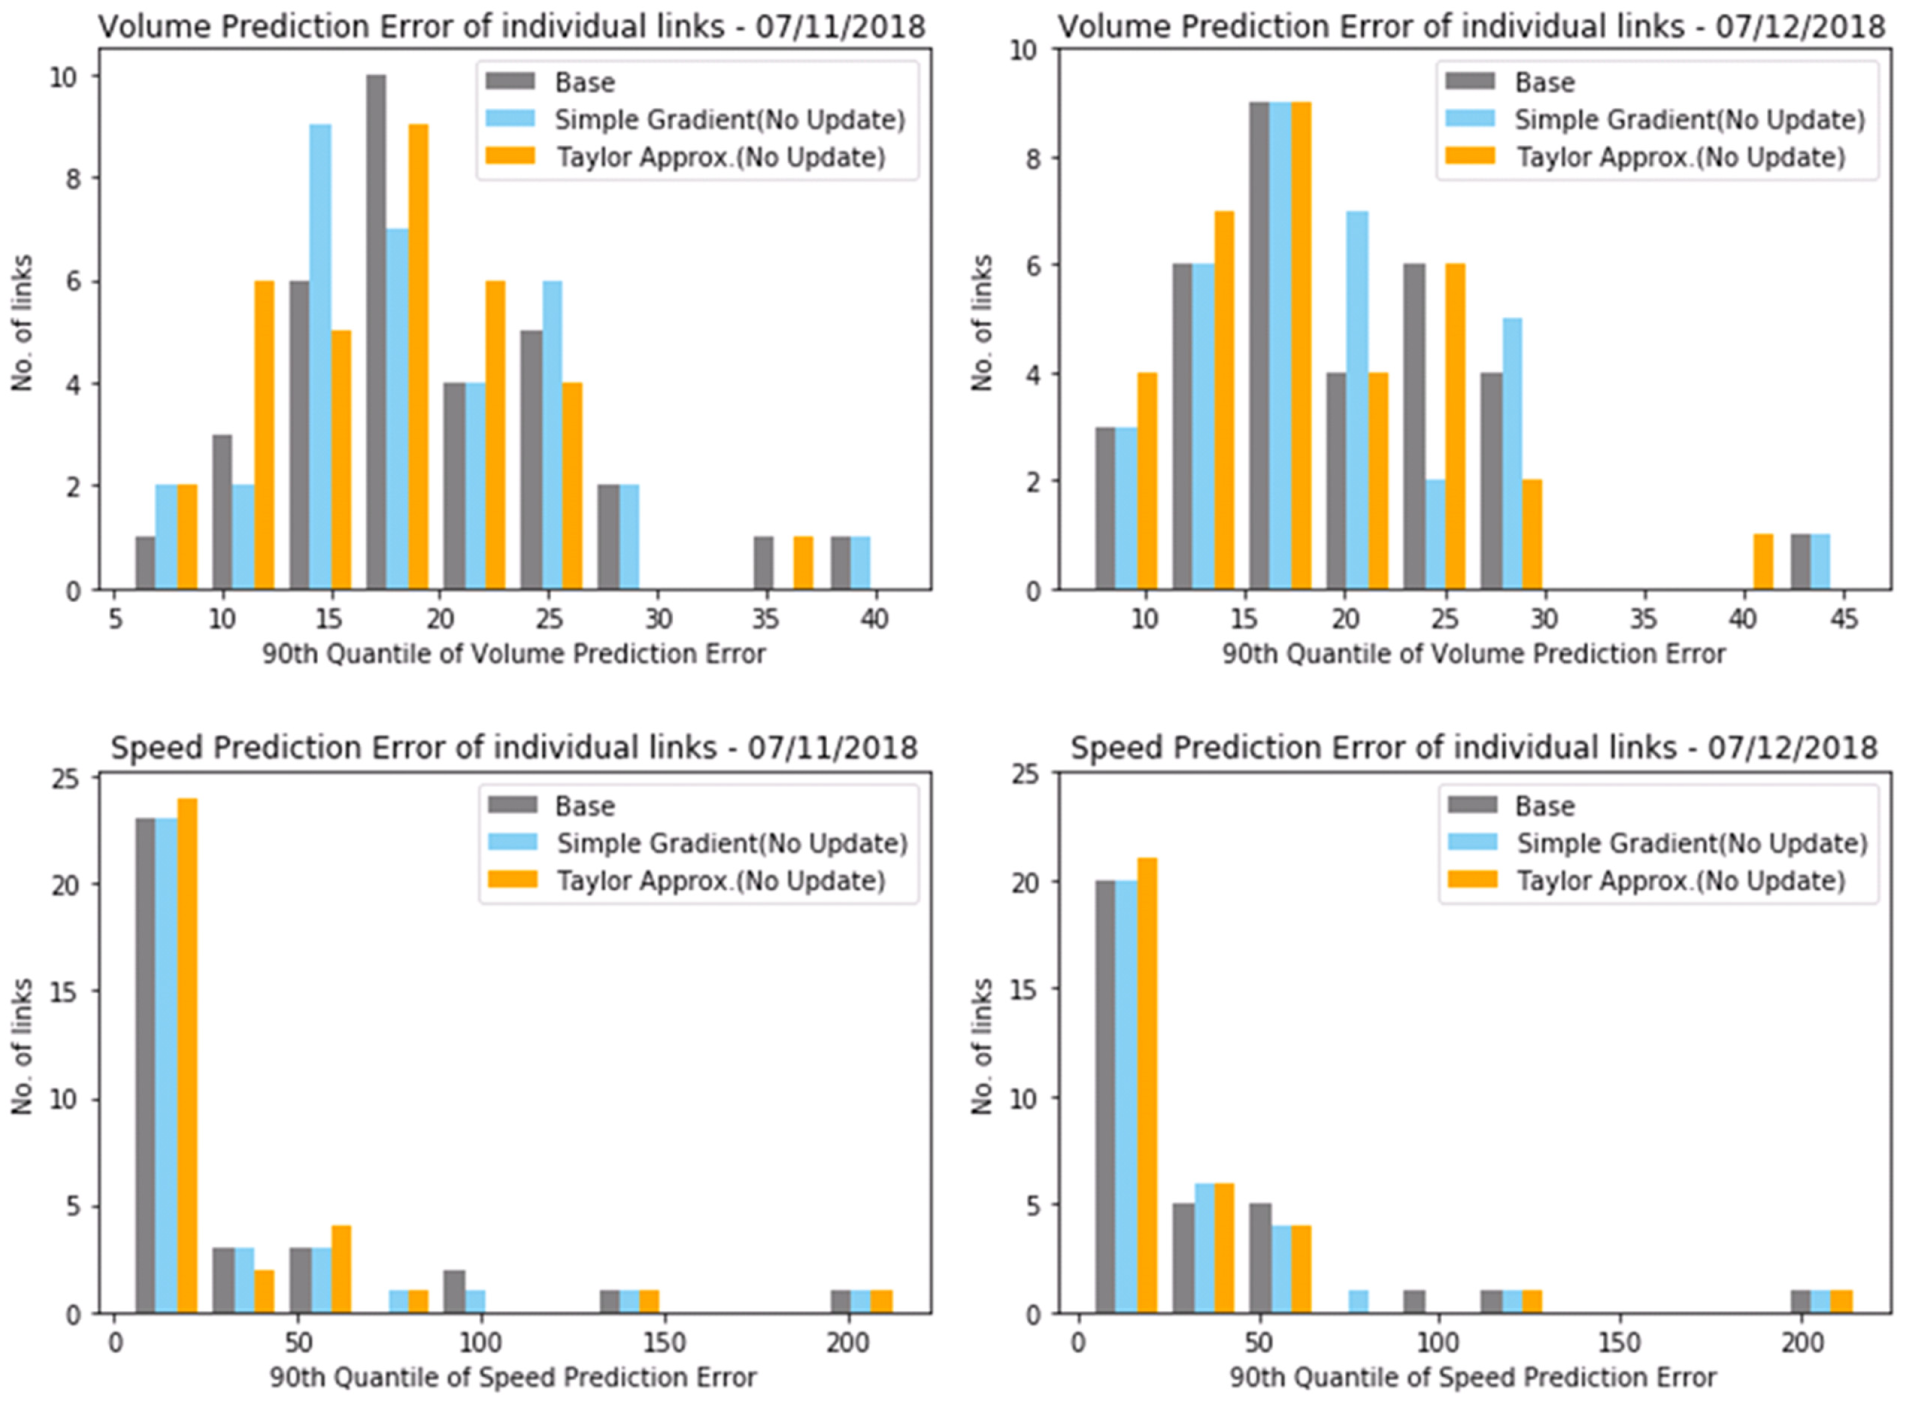
Histogram of traffic prediction error by online O–D demand correction without updating a priori demand: top = volume; bottom = speed; left = 2nd day; right = 3rd day.
The Effect of Updating a Priori O–D Demand—Comparison of Case 4 with 2 and Case 5 with 3
The same comparative analysis is applied to examine the effect of updating a priori O–D demand. The only difference of Case 4 and 5 from 2 and 3 is that the former pair uses the demand matrix updated by online O–D correction a day before, under the assumption that up-to-date demand is the best a priori for the current day. The preliminary study for demand clustering revealed that the day-of-week pattern is weaker than the seasonal effect among ordinary weekdays, except on Friday. This result supports this assumption.
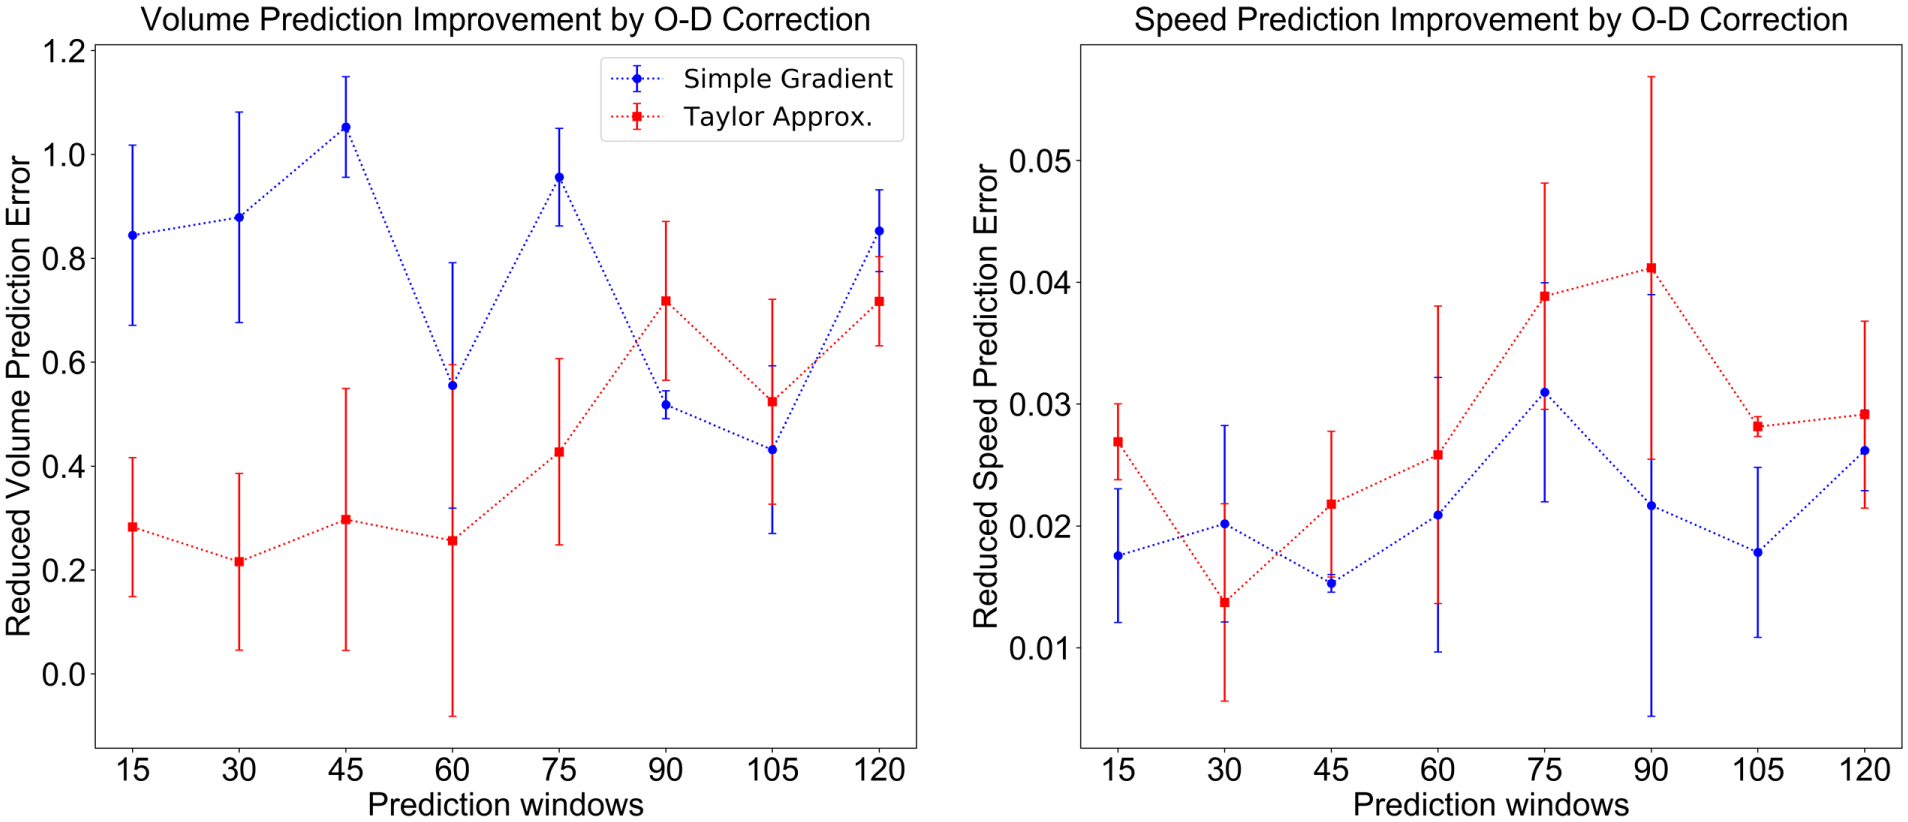
The impact of updating a priori O–D demand on traffic prediction with different prediction windows is presented in Figure 8. In the simple gradient cases, the daily updated O–D demand consistently improves both volume and speed prediction results for the shorter windows from [0,15] minute to [60, 75] minute, whereas the prediction of the longer windows results is minimal or inconsistent. This result implies that the updated O–D demand provides better initial states for traffic volume prediction. It can be deduced that the daily O–D update can have a complementary effect to the simple gradient method, the impact of which is shown to be negligible in shorter prediction windows. On the other hand, Taylor approximation with updating a priori is worse off in volume prediction than the case without O–D updates, whereas the speed prediction is improved by the updated a priori O–D demand. This reveals that the methodology of Taylor approximations tends to overcorrect O–D demand in narrowing down the expected density discrepancy and effectively improves the speed prediction. This alludes to the possibility of another source of error besides incorrect O–D demand.
Improvement of traffic prediction over time by updating a priori O–D demand. The improvement is measured by the reduction of average 90th quantile of (relative) error of traffic prediction.
A mild improvement of traffic prediction by updating a priori O–D demand was observed across all corridors in simple gradient cases, whereas the impact of Taylor approximation was oscillating along the links. Except I-435 E and US-69S, no significant improvement in speed prediction is observed in any case (Figure 9). A similar pattern is observed in histograms (Figures 10 and 11). For the simple gradient method, histograms of individual link traffic prediction by updating O–D demands have more number of links in lower error bins for both volume and speed. In the Taylor approximation cases, it is not obvious that updating a priori O–D demand improves the prediction of individual link volume, whereas the speed prediction improvement is palpable (all corridors but I-49 S worsen or exhibit inconsistent improvement from O–D updates in volume prediction, whereas the significant improvement in speed prediction was observed in the both directions of the main corridor, I-435).
Improvement of traffic prediction for individual link by updating a priori O–D demand.
Histogram of 90th quantile of traffic prediction error of simple gradient cases: top = volume; bottom = speed; left = 2nd day; right = 3rd day.
Histogram of 90th quantile of traffic prediction error of Taylor approximation cases: top = volume; bottom = speed; left = 2nd day; right = 3rd day.
The Best Strategy—Comparison of Case 2, 3, 4, and 5 with Case 1
The goal of this research is to explore the best strategy to utilize real-time observations to improve traffic prediction. To this end, all four strategies are compared with the base case as below. By all accounts, online correction and daily updates of a priori O–D demand effectively improve traffic prediction. Importantly, all four strategies enhance the prediction accuracy at long prediction windows—up to 2 h. As expected, O–D demand correction and daily O–D demand updates demonstrate a beneficial synergistic effect using the simple gradient method (Figure 12). In Taylor approximation methods, however, the O–D correction without O–D updates result is comparable to OD correction with OD updates for volume prediction. However, speed prediction benefits greatly from the two modules working jointly. Analysis of the results with temporal, spatial, and overall perspectives indicates that Taylor approximation with daily updates of O–D demand outperforms other cases. The visualized results are presented in Figures 13 and 14.
Improvement of traffic prediction by online O–D correction and daily updates of a priori O–D demand.
Improvement of traffic prediction for individual link by online O–D correction and updates of a priori O–D demand.
Histogram of 90th quantile of traffic prediction error by online O–D correction and daily updates of a priori O–D demand: top = volume; bottom = speed; left = 2nd day; right = 3rd day.
Conclusion
This paper proposes a novel methodology for online O–D correction and daily updates of a priori O–D demand in a continuous manner for real-time traffic estimation and prediction systems that would run 24/7. This study identified the best strategy for learning unfolding traffic states in the real world that are used to adjust O–D demand based on the observed traffic discrepancy for the improved prediction in a specified time horizon. Consistency checking, which corrects traffic estimation with a given observation, is used as a starting point of the predictive O–D correction.
For the best use of this initial input along the prediction horizon, two different methods are tested: 1) simple gradient method and 2) Taylor approximation. The simple gradient method applies the most recent O–D correction factors from the consistency checking module and applies the factors in a gradient manner along the prediction horizon. On the other hand, Taylor approximations capture the variation trend of density discrepancy in multiple intervals and apply the correction factors to reflect the captured trend to the subsequent prediction intervals. Whereas the former case let the correction factors converge to 1, the latter led to the factors branching off to upper and lower bounds according to increasing or decreasing trend.
It is worthy to note that the proposed methodology allows archiving of the daily demand matrix at the end of each day while the system is running online. Through the time-series analysis of these matrices, one can use predicted a priori demand matrix instead of the most recent demand matrix. This may be a method to take account of long-term seasonal effects. Even though simply the estimation of daily demand obtained a day before was used as a prior demand input, finding the best a priori demand needs to be included in future research.
The Kansas City network case study described in this paper validates the capability of the suggested online O–D correction and daily O–D updates in improving prediction capacity of real-time traffic systems. The case study results reveal that this methodology effectively improves the prediction results different scales over spatial and temporal dimensions of the test network. To expound, O–D correction enhances the traffic prediction performance in long prediction windows, whereas daily O–D updates enable the prediction to start at a better initial state. Also, the two modules exhibit a beneficial synergistic impact when they are jointly combined to the real-time DTA-based traffic estimation and prediction system.
In the simple gradient method, the improvement from the combination of the two modules is palpable for both speed and volume prediction. On the other hand, a Taylor approximation without updating a priori O–D demand shows observable (even better than joint case) results in volume prediction. However, O–D demand updates play a significant role in improving speed prediction.
In the presented results, the improvement of volume prediction and speed prediction are not necessarily proportional. One of the reasons is that unsaturated links are independent from flow variation and retain their free flow speed. Another reason is that traffic prediction performance is substantially influenced by other factors, including the density–speed relationship and traveler behavior models. This paper included neither online calibration of the density–speed relationship nor correction of a path assignment. The error that comes from an incorrect traffic flow model or incorrect traffic assignment model cannot be effectively reduced by the proposed online O–D correction and daily updates. It is expected that an online adaptive traffic flow model with the proposed online O–D demand correction and daily O–D updates will significantly improve the performance of traffic prediction. This will be the direction of future research.
Footnotes
Acknowledgements
The work presented in this paper is based in part on a project funded by the U.S. Department of Transportation, Federal Highway Administration through Leidos, Inc., in collaboration with Synesis, Inc., on the development and testing of an Integrated Modeling for Road Condition Prediction (IMRCP). The authors are grateful to Kyle Garrett, of Synesis, Inc., for his role in the test deployment.
Author Contributions
All authors contributed to all aspects of the study from data preprocessing, developing methodology, to analysis and interpretation of results, and manuscript preparation. All authors reviewed the results and approved the submission of the manuscript.
The Standing Committee on Transportation Network Modeling (ADB30) peer-reviewed this paper (19-02121).
The views expressed are those of the authors and do not necessarily reflect those of the sponsoring agencies.