
Abstract
The waste of fuel causing by traffic congestion is a challenge faced by urban traffic management authorities and travelers. At the same time, massive traffic data allows high-resolution understanding of on-road operating conditions. The development of an algorithm to estimate total fuel consumption from primary traffic condition indices, for example, network average speed, will simplify the evaluation of fuel consumption from the management perspective and guide strategy at the local area level. The objective of this study is to develop a macroscopic relationship between total fuel consumption and the network average speed for an urban road network. Floating car data (FCD) covering 13 weekdays was collected in the field in Beijing, China. FCD from 10 ordinary weekdays are used to develop a quantitative model to define the macroscopic relationship between total fuel consumption and network average speed. The model is then validated by the FCD of the other three weekdays when the traffic demand is low. The average of the resultant absolute relative errors from the validation is found to be 4.65%, which indicates a reasonably high reliability of the developed model under various traffic conditions. The facility- and speed-specific distributions of vehicle kilometers traveled (VKT) are analyzed to explain the macroscopic relationship. The result indicates that the link VKT distribution at different speeds varies greatly when the traffic became congested on expressways. The link VKT distributions are similar for different traffic conditions on arterials and collectors.
Traffic congestion is a challenge faced by large cities worldwide. Frequent traffic congestion wastes massive amounts of time, fuel, and money, and the cost of extra time and fuel caused by congestion is still increasing ( 1 ). Integrated modeling of traffic conditions and fuel consumption is still an open problem.
On the microscopic level, traffic congestion is the main cause of aggressive acceleration, deceleration, and idling. These driving behaviors boost fuel consumption, thus leading to a waste of energy. On the macroscopic level, total fuel consumption is closely related to the network-wide traffic operating conditions. The stability of the traffic operation of the road network is proved by the macroscopic fundamental diagram ( 2 ). A quantitative relationship between the total fuel consumption and traffic conditions at the network level, which can be potentially defined similarly to the fundamental diagram, is still not thoroughly investigated.
Increasingly robust data on traffic operations is being collected and provided not only by traffic administrations, but also by organizations and corporations such as INRIX, TomTom, and amap. Multiple traffic operation evaluation systems provide network traffic condition indices such as network average speed ( 3 ). Massive traffic data also allows high-resolution understanding of on-road operating conditions, which contributes to the incorporation of traffic conditions and fuel consumption models. However, big data on traffic operations is not yet fully utilized in the design of a macroscopic consumption modeling algorithm, and the key indices are not effectively exploited for real-time evaluation of fuel consumption at the network level.
The development of a macroscopic traffic condition–fuel consumption relationship will enable the simplifications of modeling fuel consumption from primary traffic condition indices. Coupling key parameters of traffic conditions and fuel consumption empowers time-efficient decision making, which further advances the collective management efforts for traffic and fuel consumption. Applying the relationship also benefits traffic control strategies at local area level such as perimeter control.
The motivation of this paper lies in the development of a macroscopic relationship between traffic conditions and fuel consumption. The study will answer the following question: Is there a possible relationship between the network traffic conditions and the total fuel consumption, which is feasible for estimating the network fuel consumption quantitatively from key indicators for traffic conditions?
Literature Review
The macroscopic relationship between total fuel consumption and the network traffic conditions is about how total fuel consumption varies across different levels of network traffic conditions. Since the calculation approaches of fuel consumption and emissions are similar, the literature review covers both them.
At the microscopic level, traffic congestion leads to more acceleration, deceleration, and idling modes, which thus produces more emissions ( 4 , 5 ). Numerous studies have shown that congestion increases emissions at a macroscopic level too. Barth and Boriboonsomsin ( 6 ) analyzed the impacts of traffic congestion on emissions, the results of which showed that three methods for improving traffic conditions could potentially reduce emissions by 7% to 12%. Zhang et al. ( 7 ) examined emissions and fuel consumption rates under free flow, work zone, and peak hour congestion conditions using the comprehensive modal emissions model (CMEM). The predicted results indicated that emission factors were nearly doubled during rush hour compared with free flow periods. Frey et al. ( 8 ) found a 50% increase in emissions during congestion by using on-board measurements of emissions. The micro-simulation method is commonly used to estimate emissions of past congested conditions ( 9 , 10 ). Anderson et al. ( 11 ) found that, compared with free flow conditions, the congestion increased emissions of CO, HC, and NOx by 71%, 53%, and 4%, respectively. The Texas A&M Transportation Institute ( 1 ) calculated extra fuel consumption in various traffic conditions compared with free flow condition based on a set of INRIX traffic speed data.
Total fuel consumption is directly related to the on-road operating conditions of vehicles, such as the operating speed distributions. Smit et al. ( 12 ) developed a method to predict on-road operating speed distributions of the links using the data from a dynamic macroscopic traffic model. Wen et al. ( 13 ) studied the traffic by the day-of-week, traffic demand management policy, holiday, and weather conditions to establish the relationships between traffic congestion patterns and those influencing factors.
As for the estimation of total fuel consumption and emissions, besides microscopic simulation ( 9 , 10 ), the microscopic fuel consumption and emission models are also used. Most of the newly developed fuel consumption/emission models, such as motor vehicle emission simulator (MOVES) ( 14 ) and the international vehicle emissions model (IVE) ( 15 ), employ vehicle specific power (VSP) as the primary parameter ( 16 ). Song et al. ( 17 ) developed the speed correction factors based on speed-specific VSP distributions. Yu et al. ( 18 ) developed the driving cycles for classified road types, incorporating vehicle activity with fuel consumption/emissions derived from portable emission measurement system (PEMS) data. Song et al. ( 19 ) and Lu et al. ( 20 ) found that the vehicle activity data generated by simulation models could not accurately represent real-world driving behaviors for fuel consumption and emissions estimations, based on the analysis of massive real-world and simulated vehicle activity data. With the field link-specific operating condition data accessible, a VSP-based algorithm in estimating fuel consumption and emission has been used to establish an online dynamic emission model applied to real-time emission monitoring of the road network in Beijing ( 21 ). The VSP-based algorithm is used in this study to calculate the fuel consumption for each link, as well as for the network.
The existing literature confirms a positive relationship between fuel consumption and traffic congestion. No quantitative macroscopic relationship between the network traffic conditions and total fuel consumption is available, however.
The objective of this paper is to develop a quantitative macroscopic relationship between the network traffic conditions and total fuel consumption. The macroscopic level is defined as the urban road network level, which contains multiple road classes and covers various vehicle groups in this paper. Three questions that the paper intends to answer are:
Is there a quantitative macroscopic relationship between the network traffic conditions and total fuel consumption for the entire network?
What are the characteristics of the link vehicle kilometers traveled (VKT) distribution in various link speed bins for different network traffic conditions?
Can the macroscopic relationship be used for estimating total fuel consumption by the network traffic conditions?
Although only fuel consumption is analyzed in this study, the methodology utilized in the paper can also be applied to emissions as well. In the paper, total fuel consumption refers to the total fuel consumption for the entire network. All the analyses are based on historic data and recent changes of infrastructure are not covered in this paper.
Methodology
The field data were collected in Beijing for a total of 13 weekdays. The data of 10 ordinary weekdays was used to develop the macroscopic relationship between traffic condition and total fuel consumption. The network average speed was used as the indicator for the network traffic condition, which is calculated as the total distance traveled on all links divided by the total travel time for the entire network. The total fuel consumption for road network is aggregated by fuel consumption on each link, which is calculated using floating car data (FCD), based on a micro fuel consumption modeling approach. The macroscopic relationship between network average speed and total fuel consumption is developed and then validated.
Data Collection
Road Information
Road information was collected based on a geographic information system (GIS). The data collection area covers the road network within the 5th Ring Road in Beijing. The lane number and road link length of all links were collected. Urban roads in Beijing are classified into three classes: expressway, arterial, and collector. The expressway is the same as the urban restricted access roadways defined in MOVES.
Fuel Consumption Factors
Fuel consumption factors were obtained from the established VSP-based fuel modeling approach using fuel consumption and vehicle activity data from Beijing ( 17 ). In the model, the speed correction-fuel consumption factors are developed based on speed-specific distributions of VSP and local fuel consumption rate obtained by PEMS tests. Fuel consumption factors of 36 groups of vehicles, grouped according to vehicle type, vehicle weight, and emission standards, are collected. For each road class, the fuel consumption factors at different vehicle speeds and the respective vehicle fleet composition are obtained. The weighted fuel consumption factors for each road class are obtained by Equation 1:
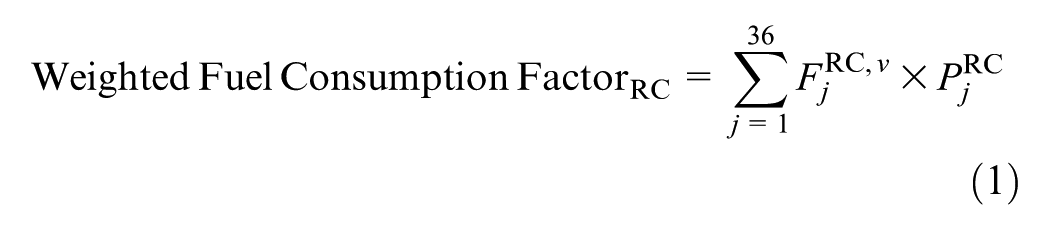
where
Figure 1 indicates the fuel consumption factors weighted by vehicle composition on expressways, arterials, and collectors.
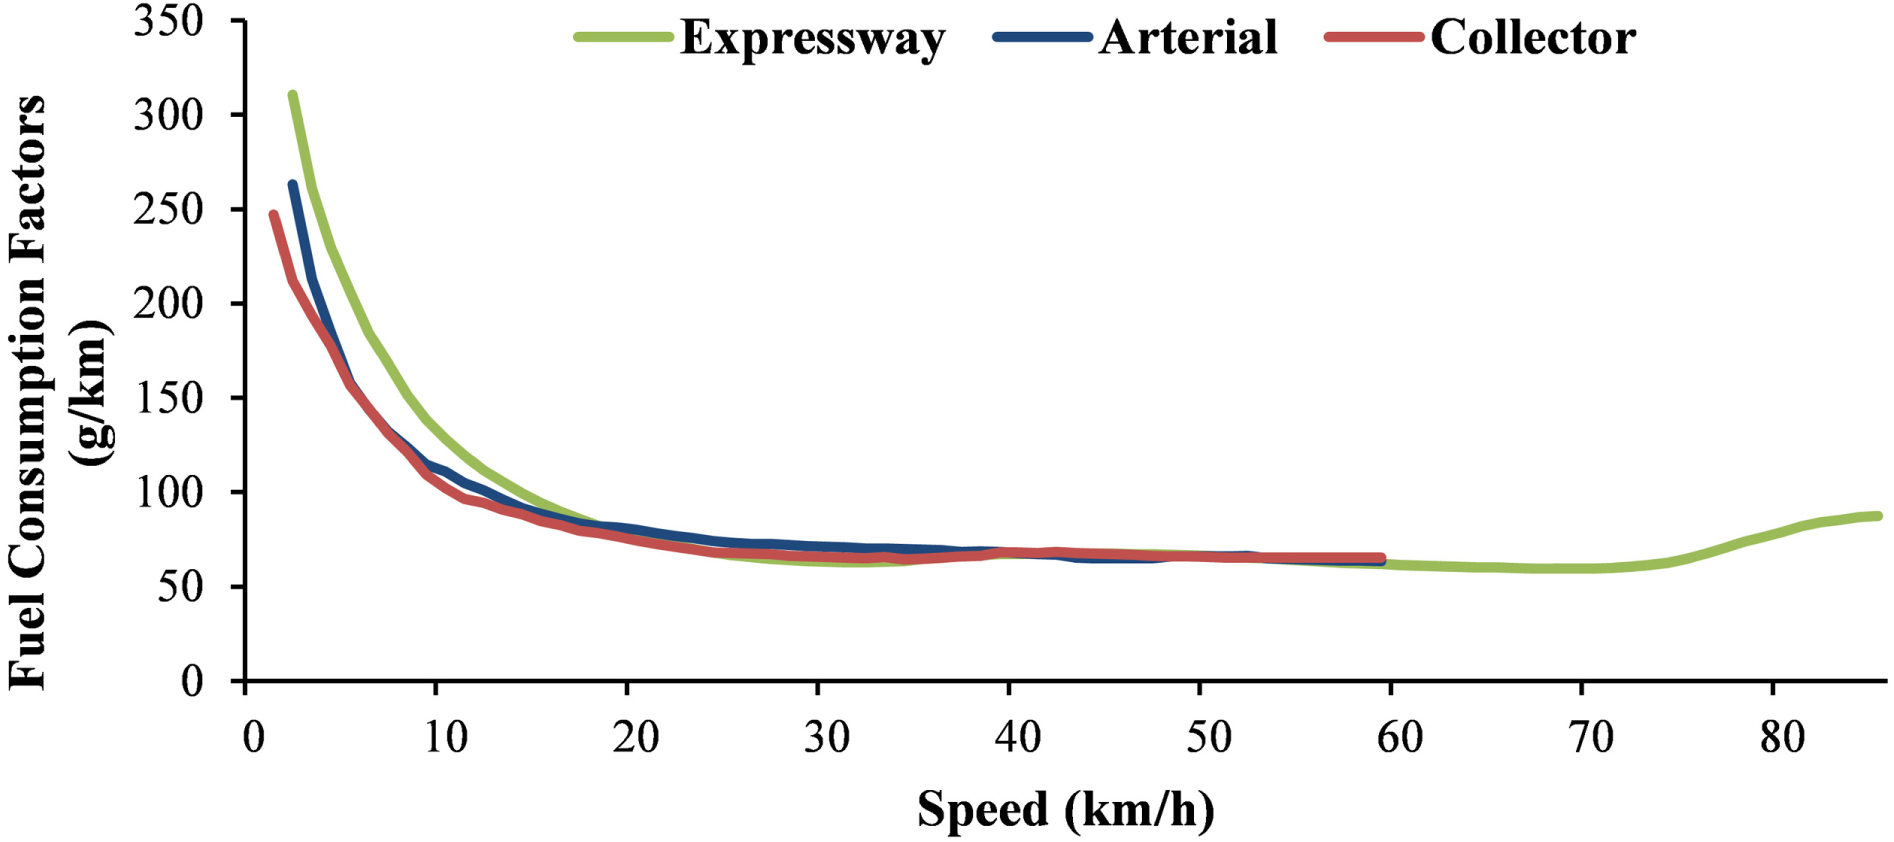
Weighted fuel consumption factors at different speeds by road class.
The fuel consumption factors decrease with the increase of the vehicle speed. The relationship between fuel consumption factors and vehicle speed is described by exponential curves. Traffic at a low speed leads to much more fuel consumption. When the vehicle speed is lower than 10 km/h, the fuel consumption factors decrease fast with the increase of vehicle speed. Further, the fuel consumption factors increase only slightly when the vehicle speed is higher than 70 km/h. Fuel consumption factors on expressways are higher than those on arterials and collectors when the vehicle speed is less than 15 km/h.
Road Link Speed and Traffic Volume Data
The link speed data are provided by the traffic operation monitoring system of Beijing, as shown in Figure 2 ( 3 ). Since 2005, FCD have been collected systematically in Beijing. Over 60,000 taxis equipped with global positioning system (GPS) devices upload their current location information continuously ( 22 , 23 ). The speed for each link of the road network is obtained at a 15-min time interval.
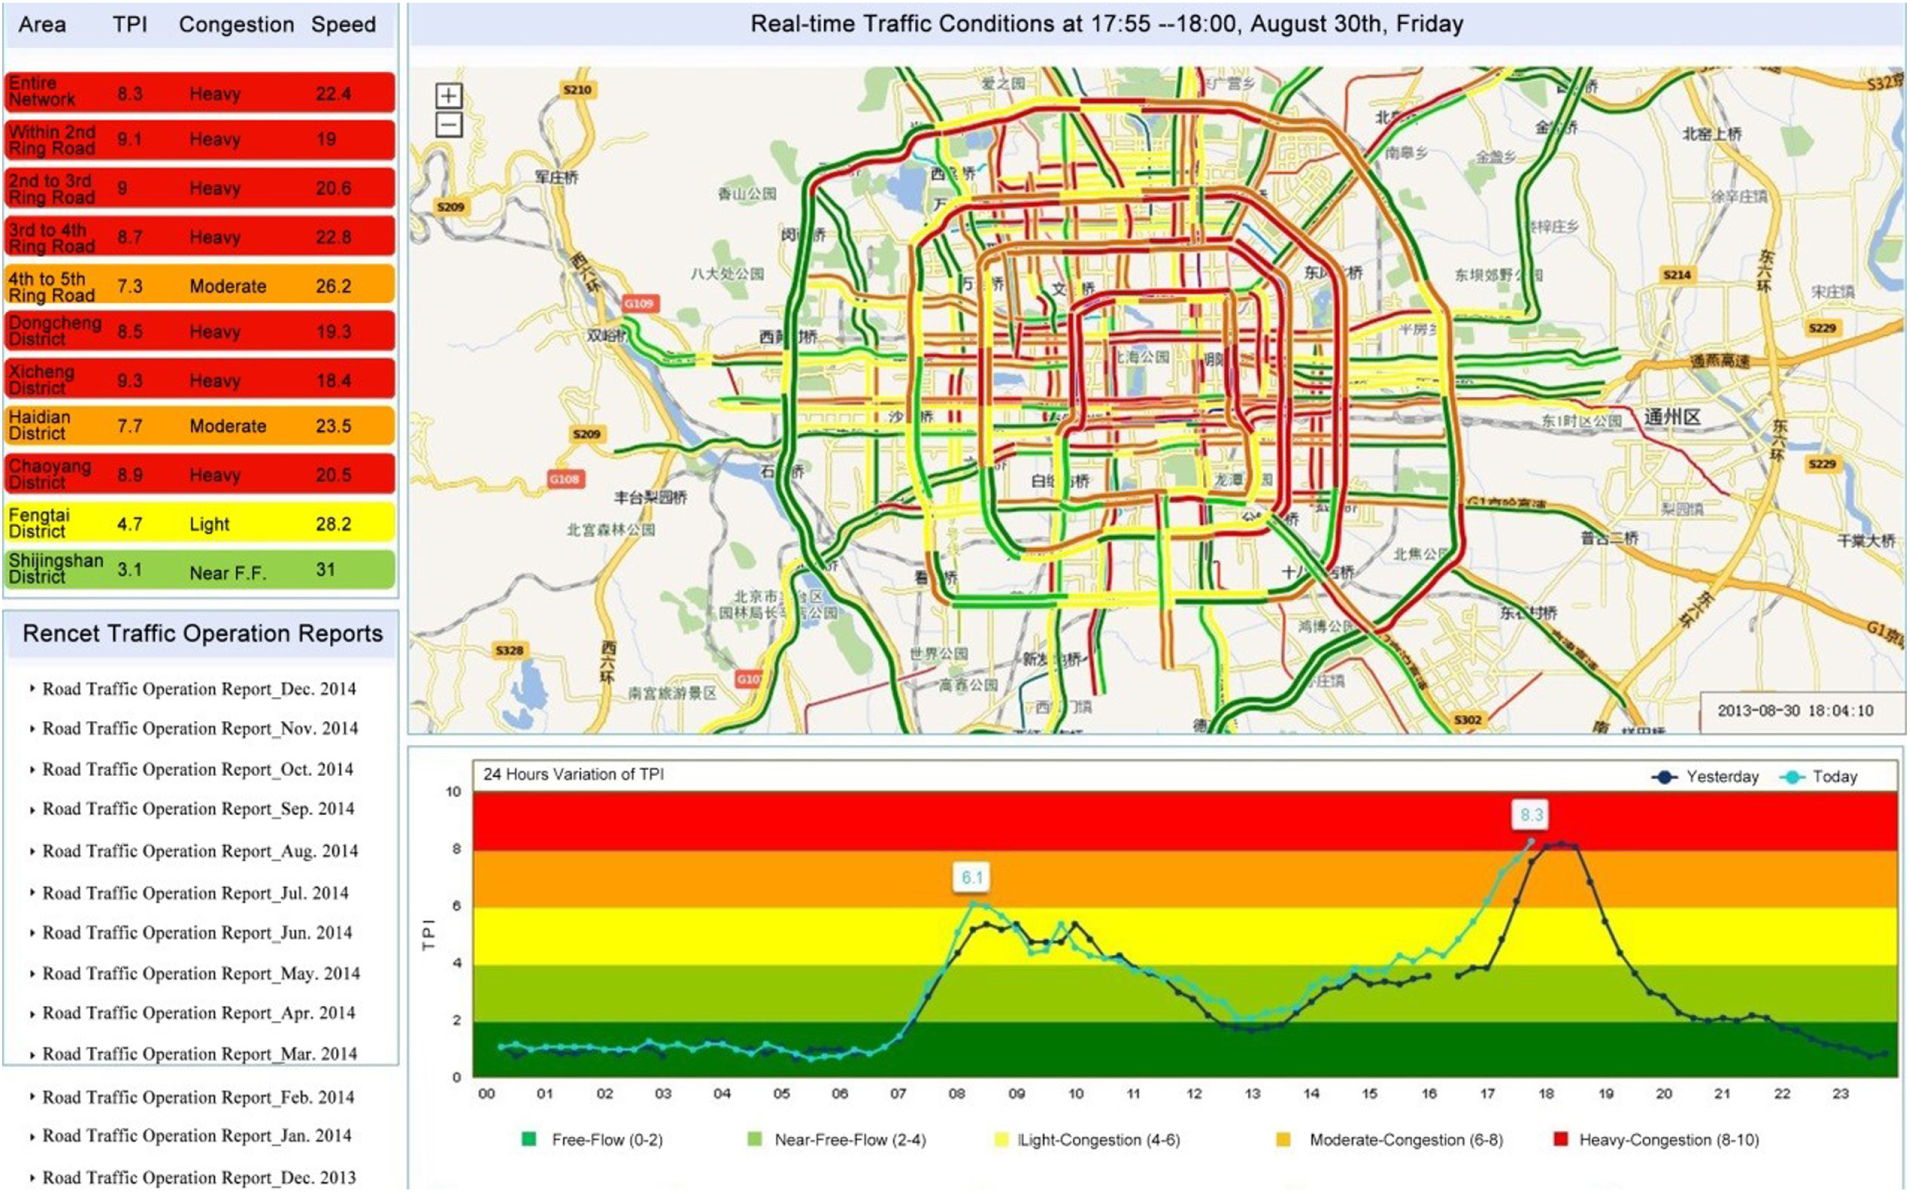
Traffic operation monitoring system in Beijing ( 3 ).
The traffic volume on each link is calculated using the fundamental flow diagram using the Underwood model based on the FCD speed. The speed–flow relationship is shown in Equations 2. In this model, the traffic flow data are obtained from remote traffic microwave sensor detectors by calculating the average value for multiple sections of the same road type and the corresponding travel speed data are provided by FCD ( 24 ). The parameters of expressways, arterials, and collectors are shown in Table 1. The relationship of traffic flow and speed on expressways, arterials, and collectors are shown in Figure 3:

Parameters of Speed–Flow Relationship
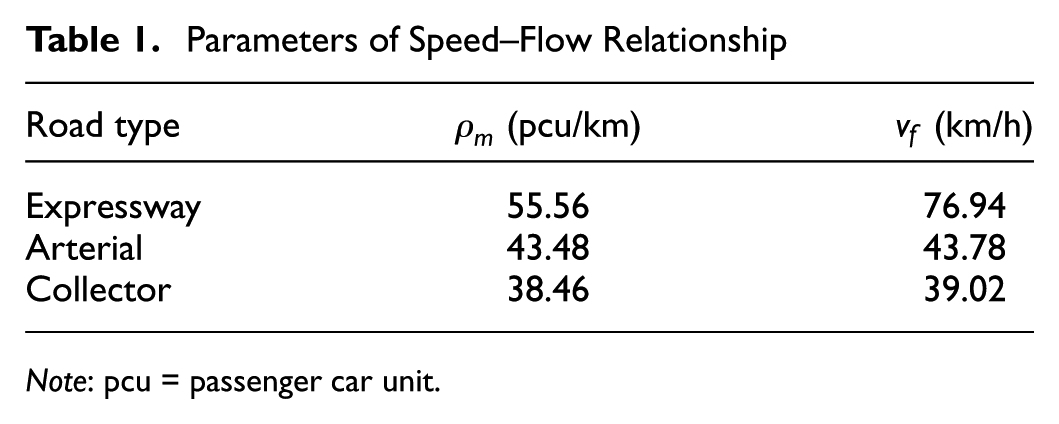
Note: pcu = passenger car unit.
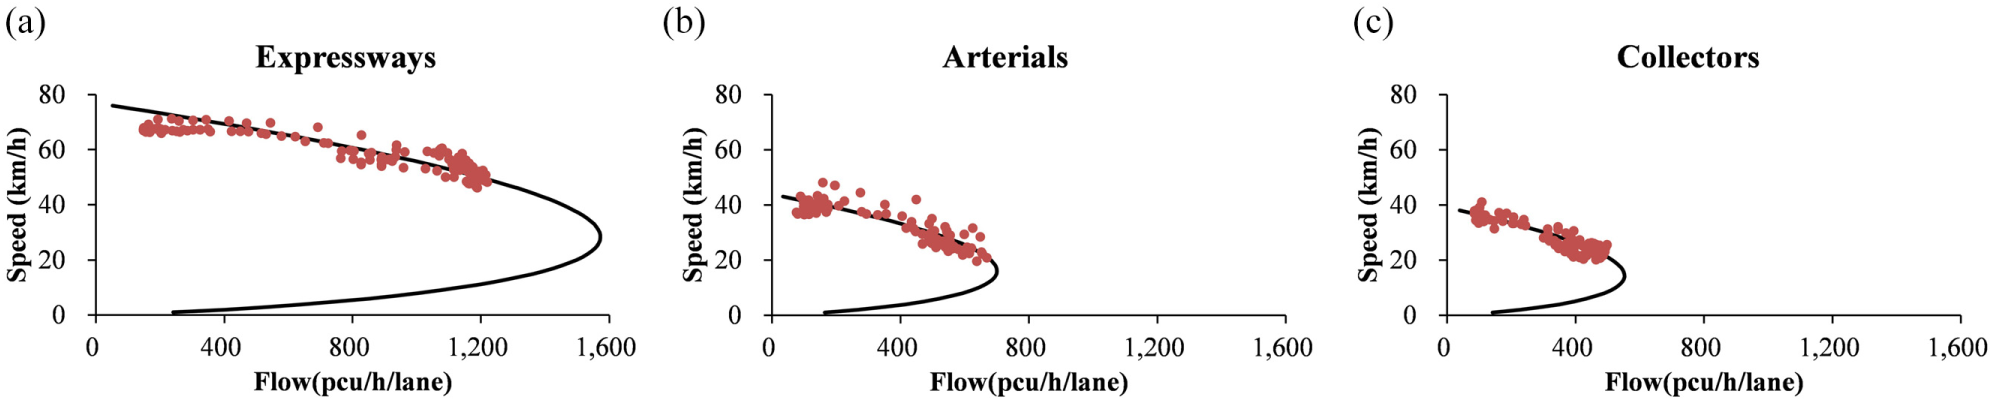
Macroscopic relationship between traffic flow and speed on (a) expressways, (b) arterials, and (c) collectors ( 24 ).
where q is the traffic flow (pcu/h/lane; pcu = passenger car unit), v is the link speed (km/h),
The traffic volume on each link for the 15-min interval is calculated by traffic flow combined with lane number, shown as Equation 3:

where Qi is the traffic volume at the 15-min interval of link i (veh), qi is the traffic flow of link i (pcu/h/lane),
In this paper, speed and traffic volume for each link at the 15-min interval on 13 weekdays are collected and derived. These data are divided into two groups. The first contains the data for five weekdays of June, 2016 and five weekdays of December, 2016 which were ordinary weekdays without holidays or school vacation. These data are used to develop the macroscopic relationship between traffic condition and total fuel consumption. The second group is data from three weekdays before the 2016 Spring Festival collected when the traffic demand was low, which are used to validate the relationship.
The Macroscopic Relationship between Traffic Condition and Total Fuel Consumption
First, the network average speed and fuel consumption are calculated. Second, the data for 10 ordinary weekdays are used to develop the macroscopic relationship between total fuel consumption and network average speed. Third, the data from three weekdays before the 2016 Spring Festival, when the traffic demand was low, are used to validate the developed macroscopic relationship. Only data collected during the hours from 06:00 to 22:00 are used in the analysis.
Data Preparation for Network Average Speed
The network average speed is selected as the indicator of traffic condition. The network average speed at 15-min intervals is calculated as the total distance divided by the total time, as shown in Equation 4. The travel time of each road link is calculated by Equation 5 and the network average speed is calculated based on road link by Equation 6:


where
Data Preparation for Fuel Consumption
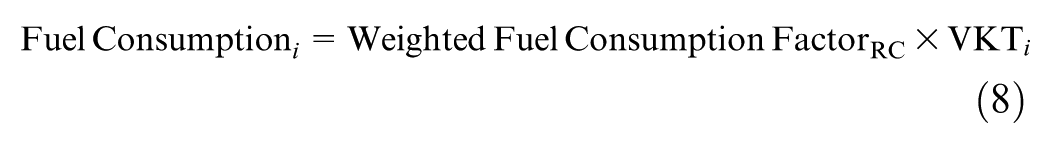
The total fuel consumption is calculated by aggregating the link fuel consumption. The VKT of each link is obtained based on traffic volume data and road information, as shown in Equation 7. For each link, the fuel consumption is equal to the weighted fuel consumption factors at the link speed multiplied by the VKT of the link, as shown in Equation 8. Total fuel consumption is thus calculated using Equation 9:


where
Macroscopic Relationship between Network Average Speed and Total Fuel Consumption
The network average speeds and the total fuel consumption at 15-min intervals are calculated based on Equations 8 and 11. For each 15-min period, the network average speed and total fuel consumption are obtained, which is considered as one sample in the study. A total of 640 samples were obtained during the hours from 06:00 to 22:00. The network average speeds fall into the range from 18.1 km/h to 33.7 km/h. The sample size of each network average speed bin at the 1 km/h interval are shown in Figure 4. For each 15-min interval, the total fuel consumption versus the network average speeds are plotted, as shown in Figure 5.
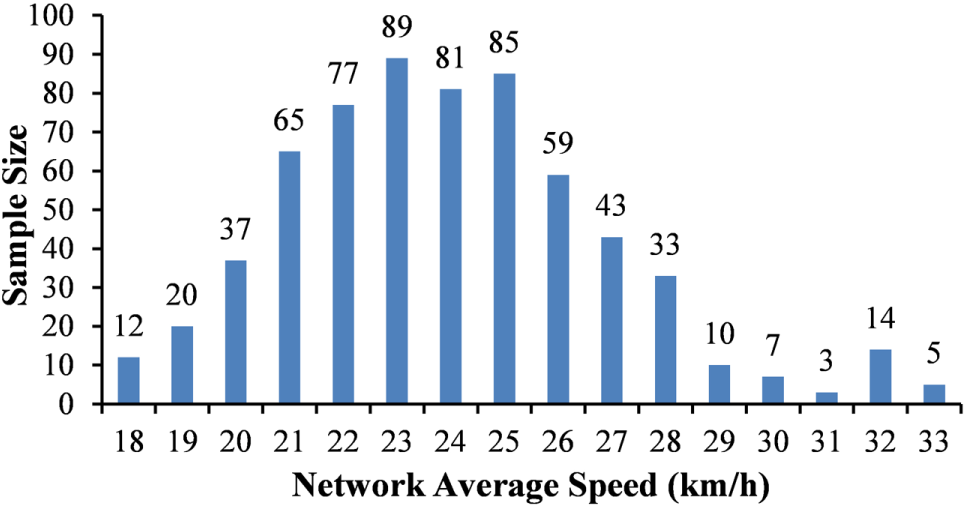
Sample size of each network average speed bin.
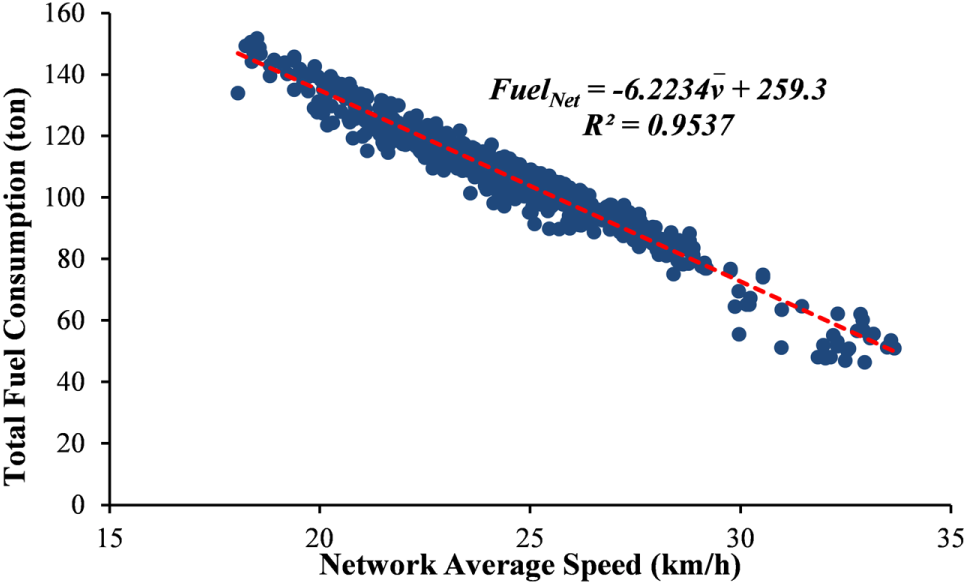
Macroscopic relationship between network average speed and total fuel consumption.
In Figure 5, 71.25% of the samples of the network average speeds are in the range from 21 km/h to 26 km/h. In Figure 5, total fuel consumption decreases when network average speed increases. A linear relationship is derived with an R-square of 0.9537, as shown in Equation 10:

where FNet is the total fuel consumption for the entire road network (ton), and
Although the relationship of speed and fuel consumption factor is a curved function, the macroscopic relationship between total fuel consumption and the network average speed follows a linear function. The field average speeds of the network of Beijing in the 10 ordinary weekdays are within a certain range from 18.1 km/h to 33.7 km/h. The linear function indicates stability of the relationship, and the relationship is possibly not applicable if the speed falls out of that range.
Validation of the Macroscopic Relationship between Network Average Speed and Total Fuel Consumption
The data from three weekdays collected in 2016 before the Spring Festival are used to validate the proposed macroscopic relationship between total fuel consumption and the network average speed. In China, people traditionally return to their hometowns for the Spring Festival. In Beijing, the non-native population is 35.9% of the total resident population ( 25 ). In the days before the Spring Festival, millions of people leave Beijing, making the traffic demand on roads decrease. As such, the total fuel consumption is smaller than those on ordinary weekdays.
The macroscopic relationship between total fuel consumption and network average speeds (Equation 12) is used to estimate total fuel consumption at 15-min intervals based on the network average speed. The estimated values are compared with the total fuel consumption from aggregated road link fuel consumption. These results are presented in Figure 6. The distribution of absolute relative errors between total fuel consumption based on network average speed and total fuel consumption based on aggregated link fuel consumption are illustrated in Figure 7.
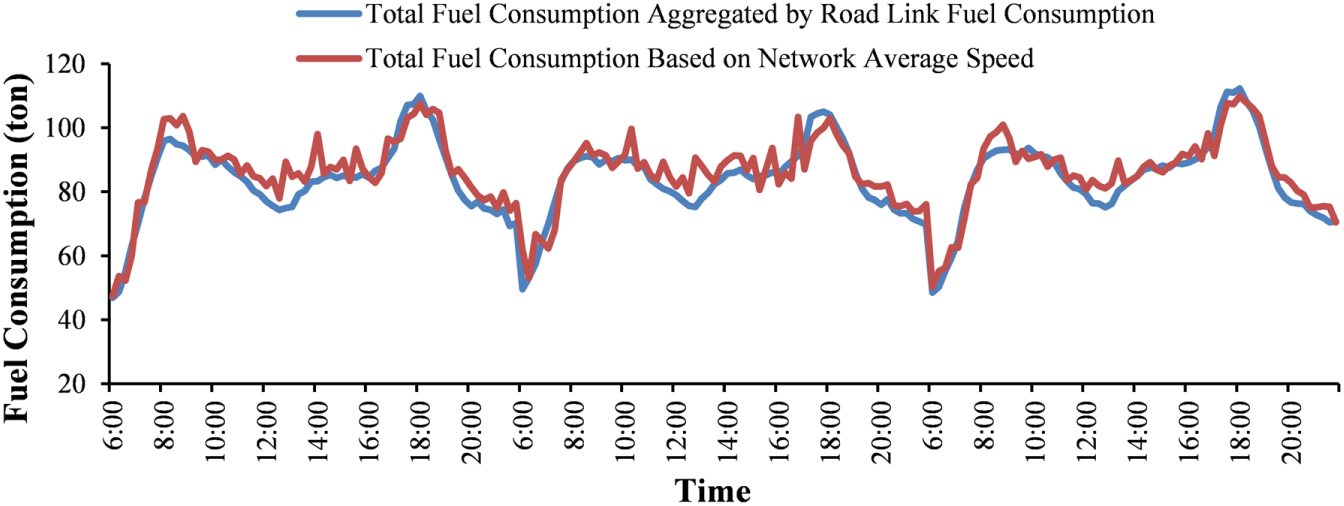
Comparison of total fuel consumption based on network average speed and total fuel consumption based on aggregated link fuel consumption.
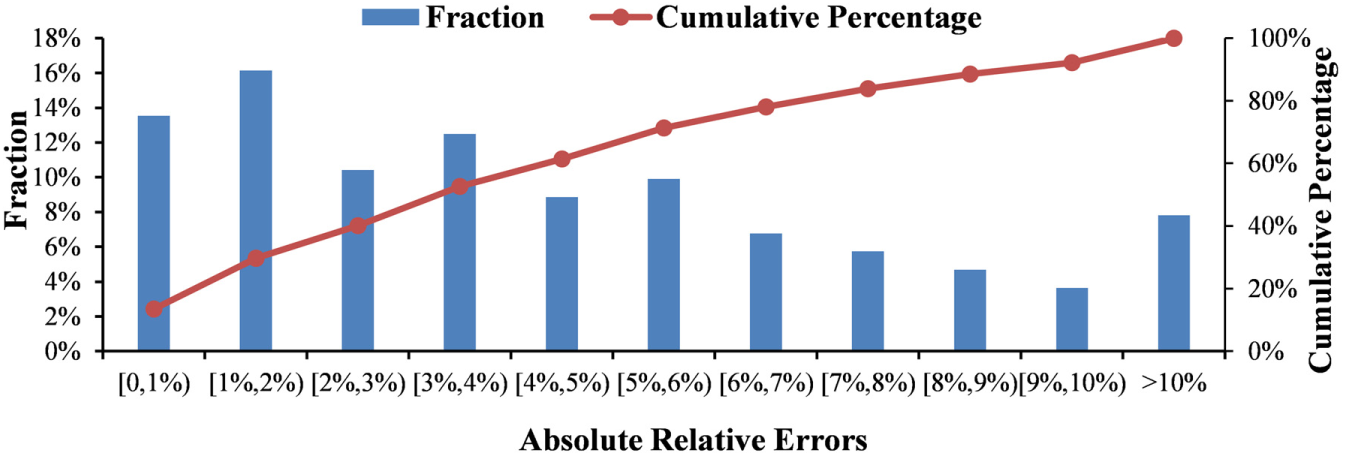
Fraction and cumulative percentage of absolute relative errors.
Using Equation 12 to estimate total fuel consumption resulted in average absolute values of the relative errors of 4.65% for all three days. Of the absolute values of the relative errors, 61.46% are smaller than 5% and 92.19% are smaller than 10%.
Similar to the traffic flow fundamental diagram, a total fuel consumption fundamental diagram can be prepared for a specific road network. The stability of the macroscopic relationship makes it possible to evaluate total fuel consumption simply based on the network traffic conditions for urban traffic management authorities.
Discussion
This section presents the analysis of the distributions of fuel consumption and the traffic operating characteristics reflected by the macroscopic relationship between total fuel consumption and network average speed. To begin with, the total fuel consumption on classified roads at different network average speeds are analyzed because the total fuel consumption is the sum of fuel consumption on expressways, arterials, and collectors. The facility- and speed-specific distributions of VKT at different network average speeds are then developed. The facility- and speed-specific distributions of VKT and respective fuel consumption are analyzed.
Facility-Specific Fuel Consumption at Different Network Average Speeds
The facility refers to certain road class (expressway, arterial and collector) in this paper. Different road classes have different operating patterns and the fuel consumption factors of three road classes have different characteristics. Hence the facility-specific fuel consumption at different network average speeds is analyzed.
The average fuel consumption fraction on expressways, arterials, and collectors are 39.09%, 17.50%, and 43.41%. The amounts and proportions of fuel consumption on expressways, arterials and collectors are shown in Figure 8.
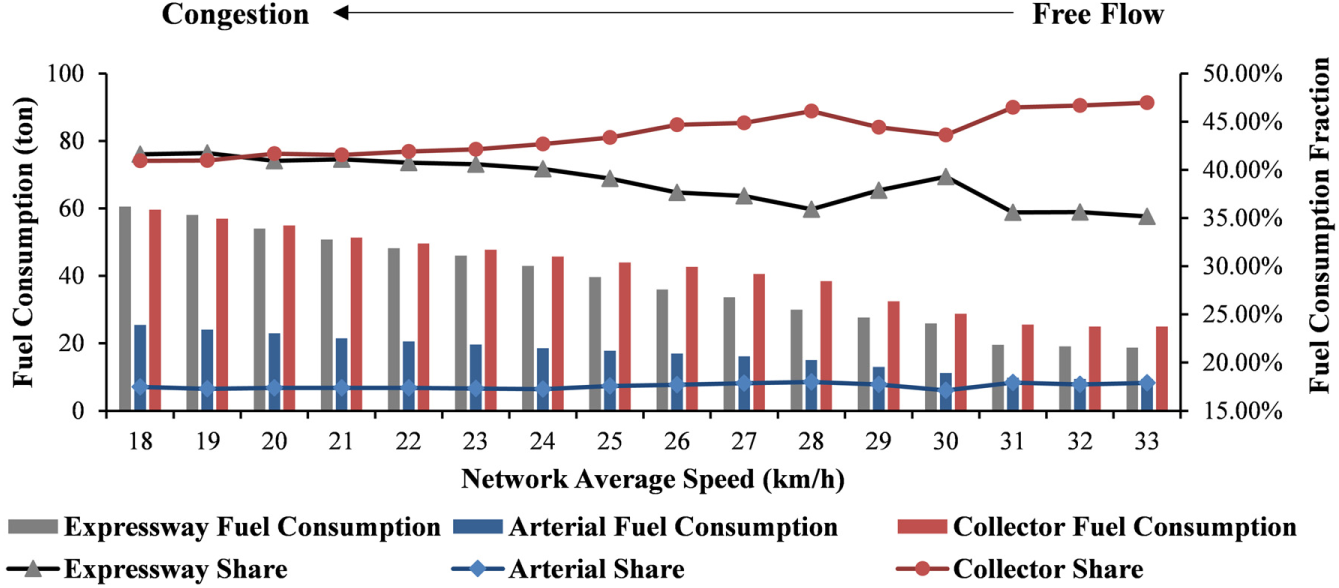
Amounts and fractions of fuel consumption on expressways, arterials, and collectors.
When the traffic becomes congested and the network average speed decreases, fuel consumption increases for all road classes but at different rates of increase. The fuel consumption proportions on expressways (the black line) increase while the proportions on collectors (the red line) decrease. The relationship between facility-specific fuel consumption and the network average speed are shown in Figure 9.
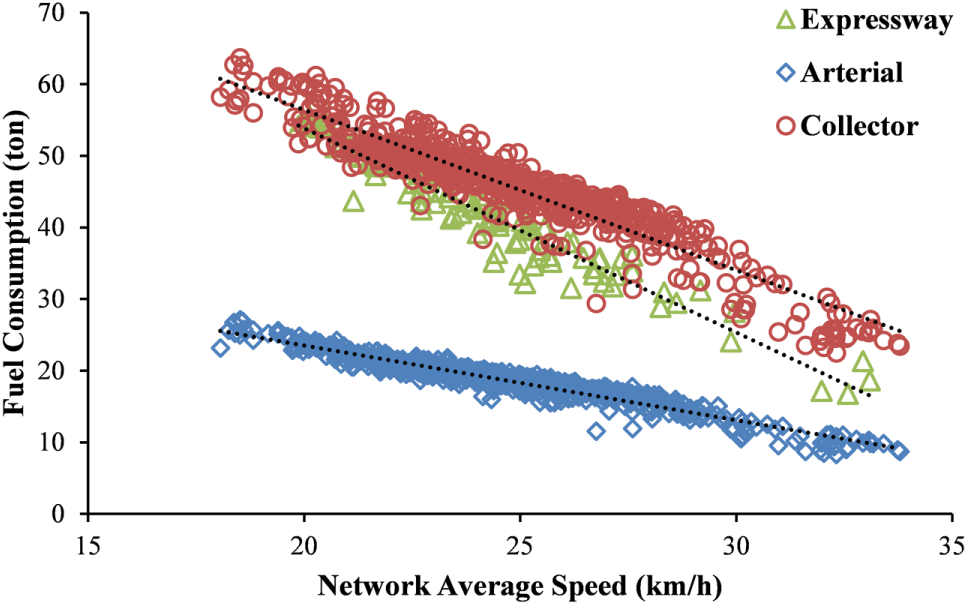
Macroscopic relationship between facility-specific fuel consumption and network average speed.
For the network within the 5th Ring Road of Beijing, the collectors are found to have the most fuel consumption, followed by expressways, and then arterials. Fuel consumption increases when the network average speed decreases for all road classes, but the rates of increase are different. Fuel consumption on expressways increases the fastest while fuel consumption on arterials increases the slowest.
Facility- and Speed-Specific Distributions of VKT and Fuel Consumption at Different Network Average Speeds
Development of Facility- and Speed-Specific Distributions of VKT and Fuel Consumption at Different Network Average Speeds
Total fuel consumption was eventually determined by the link VKT in different link speed bins taking account of the fact that weighted fuel consumption factors vary with speed. Figure 10 indicates the weighted fuel consumption factors and an example of link VKT in different link speed bins on expressways.
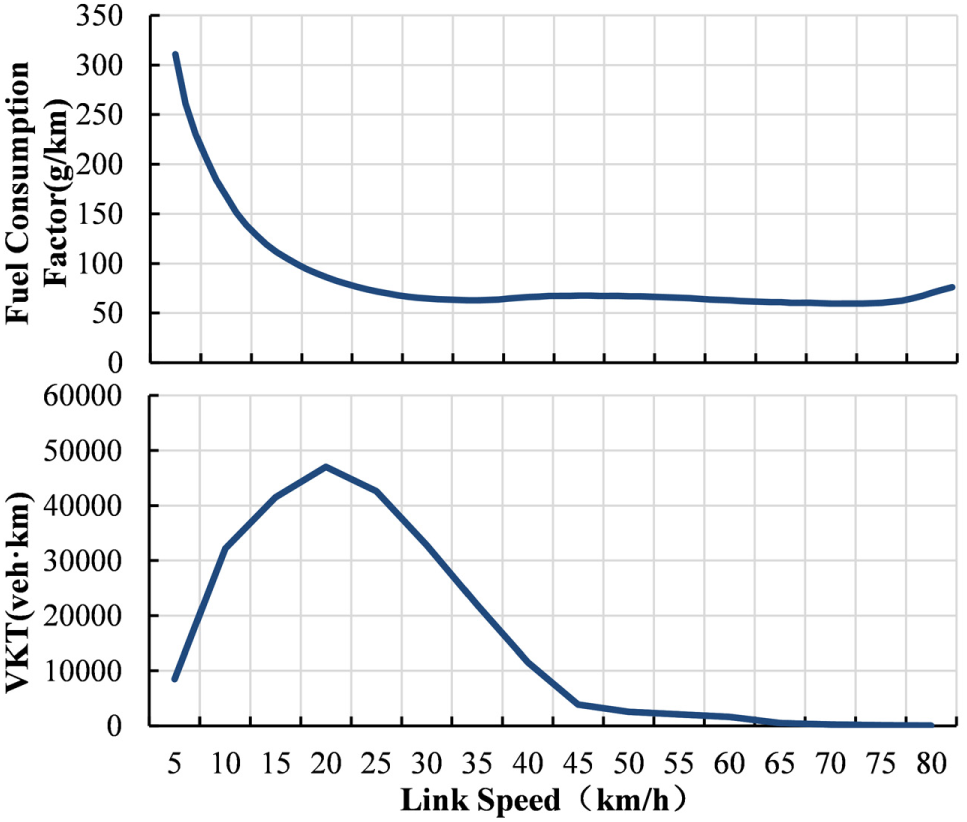
Weighted fuel consumption factors and a speed-specific distribution of VKT on expressways.
Based on the analysis in the preceding section, the rates of increasing fuel consumption on different road classes are different when the network average speed decreases. In addition, the weighted fuel consumption factors on different road classes are different. So the link VKT in different link speed bins under the network average speed should be analyzed by road class. The analysis involves three steps:
(1) Based on FCD, the VKT and fuel consumption for each link are calculated by Equations 9 and 10.
(2) Link speeds are divided into bins at 5 km/h intervals. The speed limit is 100 km/h on expressways and 80 km/h on arterials and collectors. The numbers of link speed bins for expressway, arterial, and collector roads are 20, 16, and 16 respectively. At 15-min intervals, the VKT and fuel consumption of links are classified into the link speed bins and aggregated.
(3) The network average speed is calculated at 15-min intervals. For each network average speed bin at the 1 km/h interval, the average of the aggregated link VKT and link fuel consumption in each link speed bin are calculated.
The Characteristics of Facility- and Speed-Specific Distributions of VKT and Fuel Consumption at Different Network Average Speeds
The facility- and speed-specific distributions of VKT and fuel consumption at different network average speeds are shown in Figure 11 and Figure 12. It should be noticed that the coordinate axes are not the same for different road classes, so the same color may not mean the same amount of VKT or fuel consumption for different road classes. In the same figures, the sum VKT or fuel consumption of all link speed bins are different for different rows. Different rows mean different traffic conditions. The traffic becomes more congested when moving from the upward to the downward direction (network average speed decreases).
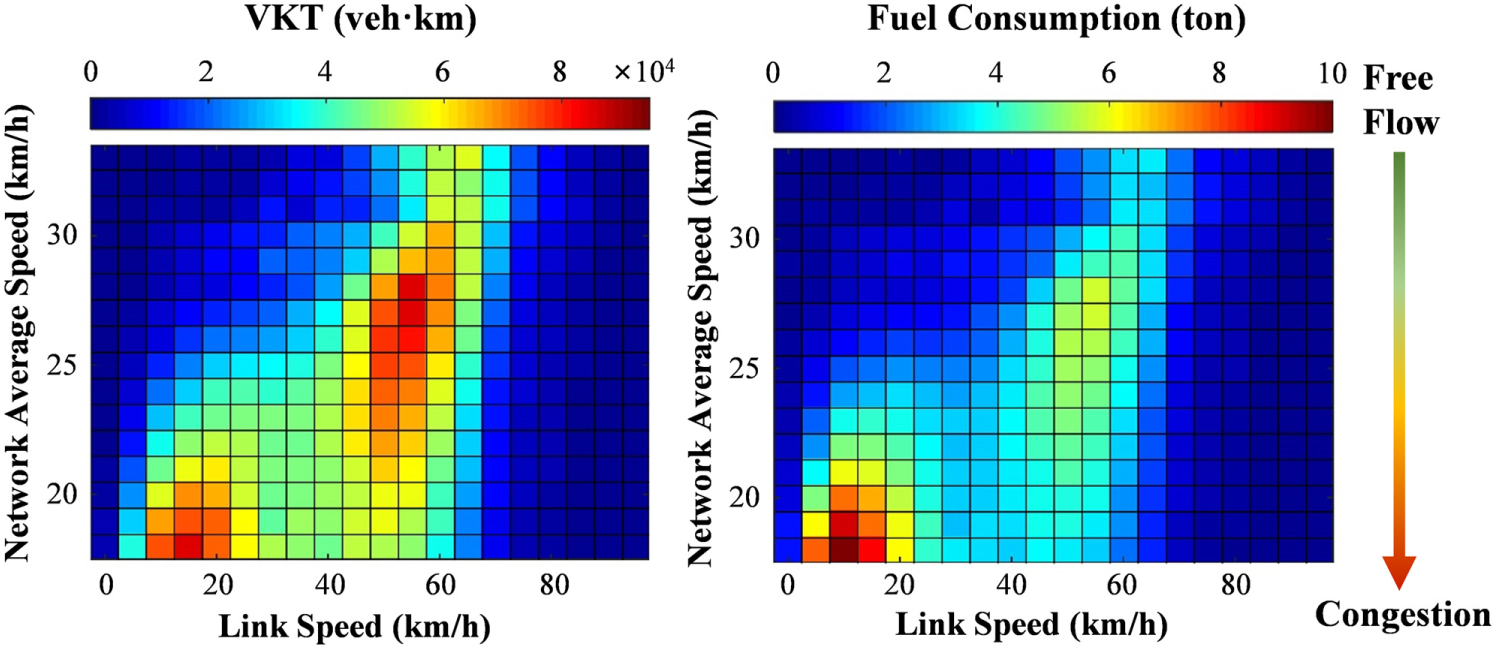
Speed-specific distributions of VKT and fuel consumption at different network average speeds on expressways.
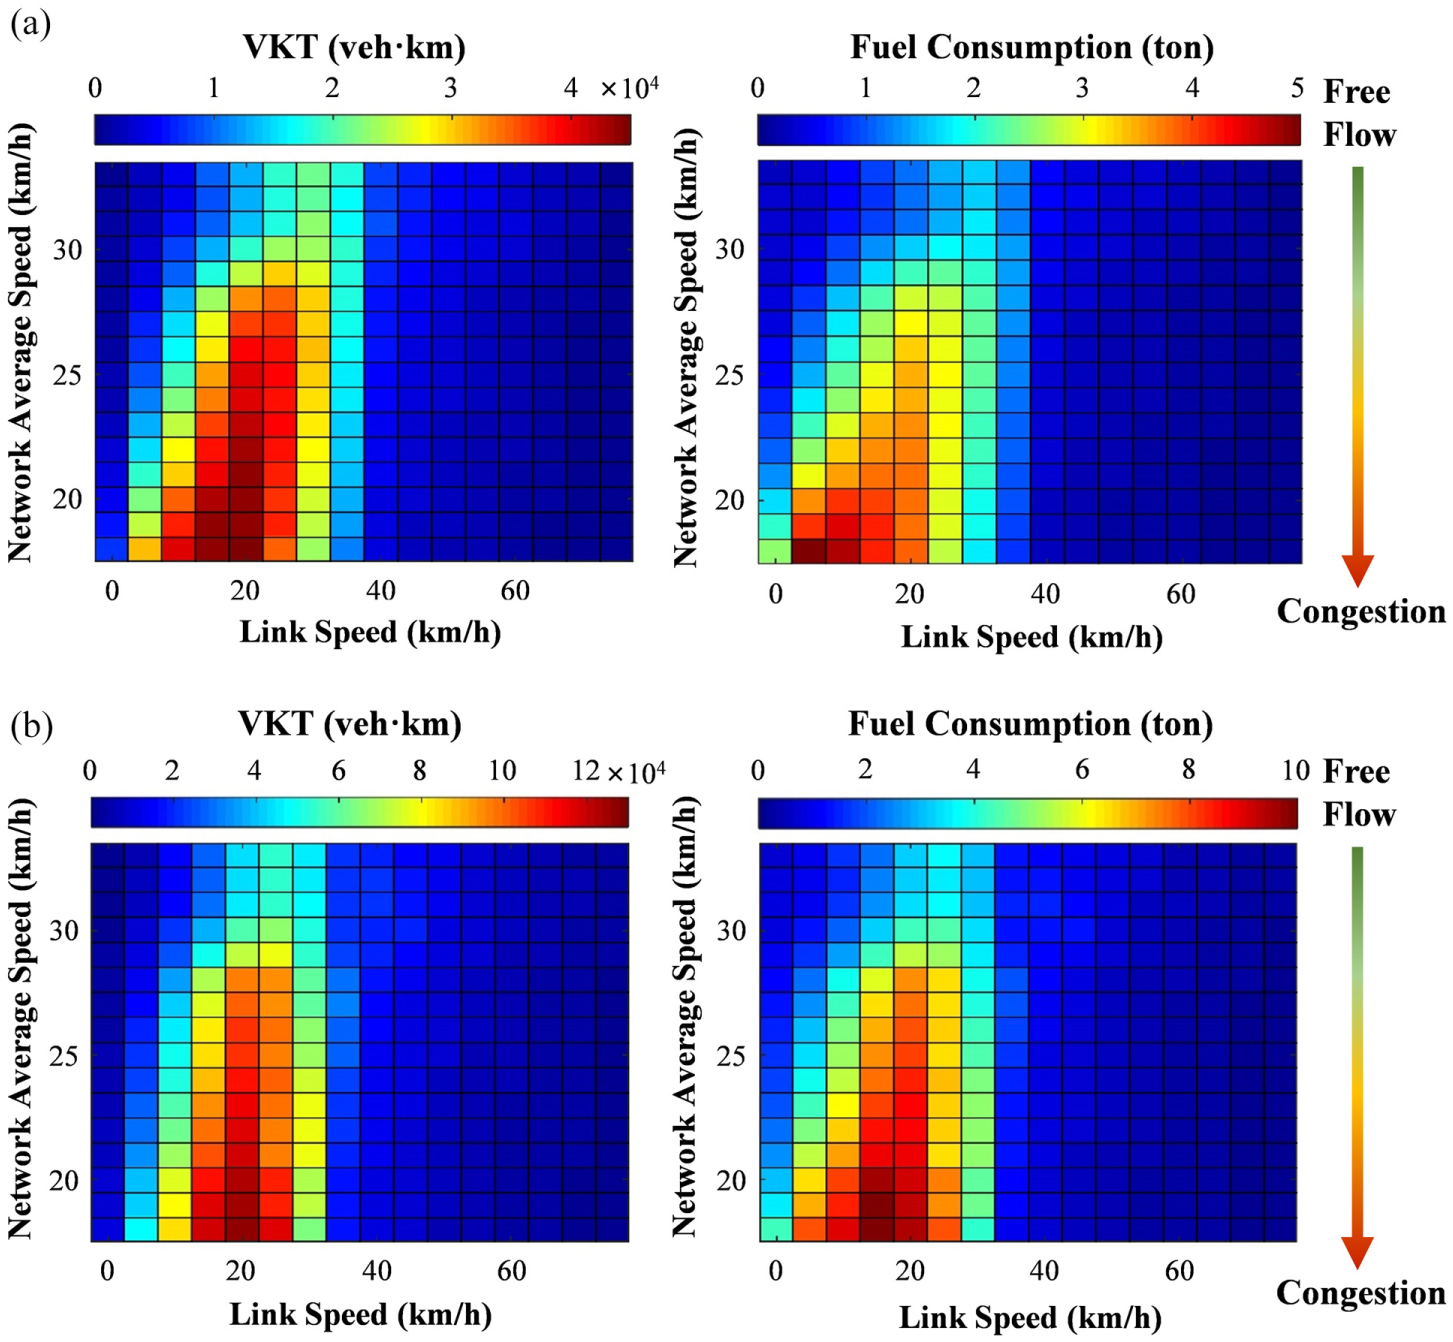
Speed-specific distributions of VKT and fuel consumption at different network average speeds on (a) arterials and (b) collectors.
The speed-specific distribution of VKT and fuel consumption on expressways present the following characteristics, as shown in Figure 11:
(i) When the network average speed is higher than 25 km/h, the speed-specific distribution of VKT demonstrates a single peak pattern. The peak VKT is at the link speed bin of [50 km/h, 60 km/h).
(ii) When the traffic becomes congested, the link VKT are mainly distributed in two link speed bins. The lower link speed bin is [15 km/h, 20 km/h) and the higher link speed bin is [50 km/h, 55 km/h).
(iii) The speed-specific distribution of fuel consumption at different network average speeds has a distribution pattern similar to that of VKT. In light of fuel consumption factors, however, the fuel consumption fraction in the link speed bin of [50 km/h, 60 km/h) is smaller than the respective link VKT fraction. The fuel consumption in the link speed bin of [5 km/h, 20 km/h) is much larger than for other bins. When the network average speed is 18 km/h, the proportion of fuel consumption in the link speed range of [5 km/h, 20 km/h) is 41.77%.
(iv) The speed-specific distribution of VKT varies greatly at different network average speeds on expressways. The link VKT in lower link speed bins increases greatly when the network average speed decreases. Further, the fuel consumption factors on expressways increase more quickly at low vehicle speeds. These are the two reasons why a rapid increase of fuel consumption is observed when traffic becomes congested on expressways.
On arterials and collectors, as shown in Figure 12, the speed-specific distributions of VKT and fuel consumption at different network average speeds indicate the following characteristics:
(i) The speed-specific distributions of VKT distribution demonstrate a single peak pattern all the time. When the network average speed decreases, the link speed bin of the peak VKT value decreases.
(ii) The distribution pattern of speed-specific distribution of fuel consumption is similar to that of VKT. The link speed bin of peak fuel consumption is lower than that of peak VKT in light of fuel consumption factors. For example, when the network average speed is 20 km/h, the maximum VKT is in the link speed bin of [20 km/h, 25 km/h) on arterials, while the maximum fuel consumption is in the link speed bin of [10 km/h, 15 km/h).
(iii) Arterials and collectors have similar speed-specific distributions of VKT at different network average speeds. So, the fuel consumption on arterials and collectors increases but not as fast as on expressways.
The macroscopic relationship between total fuel consumption and network average speed depends on the VKT in link speed bins. One concern about the macroscopic relationship is that the network average speed and the total fuel consumption are not a one-to-one correspondence because the different speed-specific distributions of VKT may lead to the same network average speed but different total fuel consumption. The certainty of the macroscopic relationship between total fuel consumption and network average speed could be improved by the analysis of VKT in link speed bins in further study.
Summary and Recommendations
Based on field data from Beijing, the macroscopic relationship between network traffic condition and total fuel consumption is developed. The network average speed is used as the indicator of network traffic condition, which is defined as the total distance divided by the total travel time for all the vehicles in the network. The total fuel consumption is based on aggregated fuel consumption of all links, which is calculated using the FCD, based on a VSP-based micro fuel consumption model. The speed-specific distributions of VKT and fuel consumption at different network average speeds are analyzed. The findings of this paper are summarized as follows:
(i) The macroscopic relationship between network average speed and total fuel consumption for a road network can be described by a linear equation. When the network average speed decreases, the total fuel consumption increases. Fuel consumption increases more rapidly on expressways than on arterials and collectors when the traffic becomes congested.
(ii) The proposed macroscopic relationship is used to estimate total fuel consumption for three weekdays when the traffic demand was low. Compared with the total fuel consumption based on aggregated link fuel consumption, the total fuel consumption based on average network speed has an average absolute relative error of 4.65%.
(iii) The speed-specific distributions of VKT explain the different rates of increase of fuel consumption on different classes of roads when the traffic becomes congested. On expressways, the link VKT fraction at different link speeds changes rapidly under different network average speeds, which causes fuel consumption to change rapidly under different traffic conditions. When the traffic becomes congested, the VKT on expressways is mainly distributed in two link speed bins, a higher speed bin and a lower speed bin, while the distribution on arterials and collectors remains as a single peak for all traffic conditions.
The validation indicates that, though uncertainty exists, the relative error is mostly less than 5%. This indicates that the speed-specific distributions of VKT at different traffic conditions are rather stable for the road network, even though the traffic demand changes. There might be a fundamental diagram for total fuel consumption and traffic conditions. If so, it will provide a relatively low-cost approach to estimate total fuel consumption by traffic conditions. Further research could analyze the characteristics and the uncertainty of speed-specific distribution of VKT by more detailed classifications, such as peak or off-peak hours and weather conditions, to improve the reliability of the macroscopic relationship. In addition, fleet composition on a high spatial and temporal resolution would help improve the accuracy of estimates of fuel consumption. The results, based on historic data, might not be applicable to future scenarios if there is a change of infrastructure. The effects of induced traffic caused by improvement of traffic conditions and improvement of infrastructure on fuel efficiency need to be considered in further study ( 26 , 27 ).
Footnotes
Acknowledgements
This research was supported by the Natural Science Foundation of China (NSFC) # 51678045 and 51578052.
Author Contributions
The authors confirm contribution to the paper as follows: study conception and design: GS, JW, YC, WH, and HL; data collection: JW and JS; analysis and interpretation of results: JW and GS; draft manuscript preparation: JW, GS, LY, and HL. All authors reviewed the results and approved the final version of the manuscript.
The Standing Committee on Transportation Energy (ADC70) peer-reviewed this paper (19-02400).