
Abstract
The passage of state legislation has promoted and encouraged the development of pavement management plans at the local level. A widespread response to such legislation in some states has been the assessment of pavement condition using the pavement surface evaluation and rating (PASER) method. The specific objectives of this research were to: 1) assess the accuracy of statewide local agency PASER raters; 2) identify PASER values that are difficult to rate; and 3) propose a standard tolerance to be used in statewide quality control evaluations. Statewide PASER condition data collected by local agencies in Indiana were statistically subsampled and rated by PASER-certified Indiana Local Technical Assistance Program (LTAP) personnel. The local agency ratings were then compared with the LTAP ratings using four agreement tolerances: 1) complete agreement; 2) within-1-rating agreement; 3) within-2-ratings agreement; and 4) “good/fair/poor” category agreement. Local agencies tended to overrate the middle-to-low PASER values (1–6) and slightly under-rate the upper PASER values (7–10). This means that budget needs based on data collected by local agencies are likely underestimated. Pavements in poor condition (PASER 1–4), particularly PASER 4, were assigned the correct “good/fair/poor” category the least often. Since the “good/fair/poor” category agreement was the most rigorous tolerance after complete agreement and has the potential to capture significant funding differences appropriate to each category, it is recommended for use as a statewide quality control standard.
Transportation asset management, although not a new concept, has struggled to gain widespread adoption, particularly at the local agency level. Because successful asset management plans depend on the collection and use of condition data, which can require significant resources to obtain, many local agencies do not collect condition data, leaving the benefits of asset management plans unclaimed. However, in some states the passage of legislation has promoted and encouraged the development of asset management plans at the local level, particularly with respect to pavements.
In 1999, the Wisconsin State Legislature passed a provision requiring local agencies to assess and report their road condition biennially using a Wisconsin Department of Transportation (DOT) approved pavement condition assessment method ( 1 ). While a few cities, such as the City of Milwaukee and the City of Eau Claire, use more sophisticated pavement condition assessment methods, it is estimated that 99% of the local agencies in Wisconsin use the pavement surface evaluation and rating (PASER) method for evaluating pavement condition ( 2 ; B. Jordan, Director of Wisconsin Transportation Information Center, personal communication on March 14, 2017). This provision has been reapproved several times, most recently in 2017.
In 2002, the Michigan State Legislature passed Public Act 499 ( 3 ), which created and charged the Michigan Transportation Asset Management Council (TAMC) with coordinating a unified effort to promote the use of asset management principles for Michigan’s roads and bridges. This has resulted in a TAMC-organized annual condition assessment and report of Michigan’s federal aid eligible roads, and the encouragement and support of local agencies to collect pavement condition data for non-federal aid roads. Similar to Wisconsin, the PASER method is widely used for both federal aid roads and non-federal aid roads in Michigan ( 4 – 6 ).
More recently, the Indiana State Legislature passed the 2016 Enrolled House Bill 1001 (EHB 1001) ( 7 ), which established a grant fund providing local agencies an opportunity to apply for and receive funds for the construction and preservation of roads and bridges. One application requirement is the submission of an asset management plan for pavements and bridges including condition data. In 2016, 312 local agencies responded to the legislation by submitting pavement management plans and accompanying condition data representing 76% of the statewide local road network. Of the pavement condition data received, PASER was the predominant condition assessment method, representing 91% of the received condition data, with the pavement condition index (PCI) representing almost all of the remaining 9% of the condition data ( 8 ).
While the use of the PASER method was not required by law in any of these states, the widespread response to state legislation was to use the PASER method for assessing pavement condition, because it was specifically designed for small local agencies, such as cities, counties, and towns, with limited resources.
Background
Pavement Surface Evaluation and Rating
The PASER method is a pavement condition assessment method that assigns roads a condition rating based on observed distresses. PASER ratings are discrete and range from 10 to 1, with a rating of 10 representing a new pavement and rating of 1 representing a structurally failed pavement. During the PASER rating process, the condition of the roadway is observed (either manually in the field or from field collected videos or images), distresses are identified, and an appropriate rating is assigned based on the visually estimated extent of the critical distress in accordance with published PASER standards. PASER manuals and field guides have been prepared for asphalt, concrete, gravel, and brick roads ( 9 ).
PASER ratings are classified into three categories based on common maintenance treatments. Pavements with PASER ratings of 8–10 are classified as “good” and require little or only routine maintenance such as cleaning or crack sealing. Pavements with ratings of 5–7 are classified as “fair” and require capital preventive maintenance such as crack sealing, sealcoats, or thin overlays. Finally, pavements with ratings of 1–4 are classified as “poor” having visible structural distresses, which require major rehabilitation such as patches, structural overlays, or reconstruction ( 4 ).
Although PASER assessments, as well as other visual condition assessments, are performed according to well-defined criteria, there is some variability inherent in the visual evaluation of distresses as well as in the experience of different raters ( 10 – 14 ). PASER ratings have been described as both subjective and variable ( 4 , 15 ) and very little research has been performed to understand PASER and how it is used.
Accuracy of Statewide Pavement Surface Evaluations and Ratings
Although both Michigan and Wisconsin have been collecting statewide PASER data for several years, only the Michigan DOT has made an effort to assess the accuracy specifically associated with the collection of PASER ratings.
Michigan
Every year since 2004, over 100 three-person teams composed of one Michigan DOT representative, one regional or metropolitan planning organization (RPO, MPO) representative, and one local agency representative perform PASER condition assessments on at least 50% of the paved federal aid road network in the state of Michigan. To assess the accuracy of the team’s ratings, a qualified transportation technician also rates over 2,000 pavement segments scattered throughout the state. These quality control ratings are then compared with the corresponding team ratings and summarized by two statistics: 1) the average difference between the team’s ratings and the technician’s ratings; and 2) the percentage of the team’s ratings that were within a two-rating tolerance of the technician’s ratings. Most recently, the average difference was reported as two thirds of a rating point and over 90% of the team’s ratings were within the two-rating tolerance of the technician’s ratings ( 6 ).
This assessment, though providing some useful information about the quality of the team ratings, leaves room for improvement, specifically in three areas. First, while efforts have been made to assess the quality of PASER ratings performed by teams of DOT, RPO or MPO, and local agency representatives, no effort has been made to assess the quality of PASER ratings performed solely by local agency raters, who have potentially limited technical backgrounds and experience.
Second, little description or justification are provided for the statistical analysis. Regarding the acceptable tolerance of ±2 rating points, no justification is provided. Since condition data are often used to develop cost estimates, a tolerance of ±2 rating points is perhaps too broad in critical areas of the scale, potentially straddling practical classifications, resulting in inaccurate cost estimates. For example, a road segment that was technician-rated a 6, a fair rating, could conceivably be mis-rated a 4, a poor rating, or an 8, a good rating. Regarding the observed average difference, no discussion of sampling is provided, making it difficult to make any statewide generalizations about the quality of the collected condition data.
Finally, Michigan DOT’s assessment provides no indication or discussion of what types of discrepancies are occurring. For example, are there some rating values that tend to be more difficult to rate than others?
Wisconsin
Although PASER is widely used in Wisconsin a formal quality control check of the local agency condition data is not employed. In Wisconsin, the primary concerns with regard to rater accuracy and variability are potential rater “drift” (which can occur when a rater has not attended a recent refresher training course), and the potential for ratings to be mis-assigned based on the treatments an agency can afford rather than on the visible distresses and standard criteria (B. Jordan, Director of Wisconsin Transportation Information Center, personal communication on March 14, 2017).
Objectives
Considering the limited research and experience specifically assessing the quality of statewide PASER data collected by local agencies, the specific objectives of this research were to:
Assess the accuracy of statewide local agency PASER raters.
Identify PASER values that are difficult to rate.
Propose a standard tolerance to be used in statewide quality control evaluations.
Methods
The objectives were accomplished by comparing statewide PASER data collected by local agencies in Indiana with corresponding PASER data collected by PASER-certified Indiana LTAP personnel.
Data Collection
Local Agency Data Collection
In 2016, 312 Indiana local agencies including cities, counties, and towns submitted pavement condition data in compliance with EHB 1001. The received condition data constituted over 290,000 pavement segments, representing approximately 76% of the statewide local network. Of the condition assessment methods used, PASER ratings accounted for 91% of the total centerline miles, PCI for 8.9%, with Pavement Condition Rating and a simple “good, fair, poor” classification making up approximately 0.1% ( 8 ).
Local Technical Assistance Program Data Collection
To assess the quality of the PASER ratings obtained by local agencies a subset of the local agency ratings were compared with corresponding ratings obtained by experienced, PASER-certified Indiana LTAP personnel. Considering the massive quantity of pavement condition data received, a complete comparison of all statewide local agency ratings with LTAP ratings was not feasible. Consequently, a representative number of pavement segments was determined and sampled for LTAP evaluation. Equation 1, for a 95% confidence interval was used as a starting point for determining an appropriate comparison sample size ( 16 ):

where
n: number of sample segments.
Solving Equation 1 for the number of sample segments yields Equation 2. Since the proportion of segments with agreeing ratings was unknown, the worst case of 0.5 was used along with a margin of error of 5%. This resulted in a required sample size of 384 segments to be selected and rated by the LTAP. To provide a buffer, a sample size of 400 pavement segments was selected:

where
n: number of sample segments,
m: margin of error, and
p: proportion of segments with agreeing ratings.
To ensure the pavement segments selected for LTAP rating satisfied statistical independence and represented the entire population of received PASER condition data, the 400 segments were randomly selected using a two-stage, weighted sampling method ( 17 ). However, sampling was limited to segments with adequate start and end point descriptions.
The first stage of sampling used simple random sampling to select a proportion of the participating cities, counties, and towns based on feasibility aspects. Sampling weights for each segment were calculated for each sampling stage. These values were used in subsequent analyses to scale the results of the comparison dataset to the statewide dataset. The sampling weight for the first sampling stage was calculated as shown in Equation 3:

where
The second sampling stage used stratified random sampling to select the 400 pavement segments in proportion to the number of segments submitted by a participating agency. This means an agency with many segments would have a greater number of sample segments selected than an agency with a small number of segments. Each of the cities, counties, and towns selected in the first stage was represented at the second stage. The segment weight representing the second stage of sampling was calculated for each pavement section according to Equation 4 and the composite sampling weight representing the two-stage sampling process was the product of both sampling weights, as shown in Equation 5. These values were calculated for each selected pavement segment:

where

where:
PASER-certified Indiana LTAP personnel performed PASER ratings on the selected pavement segments within four months of receipt of the local agency ratings. During the LTAP rating process, some segments were identified as having received a treatment or reconstruction after the local agency rating was performed but before the LTAP rating was performed. Additionally, sufficient descriptive information for re-identification of some segment start and end points was not provided by the local agencies. Such segments were noted and treated as missing in the comparison dataset because either a direct comparison between the two ratings could not be made or an LTAP rating could not be performed. The comparison dataset consisted of 363 pavement segments with both local agency and LTAP PASER ratings. The first, second, and composite sampling weights were updated to reflect the changes in the respective sample sizes.
Rating Comparisons
The PASER ratings obtained by the local agencies were compared with those obtained by the LTAP personnel using four agreement tolerances:
Complete agreement
Within-1-rating agreement
Within-2-ratings agreement
“Good/fair/poor” category agreement
These agreement tolerances are illustrated in Figure 1. Complete agreement occurred if, for a given segment, the difference between the agency rating and the LTAP rating was 0, meaning they were identical. Within-1-rating agreement occurred if, for a given segment, the absolute difference between the agency rating and the LTAP rating was less than or equal to 1 rating point. Within-2-ratings agreement occurred if, for a given segment, the absolute difference between the agency rating and the LTAP rating was less than or equal to 2 rating points. This tolerance is used as a quality control standard in Michigan ( 6 ). Finally, “good/fair/poor” category agreement occurred if, for a given segment, the good, fair, or poor category corresponding to the local agency rating matched the good, fair, or poor category corresponding to the LTAP rating. Local agency ratings not meeting any of the agreement tolerances were considered to be in disagreement.
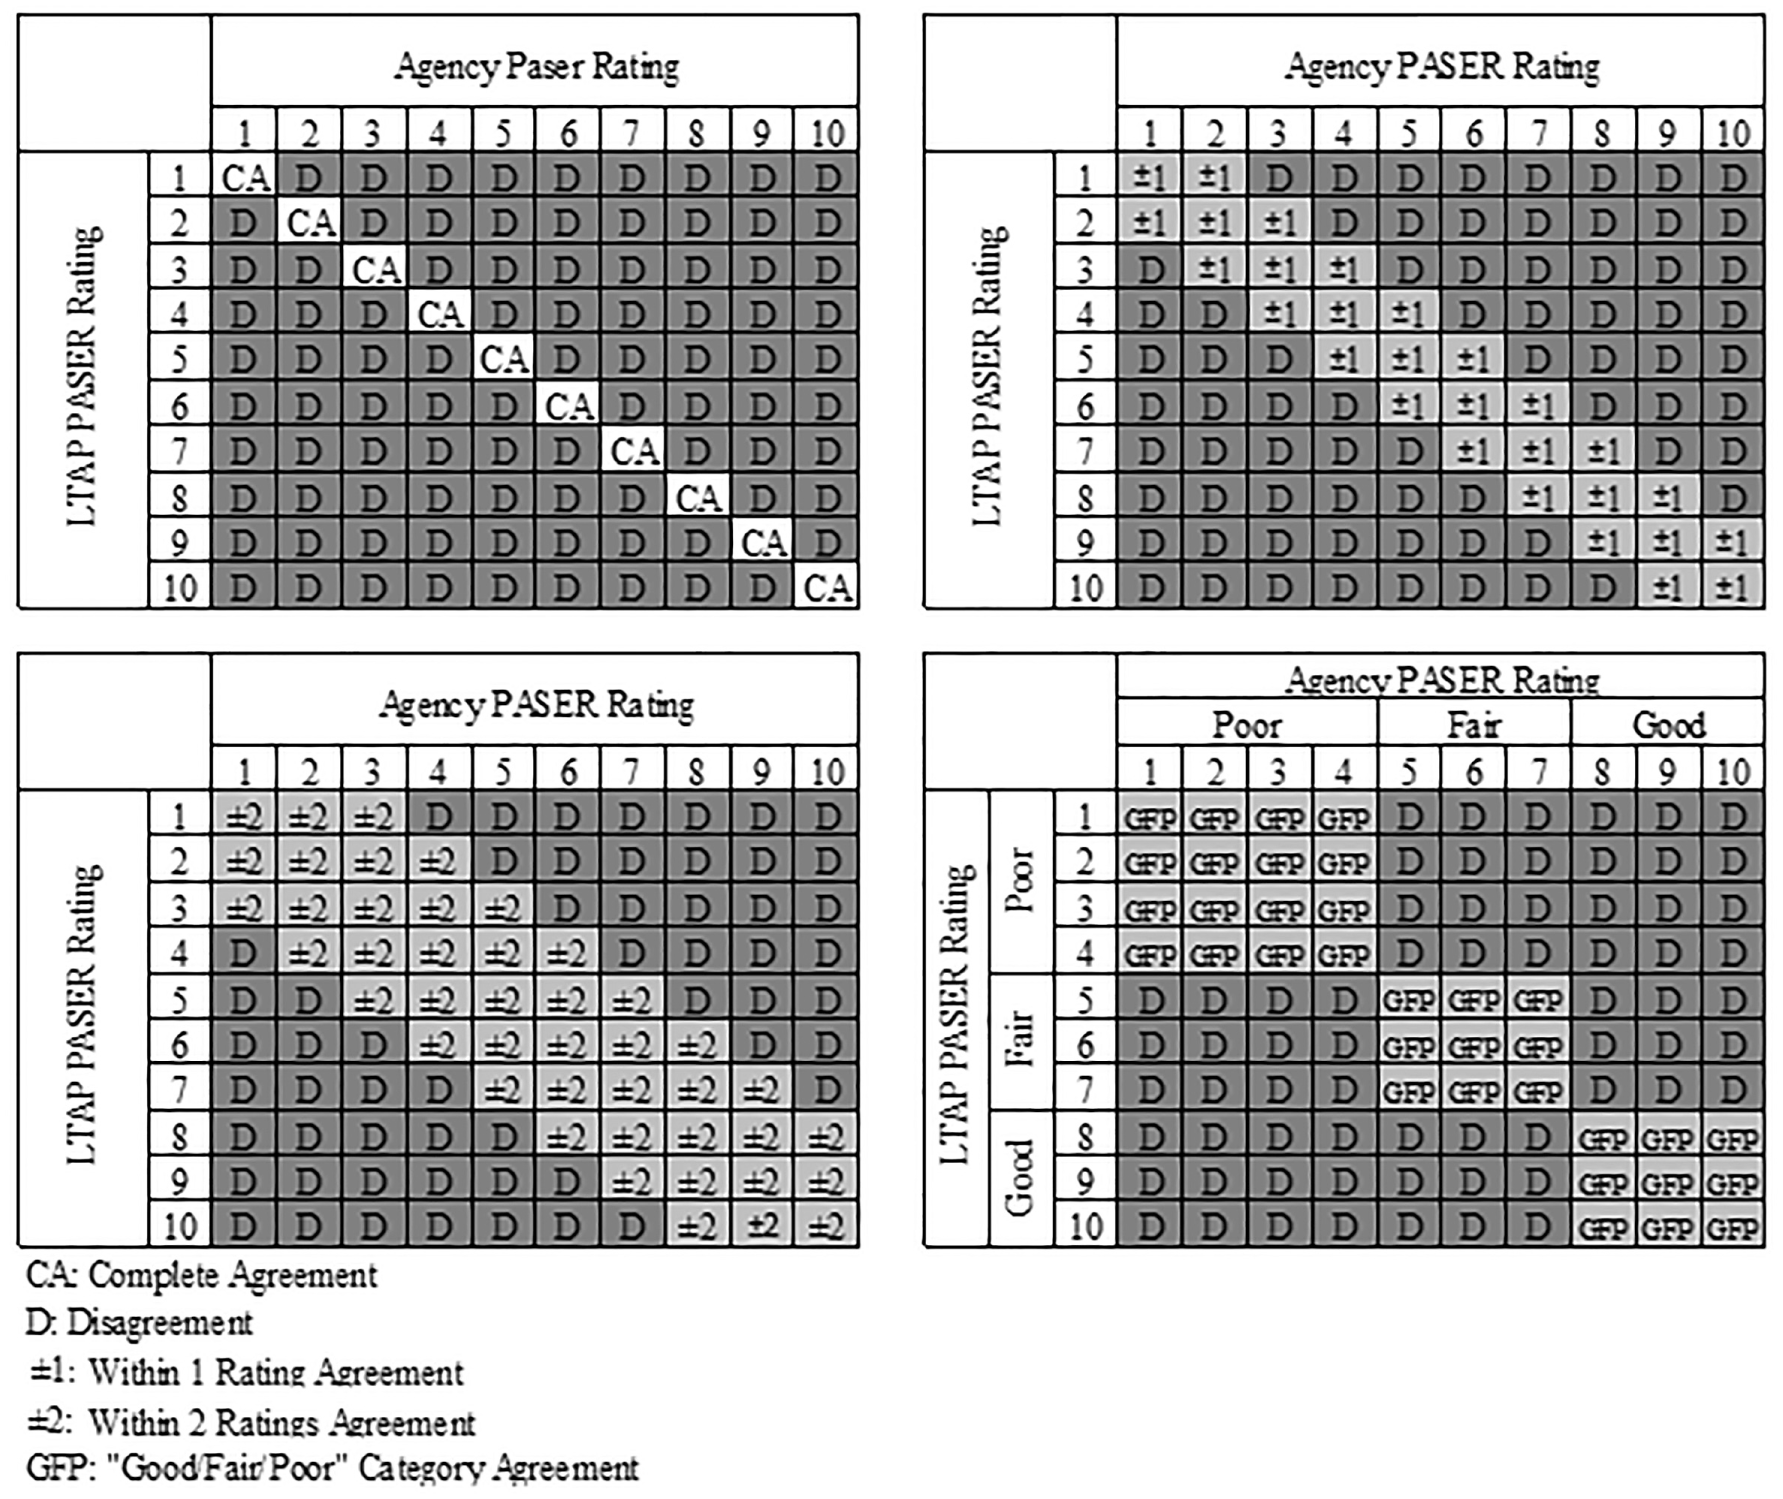
Rating agreement tolerances.
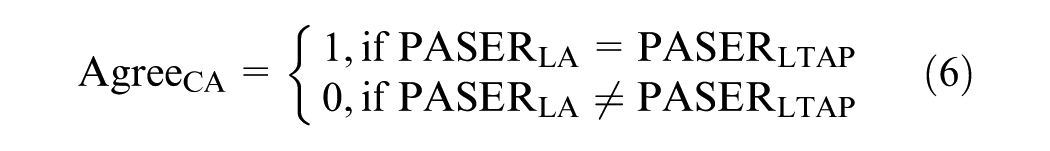
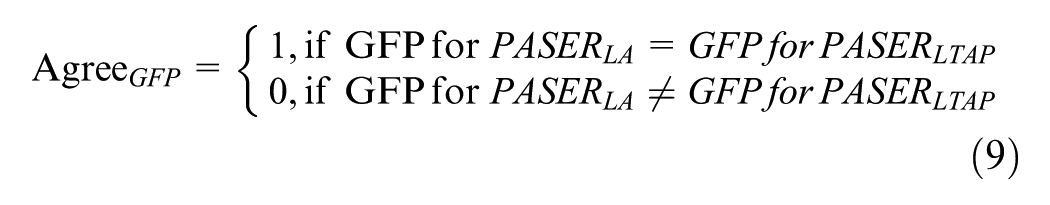
Agreement indicator variables for the four agreement tolerances were calculated for each segment according to Equations 6–9. For a given tolerance, a value of 1 indicates that the ratings were in agreement while a value of 0 indicates that the ratings were in disagreement:
where

where

where
where
other variables as previously defined.
Statistical Analysis
For each pavement segment the difference between the LTAP rating and the local agency rating was calculated and the frequency of the differences was determined. Using the previously calculated composite weights, the weighted local agency average ratings as well as the weighted standard errors and 95% confidence limits were calculated with respect to the LTAP ratings. These descriptive statistics were then compared with each of the four agreement tolerances.
Weighted Agreement Indices
Weighted agreement indices were calculated for each agreement tolerance according to Equation 10 as the combined weighted percentage of pavement segments satisfying a given agreement tolerance. These values represent the statewide pavement condition data collected by local agencies and were used to compare the different agreement tolerances overall. The 95% confidence limits were also calculated for each agreement index:
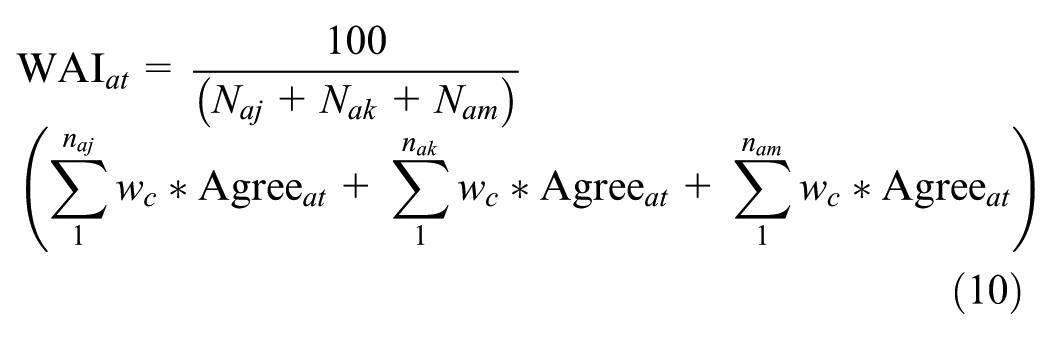
where
other variables as previously defined.
Two-Way Frequency and Cross-Tabulation
To better understand the areas of discrepancy, a two-way frequency and cross-tabulation table was prepared for the selected agreement tolerance representing the recommended quality control standard. This table compares local agency PASER ratings with LTAP PASER ratings in relation to observed frequencies, weighted agreement indices, and 95% confidence intervals.
Results
For seven of the 10 PASER values (PASER 2, 3, 6, 7, 8, 9, and 10), the predominant local agency rating aligned with the LTAP PASER rating. However, for the other three PASER values (PASER 1, 4, and 5), the predominant local agency rating was one PASER value higher than the LTAP PASER rating. The differences between the LTAP ratings and the local agency ratings are approximately normally distributed with an absolute average difference of 0.87 rating point and an absolute average standard deviation of 0.98.
The weighted average, standard error of the mean, and 95% confidence limits for the statewide dataset with respect to the LTAP ratings are listed in Table 1. For PASER values of 6 or less, the weighted average local agency ratings were greater than the LTAP ratings. For PASER values higher than 6, the weighted average agency ratings were closer to the LTAP ratings and, in most cases, just slightly below the LTAP ratings. Local agencies tend to overrate the middle-to-low PASER values (1–6) and slightly under-rate the upper PASER values (7–10). Since the costs associated with addressing structural failure (represented by low PASER values) are much higher than the costs associated with addressing functional failure (represented by higher PASER values) ( 18 ), this tendency for local agencies to overrate low PASER values means that budget, maintenance, and rehabilitation needs based on data collected by local agencies are likely underestimated and insufficient.
Basic Statistics for Statewide Dataset
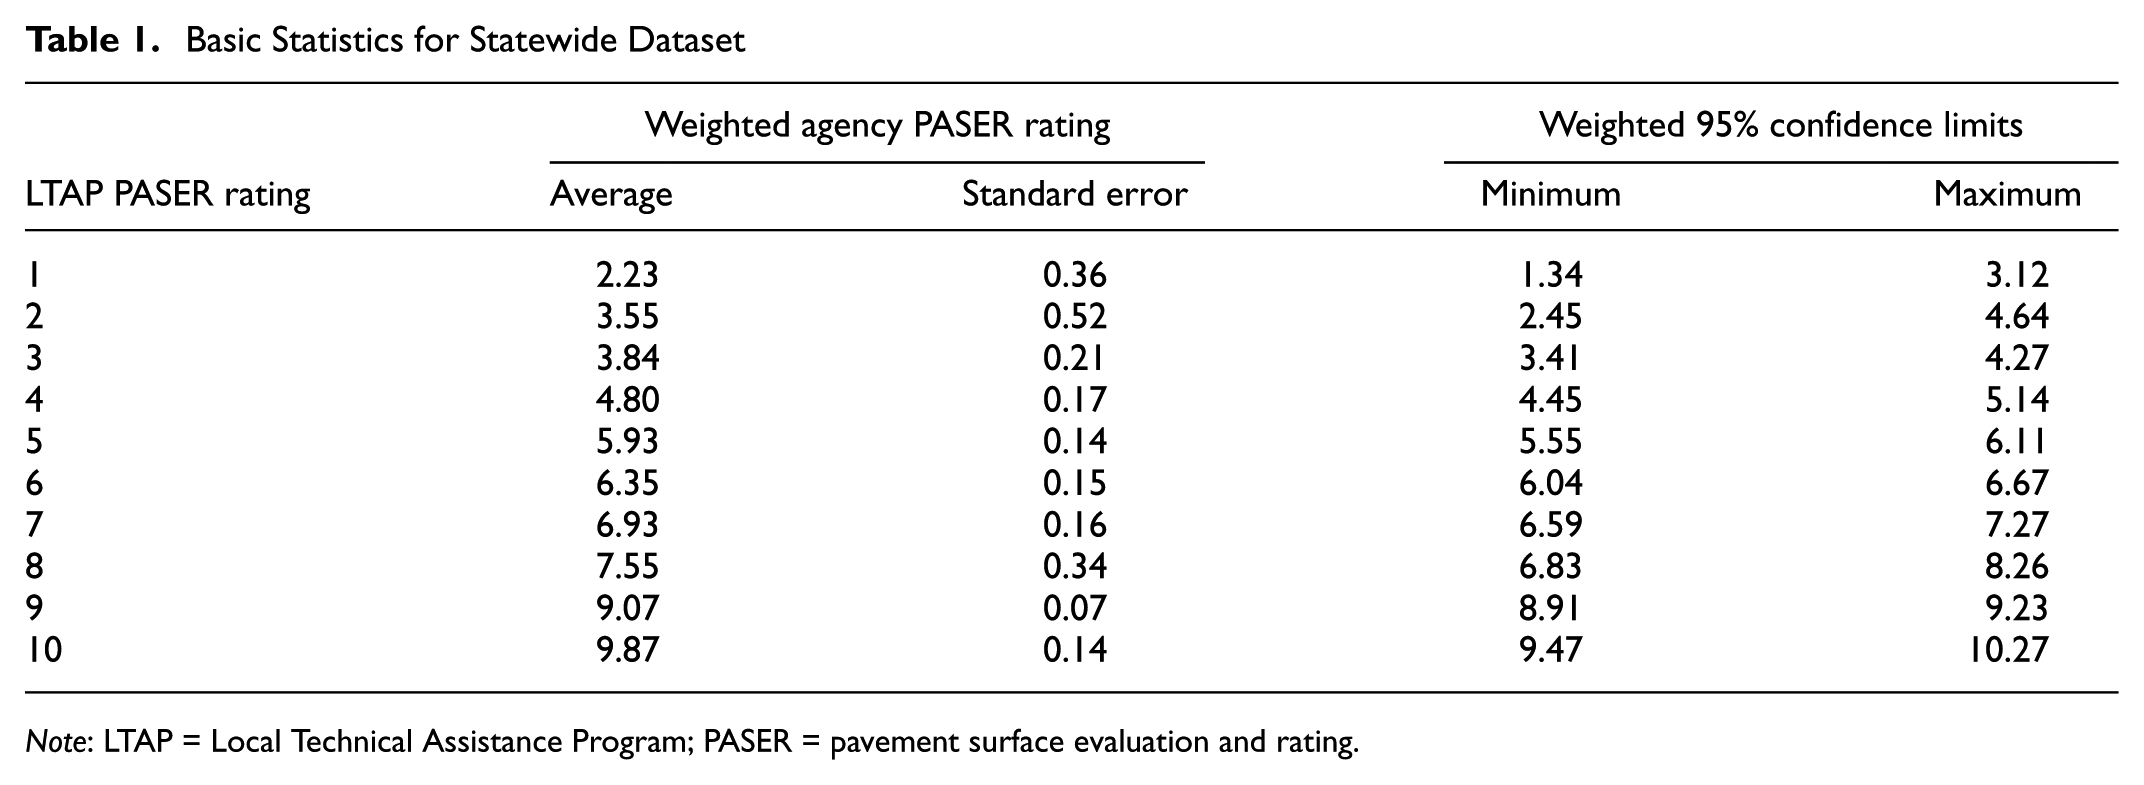
Note: LTAP = Local Technical Assistance Program; PASER = pavement surface evaluation and rating.
Figure 2a shows the weighted average local agency ratings and 95% confidence intervals, relative to the LTAP PASER ratings, compared with the complete agreement tolerance. The arrangement of the weighted averages and confidence intervals in relation to the dashed line representing the complete agreement standard indicate how acceptable each PASER value is according to this agreement standard. For the PASER values of 1–6, all of the local agency weighted averages as well as the 95% confidence intervals lie above the complete agreement standard. For the PASER values of 7, 8, and 10, the local agency weighted averages are below the complete agreement standard, but the 95% confidence intervals contain the complete agreement standard. Only the PASER value of 9 had a local agency weighted average above the complete agreement standard (but only slightly) with the 95% confidence interval containing the complete agreement standard. Considering that the majority of the local agency confidence intervals for the middle-to-low PASER values do not even contain the complete agreement standard, these PASER values were not adequately rated according to this agreement standard. However, for the high PASER values, the proximity of the local agency weighted averages to the complete agreement standard as well as the containment of the complete agreement standard by the confidence intervals indicates that these PASER values were adequately rated according to this agreement standard.
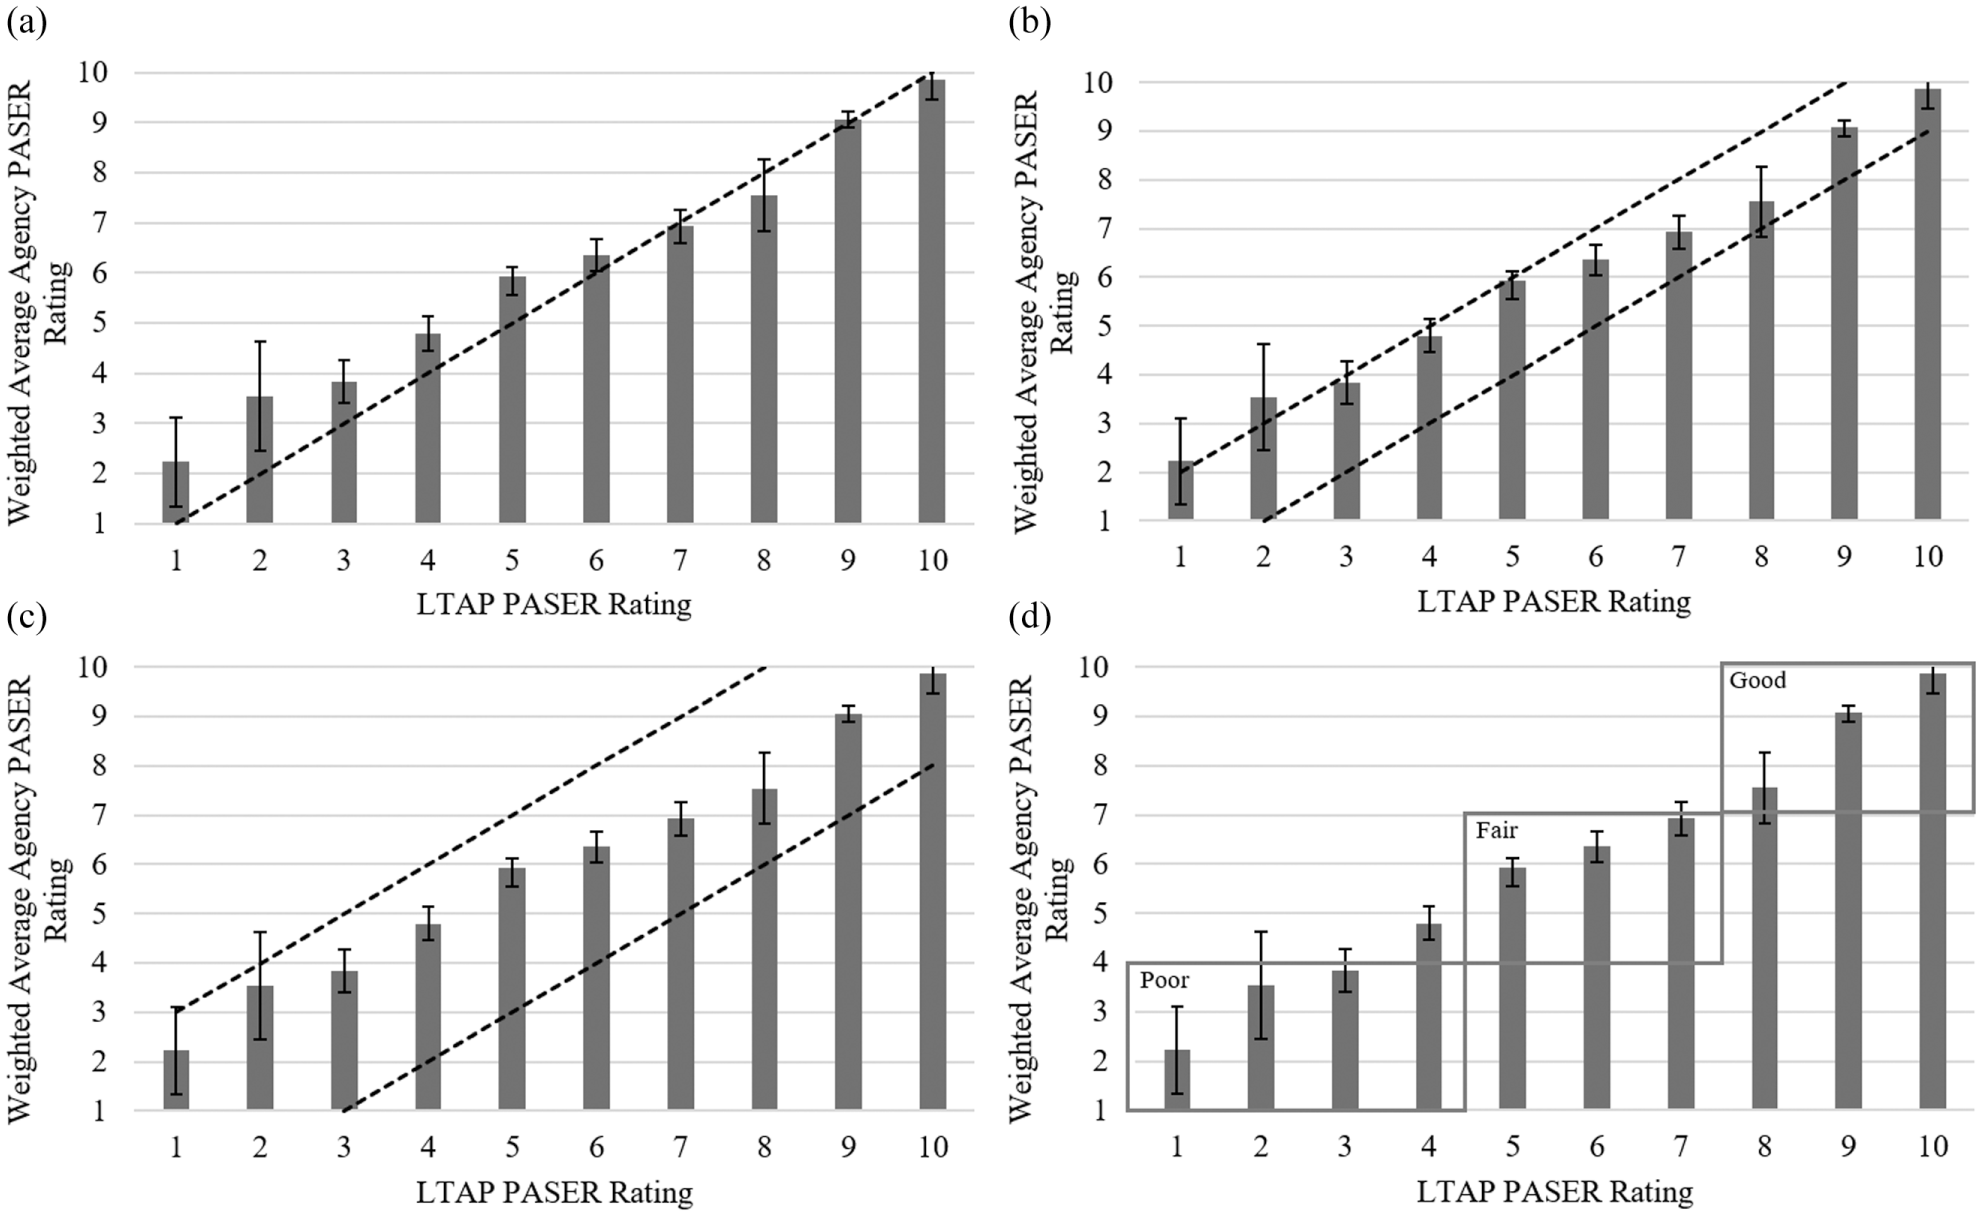
Weighted average agency ratings compared with (a) complete agreement, (b) within-1-rating agreement, (c) within-2-ratings agreement, and (d) “good/fair/poor” category agreement.
In contrast to the complete agreement tolerance, the other three agreement tolerances represent ranges of acceptability rather than exact agreement. Therefore, the arrangement of the local agency weighted averages and confidence intervals to the upper and lower tolerance bounds indicate which PASER values have high and low acceptability. Weighted averages and confidence limits falling within an agreement tolerance indicates a high level of acceptability between the local agency ratings and the LTAP ratings, while weighted averages and confidence limits falling outside agreement tolerances indicate a low level of acceptability.
Figure 2b shows the weighted average local agency ratings and 95% confidence intervals compared with the within-1-rating agreement tolerance represented by two dashed lines. For this agreement tolerance only the PASER values of 1 and 2 had local agency weighted averages not contained within the agreement tolerance. For the PASER values of 6, 7, 9, and 10, the complete confidence interval was contained within the agreement tolerance. For the PASER values of 1–5, the confidence intervals overlapped the upper bound, while for PASER 8 the confidence interval overlapped the lower bound. Considering that the local agency weighted averages for the PASER values of 1 and 2 were not contained within this agreement tolerance and that the confidence intervals were largely outside the agreement tolerance, these two PASER values were not adequately rated according to the within-1-rating tolerance of agreement. However, considering the containment of the local agency weighted averages and confidence intervals for the PASER values of 3–10, these values were adequately rated according to this agreement tolerance.
Figure 2c shows the weighted average local agency ratings and 95% confidence intervals compared with the within-2-ratings agreement tolerance represented by two dashed lines. The local agency weighted averages for all PASER values are contained within this agreement tolerance. Additionally, for all of the PASER values, except 1 and 2, the complete confidence interval was contained within the agreement tolerance. However, only a small portion of the confidence intervals for PASER 1 and 2 extended above the upper bound of this agreement tolerance. Therefore, all PASER values were rated adequately according to the within-2-ratings level of tolerance.
Figure 2d shows the weighted average agency ratings and 95% confidence intervals compared with the “good/fair/poor” category agreement tolerance represented by three boxes. All of the local agency weighted averages are contained within the appropriate “good/fair/poor” category, except for PASER 4. Additionally, this is the only PASER value where the entire confidence interval lies outside the appropriate “good/fair/poor” category. Though the local agency weighted averages for the PASER values of 2, 3, and 7, were contained within the appropriate “good/fair/poor” category, these confidence intervals overlapped the upper bounds of their respective categories. The confidence interval for the PASER value of 8 was the only one that extended below the lower bound of the appropriate “good/fair/poor” category. Overall, for this agreement tolerance, the good (8–10) and fair (5–7) PASER values were adequately rated while the poor PASER values (1–4), particularly PASER 4, were not.
A PASER value of 4 represents the first stage of structural deterioration. As evidenced by the unacceptable weighted average and confidence interval for PASER 4, it follows that structural distresses, particularly the first stage of structural distresses, are not often correctly identified by local agency raters. (The first stage of structural distresses includes longitudinal cracking in the wheel paths, <0.5 in. rutting, extensive block cracking, severe surface raveling, and slight crack erosion.) This lack of agreement and overrating of poor PASER values may simply be because these first signs of structural distress are difficult to identify. It may also be because local agency raters know that significantly higher funds are required to perform rehabilitation or reconstruction on poor roads than those required to perform preventive maintenance on fair roads. Knowing this, local agency raters may consciously or subconsciously overrate roads with structural distresses because the funds to address them may not be available.
Weighted Agreement Indices
Table 2 lists the weighted agreement index for each of the agreement tolerances, which represents the percent of statewide pavement segments rated by local agencies that satisfied a given agreement tolerance. Complete agreement has the lowest weighted agreement index with a value of 42.3%, meaning that 42.3% of the statewide PASER data collected by local agencies was accurate according to the complete agreement tolerance. Because this weighted agreement index is the lowest, it is evidently the most difficult standard of quality to satisfy. Since complete agreement is an exact tolerance, this finding is both intuitive and expected. “Good/fair/poor” category agreement had the next lowest weighted agreement index with a value of 73.3%, followed by within-1-rating agreement, which had a weighted agreement index of 80.0%. The highest weighted agreement index was the within-2-ratings agreement tolerance, which was 90.2%. This last statistic is comparable to the quality of PASER ratings reported by Michigan DOT for the last few years ( 5 , 6 ).
Estimation Results for General Linear Regression Model
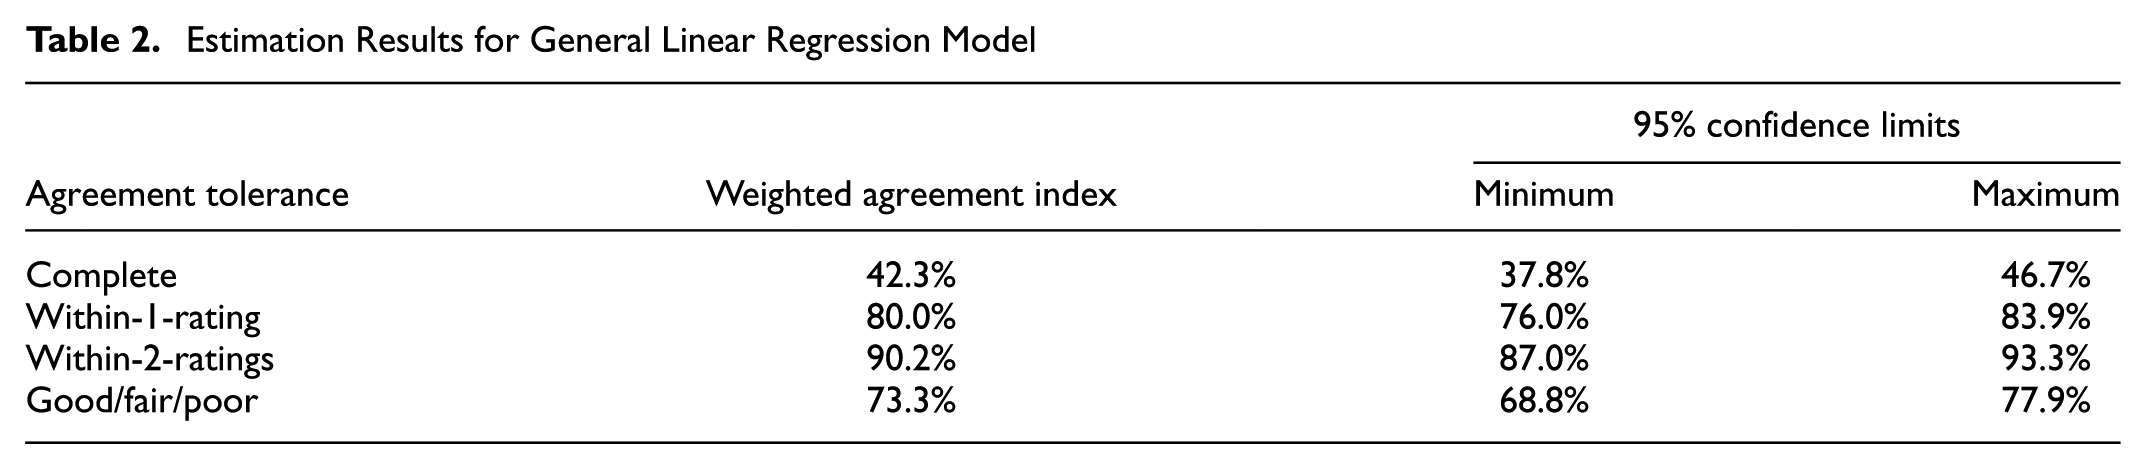
While complete agreement is ideal and represents the highest standard for rating quality it may not be practical or achievable at the local level. This is evidenced by the low weighted complete agreement index. Since The “good/fair/poor” category agreement is the most rigorous agreement tolerance next to complete agreement and because it has the potential to capture significant funding differences appropriate to each “good/fair/poor” category, this agreement tolerance is recommended for use as a statewide quality control standard.
Two-Way Frequency and Cross-Tabulation
Table 3 shows the two-way weighted frequencies and cross-tabulation for the selected quality control standard of “good/fair/poor” category agreement. This table breaks down the overall “good/fair/poor” category weighted agreement index of 73.3%, by comparing the local agency ratings with the LTAP ratings at the “good/fair/poor” category level. The weighted agreement percentages and confidence intervals are also presented visually in Figure 3.
Two-Way Weighted Frequency and Cross-Tabulation for “Good/Fair/Poor” Category Agreement
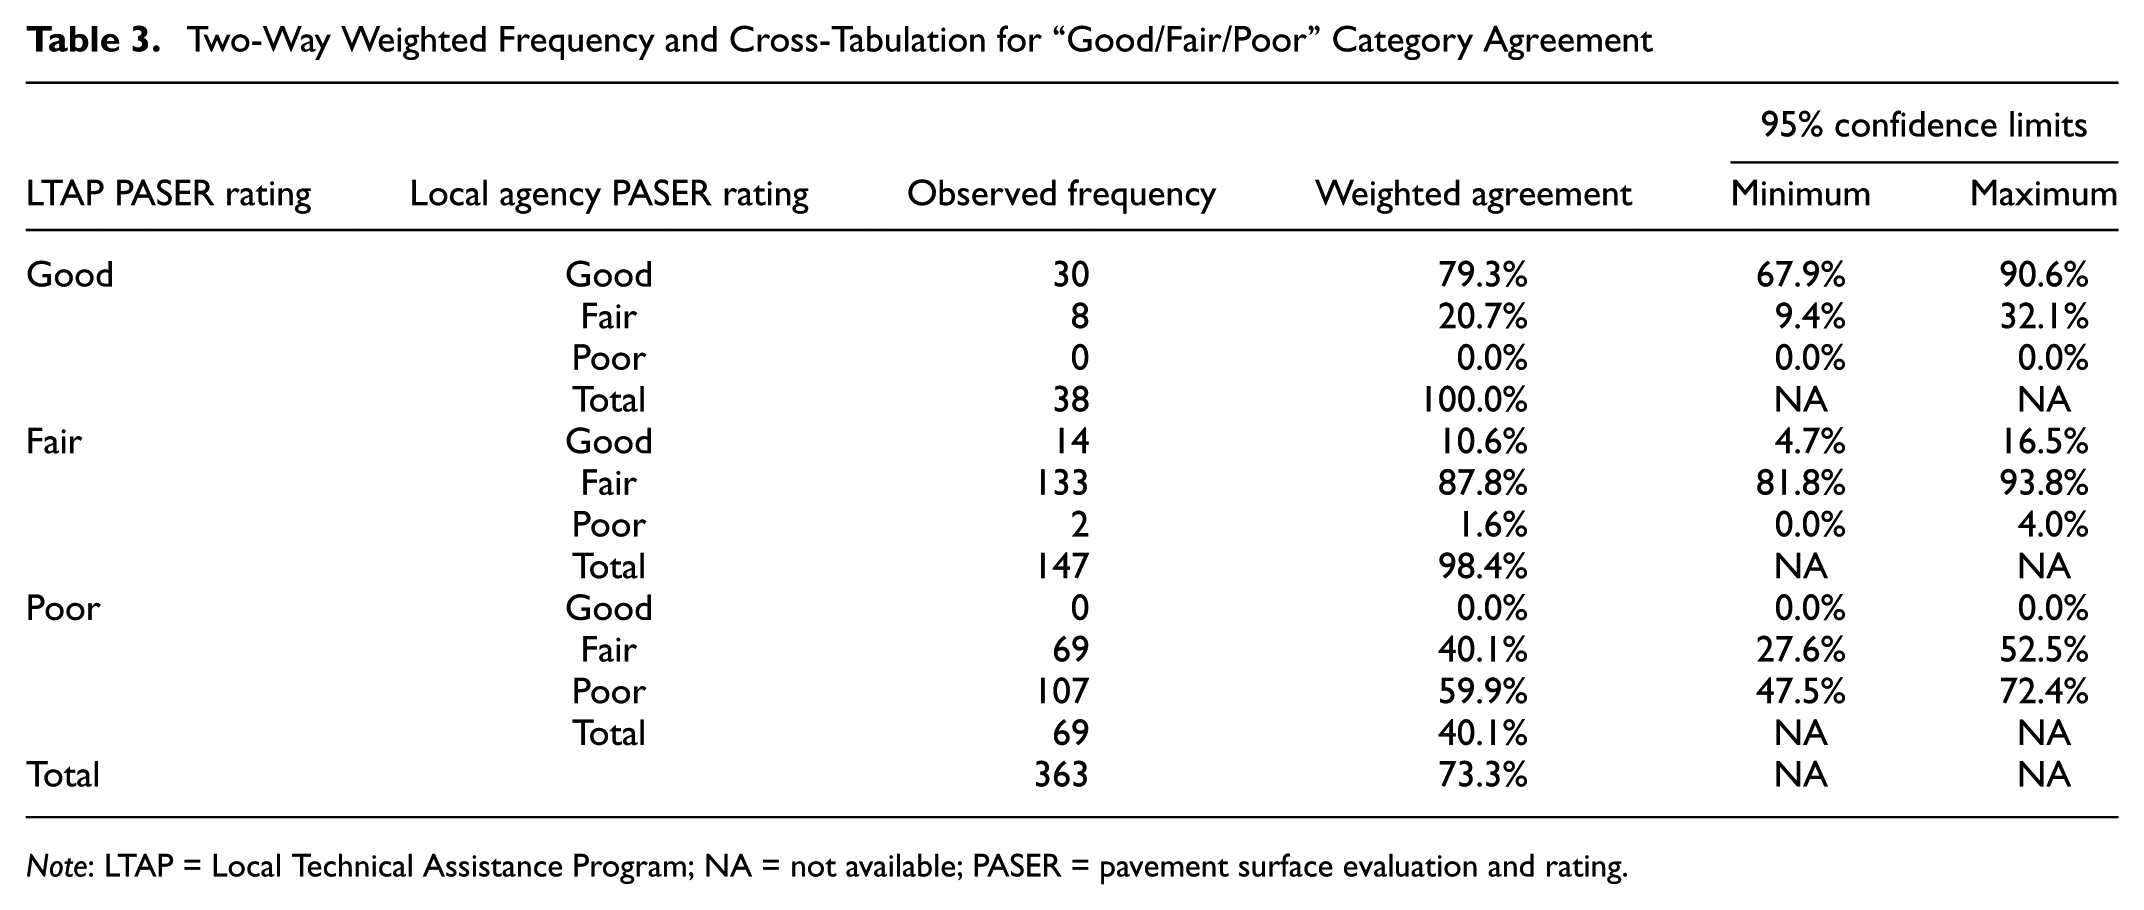
Note: LTAP = Local Technical Assistance Program; NA = not available; PASER = pavement surface evaluation and rating.
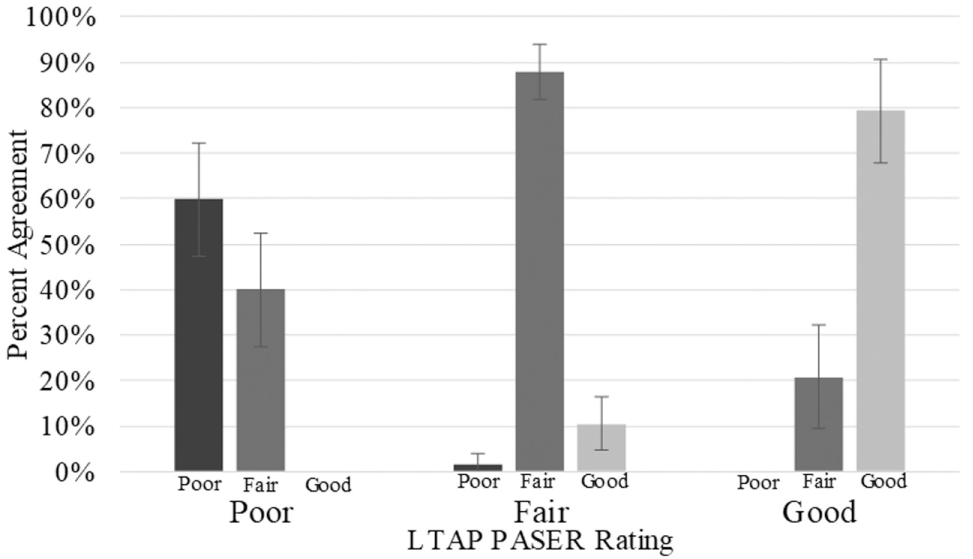
Local agency “good/fair/poor” agreement by category.
As shown, local agencies appropriately rated 79.3%, 87.8%, and 59.9% of pavement segments as good, fair, and poor, respectively. Pavement segments in fair condition were correctly classified most often and of those that were inappropriately classified, more were over-classified as good (10.6%) than under-classified as poor (1.6%). Pavement segments in poor condition were correctly classified least often with 40.1% of the segments inappropriately over-classified as fair. Of the pavement segments in good condition, 20.7% were under-classified as fair. Neither of the two extreme categories (good and poor) were misclassified as the other extreme.
Conclusions and Recommendations
During the data collection process for this research, it was discovered that some local agencies did not provide sufficient descriptive information for re-identification of some pavement segment start and end points. Additionally, the segment length was variable with a few agencies using very short segments or very long segments. This illustrates a need and recommendation for improved training and guidelines pertaining to the determination and recording of segment start and end points for the PASER condition assessment method.
In general, local agencies tend to overrate pavement segments when using the PASER method. More specifically, local agencies overrated the middle-to-low PASER values (1–6) but slightly under-rated the upper PASER values (7–10). This means that since the costs associated with addressing structural failure (represented by low PASER values) are much higher than the costs associated with addressing functional failure (represented by higher PASER values), budget needs based on data collected by local agencies are likely underestimated and insufficient.
Complete agreement was the most rigorous agreement tolerance with the lowest weighted agreement index. “Good/fair/poor” category agreement was the next most rigorous, followed by within-1-rating agreement. The highest weighted agreement index was within-2-ratings agreement. While complete agreement is ideal and represents the highest standard for rating quality it may not be practical or achievable at the local level as evidenced by the low weighted complete agreement index. Since the “good/fair/poor” category agreement: 1) was the most rigorous after complete agreement; and 2) has the potential to capture significant funding differences appropriate to each category, it is recommended for use as a statewide quality control standard.
With respect to the “good/fair/poor” category agreement, pavements in fair condition (PASER 5–7) were correctly classified most often. Of the fair pavements that were inappropriately classified, more were over-classified as good than under-classified as poor. Pavements in poor condition (PASER 1–4), particularly PASER 4, were correctly classified the least often. Since a PASER 4 represents the first stage of structural deterioration it follows that structural distresses are the most difficult to identify. With a knowledge of which PASER ratings are least accurately assigned, efforts should be taken to increase the accuracy of statewide PASER ratings performed by local agencies. Such efforts could include revising PASER guides and manuals to further clarify PASER values and improving PASER training workshops to address the process of rating difficult PASER values, particular PASER values 1–4.
This research is an important and practical addition to understanding the quality of and variability associated with visually estimated pavement condition assessments. It contributes a methodology for assessing statewide PASER data, including statistical sampling and data collection and analysis procedures, such that the results represent the statewide data in relation to weighted statistics. This research also provides a foundation for PASER rating quality control standards and state funding application requirements.
Although the assessment methodology presented here represents an improvement in statewide quality control assessment practices, additional research is recommended to improve, enhance, and validate the proposed quality control standard. This research compared agreement tolerances to determine which was the closest to complete agreement. Research comparing the agreement tolerances in relation to estimated treatment costs would add an important dimension to understanding which agreement tolerance provides the best treatment cost estimate. Consequently, a financial evaluation of the agreement tolerances is recommended for future research. Additional research identifying the weighted agreement index value at which each agreement tolerance is statistically indistinguishable from compete agreement would provide an appropriate threshold to aim for in relation to individual agency or statewide data quality.
Footnotes
Acknowledgements
The authors would like to acknowledge and thank the Indiana Local Technical Assistance Program for their cooperation in the data collection aspects of this research.
Author Contributions
The authors confirm contribution to the paper as follows: study conception and design: SRM, JEH; data collection: SRM; analysis and interpretation of results: SRM, JEH; draft manuscript preparation: SRM. Both authors reviewed the results and approved the final version of the manuscript.
The Standing Committee on Low-Volume Roads (AFB30) peer-reviewed this paper (19-06133).