
Abstract
The self-cleaning performance and mechanism of photocatalytic mortars with different cementitious materials and aggregates was evaluated through a rhodamine B (RhB) degradation test. The self-cleaning property of photocatalytic concrete helps to preserve its aesthetics, NOx removal potential, and surface reflectance. In this study, the addition of TiO2 to calcium sulfoaluminate-belite cement (CSAB) demonstrated a self-cleaning potential like ordinary Portland cement (OPC). Photocatalytic mortar mixes with OPC demonstrated increased self-cleaning efficiency with glass fine aggregate and with higher TiO2 content. However, glass addition was not effective in improving the self-cleaning efficiency of CSAB mortar with TiO2. Replacement of OPC with class F fly ash significantly decreased self-cleaning efficiency. The decrease in pore solution pH with fly ash replacement of OPC or CSAB cement instead of OPC was hypothesized as the cause for the decline in self-cleaning efficiency. An experiment to study the photocatalytic degradation rate of RhB revealed that it increased with higher pH. RhB photocatalytically degrades through N-de-ethylation and cleavage of the chromophore structure depending on the reaction surface characteristics with the first path investigated in this paper. It was shown that some of the RhB on the photocatalytic mortar surface was degraded by the N-de-ethylation path regardless of the cement and aggregate constituents and increasing TiO2 (anatase) content increased RhB degradation through N-de-ethylation.
Concrete with nano-TiO2 has air pollutant removal and self-cleaning properties ( 1 , 2 ). TiO2 particles release electrons in the presence of ultra-violet light which lead to oxidation of air pollutants such as NOx and SOx. The majority of NOx emission comes from the transportation sector, which makes the NOx concentration near major roads significantly higher than the average NOx concentration ( 3 , 4 ). Several researchers, particularly in Europe and Asia, have shown a significant decrease in NOx concentration by incorporating TiO2 into concrete ( 5 – 7 ). Likewise, others have shown that photocatalytic concrete pavements can lead to a reduction in the urban heat island effect because of its higher albedo ( 8 , 9 ). By combining NOx removal and heat island reduction benefits of photocatalytic concrete, use-phase sustainability can be improved and field implementation becomes more attractive ( 10 ). However, presence of dirt, dust, or organic pollutants on the concrete surface decreases the NOx removal efficiency because of the added competition from the organic pollutants to occupy the adsorption sites and the TiO2 reaction sites ( 11 , 12 ). Accumulation of dirt and debris on concrete also decreases the albedo of the concrete surface, potentially negating the reduction in the urban heat island ( 13 , 14 ). The self-cleaning property of photocatalytic concrete can help maintain a cleaner surface which preserves the higher albedo and NOx removal properties along with maintaining the aesthetics of the concrete structure.
A significant number of experimental works both in the lab and field environment have been performed to characterize self-cleaning of photocatalytic concrete ( 6 , 15 – 17 ). However, the effect of using alternative cementitious binders and mineral admixtures instead of ordinary Portland cement (OPC), on self-cleaning efficiency has not been studied. Calcium sulfoaluminate belite (CSAB) cement is one of the alternative cementitious binders that can have a higher rate of strength gain, lower shrinkage, and lower carbon footprint than OPC ( 18 – 20 ). In this paper, self-cleaning of photocatalytic mortar specimens with CSAB cement and partial replacement of cement with fly ash was studied along with control specimens containing OPC to understand the effect of these various binder combinations on self-cleaning efficiency.
Researchers have been studying photocatalytic concrete with various constituent materials to improve its performance. Chen and Poon have shown that clear glass aggregates can increase NOx removal efficiency by threefold because light transmitting through the glass aggregate activates more TiO2 particles ( 21 ). A few researchers have studied both NOx removal and the self-cleaning efficiency of mortar containing glass aggregate ( 22 – 24 ). Sikora et al. concluded by visual inspection that adding fine brown waste glass aggregate did not affect self-cleaning efficiency ( 22 ). Chen and Poon found that mortar containing clear glass aggregate is more effective for NOx removal than mortar containing brown glass aggregate, which had a similar NOx removal as mortar containing just sand ( 21 ).
Self-cleaning efficiency of mortar samples is generally evaluated through quantifying degradation of rhodamine B (RhB) dye. RhB dye is stable in the high alkalinity environment of cement and its chemical structure is related to the polycyclic aromatic hydrocarbons found in the soiling agents in the urban environment ( 15 ). Thus, RhB can be taken as a standard surrogate for the organic pollutants on a concrete surface. Pure nano-TiO2 in the presence of UV-A light can degrade RhB solution by two different paths: cleavage of chromophore structure and N-de-ethylation, as discussed in a previously published study ( 25 ). The preferred reaction path for RhB degradation depends on the reaction surface. Even though the mechanisms and reaction path behind the degradation of RhB through photocatalytic oxidation by pure nano-TiO2 is well-understood, the mechanism of RhB degradation by nano TiO2 present on mortar surface has not been adequately studied. A better understanding of the photocatalytic oxidation of RhB on mortar surfaces can help to design concrete with a better self-cleaning efficiency.
In this paper, mortar specimens containing OPC, CSAB cement, recycled (clear) glass fines, class F fly ash, and nano-TiO2 at different proportions are tested for their self-cleaning efficiency. The testing objectives for self-cleaning efficiency with nano-TiO2 are to quantify the effect of using CSAB cement instead of OPC, partial replacement of cement with fly ash, substituting sand with recycled glass fine aggregates, and increasing nano-TiO2 content. The reaction pathway and mechanism of RhB degradation for different mortar samples were also studied to explain the effect of different mortar constituents on self-cleaning efficiency.
Methodology
Materials and Specimens
Mortar specimens of 10 × 5 × 2 cm3 consisting of different combinations of CSAB cement, OPC, recycled (clear) fine glass, class F fly ash, and nano-TiO2 were cast and evaluated for their self-cleaning efficiency. According to the manufacturer, the nano-TiO2 powder had a specific surface area of 85.6 m2/g, a density of 3.78 gm/cc and 95% anatase content. The oxide composition of the glass aggregate, CSAB cement, OPC and class F fly were measured using an energy-dispersive x-ray fluorescence (EDXRF) analytical system in a helium environment that can detect elements with an atomic mass of sodium or higher.
OPC and CSAB cement were used in the self-cleaning experiment mortar specimens with 0%, 2.5%, and 5% of total cementitious binder replaced by nano-TiO2. Class F fly ash replaced 0%, 10% and 20% of the total cementitious binder and recycled glass aggregate of sizes between mesh no. 40 and 80 replaced 0%, 25%, 50%, 75% and 100% of the total fine aggregate content by mass. A water to cement ratio of 0.5 and paste volume fraction of 0.45 were maintained in all the mixtures. A summary of all mixtures tested are shown below (Table 1). All samples prepared for self-cleaning experiments were moist-cured in room temperature for seven days and then air dried for seven days in an indoor environment with relative humidity ranging from 50% to 60%.
Photocatalytic Mortar Mixtures and Testing Factorial
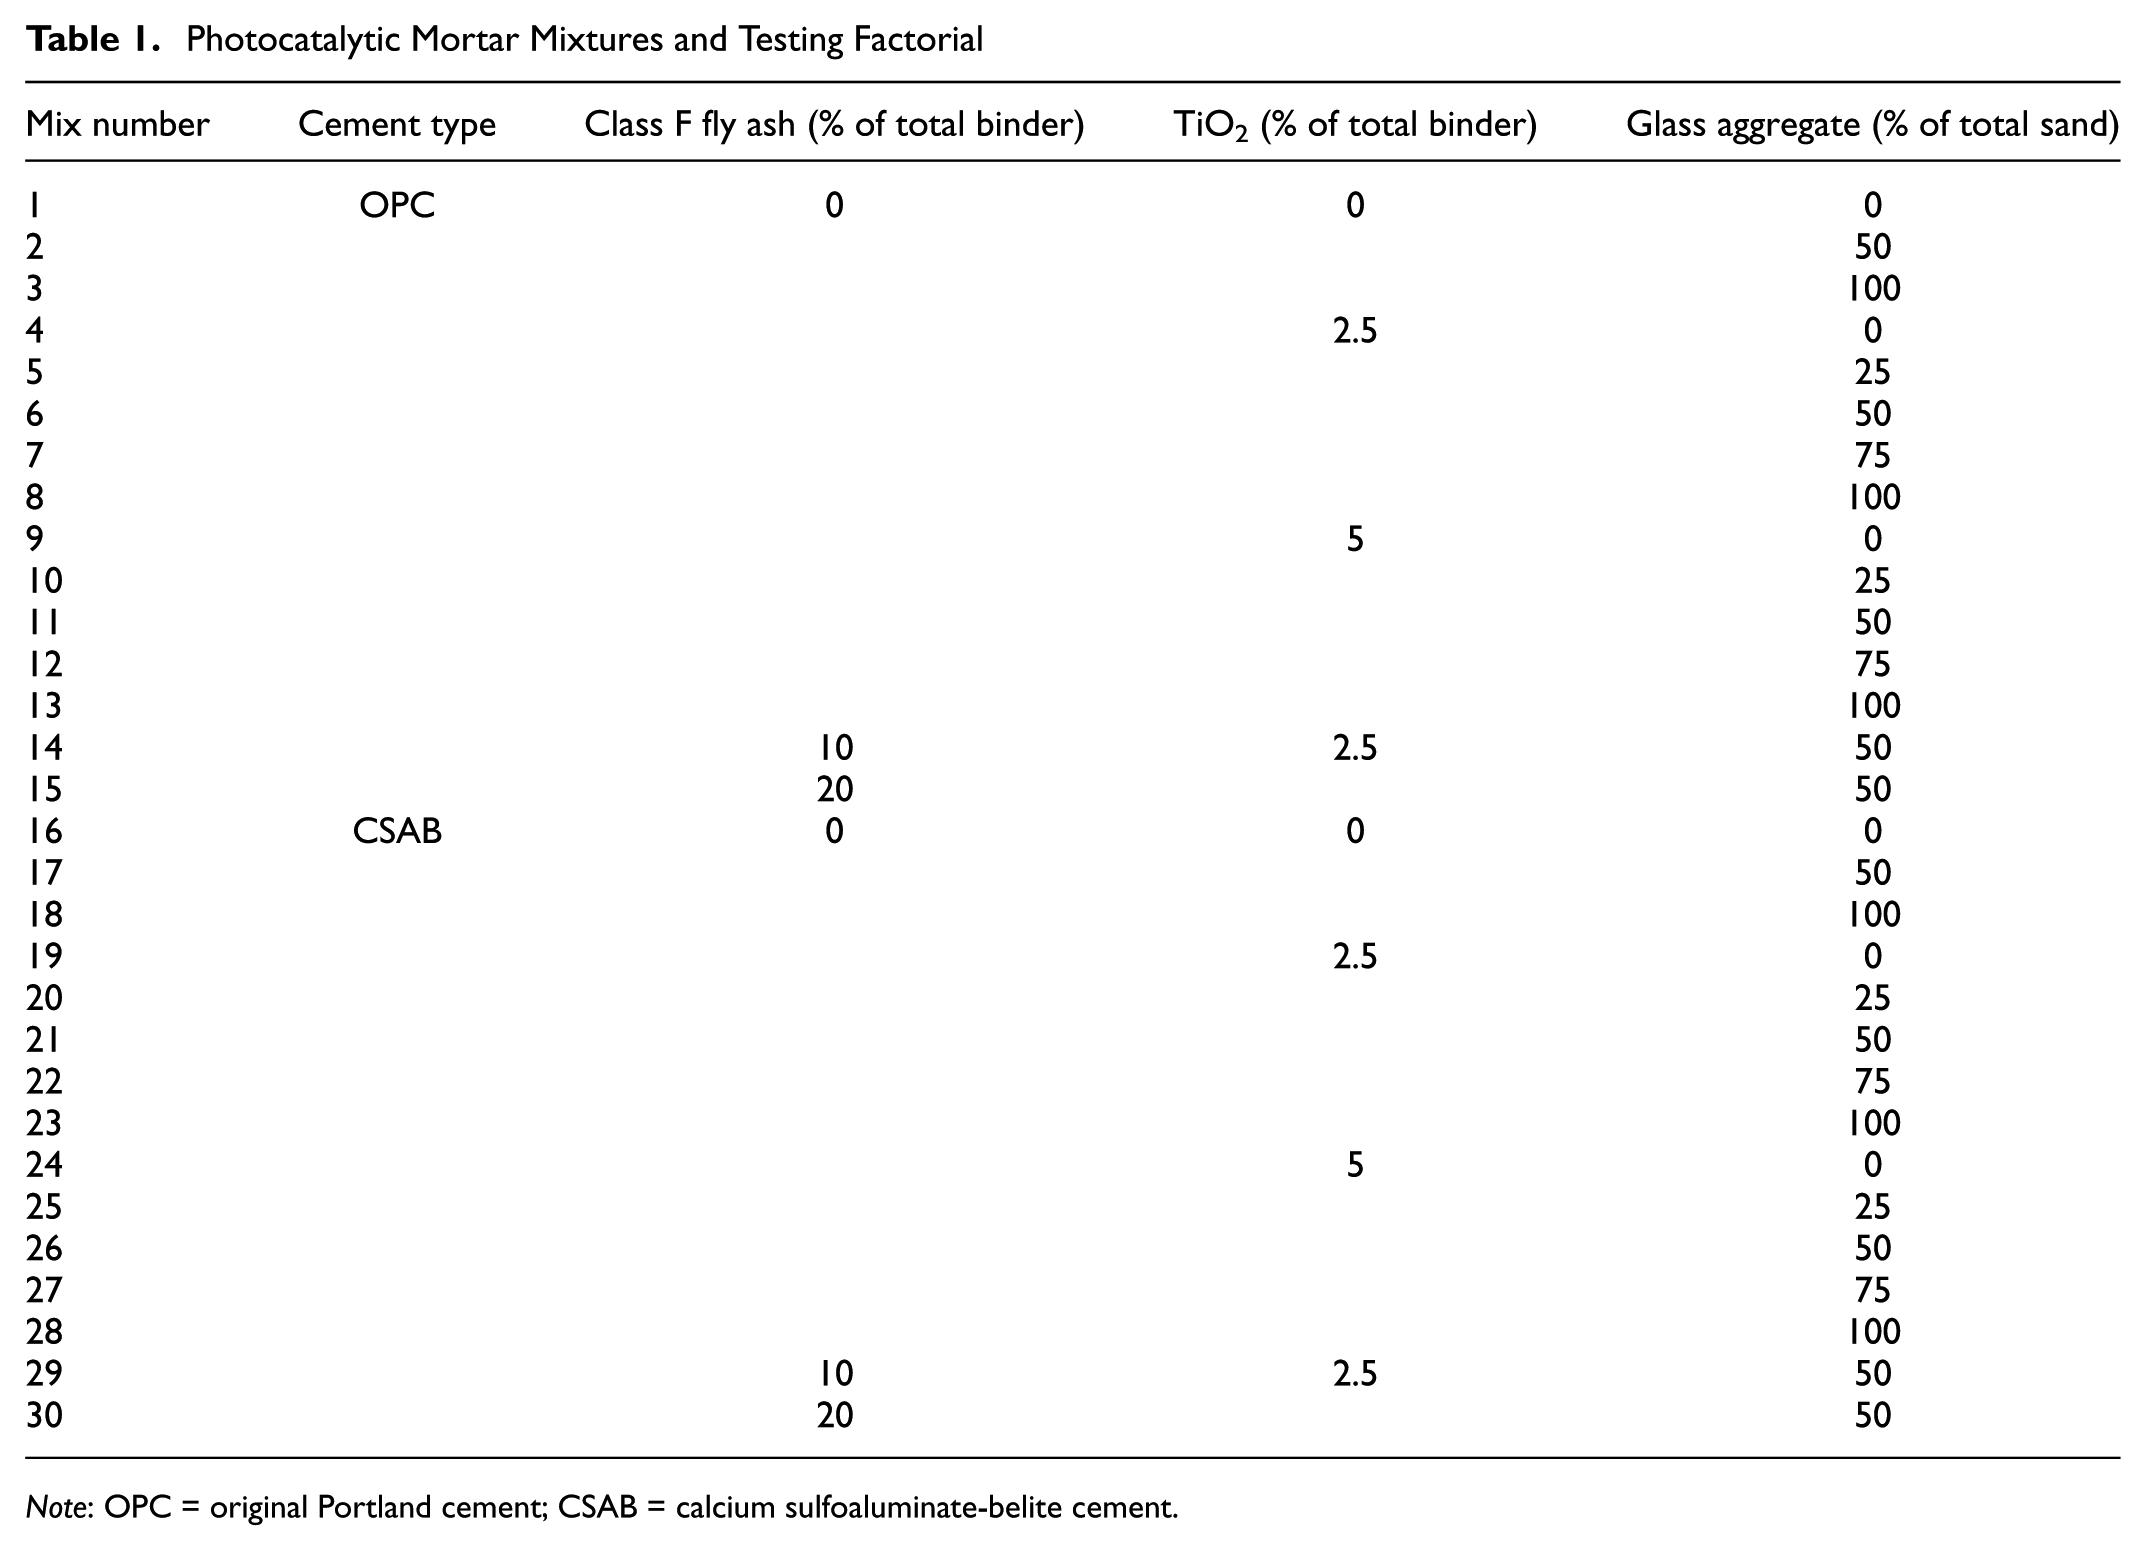
Note: OPC = original Portland cement; CSAB = calcium sulfoaluminate-belite cement.
Laboratory Test Method of Self-Cleaning Efficiency
Self-cleaning efficiency was measured as per Italian standard UNI 11259 with several modifications ( 26 ). In this method, a circular area on the sample is identified for the RhB dye with the remaining sample area coated with a hydrophobic liquid to ensure that RhB does not migrate outside of the marked area given the super-hydrophilic property of TiO2. Next, a 0.5 g/l solution of RhB is applied on the marked area to achieve an area density of 11.4 mg/m2. After the RhB solution dries, the sample’s color is measured in the CIEL*A*B* system using a Cary 5000 spectrophotometer ( 27 ). The sample is then kept in a black-box under UV-A light of intensity 3.75 W/m2 for 26 h. The energy distribution of the UV-A light used in this experiment is shown below (Figure 1). The sample’s color is again measured after 26 h of UV-A light exposure. The standard recommends using a sample size of 16 × 14 × 4 cm3 and applying RhB on a circular area of 22 cm2 on the mortar surface. Given the size constraint of the spectrophotometer, only a sample of size 10 × 5× 2 cm3 was used, and the RhB solution was applied uniformly on a circle with a 4 cm diameter.
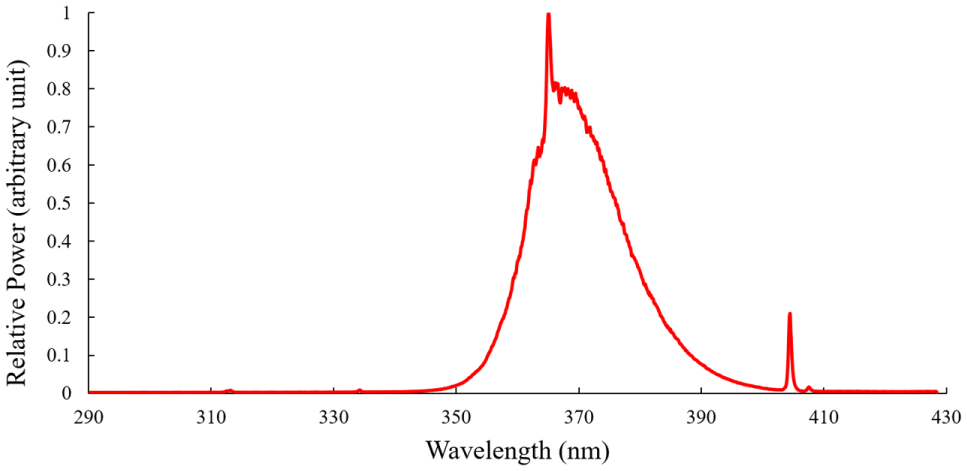
Spectra of UV-A light used for self-cleaning experiment.
A color is identified by three coordinates, L*, A*, and B* in the CIEL*A*B* color space (Figure 2). L* represents the brightness of the sample, a higher value representing greater brightness. As A* becomes more positive the color is redder, and a more negative A* becomes greener. Similarly, as B* becomes more positive, the color becomes more yellow, and as B* becomes more negative, the color is more blue. As RhB is red, the A* reading is considered to evaluate degradation of Rhodamine B. The A* value will decrease with Rhodamine B degradation. In this paper, the A* coordinate was calculated from the diffused reflectance versus wavelength data according to ASTM E308 ( 27 ). The self-cleaning efficiency of the samples is quantified by R26, which is the relative change in A* values after 26 h of exposure to UV-A radiation relative to the initial value:

A higher value of R26 implies greater RhB degradation and thus a better self-cleaning efficiency. UNI 11259 recommends R26 to be greater than 50. The self-cleaning experiment was performed on two sample replicates for each of the mortar mix designs and the average taken as the self-cleaning efficiency for a particular mix.
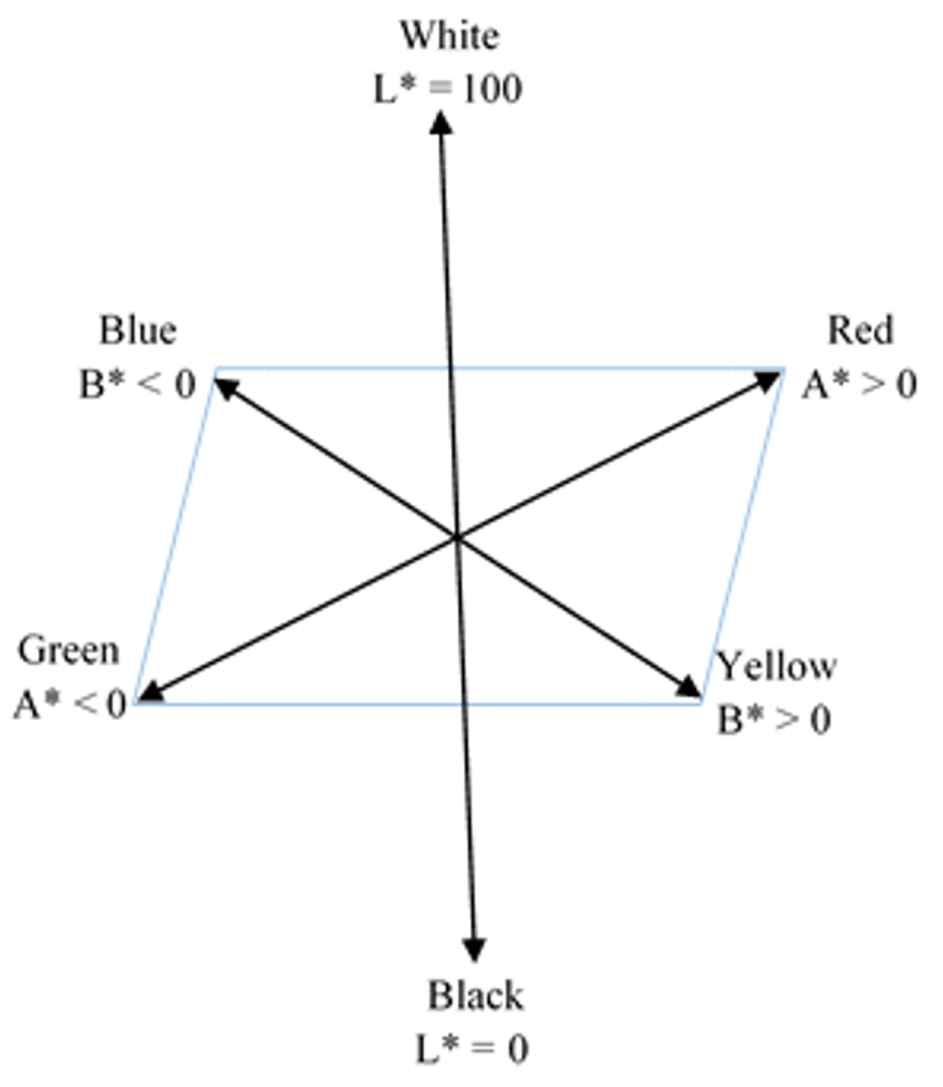
CIEL*A*B* color space.
Figures 3 and 4 show photographs of two different mixes with 0% and 5% TiO2 content, respectively, after 0 and 26 h of exposure to UV-A radiation. The sample without any TiO2 did not show any distinct color change after 26 h of UV-A exposure, but the sample with TiO2 had almost all the redness removed after 26 h because of the photocatalytic degradation of RhB. Therefore, samples with TiO2 can be expected to have a significantly high self-cleaning efficiecny compared to samples without any TiO2 content.
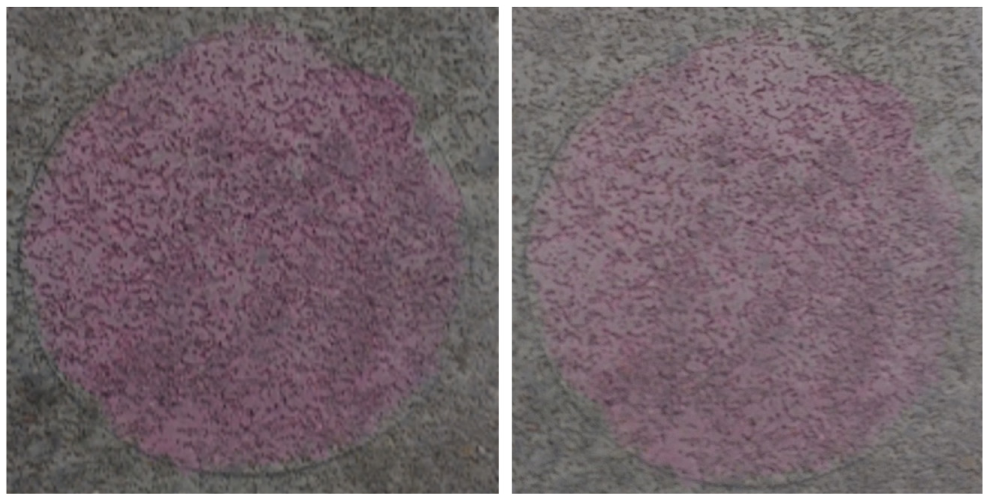
Photographs of OPC, 0% fly ash, 0% TiO2, 50% glass aggregate mix after 0 h (left) and 26 h (right) of UV-A exposure.
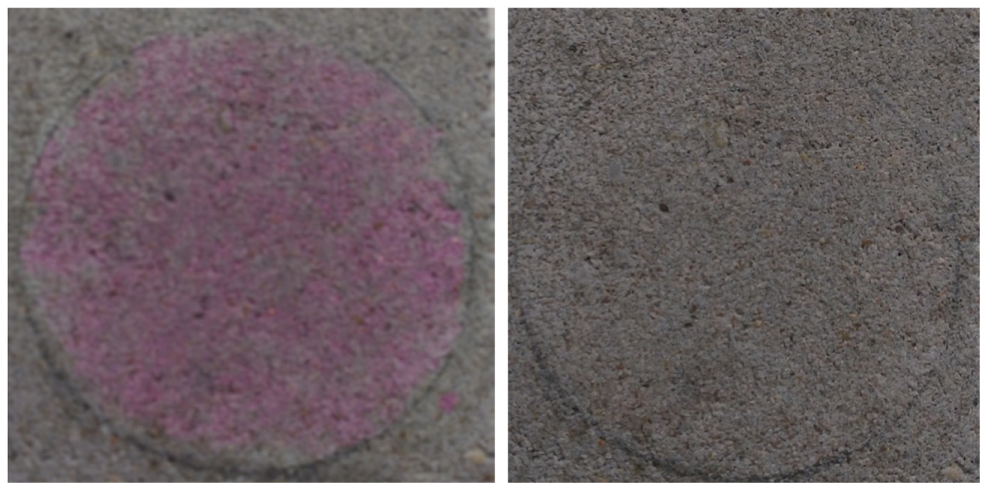
Photographs of OPC, 0% fly ash, 5% TiO2, 50% glass aggregate mix after 0 h (left) and 26 h (right) of UV-A exposure.
Reaction Pathway of RhB Degradation on Photocatalytic Mortar Surface
The change in redness is the main indictor of RhB degradation. There are two dominant reaction paths for RhB degradation: N-de-ethylation and cleavage of the chromophore structure. Both paths require the generation of a hydroxyl radical or a superoxide ion, that is, an active oxygen species ( 25 ). In the N-de-ethylation path, the hydroxyl radical attacks the ethyl group attached to the nitrogen atom of RhB and removes the ethyl groups attached to nitrogen in the following sequential process N,N,N′-tri-ethylated rhodamine, N,N′-di-ethylated rhodamine, N-ethylated rhodamine, and rhodamine ( 28 ). In the other path, the active oxygen species attack one of the aromatic rings in RhB causing cleavage of conjugated chromophore structure ( 29 ).
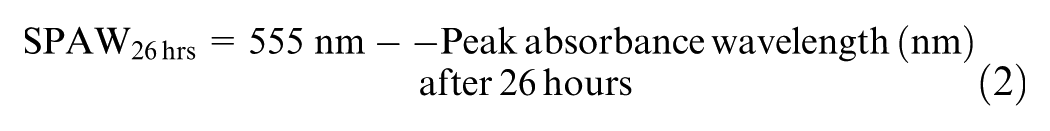
In this paper, the N-de-ethylation path is investigated in detail as it can be easily observed through the change in the peak absorbance wavelength. A solution of RhB in water has the highest absorbance at a wavelength (λmax) of 555 nm. The peak absorbance wavelengths of the compounds generated through N-de-ethylation of RhB are lower than RhB, and as a result, N-de-ethylation of RhB shifts the peak absorbance to lower wavelengths. The peak absorbance wavelength of N,N,N′-tri-ethylated rhodamine, N,N′-di-ethylated rhodamine, N-ethylated rhodamine, and rhodamine are 539, 522, 510, and 498 nm, respectively ( 28 ). As the compounds generated because of N-de-ethylation have a peak absorption wavelength between 556 and 497 nm, only this region of wavelengths was considered for a shift in peak absorbance wavelength (SPAW). SPAW26hrs is calculated using Equation 2 from the reflectance data after 26 h of exposure to UV-A radiation and is schematically shown in Figure 5.
In the self-cleaning experiment, a large positive SPAW26hrs indicates RhB degradation through the N-de-ethylation pathway, whereas a zero SPAW26hrs indicates N-de-ethylation of RhB has not taken place. As SPAW26hrs increases with the greater number of steps of N-de-ethylation, a higher SPAW26hrs indicates an increase in the N-de-ethylation.
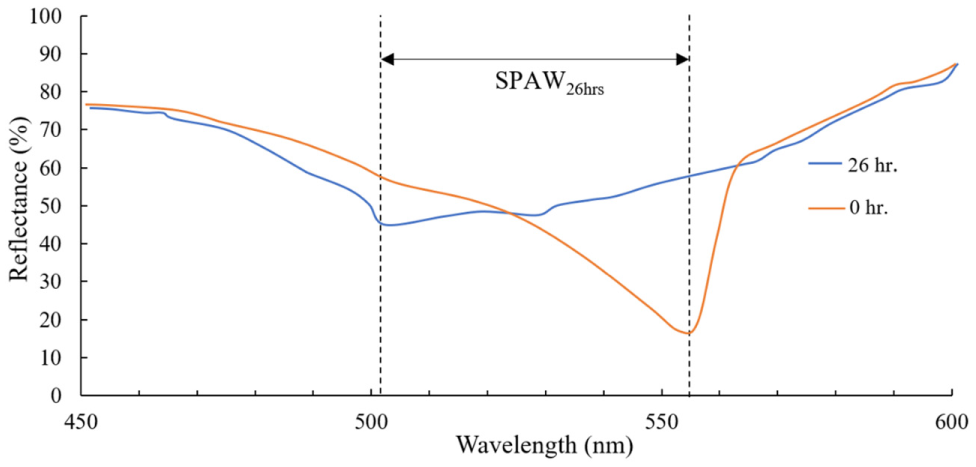
Schematic diagram of the shift in peak absorbance, SPAW26hrs.
Results and Discussion
Materials and Specimens
The oxide composition of the glass aggregate, CSAB cement, OPC and class F fly are given in Table 2. The combined amount of oxides of silicon, aluminum, and iron in the class F fly ash sample was 86.41%. The amount of aluminate and sulfate in the CSAB cement is considerably higher than that of OPC because of the high amount of yelimite and gypsum.
Oxide Composition of Mortar Constituents
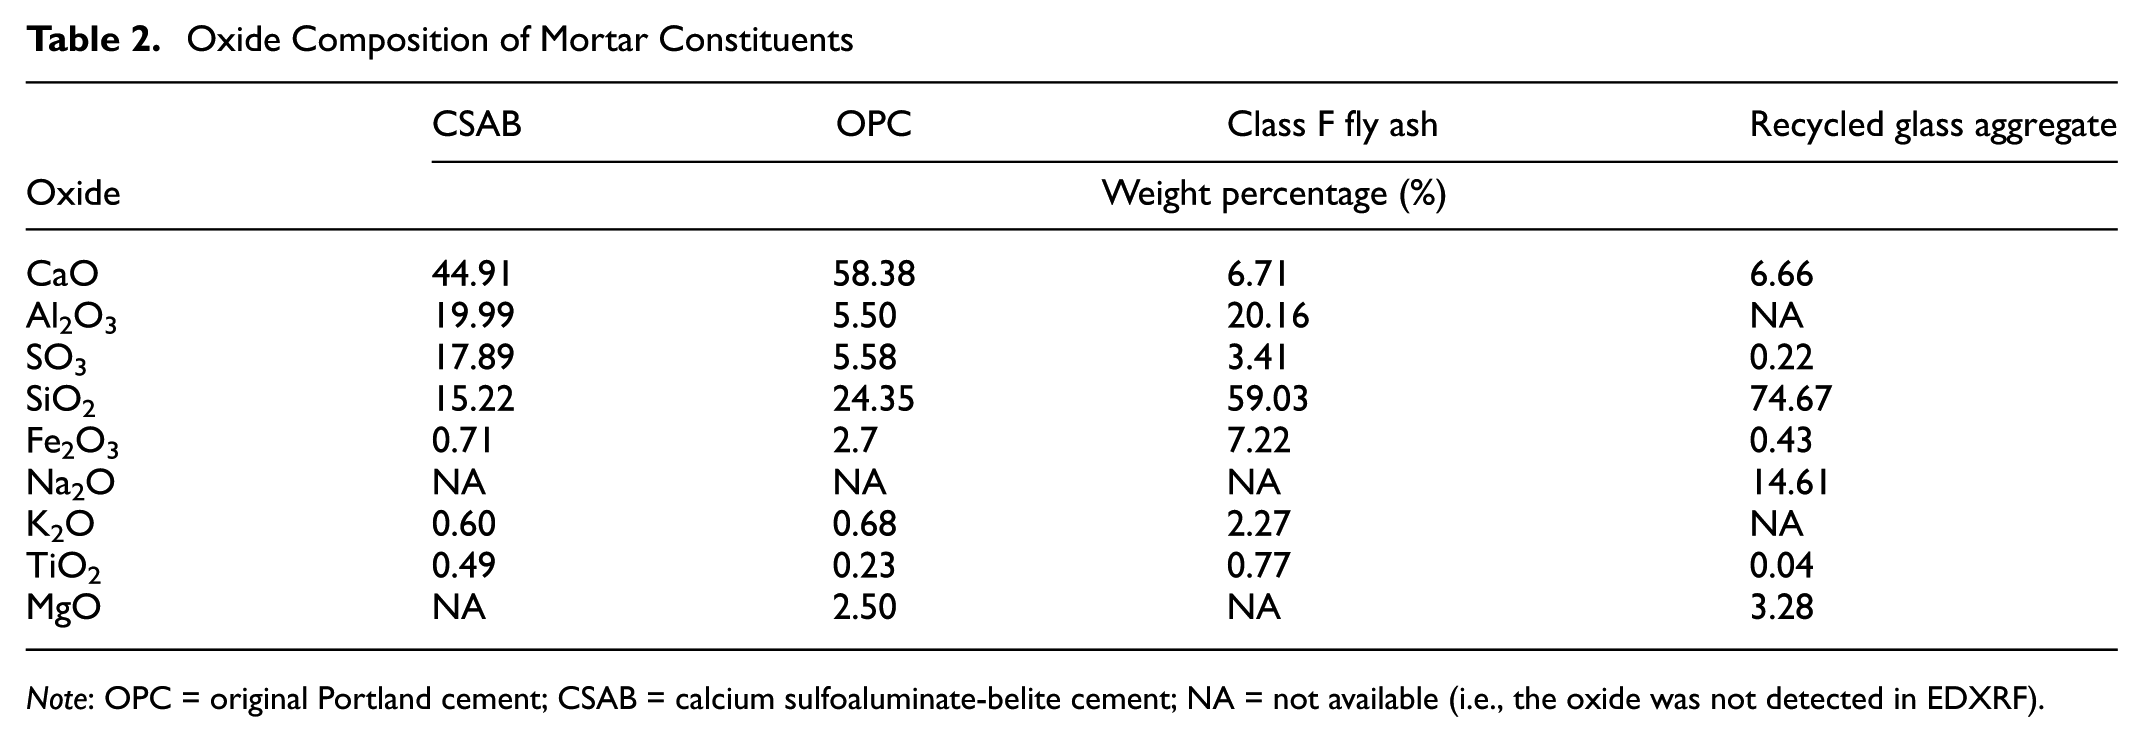
Note: OPC = original Portland cement; CSAB = calcium sulfoaluminate-belite cement; NA = not available (i.e., the oxide was not detected in EDXRF).
Self-Cleaning Efficiency Test Results
Reflectance Change
Figure 6, 7 and 8 show the typical reflection versus wavelength response of different mixes as RhB degrades over time. Figures 6, 7, and 8 represent samples with 5%, 2.5% and 0% TiO2 content, respectively. As RhB degrades, the surface reflectance increases over time because RhB absorbs less light. Right after applying the dye and before the sample exposure to UV-A light (0 h), the minimum reflectance wavelength was very close to the peak absorption wavelength of RhB (555 nm). The wavelength of the light for which reflectance is the lowest decreased as RhB degraded over time. Moreover, Figure 6 (OPC with TiO2) had the highest increase in reflectance at 555 nm after 26 h of UV-A exposure, followed by CSAB with TiO2 (Figure 7). The sample without any TiO2 showed a minimal change in reflectance with time (Figure 8). The magnitude of the self-cleaning efficiency of the samples follows the increase in reflectance with time.
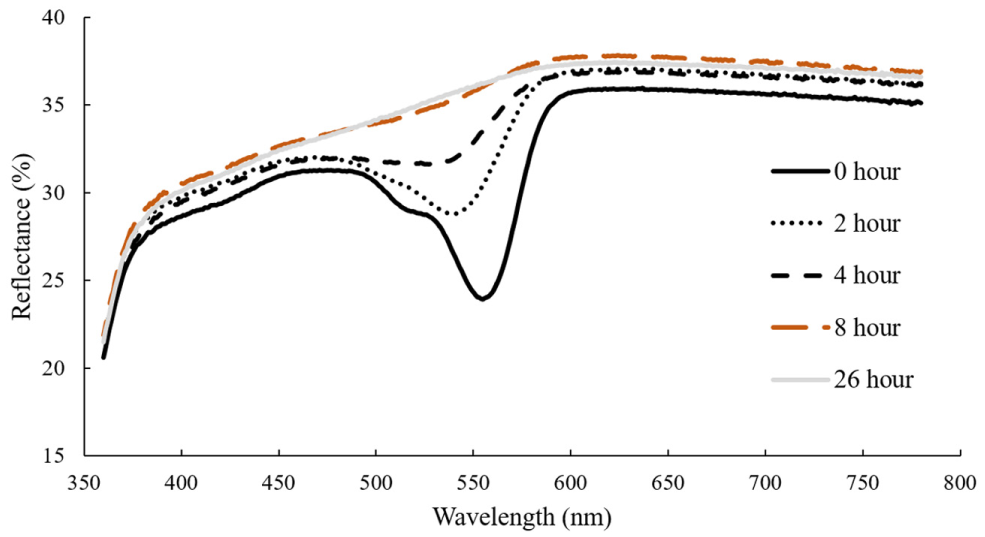
Reflectance versus wavelength spectra with UV-A exposure time for OPC mortar with 5% TiO2 and 50% glass aggregate replacement.
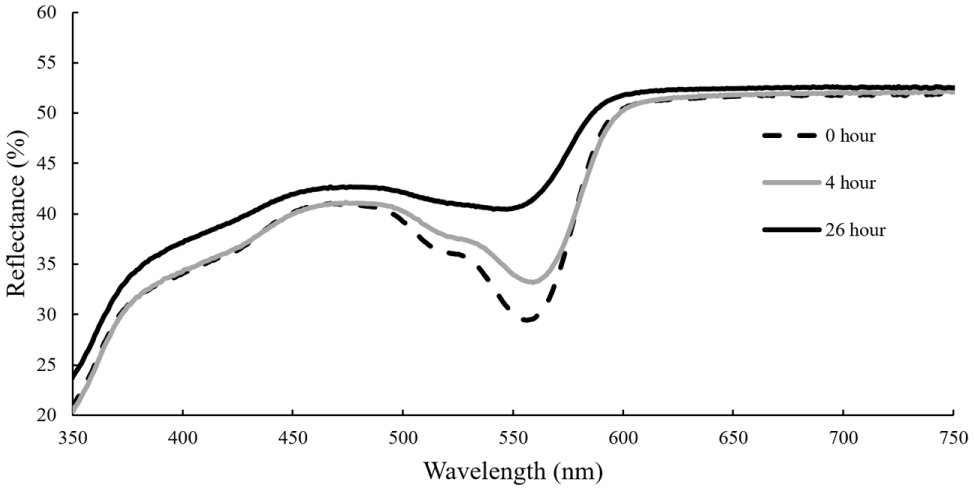
Reflectance versus wavelength spectra with UV-A exposure time for CSAB mortar with 2.5% TiO2 and 0% glass aggregate replacement.
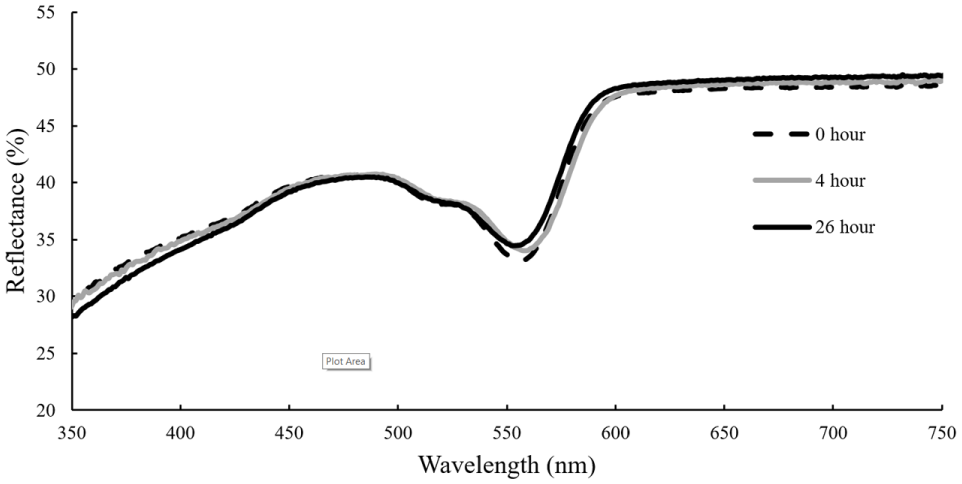
Reflectance versus wavelength spectra with UV-A exposure time for CSAB mortar with 0% TiO2 and 0% glass aggregate replacement.
Self-Cleaning Efficiency Test Result
For all of the specimens tested, Table 3 summarizes the self-cleaning efficiency and the shift in the lowest reflectance wavelength. As expected, the specimens without TiO2 had very low R26 compared to those with TiO2. Even samples without TiO2 had some level of self-cleaning efficiency because RhB degrades very slowly through the self-excitation method (30). In general, TiO2 samples with significant self-cleaning efficiency also had a major shift in SPAW26hr, which indicates some of the RhB was degraded through N-de-ethylation. One mix (OPC, 0% fly ash, 0% TiO2, and 50% glass aggregate) had a negative SPAW26hr and had a very low photocatalytic efficiency and thus, negative SPAW26hr is attributed to slight inaccuracies in the measurement of the spectral reflectance.
Self-cleaning Test Results of OPC and CSAB Mortar
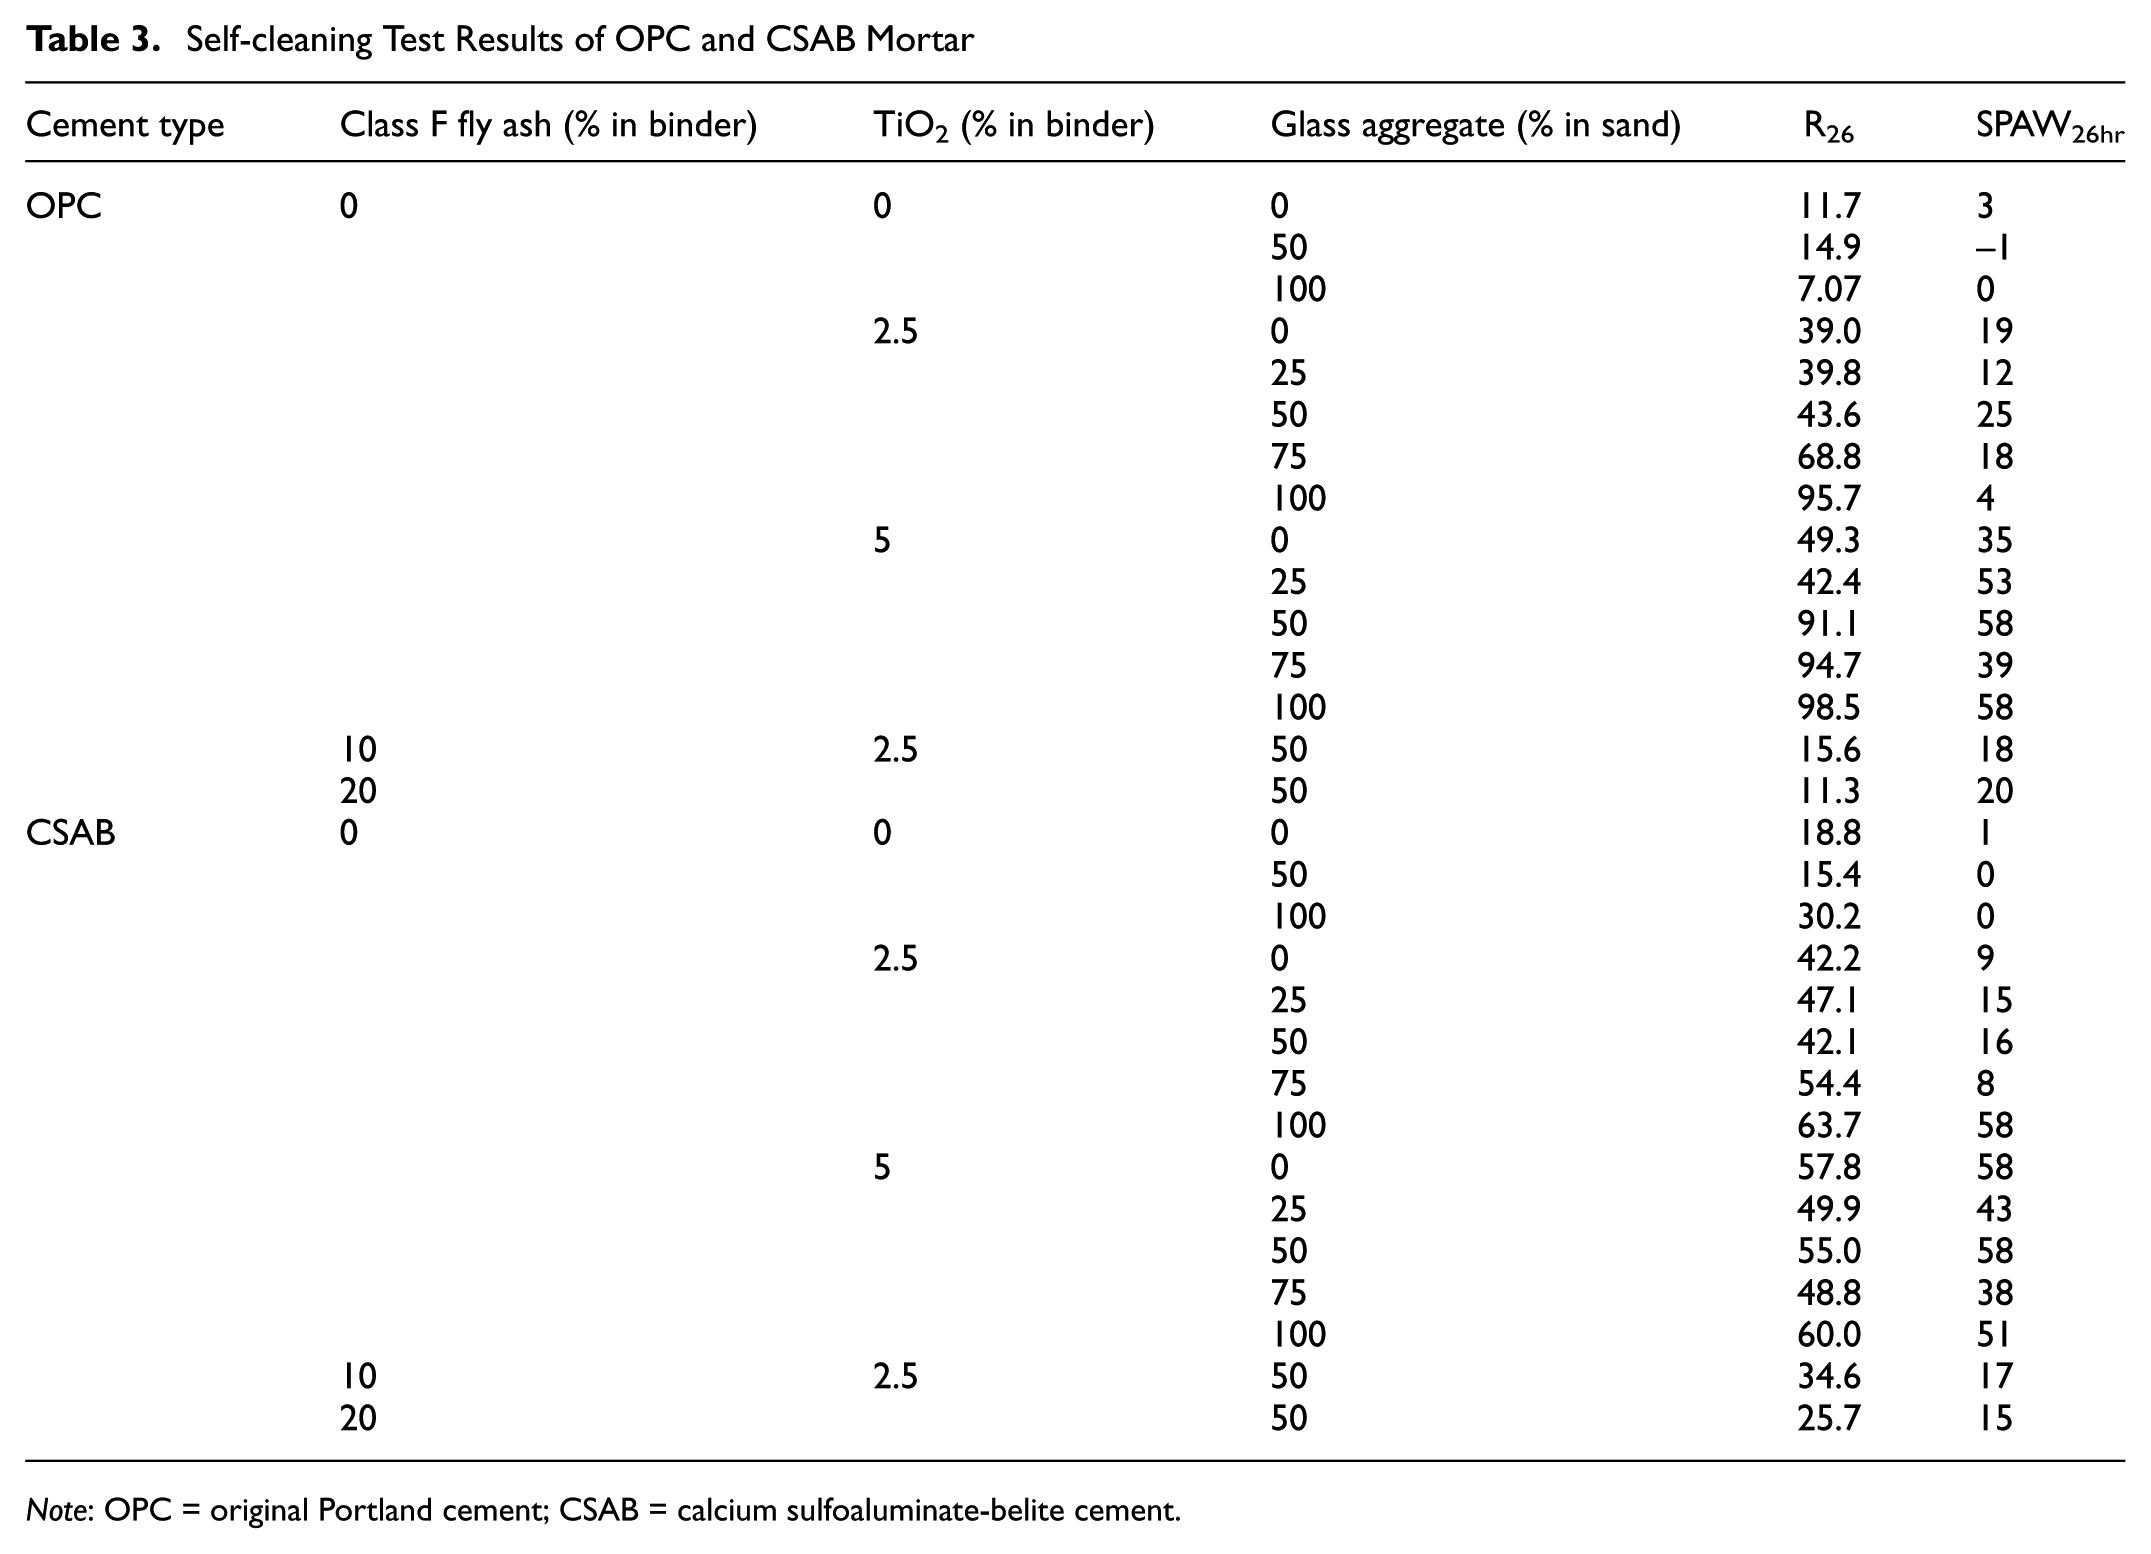
Note: OPC = original Portland cement; CSAB = calcium sulfoaluminate-belite cement.
Effect of Mortar Constituents on Self-Cleaning Efficiency
Effect of Glass Aggregates on Self-Cleaning Efficiency
Replacing sand with glass fine aggregate increased the self-cleaning efficiency tremendously for the OPC samples. However, the increase in self-cleaning efficiency by glass aggregate addition was not effective for CSAB samples as compared with OPC samples (Figure 9). According to Chen and Poon, replacement of sand with glass aggregates in mortar increased photoactivity because light can transmit through the glass aggregates and activate TiO2 molecules that are not directly on the surface of the specimen (21). The R26 value did not increase with addition of glass aggregates for the CSAB specimens despite the increase in activated TiO2 molecules. However, in OPC specimens, higher amounts of glass aggregates increased activation of TiO2 molecules and improved the RhB degradation. A lower pore solution pH of CSAB cement is one of the limiting factors to further increasing the self-cleaning efficiency, as discussed in detail in the next section.
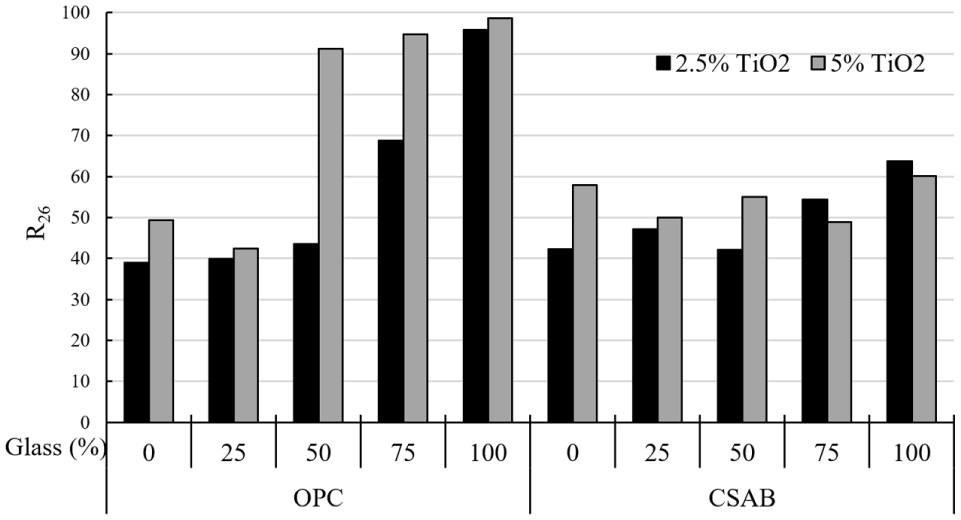
Effect of glass aggregate and TiO2 content on self-cleaning efficiency (R26) for OPC and CSAB cements.
Effect of TiO2 Content
All samples and mixtures demonstrated some self-cleaning efficiency in the presence of UV-A light even in the absence of TiO2 (0%), as seen in Table 3. In general, increasing TiO2 content from 2.5% to 5% in OPC mixtures increased the self-cleaning efficiency, but this trend was not seen in the CSAB samples (Figure 9). As with the addition of glass aggregates, an increase in TiO2 content is expected to increase the amount of activated TiO2 in OPC, but for CSAB samples this increase in the activated TiO2 did not significantly increase RhB degradation. Similarly to that discussed above, a lower pore solution pH decreases the potential for greater degradation of RhB degradation in the CSAB samples.
Effect of Fly Ash on Self-Cleaning Efficiency
Replacing cement with class F fly ash had an adverse effect on the self-cleaning efficiency for both CSAB and OPC samples (Figure 10). The self-cleaning efficiency decreased drastically with an increase in class F fly ash replacement again indicating that pore solution pH may play a role in the greater self-cleaning efficiency.
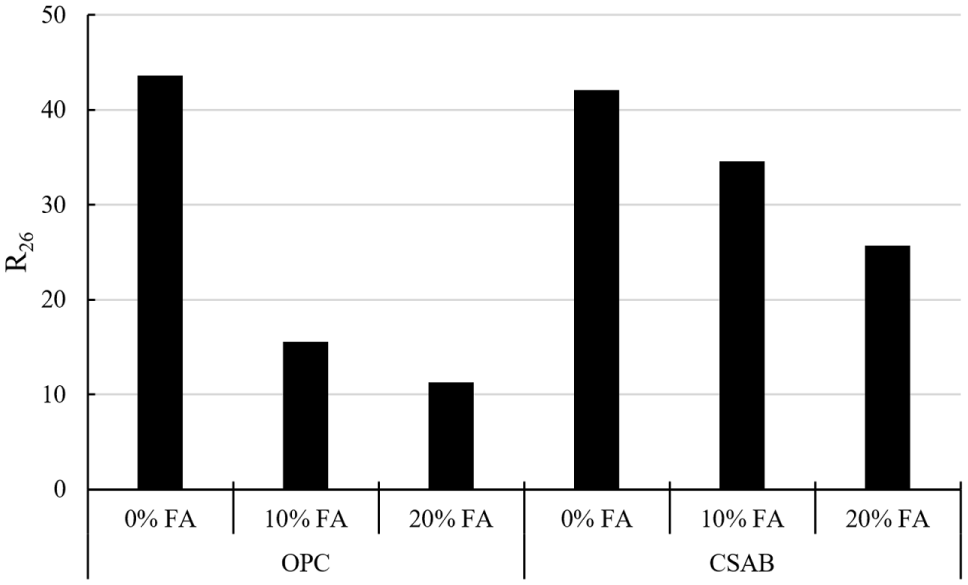
Effect of cement replacement with class F fly ash (FA) for samples with 50% glass aggregate and 2.5% TiO2 on self-cleaning efficiency (R26).
Effect of Cementitious Binder on Self-Cleaning Efficiency
The self-cleaning efficiency of samples with CSAB cement or fly ash replacement was lower than samples containing just 100% OPC. One common effect of using CSAB cement instead of OPC and replacing OPC with fly ash is that the pH of the pore solution decreases compared to plain OPC samples. The pH of the pore solution also depends on the hydration age. In this testing, all of the specimens were moist cured for seven days and then left at room temperature for seven days. The next sections discuss how different binders changes the pH of the pore solution and how pH affects the RhB degradation rate.
Pore Solution pH of Samples with Different Binders
There have been a few studies on pore solution pH of sulfoaluminate cements, but all of them indicate that the pore solution pH of CSAB cement is less than that of the pore solution of OPC. Pore solution of calcium sulfoaluminate (CSA) cements after 7 and 28 days of hydration were in the range of 12.6–12.9 and 12.7–12.8, respectively, whereas the pH of pore solution of CSAB cements after 7 and 14 days of hydration were 13.04 and 12.94, respectively ( 31 , 32 ). The pore solution pH of OPC cement samples after seven days ranged from 13 to 14 with the pore solution pH of OPC samples being higher than samples containing CSAB cement ( 33 , 34 ). The pore solution pH of samples with only OPC and OPC with 30% CSA blends were 13.4 and 13, respectively, after seven days of hydration ( 35 ).
In general, pore solution pH decreases when fly ash replaces OPC. The decrease in calcium and alkali content and increase in silica content in fly ash helps to reduce the pH of the pore solution. In this study, a class F fly ash with very low calcium oxide content (6.71%), very high silica content (59.03%), and moderate alkali content (Na2Oe = 1.54%) partially-replaced OPC. From the results of previous studies that used fly ash with similar oxide contents, it is expected that replacing OPC with class F fly ash will reduce pH of the pore solution ( 36 , 37 ). The C-S-H formed because of the pozzolanic reaction of class F fly ash has a lower Ca/Si ratio, which results in the C-S-H absorbing alkali (A) ions forming C-(A)-S-H, and the pH of the pore solution decreasing in the absence of alkali ions ( 38 – 40 ).
Although there are a few works that have explored the effect of the addition of fly ash on the hydration of CSA or CSAB cement, there is no research work that has studied its effect on the pH of the pore solution ( 41 – 45 ). Given that there is no alite in CSAB cement, it is expected that a smaller amount of CH, which is required for the pozzolanic reaction to occur, will be generated after 7 to 14 days of hydration compared to OPC and thus the decrease in pH of the pore solution because of fly ash addition will be much lower for CSAB cement as compared to OPC.
Effect of pH on Photocatalytic RhB Degradation
Researchers have studied the pH of the RhB solution on its photocatalytic degradation in the presence of different photocatalysts. You-ji and Wei found that the rate constant of RhB degradation in the presence of TiO2-zeolite composite increases by about 10% when the pH of the solution increases from 8 to 10 ( 46 ). RhB degradation in the presence of a ZnO photocatalyst rose from about 80% to 90% when the pH of the RhB solution was increased from 10 to 12 ( 47 ). The rate of degradation of RhB in the presence of anatase doubled by increasing the pH from about 9.5 to 12 ( 48 ). Given no previous work had studied the effect of the pH of the RhB solution on its degradation at high alkalinity (hydrated cement pH of 12.5 to 14) in the presence of TiO2, an experiment was performed in this study.
Experimental Study of RhB Solution pH on Photodegradation of RhB
Four solutions of RhB with a concentration of 20 µM were prepared with pHs of 12.65, 13.0, 13.3 and 13.7. Saturated lime water was used to attain a pH of 12.65, and appropriate amounts of sodium hydroxide were added to saturated lime water to obtain the desired pH of the different solutions. Finally, proper amounts of RhB were added to all of the solutions to obtain a RhB concentration of 20 µM. 50 ml of each solution was mixed with 5 gm of nano-anatase which was used to make the photocatalytic samples. The samples were then exposed to UV-A light at an intensity of 3.75 µW/cm2 for 4 h while being mixed vigorously. Solutions were filtered to minimize the amount of anatase present in the solution and then analyzed using a Varian Cary 5G spectrophotometer to obtain the absorbance at different wavelengths, as shown in Figure 11. The four solutions were also tested before exposure to UV-A light and addition of TiO2, and all four solutions had a peak absorbance of about 1.85 at wavelength 555 nm. Beer–Lambert’s law can be used to relate the absorbance of a solution (

in which

in which
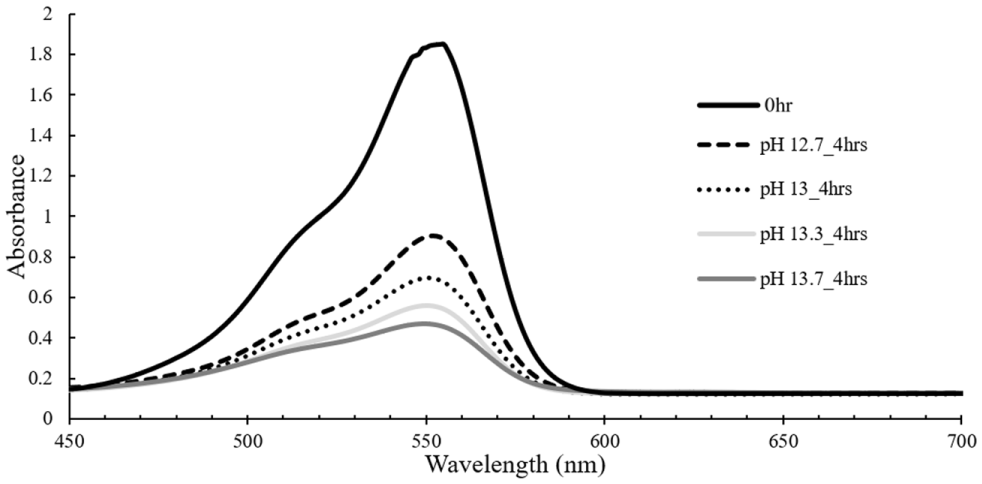
Absorbance patterns of RhB solutions with different pH after 4 h of UV-A exposure.
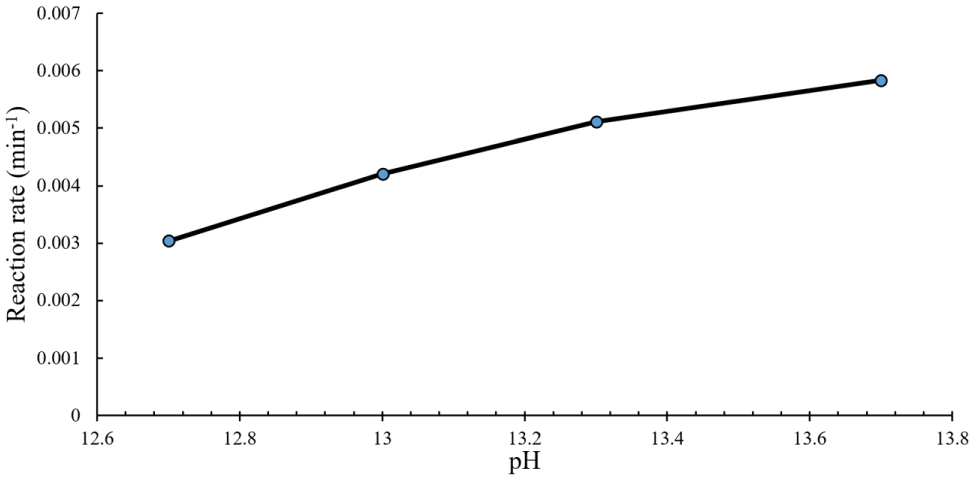
Effect of pH on reaction rate constant for RhB solution degradation.
Mechanism of Photocatalytic RhB Degradation on Mortar Surface
There are two reaction paths to degrade RhB: N-de-ethylation and cleavage of the chromophore structure. Both paths require generation of an active oxygen species which can be achieved by photosensitization of RhB and direct excitation of TiO2 by UV light. In the first mechanism, RhB can be photosensitized in the presence of UV light and photosensitized RhB, when adsorbed on the TiO2 surface, can react with TiO2 to form a cationic radical of RhB and excite TiO2 which can release an electron to form an active oxygen species ( 27 , 29 , 30 , 52 ). The active oxygen species prefers to attack the organic group of RhB present close to the TiO2 surface. Mortar samples are highly alkaline with a pH higher than the isoelectric point of TiO2, making the TiO2 surface negatively charged. In highly alkaline conditions, the diethylamino group and the carboxyl group of RhB are positively and negatively charged, respectively, and as a result, when photosensitized RhB is adsorbed onto the TiO2 surface, the positively charged diethylamino group of RhB faces toward the negatively charged TiO2 surface and the carboxyl group faces away from the TiO2 surface ( 29 , 53 ). As the ethyl group is close to the TiO2 surface, the active oxygen species generated by photosensitization of RhB mainly attacks the ethyl group causing N-de-ethylation of RhB. In the second mechanism, TiO2 becomes excited in the presence of UV-A light and releases electrons creating an electron-hole pair, which can create active oxygen species by reacting with oxygen and water. In this method, active oxygen species are generated independently of the adsorption sites of RhB, but the active oxygen species generated shows a slight preference toward attacking the organic group close to the TiO2 surface, and thus RhB degrades through both reaction pathways, N-de-ethylation and cleavage of the chromophore structure of RhB ( 29 ).
As N-de-ethylation of RhB occurs in both the mechanisms of active oxygen species generation when RhB degrades on mortar surface, it is expected that a positive SPAW26hrs will be observed for all of the photocatalytic mortar samples, as seen in Table 3. Overall, SPAW26hr increased with R26 (Table 3) because the higher amount of RhB degradation implies generation of an increased amount of active oxygen species, which leads to a increased amount of N-de-ethylation. Thus, samples with similar RhB degradation amounts should be compared to study what mortar constituents increase N-de-ethylation relative to cleavage of the chromophore structure. The SPAW26hr of the samples with a R26 value in the range of 38.9–50 were compared (Figure 13). The samples with 5% TiO2 content had a significantly higher SPAW26hr than the samples with a 2.5% TiO2 content. An increase in SPAW26hr indicates an increase in the N-de-ethylation of RhB. As the amount of TiO2 in the mortar mix increases, the amount of TiO2 on the mortar surface also increases allowing more RhB to be adsorbed on the TiO2 surface and thus, a greater amount of RhB degradation occurs through N-de-ethylation.
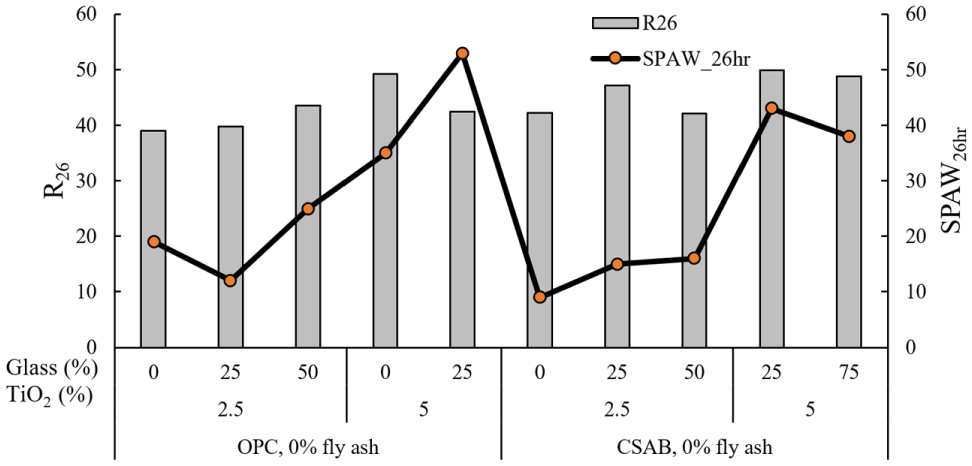
Effect of TiO2 content on SPAW26hr for samples with similar R26.
Conclusion
Concrete surfaces must remain relatively clean of contaminants to take advantage of the photocatalytic concrete capabilities for air pollutant removal. Photocatalytic concrete has the chemical ability to degrade organic soiling agents and keep the concrete surface cleaner and more aesthetically pleasing. In this study, the self-cleaning efficiencies of various photocatalytic mortars containing OPC or CSAB cement with titanium dioxide were quantified through degradation of RhB after 26 h of UV-A light exposure (R26). The impacts of partial replacement of the cement with fly ash and replacement of sand with glass fine aggregate were also quantified.
Overall, the self-cleaning efficiency of photocatalytic OPC samples was higher than the samples containing CSAB or fly ash. It was hypothesized that cementitious samples with a lower pore solution pH resulted in a lower self-cleaning efficiency. Increasing the TiO2 content from 2.5% to 5% and fine glass aggregate substitution for sand both significantly increased the self-cleaning efficiency of the OPC samples, but the effect was minimal for CSAB samples. Thus, increasing the activated TiO2 beyond a certain dosage does not produce additional benefits in the self-cleaning efficiency for CSAB samples.
Partial replacement of cement by fly ash and using CSAB instead of OPC both lead to a lower pore solution pH. The degradation of RhB solutions in the presence of nano anatase powder at various pH levels in the typical range of pore solution pHs was tested. The rate of RhB degradation increased with the pH of the RhB solution. Based on these results, the decrease in pore solution pH is one of the main reasons behind the lower self-cleaning efficiency for CSAB and class F fly ash replacement of OPC.
Photocatalytic degradation of RhB in the presence of pure anatase can occur by N-de-ethylation and cleavage of the chromophore structure. The shift in peak absorbance wavelength was measured to evaluate the N-de-ethylation of RhB. All of the photocatalytic samples, regardless of the binder or aggregate present, had a shift in the peak absorbance wavelength proving the occurrence of RhB degradation through N-de-ethylation. The shift in peak absorbance wavelength, defined as SPAW26hr, was compared among with samples with a similar self-cleaning efficiency to study the effect of increasing TiO2 content on the mechanism of RhB degradation. An increase in the TiO2 content increased the change in the peak absorption wavelength indicating that a higher TiO2 content leads to an increase in the photodegradation through the N-de-ethylation pathway.
Footnotes
Acknowledgements
This work was supported by the U.S. Department of Transportation (U.S. DOT) through the University Transportation Center for Highway Pavement Preservation (UTCHPP) at Michigan State University (contract number DTR13-G-UTC44). Part of the study was carried out in the Frederick Seitz Materials Research Laboratory Central Facilities, University of Illinois. Edoardo Barber helped with the translation of UNI 11259 ( 26 ). Thanks to Cristal for providing the anatase used in this study.
Author Contributions
The authors confirm contribution to the paper as follows: study conception and design: AB, JRR; data collection: AB; analysis and interpretation of results: AB, JRR; draft manuscript preparation: AB, JRR. Both authors reviewed the results and approved the final version of the manuscript.
The Standing Committee on Basic Research and Emerging Technologies Related to Concrete (AFN10) peer-reviewed this paper (19-01047).