
Abstract
Traffic accidents in extra-long urban underwater tunnels are characterized by high numbers of causalities and severe traffic congestion. Analyzing drivers’ saccade characteristics under different curvature conditions in urban underwater tunnels can provide solutions to reduce the rates of such accidents and increase traffic safety. This paper reports real vehicle tests conducted in extra-long urban underwater tunnels, on curved sections of radii of 400, 680, 1,000, 1,500, and 3,000 m, and also on straight sections. Indicators of drivers’ saccade behavior, such as saccade angle, time, and frequency, and the saccade time ratio were evaluated. The coefficient of variation was used to analyze the discreteness of the saccade angle. The driver’s saccade characteristics, such as saccade time and frequency, were explored by combining the visual distances for different curved sections. The results demonstrated that (a) small angles in the range of [0, 10°] constituted the main distribution section of the driver’s saccade angle in extra-long urban underwater tunnels, and the saccade angle discreteness increased with increase in the radius, (b) the driver’s average saccade time increased while the average saccade frequency decreased with the increase of the radius, (c) the driver’s visual load was higher for long straight sections and small-radius curves, (d) the driver’s safety was generally higher on right-curving sections than on left-curving sections.
Extra-long urban underwater tunnels represent a special form of urban roads that play an important role in saving land resources, breaking regional geographic barriers, and alleviating urban congestion. Recently, the number and mileage of these tunnels have been steadily increasing. In China, numerous underwater tunnels are currently under construction or already built. For example, there are 14 extra-long urban underwater tunnels under the Changjiang River. Several studies have revealed that driver fatigue is more likely to occur in monotonous driving environments, especially tunnels ( 1 ), which can lead to visual illusion and even traffic accidents. In tunnels, such accidents often have heavy casualties ( 2 ), and can cause urban traffic paralysis. With relatively airtight space and psychological panic, it is difficult for people to escape or be rescued from accidents in tunnels.
The tunnel operating environment is significantly different from the conventional one in relation to luminance, sight distance, and sight zone. Drivers in tunnels are more prone to visual illusion, and their perception of speed and distance is much reduced ( 3 ). Moreover, cars traveling at excessive speeds or improperly changing lanes through tunnels are more likely to cause high-casualty accidents.
This paper reports the results of extensive driving tests that explored drivers’ saccade behavior in extra-long urban underwater tunnels. The purpose of this work is to investigate changes in drivers’ saccade behavior under different curvature settings, and provide a theoretical basis for the safety management of extra-long urban underwater tunnels.
Literature Review
Several studies have been made of drivers’ saccade characteristics ( 4 , 5 ). Underwood et al. ( 6 ) studied the relationship between drivers’ scanning behavior and driving safety. They found that experienced drivers scanned more often, and increased scanning to notice hazardous objects earlier. In a review of 50 years of safety research, Lee ( 7 ) concluded that traffic accidents such as vehicle collisions occur because the right things are not observed at the right time. His research also proves that inadequate scanning will inevitably result in a collision. Klauer et al. ( 8 ) studied the 100-car naturalistic driving data of the Virginia Tech Transportation Institute, and they discovered that a prominent feature prevailing before the occurrence of an accident is that the driver lacks sufficient visual search. Failing to scan the roadway was a common cause for sudden swerving or braking. This is also why our work focuses on the saccade behavior of drivers in curved sections of extra-long urban underwater tunnels.
In relation to driving tasks, Baker et al. ( 9 ) and Horrey and Wickens ( 10 ) found that the allocation of cognitive resources affected driving performance. The appropriate allocation of attention is necessary for adequate visual perception through the driver’s scanning activities, as it is essential for ensuring safe driving ( 11 , 12 ). According to the relationship between the visual environment and driving tasks, the researchers found that the load level of the driving task was closely related to the driver’s pupil diameter, amplitude of saccade, fixation time, and blink rate ( 13 , 14 ).
In relation to drivers’ behavior in tunnels, Redenbo and Lee ( 15 ) and Macdonald and Lavie ( 16 ) found that the visual load was determined by both the visual physiological load and the visual perception load. The visual physiological load is a physiological response caused by eye movements, while the visual perception load is the amount of visual perception information during task stimulation. Du et al. ( 17 ) studied the drivers’ visual comfort at a tunnel entrance, and established a quantitative evaluation method of the instantaneous blind area through visual oscillations. Calvi et al. ( 18 ) used a driving simulator to study the influence of tunnel sections on driving behavior. In addition to the eye movement data, Feng et al. ( 19 ) showed that when driving through an urban tunnel, the increase in a driver’s heart rate was more sensitive to slope than speed. Kircher and Alstrom ( 20 ) studied the brightness levels and colors, and concluded that light-colored side walls were more conducive to driving safety in tunnels.
For curved road sections, Oka et al. ( 21 ) investigated the physiological characteristics of drivers, and found that left-curve driving requires more visual attention than right-curve driving. Peng et al. ( 22 ) utilized a simulated driving experiment to study the driver’s visual field and viewing angle when driving on a curve, and established a comprehensive evaluation model. Mars and Navarro ( 23 ) found that drivers pay more attention to the left space during a left curve, while for right the attention is significantly directed to the right space. In other words, the driver’s line of sight generally tends to be inside the curve while negotiating the curve.
In general, there is a lack of research on drivers’ visual characteristics in curves of underwater tunnels. Therefore, this paper attempts to explore drivers’ saccade characteristics in extra-long urban underwater tunnels under different radii and direction of curvatures. The paper (a) studies the main distribution sections of the driver’s saccade angle, (b) establishes mathematical models of saccade time and saccade frequency for different radii, and (c) analyzes driving safety under different tunnel section and curvature conditions. To achieve the objectives of this work, several issues were addressed:
What is the distribution of the driver’s saccade angle under different alignments and curvature conditions?
Is there any quantitative relationship between the visual distance and the saccade behavior in the curves of underwater tunnels?
What are the differences in the visual load under different alignments and curvature conditions?
Experimental Design and Data Collection
Test Tunnel Description
The East Lake Tunnel (Wuhan, China) was selected as the principal experimental site in this study. By restricting the main study to this unique urban underwater tunnel, we aimed to reduce the influence of the environment, the traffic flow, and other external conditions on our real vehicle tests. The selected tunnel consists of several curved sections and a few straight sections. There are three typical curved sections in the tunnel, with radii of 400 m, 680 m, and 1,000 m, respectively. A straight-line section in the tunnel was used as a reference. The length of the East Lake Tunnel is 10.6 km, while the lengths of the test curves are 443 m to 930 m, and the length of straight section is 1,196 m.
To study saccade behavior in sections with different radii, a number of experiments were carried out in other underwater tunnels with radii of 1,500 m and 3,000 m. The number of lanes (two-way six lanes) and the speed limit (60 km/h) in the six sections above is the same. The average illuminance range of the abovementioned six sections is 21.304 lx to 24.082 lx, and the average slope is 0.74%. Changes in illuminance and slope are limited, and thus these two factors were not studied.
Demographic Data of the Test Drivers
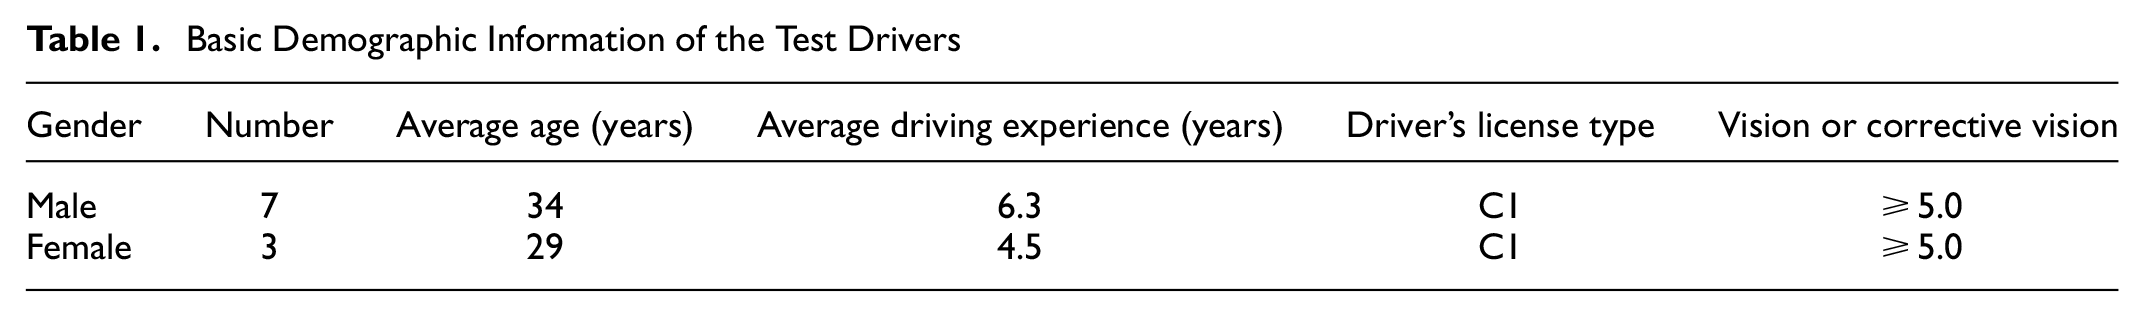
Basic information about the driver’s gender, age, and driving experience is shown in Table 1. The male-to-female ratio of the test drivers was selected according to the general ratio of drivers in China, which is 7:3. All test drivers hold a C1 driving license, which is the basic and most common type in China. Before beginning the tests, the subjects had normal diets, rest, and other life routines, and they avoided vigorous exercise.
Basic Demographic Information of the Test Drivers
To reduce the influence of speed and lane-change on the test, each driver kept driving in the middle lane with the free-flow speed of 50–60 km/h. The two directions were cycled once, test data was generated, and at least three sets of valid data were collected for each driver.
Test Facilities and Calibration
In our study, the test vehicles were a Volkswagen car and a Chevrolet car. As shown in Figure 1, the eye data acquisition equipment was a Dikablis Professional Eye Tracker system, which had a sampling frequency of 60 Hz and a line-of-sight tracking accuracy of 0.1° to 0.3°. The eye tracker was very lightweight and when positioned on the driver’s head caused no interference with normal driving. This tracker was used for real-time collection of eye movement data. Data extraction and analysis were undertaken by the D-Lab software. The acquisition equipment of the illuminance data was a UT381 illuminometer. The maximum measurement was 20,000 lx, and the measurement accuracy was ± (3% + 8). This device was fixed in the car at the same height as the driver’s eyes to collect illuminance data through the tunnel.
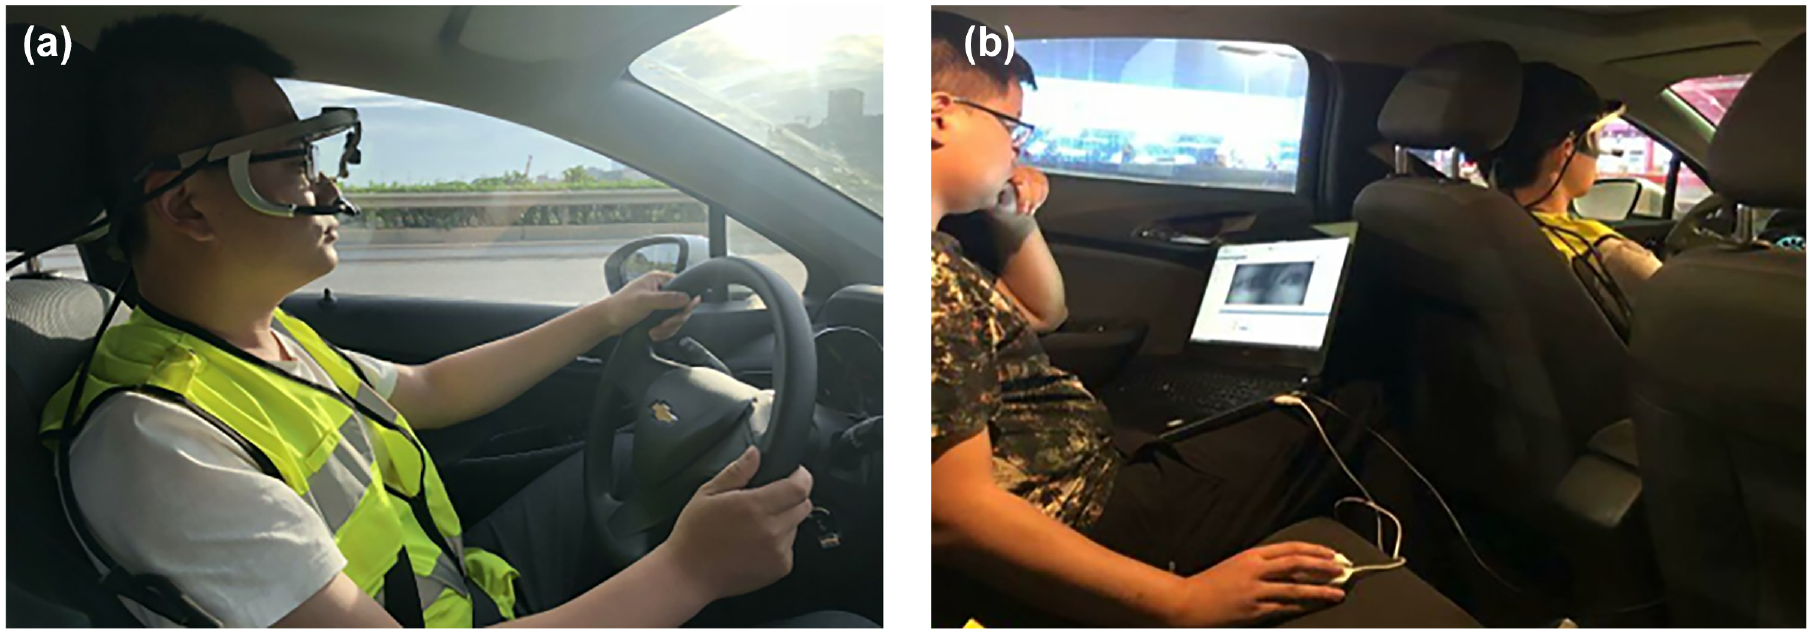
Test vehicle set-up: (a) driver, (b) researcher.
After each group of drivers performed the tests, those drivers took a rest to reduce the effect of fatigue. During the experiments, the instruments were calibrated before and after each test, and the integrity of the experimental data was checked as well. To reduce the impact of traffic flow changes on the accuracy of the data, the tests were conducted under free-flow conditions during off-peak periods at night. All the tests were conducted under good weather conditions.
Data Collection
The pupil area, pupil change rate, pupil fixation time, saccade time and saccade angle are important parameters in the analysis of a driver’s visual characteristics ( 10 , 14 , 24 ). For curves in urban underwater tunnels, the driver’s perception of curvature under different alignments and conditions may vary. The saccade angle, time, and frequency are significant indices to study the driver’s visual characteristics in curves, which can demonstrate the driver’s psychological changes and fixation transfer. These saccade indices constitute the important parameters that were collected and studied in this paper.
For data analysis, eye movement data measurements were averaged to improve validity. The collected data was processed by the Pauta criterion ( 25 ) to reduce the interference of abnormal data. The calculation method for abnormal data, according to the Pauta criterion, is as follows:

where, xi represents the test data,
Experimental Results
Saccade Angle
Statistical analysis was performed to test the normality of the data. In particular, the Shapiro-Wilk test ( 26 ) for normality was used, with a significance level of 0.05. After applying a logarithmic transformation to the data, the test probability of significance (Sig.) of each section was greater than 0.05. These outcomes indicate that there was statistically significant normality. The results of the normality test (Sig.) and the overall descriptive statistical analysis (maximum, minimum and median value) of the saccade angle data for different road sections are shown in Table 2.
Normality Test and Statistics of the Saccade Angle
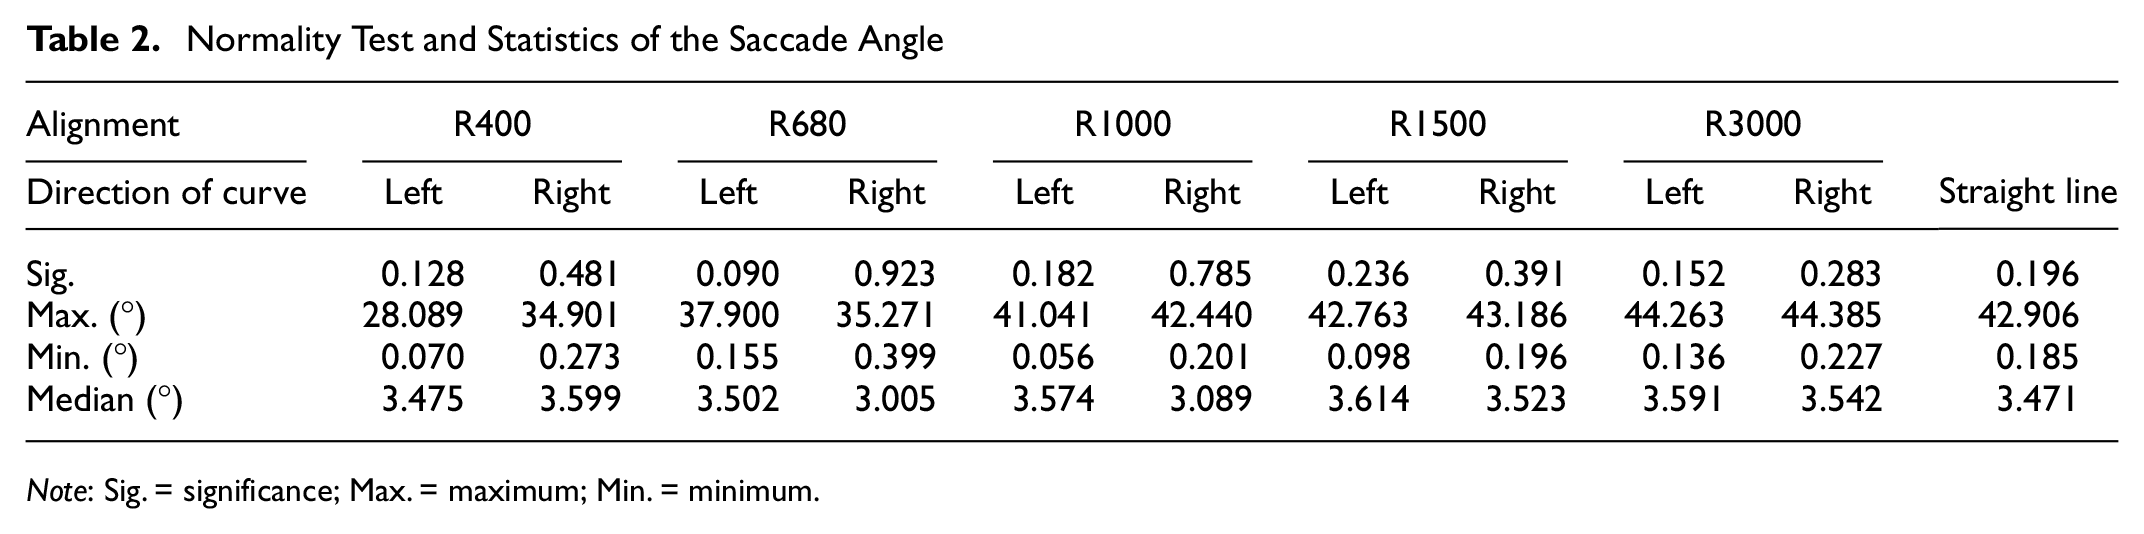
Note: Sig. = significance; Max. = maximum; Min. = minimum.
As shown in Table 2, the change of the range of driver’s saccade angle becomes wider with the increase of the radius. When driving on a curve with the same radius, the distribution intervals of the saccade angle for left and right curves are essentially the same. When the driver follows a curve to the left, the maximum and median of the saccade angle in different curves increases with increase of the radius. In contrast, there was no significant regularity in the indices during right-curve driving. In particular, the index values for a 400 m radius are larger than those for larger radii. When the left-curve index was compared with the corresponding right-curve index for the same radius, the former was found to be larger than the latter for all radius values, with the sole exception of the case of the 400 m radius, for which the opposite holds.
It can be seen from Table 2 that the saccade angles are concentrated in the interval [0.056, 44.385]. The interval [0, 45] was divided into nine segments, of a five-degree width each, and the proportion of saccade angles in each segment was studied. Figure 2 presents these proportions (as percentages) under different alignments and curvature conditions.
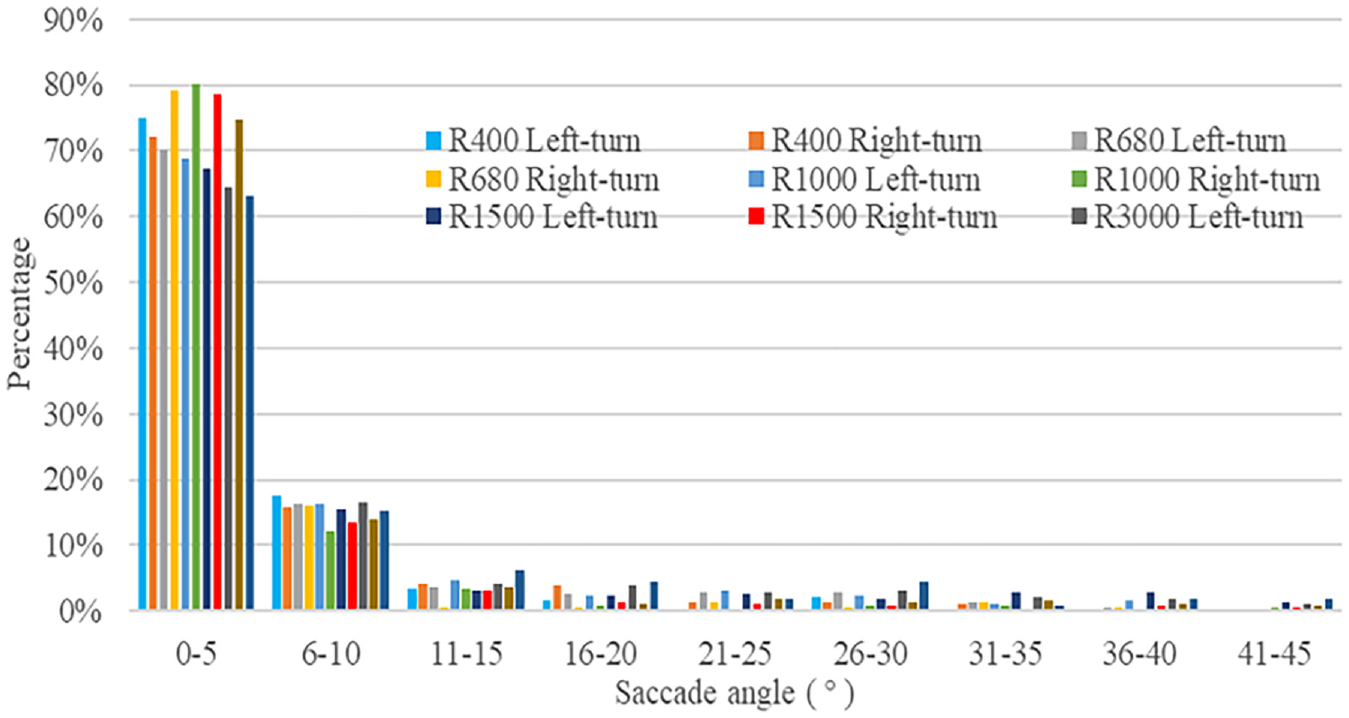
Percentage of saccade angle distributions.
Obviously, the proportion in the first segment of [0, 5] was the largest, and accounts for more than 63% of the whole distribution. The proportion in the section of [0, 10] comprising the first two segments was more than 78% of the total. So it can be concluded that the saccade angle in the urban underwater tunnel in practice tends to be small.
The ranges that account for 90% of the occurrences of the driver’s saccade angle were combined. For left curves, the main distribution sections of the alignments R400, R680, R1000, R1500, R3000, and the straight-line section were [0, 10°], [0, 15°], [0, 20°], [0, 25°], [0, 25°], and [0, 25°], respectively. This pattern is similar to the trend of the saccade angle distribution, in which the increase of the radius led to a continuous increase in the fixation transfer range for drivers. For radii larger than 1,500 m, the change range of the saccade angle tended to be stable. For right curves, there was no significant regularity, and the main distribution range of the saccade angle was larger for the small radius of 400 m and the radius of 3,000 m.
Saccade Time
An eye tracker can be used to obtain the driver’s saccade time. Each driver’s average saccade times under different curvature conditions and alignments were measured. Statistical p-values showed that there was no significant difference at a radius of 400 m (p > 0.05), while there were significant differences at other radii (p < 0.05). There was no significant difference in the average saccade time under the same direction of curvature and different radii (p > 0.05).
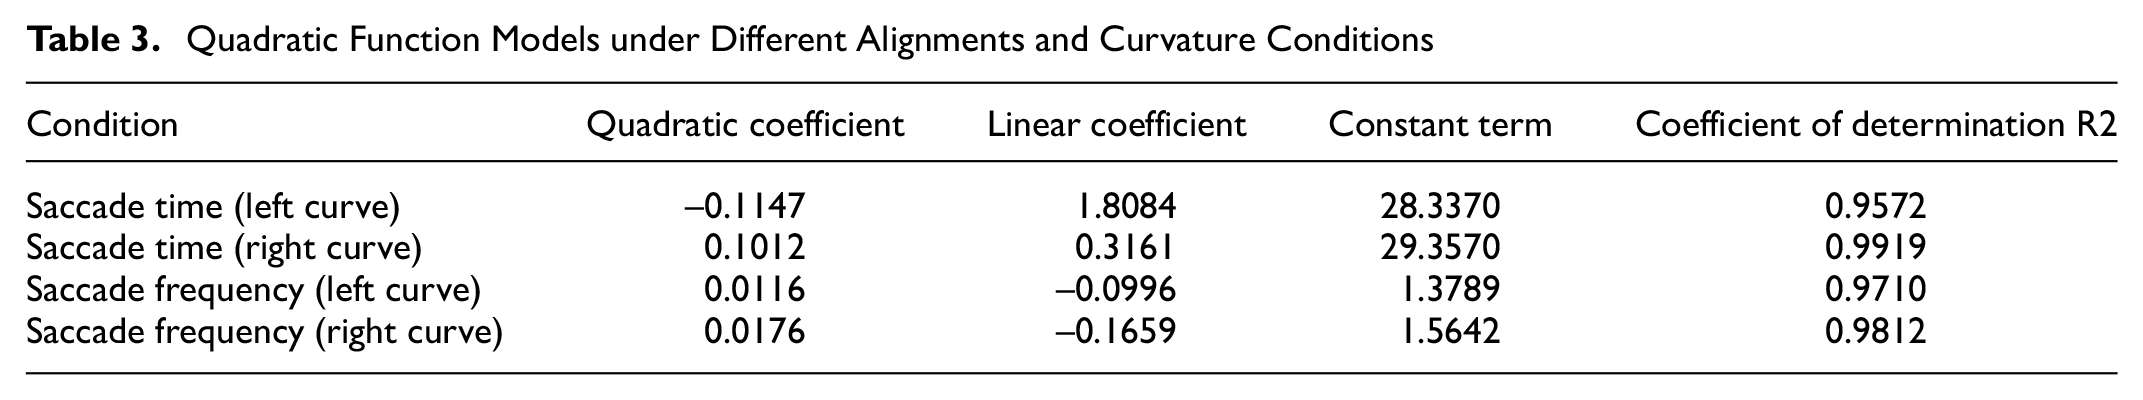
According to measurements of the saccade times, the fitting accuracy of different fitting functions was compared. As shown in Figure 3, the quadratic relationship models between the average saccade time y and the radius x under different curvature conditions could be established. The parameters of the fitted quadratic model are shown in Table 3. The coefficients of determination R 2 for left and right curves are 0.9572 and 0.9919, respectively. The goodness of fit of the model turned out to be high.
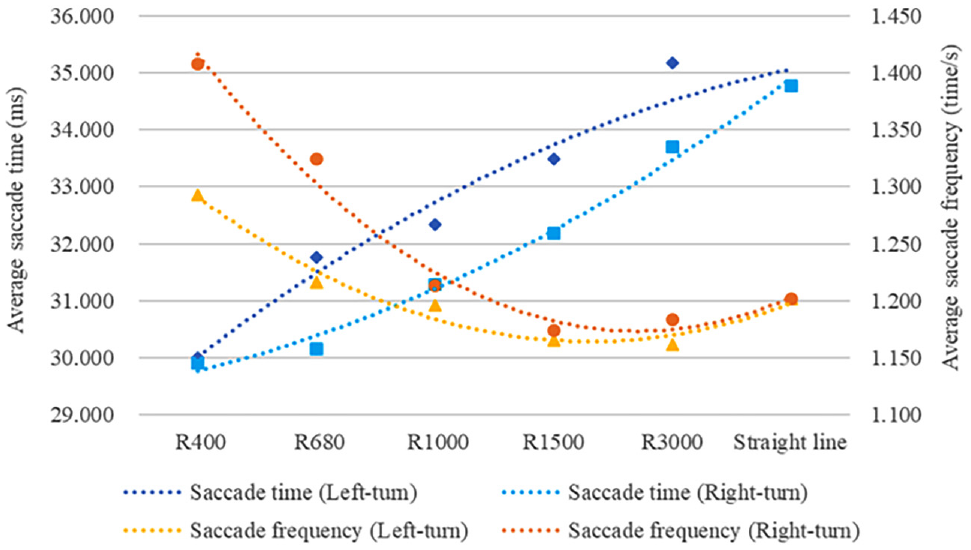
Average saccade time and frequency.
Quadratic Function Models under Different Alignments and Curvature Conditions
It can be seen from Figure 3 that the driver’s average saccade time increased with the increase of the radius under different alignments. Under the same radius, the average saccade time for left curves was longer than that for right curves. The average saccade times for left and right curves were almost the same in the small radius of 400 m. The larger the radius, the greater the difference of the average scanning times between the cases of left and right curves.
Saccade Frequency
The gaze and saccade numbers collected by the eye tracker could be further processed to obtain the saccade frequency. The saccade frequency can be defined as follows:

where pm,n represents the driver’s saccade frequency while driving with alignment m and curve n (in time/s); Ns, m,n is the number of saccade while driving with alignment m and curve n (in times); Tm,n represents the total time while driving with alignment m and curve n (in seconds), m∈ {R400, R680, R1000, R1500, R3000, straight line}, n∈ {left curve, right curve}.
For the average saccade frequency, radii of 400, 680, and 1,000 m showed significant differences (p = 0.023, 0.032, 0.042). For radii of 1,500 m and 3,000 m, there were no significant differences (p = 0.014, 0.097). There was also no significant difference in the average saccade frequency under the same direction of curvature and different radii.
As shown in Figure 3, the quadratic function relationship models between the average saccade frequency y and the radius x under different curvature conditions could be established. The parameters of the fitted quadratic function model under the left and the right curve, respectively, are shown in Table 3. The coefficient of determination R 2 is 0.9710 and 0.9812, respectively, and the reliability of the abovementioned models is good.
It can be seen from Figure 3 that the driver’s average saccade frequency decreased with the increase of the radius, while slightly increasing for the radius of 1,500 m. Moreover, for the same radius, the average saccade frequency for left curves was less than that for right curves. The larger the radius, the smaller the difference in the saccade frequencies between the cases of left and right curves.
Discussion of Results
Relationship between Saccade Angle and Coefficient of Variation
On the basis of the descriptive statistics and the division of driver’s saccade angle, the coefficient of variation was used to analyze the driver’s saccade characteristics under different alignments and curvature conditions. When the mean values of multiple sets of data were different, the coefficient of variation could reflect the degree of dispersion of the data from the unit mean ( 27 ). The coefficient of variation is given by:

where CVm,n represents the coefficient of variation of the driver’s saccade angle with alignment m and curve n; σm, n is the standard deviation of the driver’s saccade angle with alignment m and curve n; μm, n represents the average value of the driver’s saccade angle with alignment m and curve n, m∈ {R400, R680, R1000, R1500, R3000, straight line}, n∈ {left curve, right curve}.
The coefficients of variation of the driver’s saccade angle under different alignments and curvature conditions are calculated. The coefficients of variation for curves of extra-long urban underwater tunnels are shown in Figure 4.
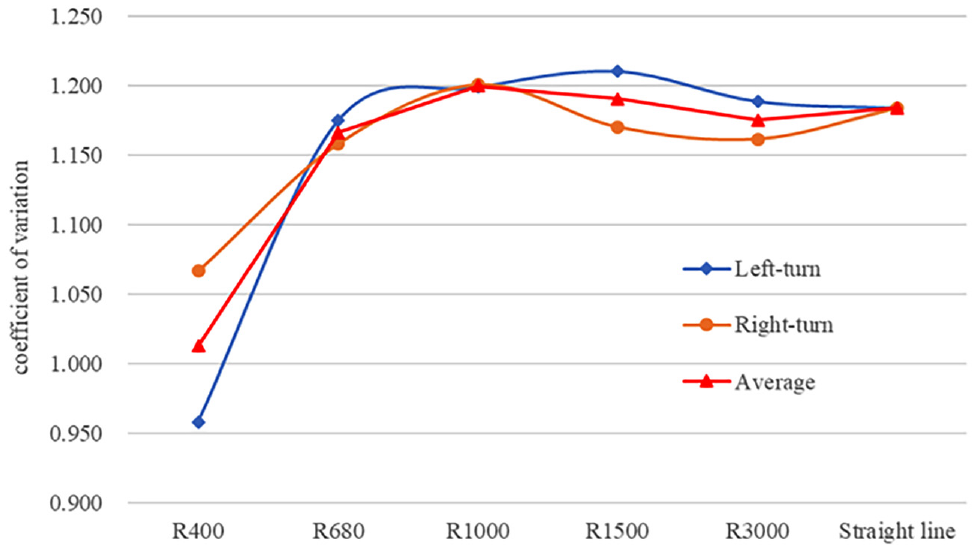
Coefficient of variation under different alignments.
Without distinction between the left- and right-curve conditions, the average coefficient of variation for the radii of 400, 680, 1,000, 1,500, 3,000 m, and the straight-line segment were 1.013, 1.167, 1.200, 1.191, 1.176, and 1.184, respectively. With the decrease of the curvature, the driver’s driving vision is wider, the change range of the saccade angle is wider, and the driver’s saccade angle is more discrete. When the radius is larger than 1,000 m, the variation of the coefficient of variation tends to be stable. When driving in small-radius curves of urban underwater tunnels, the range of the driver’s saccade angle is the smallest and the focus range is more concentrated. The results also reflect that the driver’s visual burden and tension become larger as the curvature increases, and driving safety decreases.
Comparing the left curve and right curve cases, it can be observed that the variation range of the coefficient of variation for right curves is 46.965% less than that for left curves. That is, the discreteness of the saccade angle for right curves is smaller and the driver’s driving condition is more stable. The coefficient of variation of the saccade angle is the lowest when curving left in a 400 m radius curve. That is, when curving left in a small radius, the driver pays more attention to the trend of tunnel alignment, and the corresponding psychological pressure is also greater compared with driving on other alignments.
Relationship between Saccade Time and Visual Distance
Reimer ( 14 ) reported that drivers compensated for moderate cognitive demands by increasing their sight distances when the workload exceeded their abilities. Since the space is relatively closed when driving in a tunnel, it is difficult for drivers to perceive the sight distance, sight zone, and curvature correctly. It is more direct and effective for drivers to discriminate the visual distance when driving in bends, that is, the farthest distance that can be seen in a curve. As shown in Figure 5, the visual distance can be calculated as:
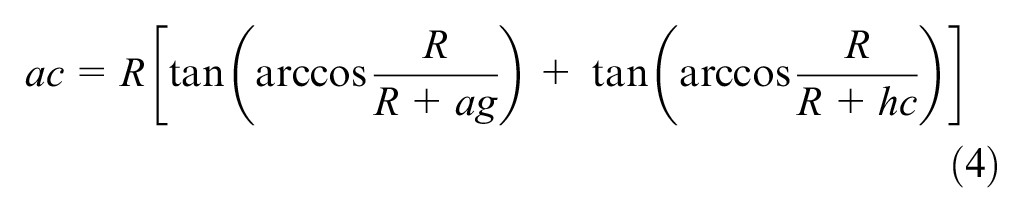
where CVm,n represents the visual distance (in meters), R is the radius of the tunnel curve (in meters), ag is the distance from the driver’s eye to the inner wall of the tunnel (in meters), and hc is the width between the inner and outer walls of the tunnel (in meters).
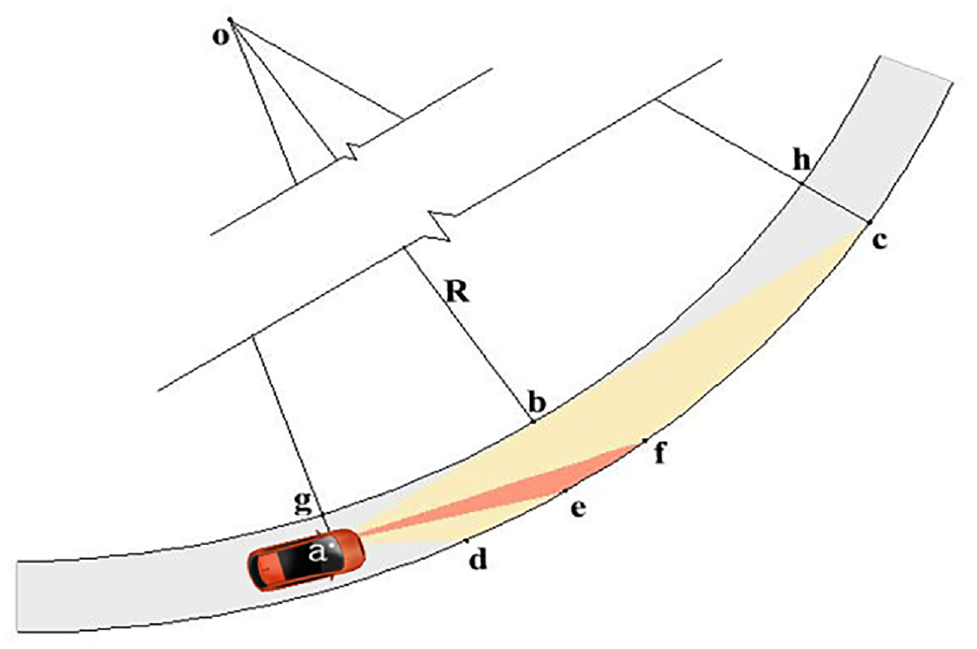
Visual distance on a curved road.
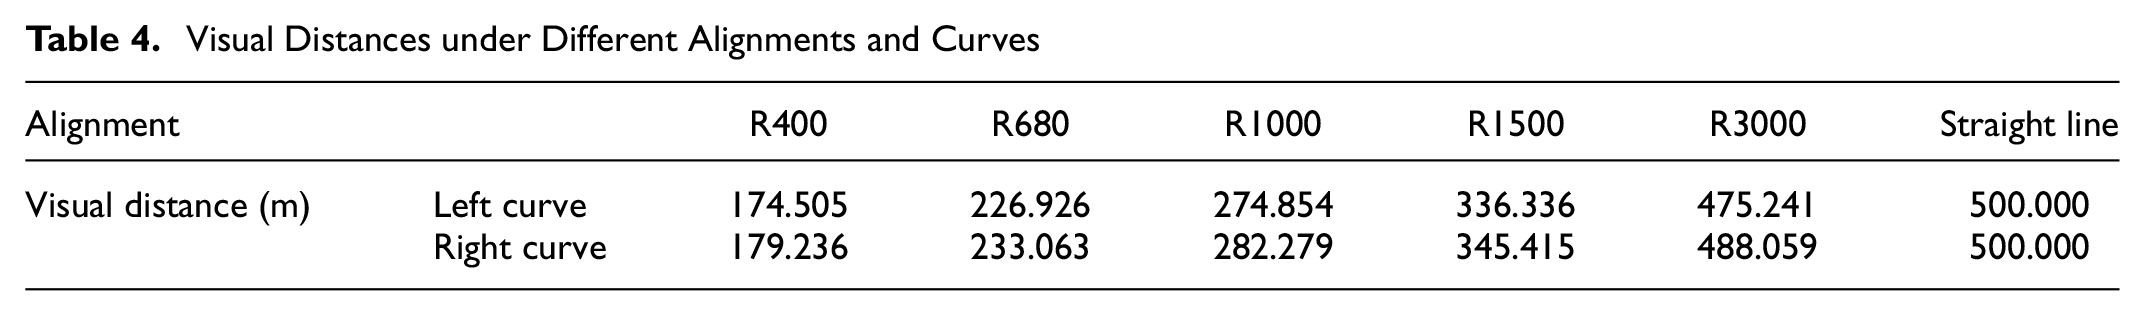
Overtaking other vehicles is allowed in the straight-line sections of some of the extra-long urban underwater tunnels in China. Therefore, the visual distance for straight-line sections (500 m in this work) can be greater than that for a curve radius of 3,000 m. According to the abovementioned method, the visual distance under different alignments and curvature conditions could be obtained, as demonstrated in Table 4.
Visual Distances under Different Alignments and Curves
The relationship between the visual distance and the average saccade time under different alignments and curvature conditions is illustrated in Figure 6. With the combination of the variation of the visual distance and the average saccade time in extra-long urban underwater tunnels, the driver’s saccade characteristics under different alignments and curvature conditions were analyzed.
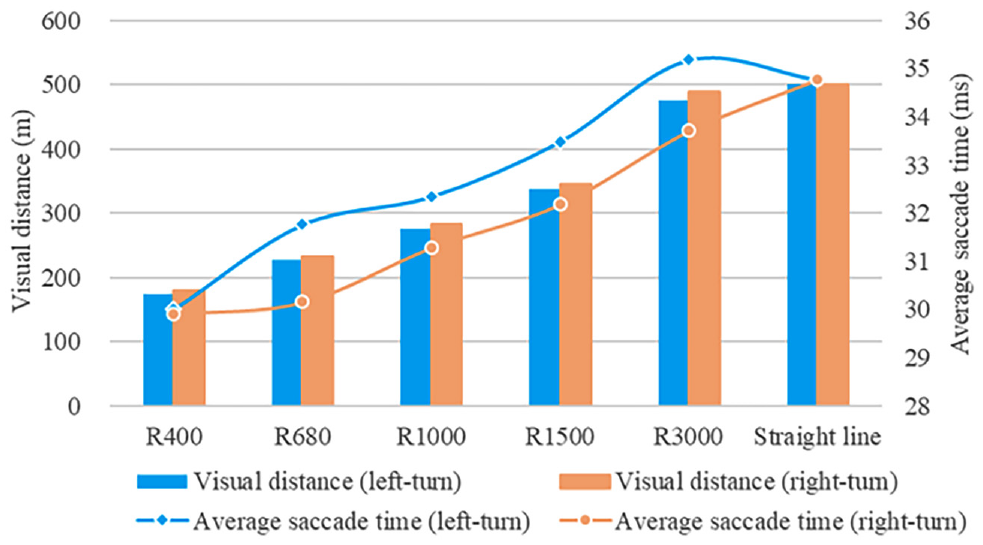
Changes in visual distance and average saccade time.
Without distinction between left- and right-curving conditions, the driver’s average saccade time increases with increase of the radius. The average saccade time for left curves is close to that of the case of right curves for the small radius of 400 m. The average saccade time for left curves is higher than that for the right curves for other curve radii. The minimum difference is 0.103 ms at a radius of 400 m.
Analysis of the saccade characteristics shows that longer saccade times simplify the gathering of effective information in tunnel sections with longer visual distances. For the same radius, small differences exist between the sight distance and the sight zone. However, the average saccade time for left curves is longer than that for right curves. This reflects the fact that the driver’s visual burden is greater when negotiating a curve to the left. Oka et al. ( 21 ) studied drivers’ physiological characteristics and brain activities for different curves. The results showed that higher visual attention is needed for driving on left curves in comparison with right curves.
Saccade Frequency, Time Ratio, and Frequency Ratio
Harbluk et al. ( 28 ) used time ratios to study the visual situation during driving, and showed that parameters such as the time ratio were effective test parameters. Therefore, analysis of the driver’s saccade characteristics under different alignments and curvature conditions in urban underwater tunnels should be combined with indicators such as their saccade frequency, time ratio, and frequency ratio. In this paper, the saccade time ratio and the saccade frequency ratio are respectively defined as:


where qm,n represents the driver’s saccade time ratio, ts, m,n is the driver’s saccade time with alignment m and curve n (in seconds), tf, m,n is the driver’s fixation time with alignment m and curve n (in seconds), rm,n represents the driver’s saccade frequency ratio, Nf, m,n is the number of fixation with alignment m and curve n (in times), m∈ {R400, R680, R1000, R1500, R3000, straight line}, n∈ {left curve, right curve}.
The driver’s saccade frequency, time ratio, and frequency ratio under different alignments and curvature conditions are shown in Table 5.
Saccade Frequency, Time Ratio, and Frequency Ratio for Different Alignments and Curvature Conditions
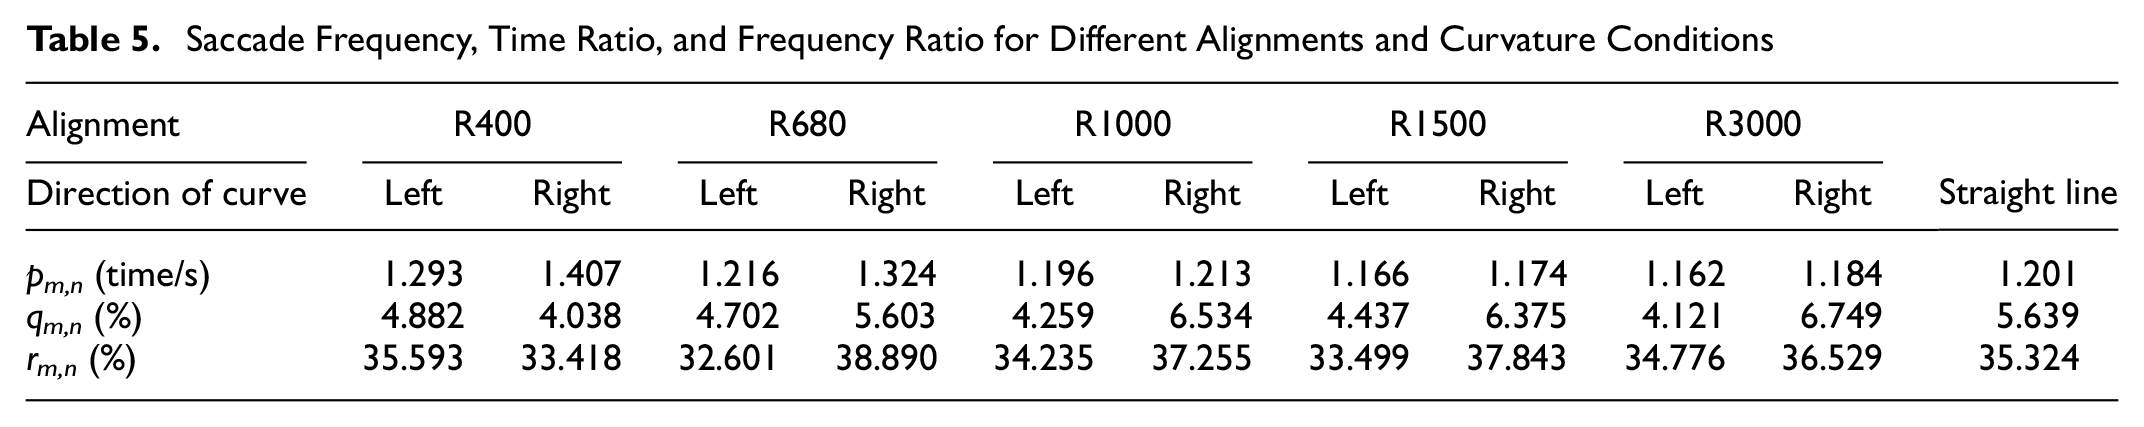
The driver’s average saccade frequency decreased with the increase of the radius. For the same radius, the average saccade frequency for left curves was smaller than that for right curves. The maximum difference of the saccade frequency was 0.114 times/s at a 400 m radius. For driving on curves, the saccade time ratio for left curves decreases with the increase of the radius, whereas that ratio for right curves gradually increases. Remarkably, no obvious correlation between the saccade frequency ratio and the curve radius was found.
For small-radius curve driving, it was also found that shorter visual distances lead to more concentration in the driver’s energy. By comparing the saccade frequencies and the saccade time ratios for the cases of the left and right curves, it was observed that the driver’s response for right curves is more relaxed, and their driving behavior is safer. There was no obvious correlation between the saccade frequency ratio and the radius, however. This lack of regularity may be related to the environment and the layout of the traffic facilities in the test tunnel.
Conclusion
In this paper, actual driving tests were carried out in an extra-long urban underwater tunnel. The saccade characteristics of multiple drivers under different alignments and curvature conditions were studied. The main conclusions can be summarized as follows:
(1) The driver’s saccade angle in urban underwater tunnels is often small, and is essentially mainly distributed in the [0, 10°] interval. For larger curve radii, the viewing distance increases, the range of the saccade angle becomes wider, and the discreteness of the saccade angle increases as well.
(2) Under different alignments, the driver’s average saccade time increases and the average saccade frequency decreases with the increase of the curve radius. For the same radius, the average saccade time for driving on left curves is higher than that for right curves. Also, the average saccade frequency for left-curve driving is smaller than that for right-curve driving.
(3) Under the influence of the sight distance and the sight zone, smaller radii of urban underwater tunnels lead to stronger visual loads and tension for drivers, and hence decrease the driver’s safety. Also, considering the overtaking demand on a straight-line road segment, special attention should be paid to the safety management of small-radius curves and long straight sections.
(4) For the same radius, the driver’s visual load during left-curve driving is greater than that for right-curve driving. Therefore, more attention should be paid when driving along a left-curving section of an extra-long urban underwater tunnel.
The experimental results of this work can provide a theoretical basis for safety management and design of extra-long urban underwater tunnels, and have high significance for improving tunnel traffic safety.
Footnotes
Author Contributions
The authors confirm contributions to the paper as follows: study conception and design: Fangtong Jiao, Zhigang Du; data collection: Shoushuo Wang; analysis and interpretation of results: Fangtong Jiao, Yudan Ni, Rui He; draft manuscript preparation: Zhigang Du, Fangtong Jiao. All authors reviewed the results and approved the final version of the manuscript.
Declaration of Conflicting Interests
The author(s) declared no potential conflicts of interest with respect to the research, authorship, and/or publication of this article.
Funding
The author(s) disclosed receipt of the following financial support for the research, authorship, and/or publication of this article: This study was supported by the National Natural Science Foundation of China (No. 51578433) and the Independent Innovation Foundation of Wuhan University of Technology (No. 195202005).