
Abstract
A new decision support system (DSS) using travel time reliability was developed for integrated active traffic management (IATM) including freeways and arterials. The DSS consists of recommendation and evaluation of response plans. The DSS also includes three representative traffic management strategies: variable speed limits, queue warning, and ramp metering. The recommendation of response plans for recurring traffic congestion was generated from the logics of the three strategies. The evaluation of response plans was conducted by travel time reliability through the prediction of traffic conditions with response plans. The near-future prediction of traffic conditions with control strategies was conducted through METANET for freeways and arterials. The developed DSS was evaluated under three types of traffic congestion: extreme, heavy, and moderate. According to the evaluation results, the developed DSS recommended an IATM strategy with the highest synergistic relationships in real time and contributed to enhancing the effectiveness of the IATM strategies. It was confirmed that arterials should have the allowable residual capacity for the improvement of traffic flow of the entire corridor network. Furthermore, the DSS demonstrated a more balanced traffic condition between freeways and arterials.
As effective traffic congestion management strategies for recurring and non-recurring traffic congestion, active traffic management (ATM) and integrated corridor management (ICM) are typical cases integrating traffic management strategies such as variable speed limits (VSL), queue warning (QW), ramp metering (RM), and so on. ATM aims to maximize the effectiveness of ATM strategies by using the synergistic relationships between traffic management strategies through the integration of conventional systems independently operated. Additionally, the purpose of ICM is to exert synergy among networks by maximizing the utilization of the existing infrastructure assets such as freeways and arterials. A representative strategic area is load balancing, which deals with how commuters use the networks in a corridor. Load balancing can be performed by implementing RM, reversible lanes, hard shoulder lanes, and so on.
For the successful implementation of ATM, it is necessary to use a decision support system (DSS) since the integration of roadway networks and the combination of various traffic management strategies would make it difficult for human operators to decide a proper response plan or control measure. Thus, the DSS is required to provide integrated, coordinated, automated, and intensive traffic management ability for the human operators. Integrated active traffic management (IATM) is a concept developed by the authors to combine many of the above concepts. In a broad scope, the DSS aims to recommend the best suitable control measure among multiple alternatives or combinations of them for mitigation of recurring and non-recurring traffic congestion ( 1 ). In a narrow scope, the DSS was developed to support specific decisions such as prediction-based route guidance, optimal detour routes, safety and efficiency of work zones, detection of traffic events, and weather-responsive traffic operation ( 2 – 5 ). These kinds of DSS were developed through various algorithms and techniques: analytical hierarchical process, knowledge-based decision support, simulation-based decision support, and intelligent-systems-based decision support ( 1 , 2 , 4 , 6 – 9 ). Overall, a DSS for traffic management has functionalities to identify current and near-future traffic conditions in real time and recommend a proper response plan regarding the identified event. In summary, the existing DSSs in the field mainly focus on non-recurring traffic congestion and are handled with other performance measures regardless of travel time reliability.
Among various effective aspects of ATM and ICM, a representative performance measure is travel time reliability, which has become an important topic for the transportation systems management and operations community, since one of their many goals is to improve the travel time reliability on the roadway network. The concept and metrics of travel time reliability have been defined and developed in various perspectives which can be categorized as: statistical range measures, buffer time measures, tardy-trip measures, and probabilistic measures ( 10 , 11 ). In relation to the reliability analysis of link/segment/route/network travel time, modeling of travel time uncertainty has been developed through the analytical approach ( 12 ), statistical approach ( 13 – 16 ), and simulation ( 17 , 18 ).
Previous research on travel time reliability has been conducted to find suitable measures of travel time reliability, to estimate well-fitted models representing travel time distributions, and to describe the effectiveness of traffic management strategies. However, there is no research about how to use travel time reliability directly in DSS for traffic management systems. Considering travel time reliability at the time of decision of ATM strategies, is expected to achieve more reliable travel time for travelers, and for operators to manage traffic in relation to travel time reliability.
This research aims to develop a DSS of IATM to make decisions by integrating travel time reliability into the concept of ATM and ICM. Specifically, the DSS focuses on the mitigation of recurring congestion by maximizing the synergistic relationships between ATM strategies and balancing traffic conditions between freeways and arterials. The DSS will integrate traffic management of freeways and arterials by using two main functions: recommendation of response plans and effectiveness evaluation of response plans. Based on the predicted traffic conditions, real-time new response plans are generated through the logic of three strategies: VSL, QW, and RM. In real time, the DSS would recommend the best alternative between existing control values of the three strategies and newly generated values to maximize the overall travel time reliability including freeways and arterials.
DSS Configuration for IATM
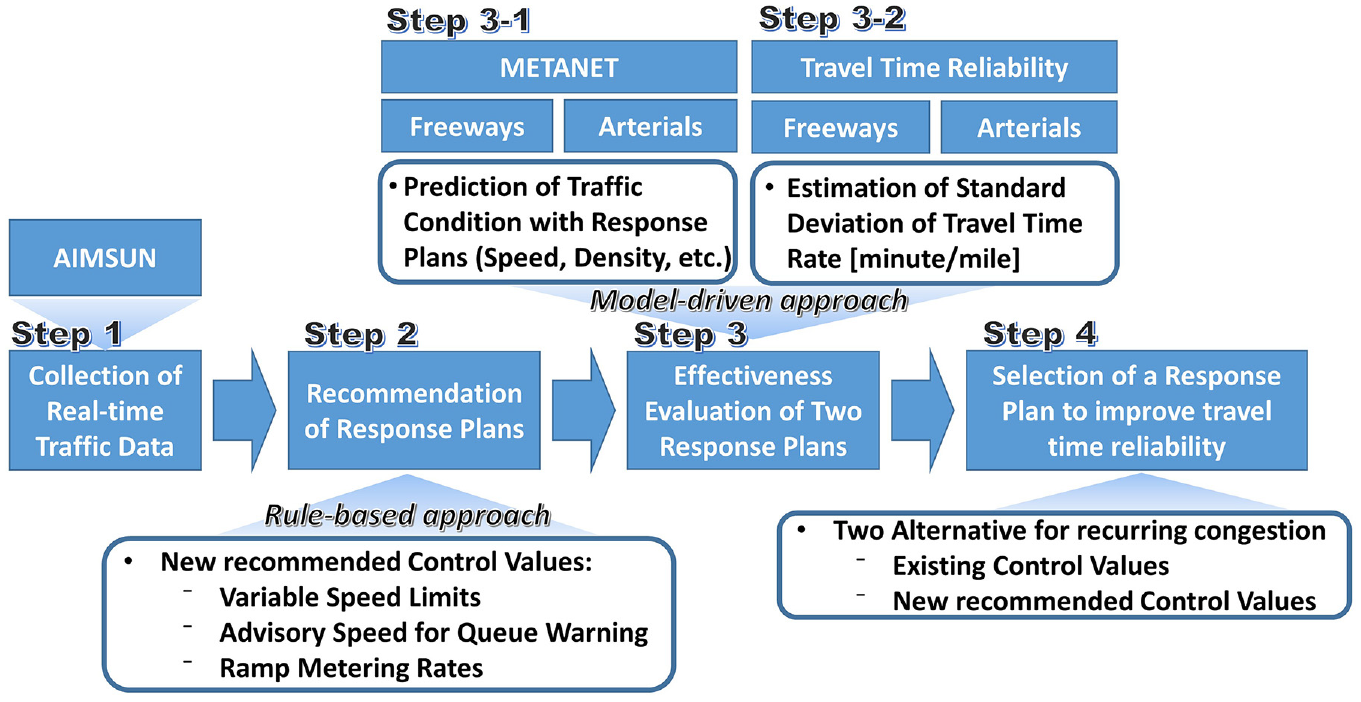
The developed DSS consists of several components: collection of real-time traffic data, recommendation of response plans, evaluation of effectiveness of response plans, and selection of a response plan (see Figure 1). Since the current DSS cannot be linked to the real-time traffic operation, AIMSUN traffic simulation is used instead in step 1. The calibration and validation of AIMSUN are explained in the setup of the AIMSUN simulation environment. Based on real-time traffic data, a new possible response plan for segments between interchanges on the corridor networks is created through the combination of the control rules of VSL, QW, and RM strategies for the recurring traffic congestion at step 2. The logic of each control rule is selected and adjusted by considering the practical implementation although there are many complicated logics. The details of the control rules are described in the rules of ATM strategies.
Decision support system configuration.
As a core part of the DSS, the effective evaluation of response plans uses two models: METANET to predict the near-future traffic status depending on control values of the three strategies and a travel time variability estimation model using the standard deviation of travel time rate. At step 3, METANET uses the new recommended response plan and the existing response plan individually to predict the near-future traffic conditions arising from the two response plans, respectively. The response plan consists of control values for segments along with the corridor network. Based on the near-future traffic conditions predicted by the two response plans, the developed model for travel time reliability provides the anticipated near-future travel time variability of two response plans. At step 4, the DSS finally selects the best alternative between existing control values of the three strategies and newly generated values by comparing the overall travel time reliability of the entire corridor network including freeways and arterials.
Setup of AIMSUN Simulation Environment
AIMSUN dynamically defines traffic demand data through a traffic demand profile using origin-destination (OD) matrices and path assignment. The traffic demand profile has the percentage of trips in 15-minute intervals. The OD matrix was adjusted through real data sets. Furthermore, the demand variation was generated by applying different random seeds in AIMSUN. The random seed approach provides some variability of either one or all of network loading (i.e., vehicle behavior), traffic management, traffic assignment (i.e., vehicle routes), or vehicle parameters. Thus, each simulation scenario was executed 30 times with different random seeds and statistical validity was thus achieved.
Study Site
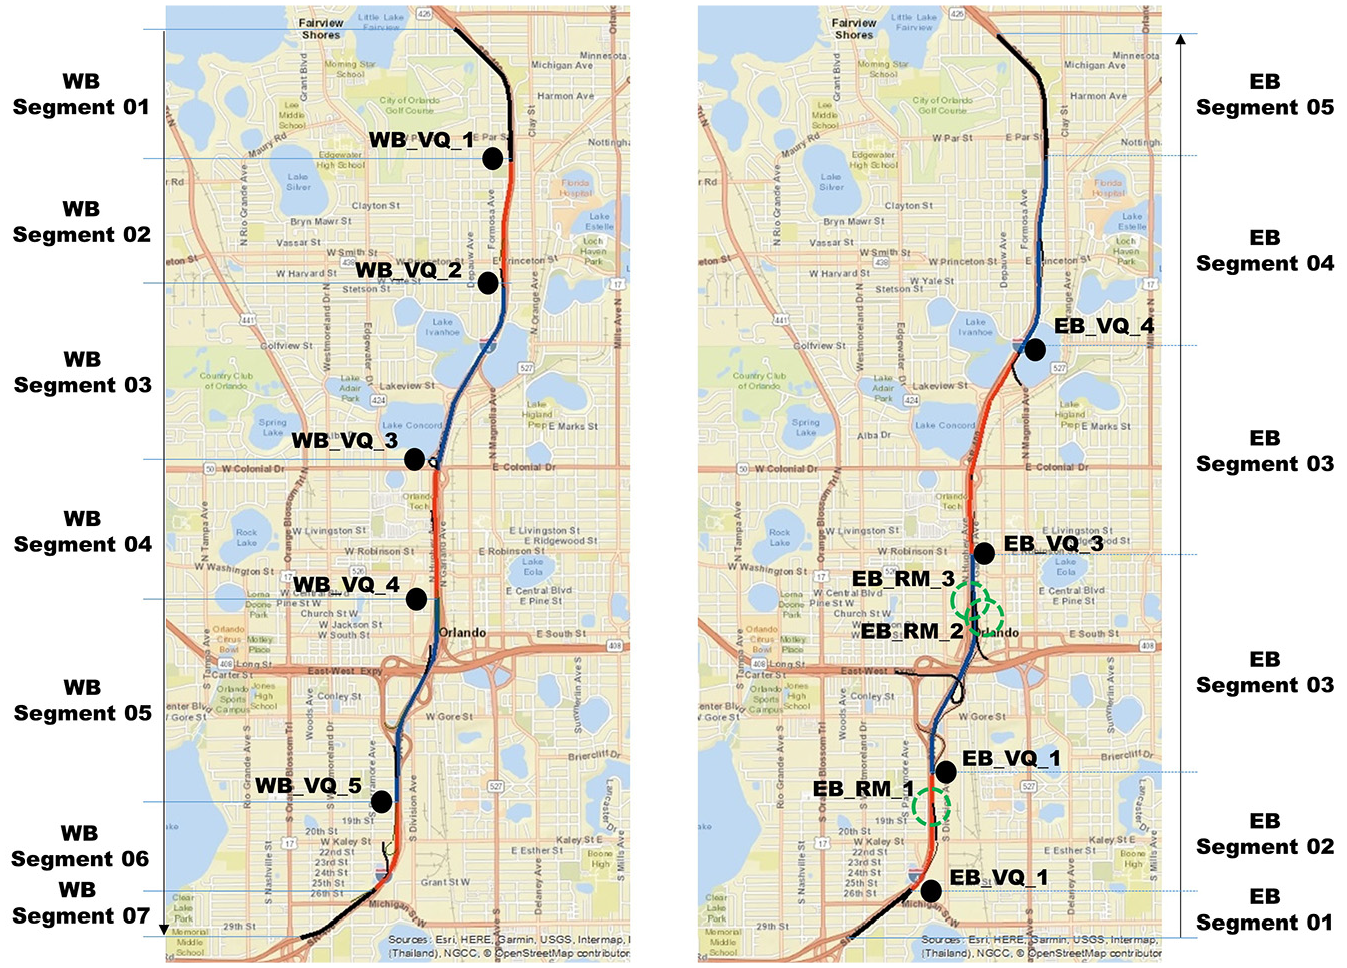
An Interstate 4 corridor network in the Orlando CBD area between West Michigan Street and East Par Street was chosen, which has the most congested bottlenecks in the Orlando Metropolitan area (see Figure 2). This study site provides an opportunity for different analysis of effectiveness under dynamic traffic conditions. The posted speed limit on this 6-mi freeway is 55 mph. There are nine on-ramps on the eastbound direction in the study site and eight in the westbound direction.
Study site.
Considering the general guide for deploying VSL, the VSL locations were placed at major segments, which are separated by interchanges. Nine VSL locations were selected, four for the eastbound and five for the westbound directions. The average installation spacing is about 1 mi. Figure 2 shows the exact locations and segments of VSL. In addition, QW signs are located in the same location as VSL, because VSL and QW would usually be integrated in a composite gantry and also the QW strategy could be implemented as an extension of VSL.
While RM has many benefits, it might not be applicable for every freeway on-ramp. Rigorous selection of the potential locations of RM deployment must be conducted. According to the RM warrants for the State of Florida ( 19 ), only three ramps, which are the on-ramp connecting Kaley St with I-4 Eastbound (EB_RM_1), the on-ramp connecting Anderson St with I-4 Eastbound (EB_RM_2), and the on-ramp connecting South St with I-4 Eastbound (EB_RM_3), were selected.
Calibration and Validation
Traffic counts and the travel time aggregated in each 15-minute interval during the morning peak hour (07:00–09:00) were used to calibrate and validate the microscopic area with lower acceptable bound of error. There are two main parts to calibrate the parameters to achieve good validation criteria: (a) dynamic traffic assignment or route choice and (b) microscopic parameters. After calibrating the parameters, the GEH statistic was calculated for the study area. The GEH statistic is a measure to compare two sets of traffic volumes. From the microscopic calibration results, Downtown Orlando area achieved 86% of GEH less than 10, which represents reasonable calibration for the microscopic area based on simulation guidelines.
Furthermore, to create reasonable simulation scenarios representing real-world traffic flow in the Orlando area, possible scenarios related to IATM can be created on the basis of different traffic congestion and possible operational strategies of IATM. Thus, the effectiveness of the IATM system on a corridor network linking freeways/expressways and arterials was analyzed according to different traffic congestion levels. The traffic congestion of freeway/expressway in corridor networks was categorized into three classes:
Extreme traffic congestion: Average vehicle speed less than 25 mph
Heavy traffic congestion: Average vehicle speed between 25 mph and 35 mph
Moderate traffic congestion: Average vehicle speed between 35 mph and 45 mph
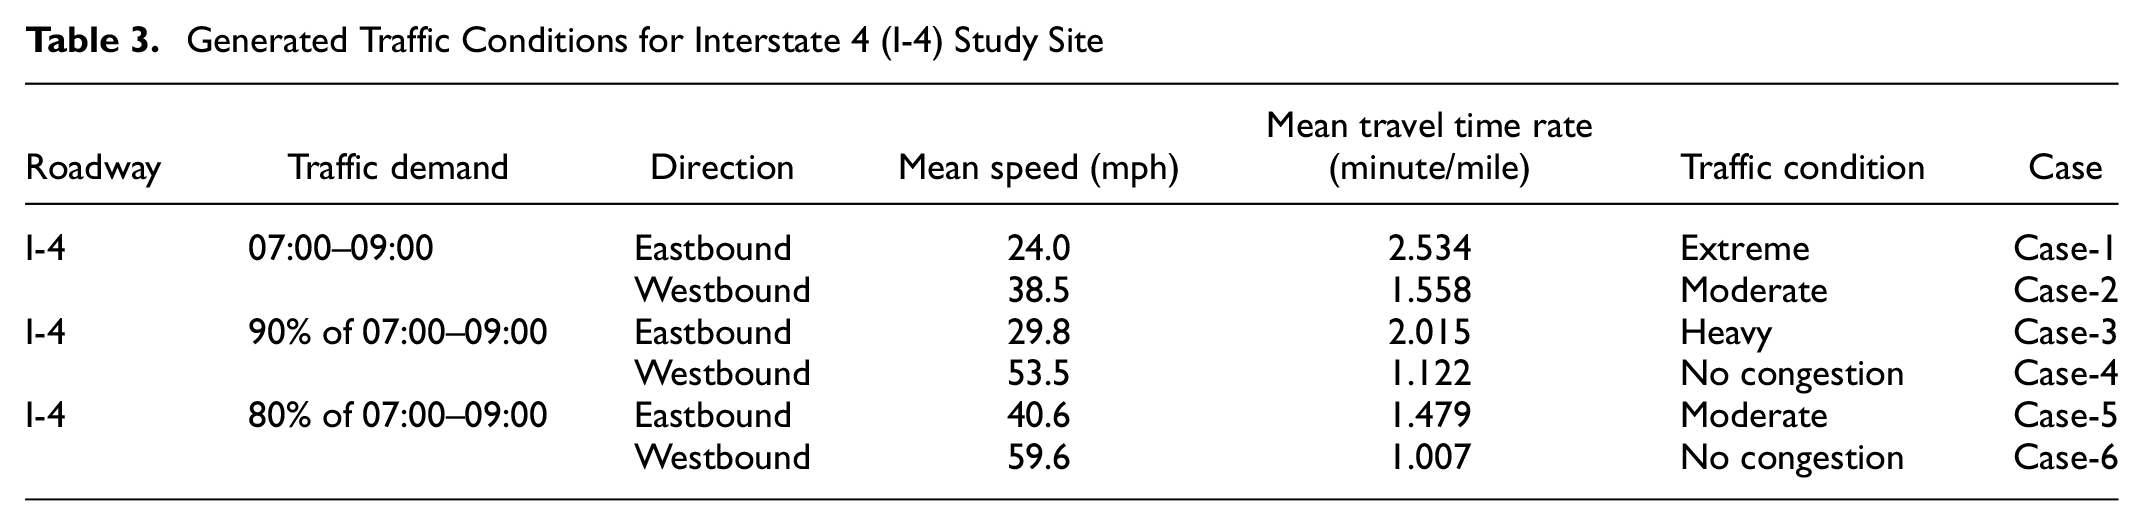
According to the results of the calibration and validation of AIMSUN, the eastbound and westbound of I-4 experience extreme and moderate traffic congestion. To generate different traffic conditions, in addition to the actual demand, the traffic demand of I-4 was also adjusted to create various conditions. The traffic demand of I-4 was reduced by 80% and 90% of the original traffic demand to examine the IATM strategies and the DSS. Table 1 includes the generated traffic conditions created from the adjusted traffic demand.
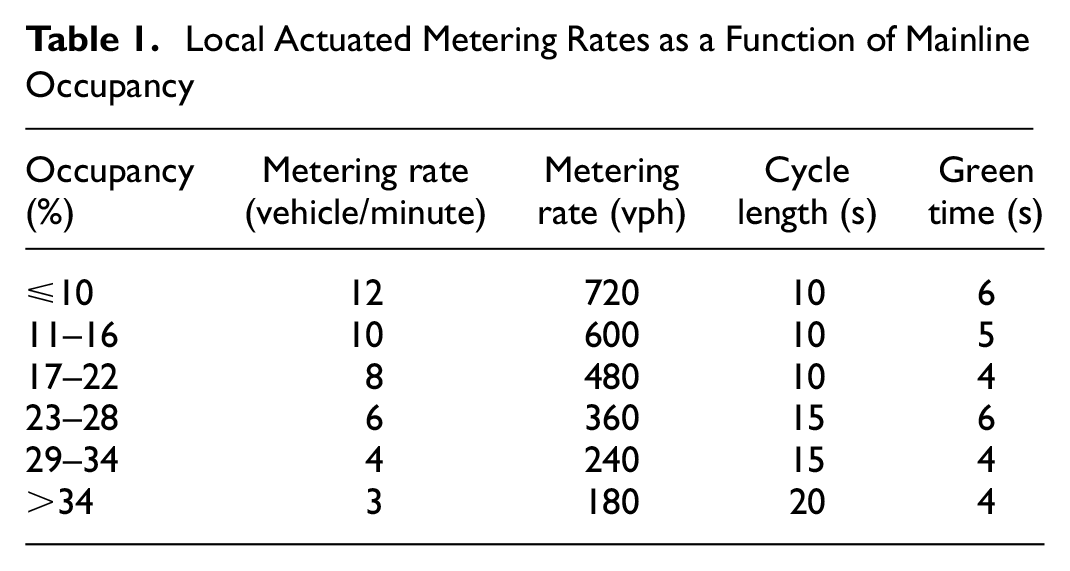
Local Actuated Metering Rates as a Function of Mainline Occupancy
Rules of ATM Strategies
For the development of a feasible DSS, practically implementable control logics were considered to generate rule-based response plans for recurring traffic congestion. These were selected for practical implementation by reviewing the existing operational ATM systems. By evaluating the results of possible operational strategies of IATM, it was confirmed how the selection of the alternative providing higher travel time reliability contributes to less congestion, less travel time, and good load balance.
VSL Control Rule
Although numerous advanced VSL algorithms have been developed, many agencies are still using simple reactive rule-based algorithms which have shown various benefits for traffic safety or efficiency in previous research ( 20 – 22 ). Considering applicability in the field and scalability in traffic simulations, a simple but representative online VSL algorithm was developed in this study. The basic logic is that speed limits are changed toward the 85-percentile speed if there is a difference between the posted speed limit and the 85-percentile speed. This kind of logic has been applied in the states of Florida, Oregon, and Washington ( 22 ).
Additionally, operational constraints proved in the previous research were considered to make sure that the implemented VSL would not introduce any negative safety impacts. The constraints are as follows:
The maximum difference between two neighboring posted speed limits should be 10 mph (spatial constraint) ( 23 ).
The maximum difference between two consecutive VSL control time steps should be 10 mph (temporal constraint) ( 23 , 24 ).
An increment of VSL should be 5 mph ( 25 ).
VSL should be updated by five minutes ( 23 ).
The minimum variable speed limit should be 40 mph ( 24 ).
The posted speed limit should never exceed the design speed on the freeway.
QW Control Rule
QW can be provided by alert messages (e.g., “STOPPED VEHICLE AHEAD”, and “SLOW VEHICLE AHEAD”) or recommended speeds. QW systems in ATM can often now be regarded as an extension of VSL systems ( 26 , 27 ), because QW signs can be displayed as warning messages with either recommended speeds or lane control signs. In this study, the recommended speed was used for precise traffic control. To implement a QW algorithm with recommended speeds, three aspects were considered:
Detecting segments in which queues exist
Deciding recommended speeds in segments with queues
Guiding speed reduction gradually
For the QW activation, segments with queues should be detected. The existence of a queue in a segment was determined to be when the average speed of the segment is less than 40 mph. Thus, VSL and QW could be activated and separated at different speed ranges consistently. When the average speed of segments is more than 40 mph, speed limits would be determined through a VSL algorithm. On the contrary, the QW algorithm would work in case of less than 40 mph. Recommended speeds in segments with queues are determined:
40 mph, if the average speed of a segment is between 35 and 40 mph
35 mph, if the average speed of a segment is between 30 and 35 mph
30 mph, if the average speed of a segment is between 25 and 30 mph
25 mph, if the average speed of a segment is between 20 and 25 mph
20 mph, if the average speed of a segment is less than 20 mph
For the gradual speed reduction of traffic upstream from a segment under queue state, the size of the gradual speed reduction was determined as a constant value of 5 mph. A maximum of two upstream segments from the segment under queue state were controlled for the gradual speed reduction. Depending on the recommended speed of segments with queues, if the upstream segments are not under queue state, the recommended speeds for the upstream segments are determined:
When the recommended speed for the queue segment is 40 mph, the first upstream segment is 45 mph and the second upstream segment is 50 mph.
When the recommended speed for the queue segment is 35 mph, the first upstream segment is 40 mph and the second upstream segment is 45 mph.
When the recommended speed for the queue segment is 30 mph, the first upstream segment is 35 mph and the second upstream segment is 40 mph.
When the recommended speed for the queue segment is 25 mph, the first upstream segment is 30 mph and the second upstream segment is 35 mph.
When the recommended speed for the queue segment is 20 mph, the first upstream segment is 25 mph and the second upstream segment is 30 mph.
RM Control Rule
Representative traffic responsive metering was applied in this research. The traffic responsive metering is directly affected by the current traffic state on mainline and ramp. The metering rate is selected based on the real-time traffic variable (e.g., occupancy). In traffic responsive metering, the control logic also can be divided into closed loop and open loop control. Closed loop control is a feedback control to incorporate updated measurements in addition to the initial state (e.g., ALINEA ( 28 )). In open loop control, one of many predefined metering rates is selected based on the current measurement, which can be easily integrated with other strategies.
In this study, an open loop control method was selected, which can provide predefined metering rates based on traffic variables such as occupancy and volume. With reference to the previous studies ( 29 ), local actuated metering rates were applied. Table 2 shows that the actuated metering rates can be selected according to the mainline occupancy. The cycle length and green time were tested and adjusted to generate the predefined metering rate in the microscopic traffic simulation.
Results of the Tobit Model to Calculate the Standard Deviation of TTR
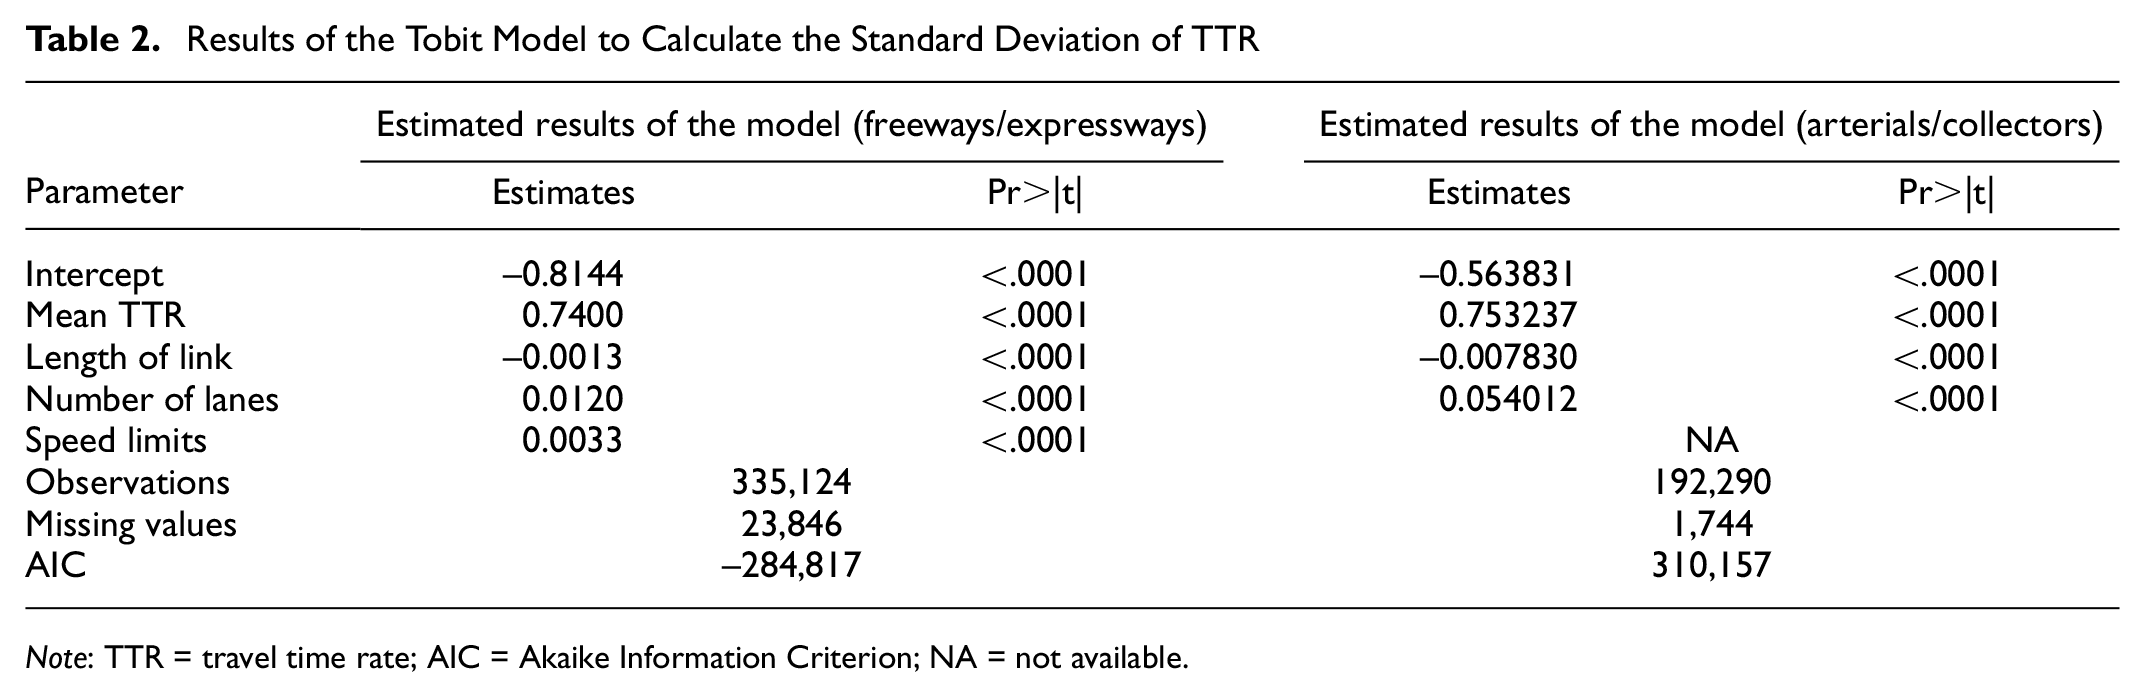
Note: TTR = travel time rate; AIC = Akaike Information Criterion; NA = not available.
Macroscopic Traffic Flow Model for the Freeway and Arterial Network
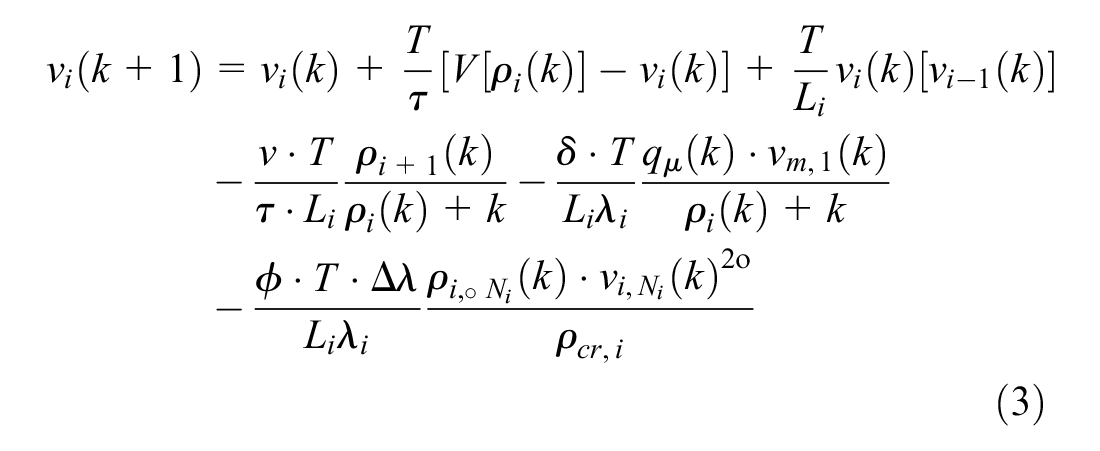
Considering the applicability of various ATM strategies and the integration of freeways and arterials, the well-known METANET model was utilized, a deterministic macroscopic modeling tool using a second-order traffic flow model ( 30 ). The METANET model is able to simulate all types of traffic statuses, incidents reducing capacity, and also traffic control actions such as RM, VSL, and so on.
Freeway Traffic Model
In the METANET model, the macroscopic traffic flow is described through the definition of adequate variables representing the average behavior of the vehicles at certain freeway segments i and times t (
31
). Freeway stretches are split into segments with length of


where
To illustrate a flow-density diagram regarding speed limit, a quantified model was used, which was developed by Papageorgiou et al. ( 30 ). The impact of the control of speed limits on the flow-density diagram is quantified as follows:


where
By using traffic data collected from AIMSUN simulation, constant parameters of METANET were calibrated through the deterministic Nelder-Mead algorithm, which can provide converged robust model parameter sets and also reduce computation time (
34
). The calibrated parameters are
Arterial Traffic Model
In this study, it is necessary to consider not only freeways but also arterials to develop the DSS. Therefore, a METANET for arterials was developed and integrated with a METANET for freeways. The METANET for arterials should describe traffic congestion realistically and reflect the effect of strategies on arterials. For example, when RM is being implemented on a freeway, it should reflect the effect of the queue on the arterial. However, a complicated model for arterials could cause a computational inefficiency, so a simple model is proposed.
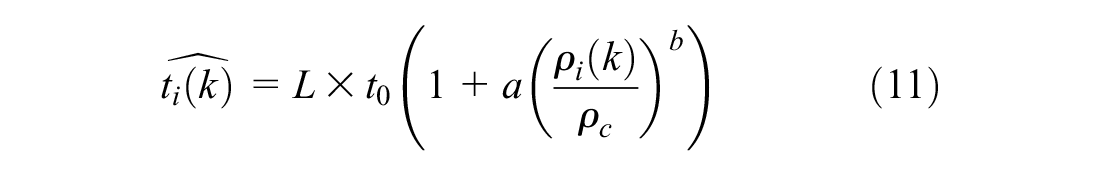
This study presents a simple model to estimate travel time in a link based on density. This method is similar to the volume-delay function or link-congestion function that reproduces traffic speed or travel time in a link based on traffic volume. The volume-delay function can reproduce congestion effects in macroscopic models and can be applied for various purposes. However, there was a limitation in the application to the operational level (i.e., controlled by vehicle unit) because of the assumption that the volume can exceed capacity ( 35 ). This assumption could lead to unrealistic results in congested traffic in relation to traffic operations ( 35 ). To overcome this issue, the METANET for arterials is presented by using density instead of volume.
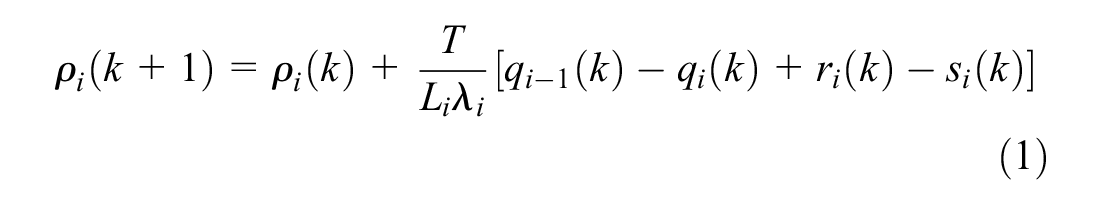
This model considered the traffic flows of adjacent arterials and ramps entering and leaving a target link. As shown in Figure 3, in the target link i, the inflow,


where
where,
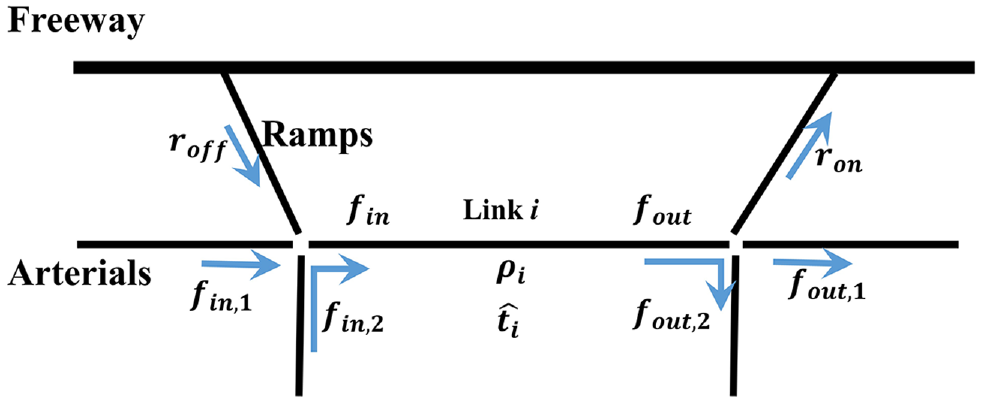
METANET for arterial.
Travel Time Reliability Model
Among various measures of travel time reliability, the standard deviation (SD) of travel time rate (TTR) was selected. Based on previous research findings that there is a linear relationship between the TTR and its SD ( 37 , 38 ), additional impact factors were considered. A model to estimate the SD of mean travel time was developed using the Tobit modeling method with censored data. In the case of the SD, which is the dependent variable in this study, the value cannot become less than zero. Therefore, it would be proper to use the Tobit model as a censored regression model:


where
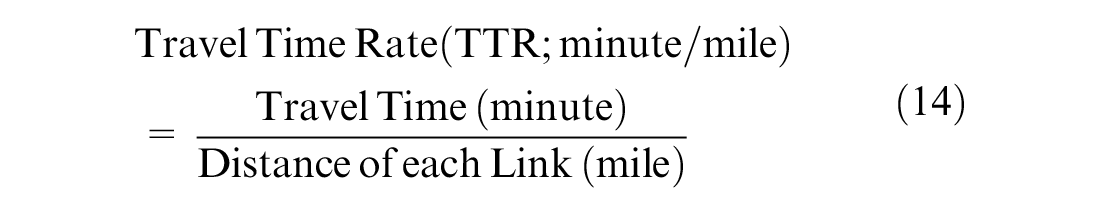
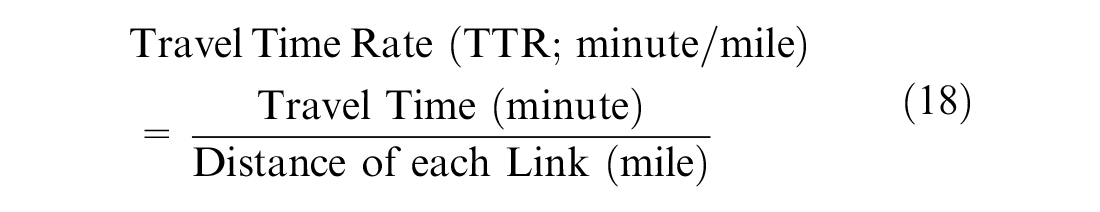
Regarding the data preparation, the traffic data were obtained from the automatic vehicle identification system of the Central Florida Expressway Authority for individual travel times, and the National Performance Management Research Dataset for mean travel time. Speed limits and the number of lanes of each link were collected from the Roadway Characteristics Inventory database. The collected travel times were converted into TTR by the distance of each link as follows:
After link-mean TTR and its SD were aggregated at five-minute intervals, the SD estimation model was developed for freeways/expressways and arterials/collectors. Table 3 shows the results for the Tobit model to calculate the SD of TTR for freeways/expressways and arterials/collectors, respectively. The developed model for arterials/collectors did not include speed limits because of the limitations of data collection. Based on the model, travel time reliability could be evaluated. According to the exploration and modeling results, TTR and its SD have a positive statistically significant relationship at the link level.
Generated Traffic Conditions for Interstate 4 (I-4) Study Site
Finally, SDs of TTR were aggregated for the selected routes or network. Usually, vehicle miles traveled (VMT)-weighted or distance-weighted mean values were computed to obtain the aggregated evaluation measures for freeways and arterials/collectors. In this study, the VMT-weighted mean method at each time slot was used as follows:
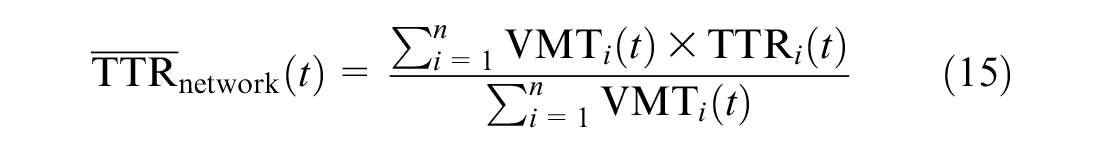
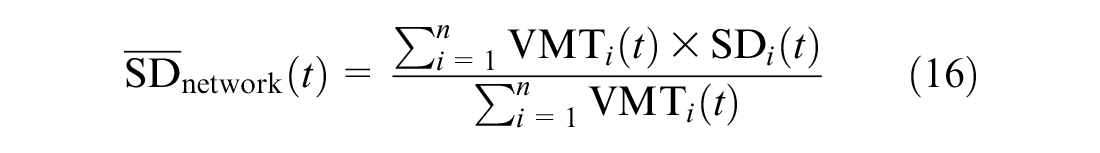
where
Evaluation Results of Possible Operational Strategies of IATM
The IATM system on a corridor network linking freeways/expressways and arterials can be built in various forms. Since the IATM will have at least two strategies, stand-alone systems such as VSL, QW, and RM were not included in the possible operation strategies of IATM. Also, VSL/QW was excluded since it relates only to freeways. So, for the evaluation of the developed DSS, four types of system regarding the IATM strategies can be established, as follows:
VSL and RM without DSS (VSL/RM)
QW and RM without DSS (QW/RM)
VSL, QW, and RM without DSS (VSL/QW/RM)
VSL, QW, and RM with DSS through METANET (DSS)
Each type was executed 30 times with different random seeds and the average result was reported for the final evaluation. A total of 120 simulations were conducted. Simulation results were analyzed from three aspects: freeway, arterial, and overall network. The effects of DSS are analyzed in two scopes: the eastbound I-4 and the I-4 adjacent arterials. Specifically, DSS on the eastbound of I-4 was operated to select the best control value balancing traffic congestion of both freeways and arterials among the combinations of control values of VSL, QW, and RM. The westbound of I-4 was excluded because there is no RM.
The effectiveness of the IATM system on a corridor network linking freeways/expressways and arterials was analyzed under the several traffic congestion. The traffic congestion was classified according to average vehicle speed:
Extreme traffic congestion: Average vehicle speed less than 25 mph
Heavy traffic congestion: Average vehicle speed between 25 mph and 35 mph
Moderate traffic congestion: Average vehicle speed between 35 mph and 45 mph
According to the generated traffic conditions for I-4 (see Table 1), the westbound of I-4 has three types of traffic congestion: extreme, heavy, and moderate.
In this research, the evaluation of possible operational strategies of IATM was intended to reveal whether the developed DSS would enhance the synergistic relationships among traffic management strategies, and the load balancing concept between freeways and arterials on the corridor network under recurring traffic conditions. It is difficult to calculate definitively and specifically the synergistic relationships among traffic management strategies, and the results of load balancing on the complicated corridor networks under the multiple dynamic traffic demand during recurring traffic congestion. Hence, the global evaluation results are statistically compared with cases tested in DSS with other cases with/without traffic management strategies through the aggregated traffic condition indicators.
Though there are many kinds of roadway traffic condition indicators to evaluate transportation problems and solutions, this research focused on the travel time index (TTI) and the TTR (minute/mile). The traffic congestion of roadways and their segments can be measured by the TTI. The TTI is defined as the ratio of average travel time to a free-flow or speed-limit travel time:
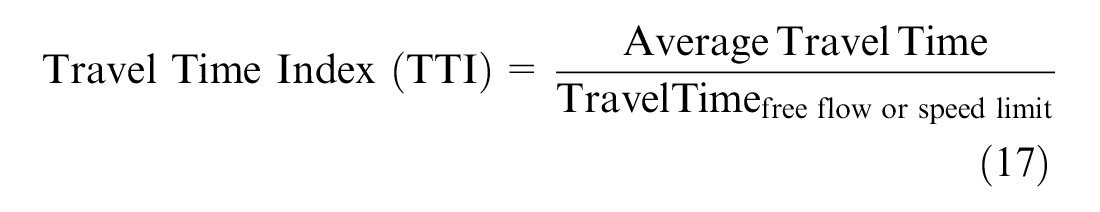
The TTI represents how much longer travel time is spent on average on the basis of the ideal traffic condition. All travel times were converted into TTR through normalization by the distance of each link as follows ( 11 , 39 ):
The effectiveness of the DSS was separately analyzed according to the traffic congestion level: extreme, heavy, and moderate. The effectiveness of DSS was compared with VSL/RM, QW/RM, and VSL/QW/RM individually on the entire network, freeway, and arterials. The comparison results were tested statistically through the paired test. To help understand the comparison results, scatter charts were used to show intuitively whether the traffic conditions at the corridor network level were improved or not. In the scatter charts, the x-axis represents TTR or TTI of freeways and the y-axis TTR or TTI of arterials. For example, it can be interpreted that if some points are positioned at the bottom left of the reference data, the performance of the points was better than the reference data in both aspects: freeways and arterials.
Extreme Traffic Congestion
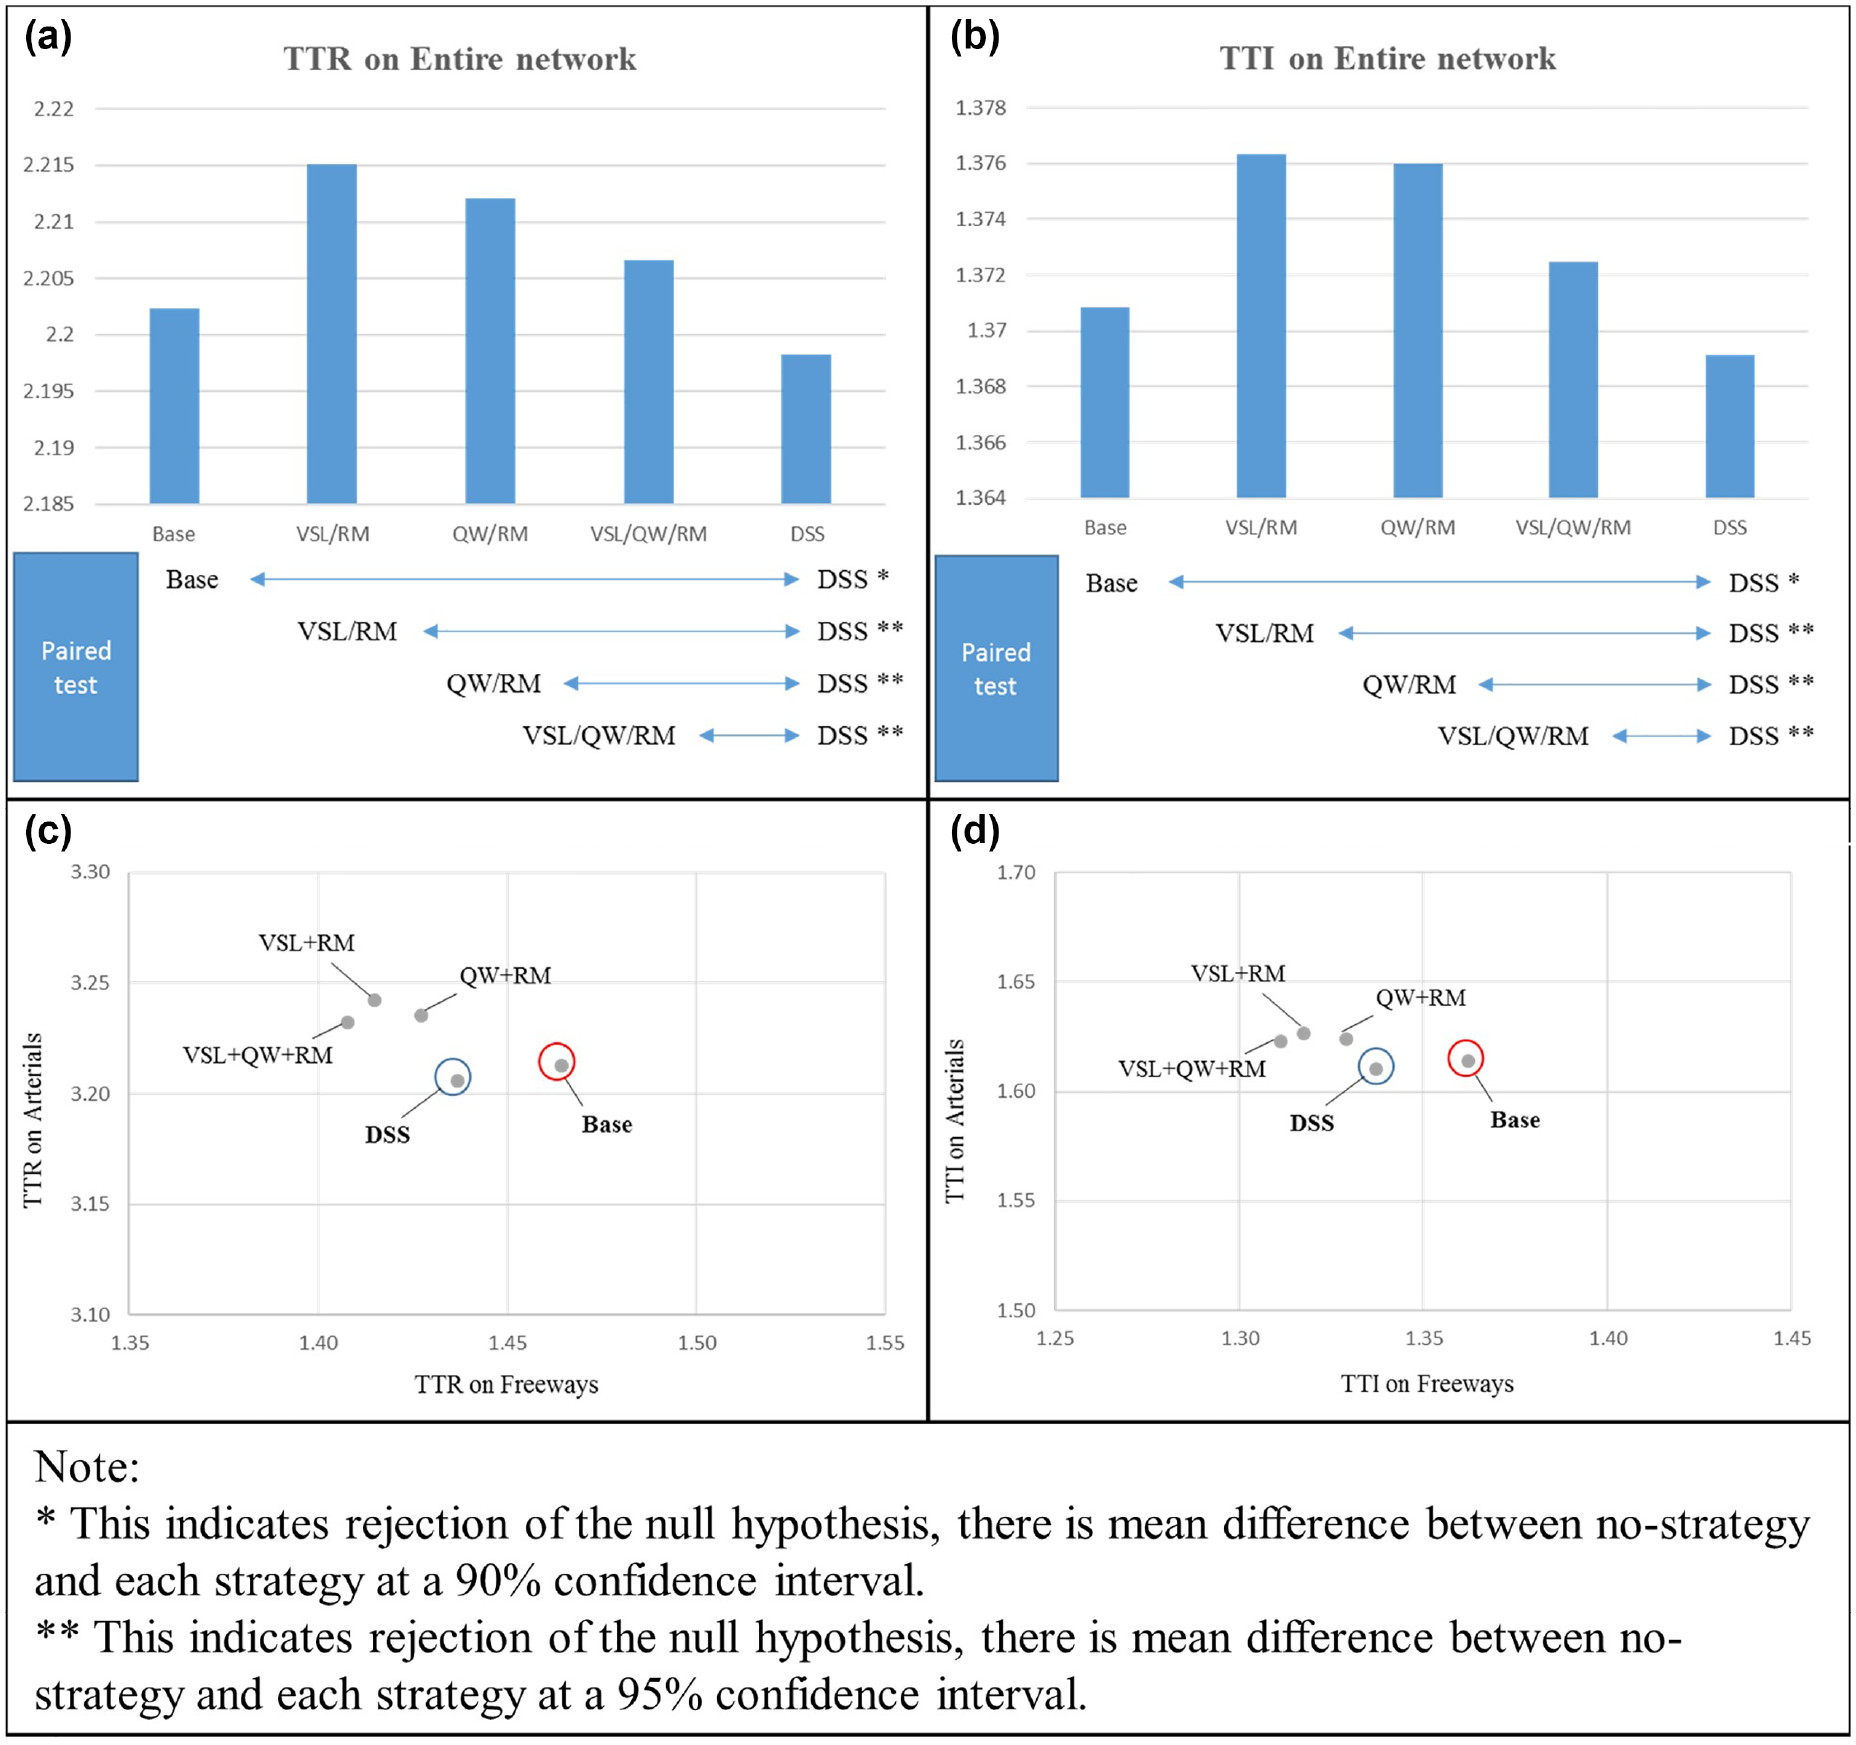
Figure 4a and b show that all IATM strategies with/without DSS have higher TTR and TTI than the base condition in the extreme traffic condition of the entire network in the downtown I-4 corridor network. Rather, the DSS improved TTR and TTI more than the simple IATM systems: VSL/RM, QW/RM, and VSL/QW/RM. Statistically, the DSS significantly improved performance more than VSL/RM, QW/RM, and VSL/QW/RM at a 95% confidence interval. Specifically, Figure 4c and d show how the DSS has an impact on freeways and arterials. All types of IATM strategies are located at the top left of the base condition, which means that they improved the traffic condition of freeways, but they did not improve arterials. Relatively, the DSS mitigated the adverse impact on arterials of VSL/RM, QW/RM, and VSL/QW/RM. Because of that, the DSS achieved great improvement of freeways by mitigating the adverse impact on the entire network. In addition, in extreme traffic congestion on the corridor network, there may be a limitation on improving both freeways and arterials. Nevertheless, the DSS achieved more balanced traffic conditions across the entire network than the simple IATM system without DSS (VSL/RM, QW/RM, and VSL/QW/RM). Moreover, it would be expected that adaptive signal control strategies integrated with the ATM strategies would even further improve the whole network. This could be a possible extension, however, it is not within the scope of this study.
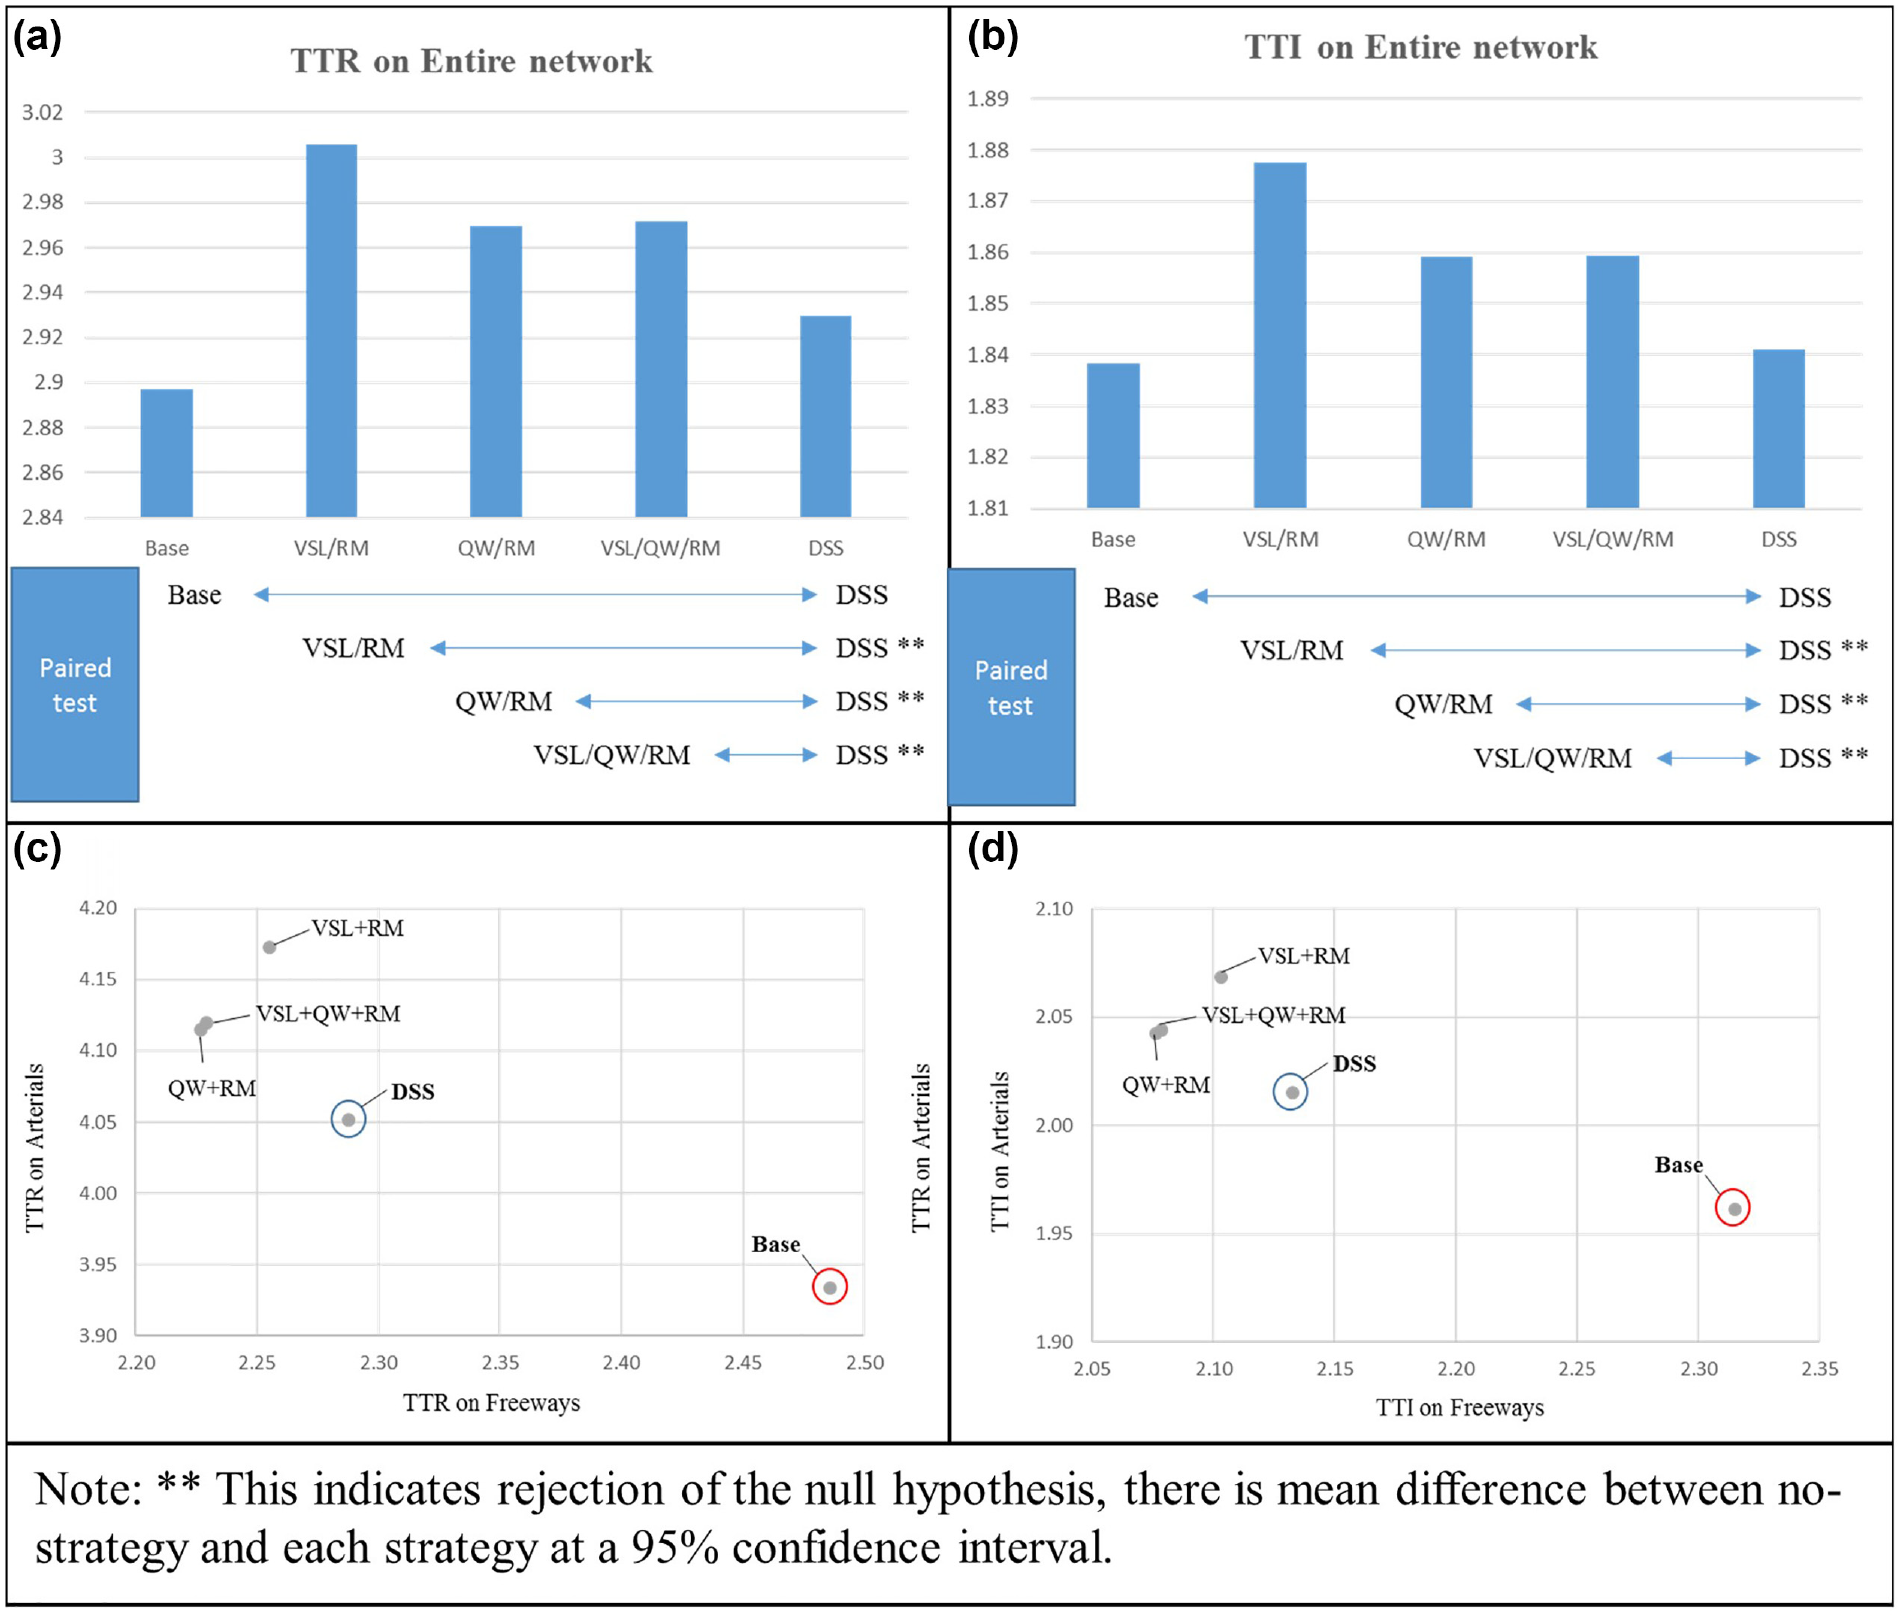
Travel time rate (TTR) and travel time index (TTI) under extreme traffic congestion: (a) TTR on entire network, (b) TTI on entire network, (c) scatter plot of TTR, and (d) scatter plot of TTI.
Heavy Traffic Congestion
Different from the results under extreme traffic congestion, Figure 5a and b shows that DSS could improve traffic conditions in relation to the entire network. However, the improvement is not statistically significant. As shown in Figure 5c and d , it should be noted that the DSS is located at the bottom left of the base in both TTR and TTI. This effect shows that the benefit of the DSS could be greater in heavy traffic congestion than in extreme traffic congestion. It is also believed that this effect is because of the allowable residual capacity of arterials in heavy traffic congestion. This is because the TTI of arterials (between 1.75 and 1.85) in heavy traffic congestion is smaller than the TTI of arterials (between 1.95 and 2.10) in extreme traffic congestion.
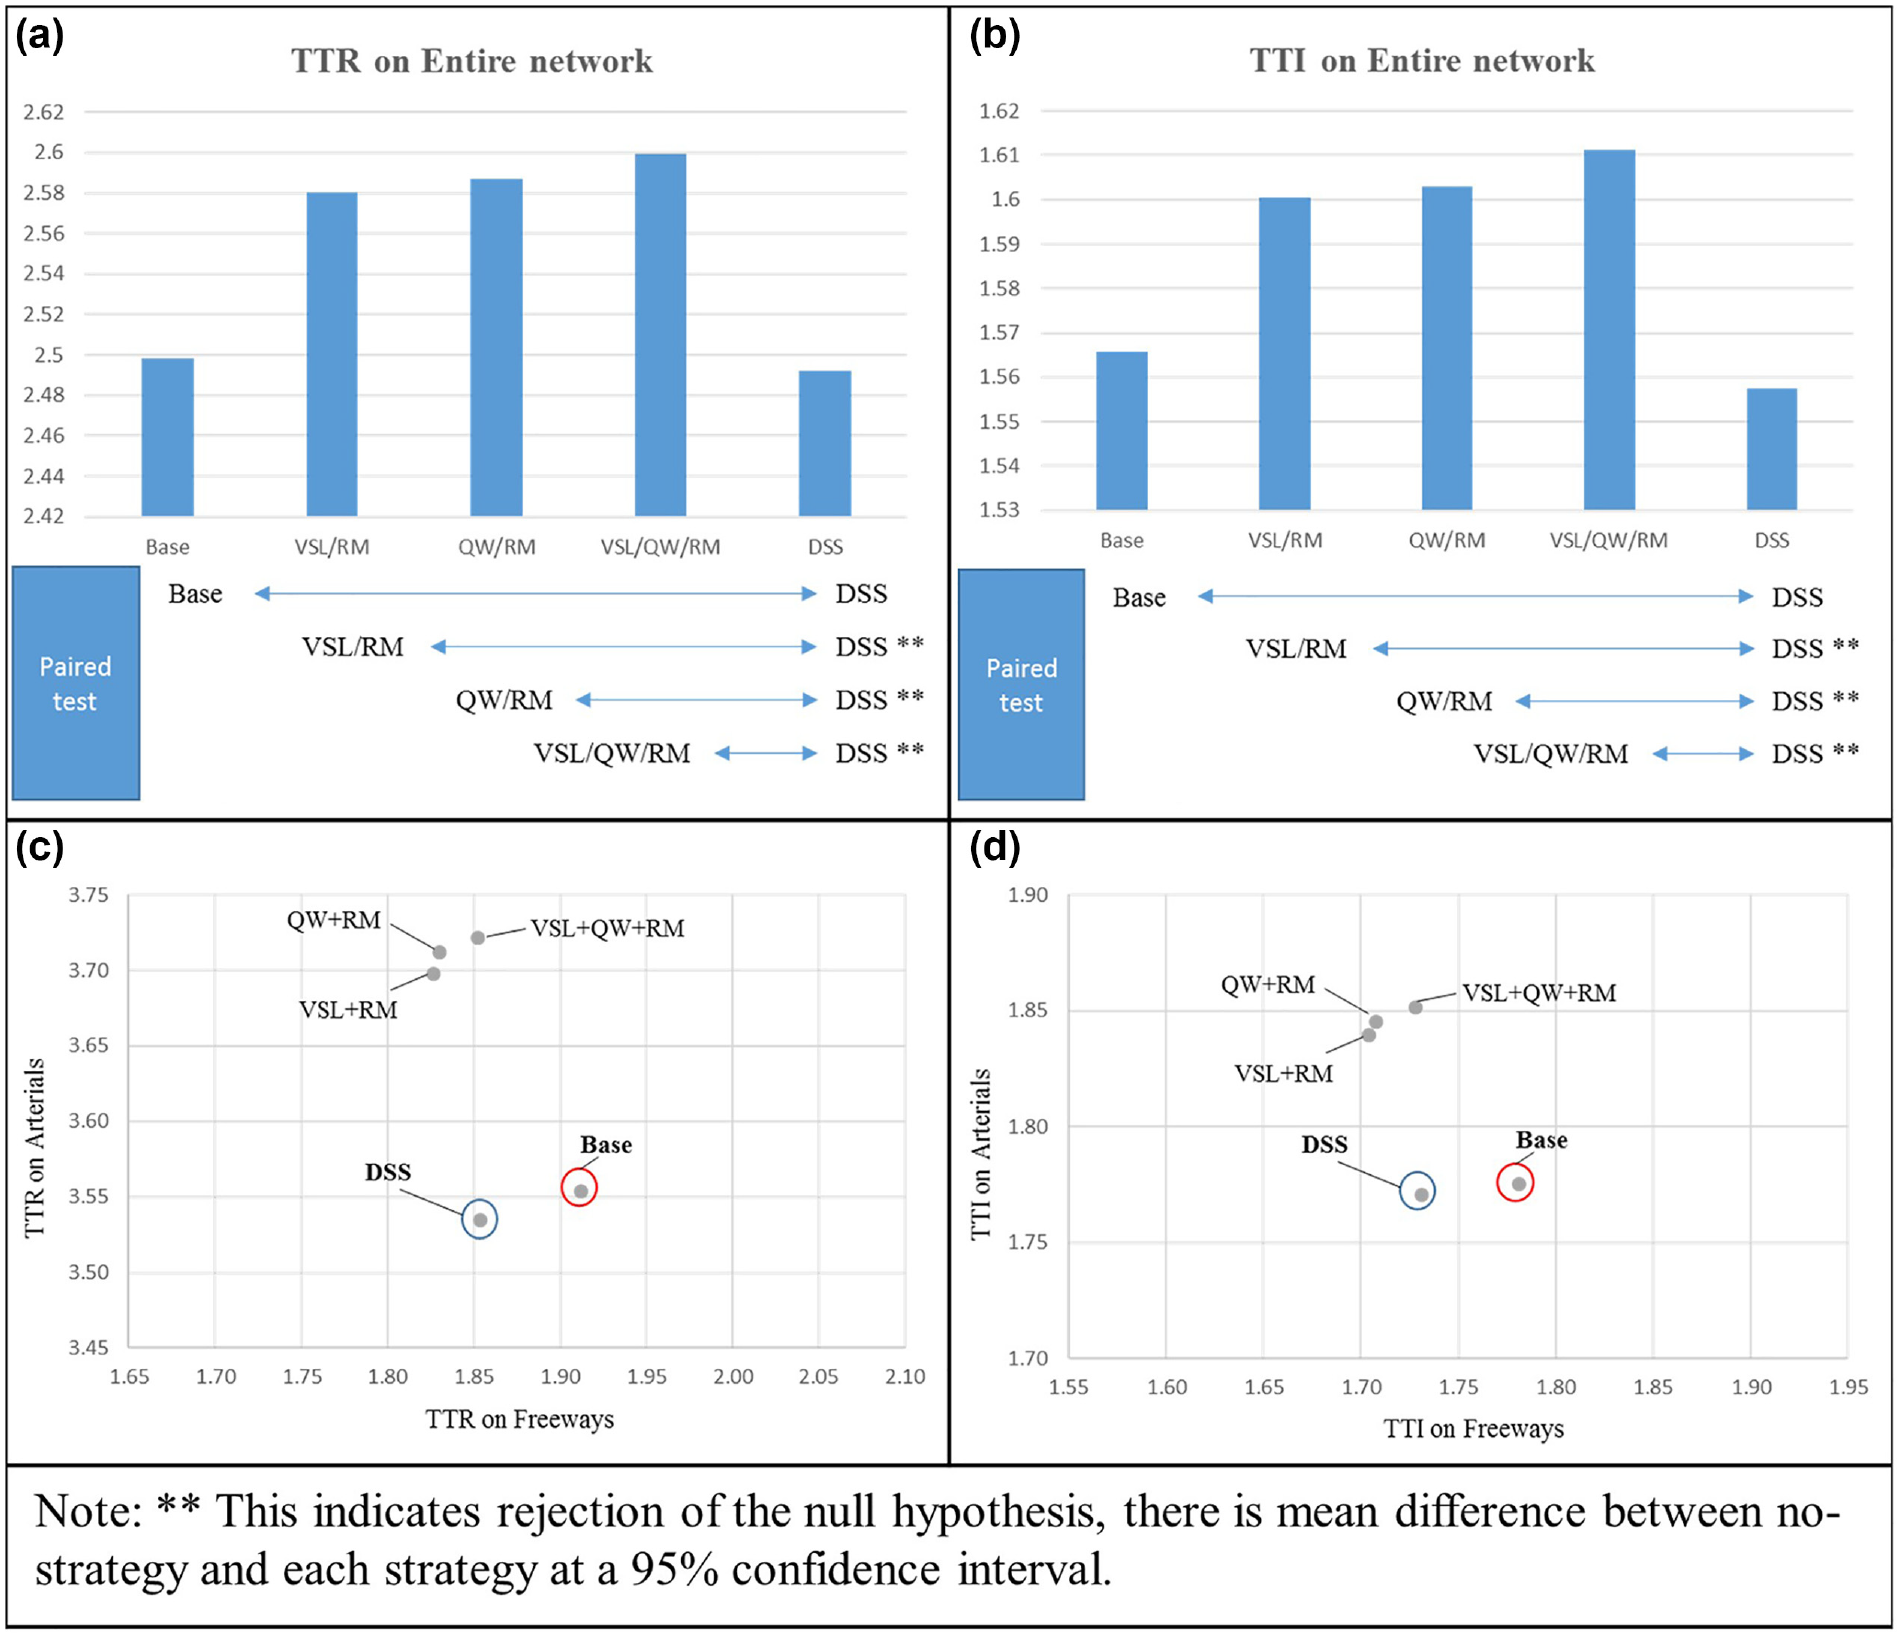
Travel time rate (TTR) and travel time index (TTI) under heavy traffic congestion: (a) TTR on entire network, (b) TTI on entire network, (c) scatter plot of TTR, and (d) scatter plot of TTI.
Moderate Traffic Congestion
Figure 6 shows the obvious effectiveness of the DSS. Comparing the DSS with other types of IATM as well as the base condition, the improvement of the DSS is significantly different at a 90% confidence interval. As with the results of the heavy traffic condition, Figure 6c and d show a similar scatter plot. That is, DSS has the ability to balance the traffic conditions of both freeways and arterials and could improve both freeways and arterials in the moderate traffic congestion.
Travel time rate (TTR) and travel time index (TTI) under moderate traffic congestion: (a) TTR on entire network, (b) TTI on entire network, (c) scatter plot of TTR, and (d) scatter plot of TTI.
Discussion and Conclusion
This study presented the use of travel time reliability for the DSS in IATM. The developed DSS consists of three ATM strategies (VSL, QW, and RM), prediction models of traffic condition with control rules, and travel time variability estimation models for freeways and arterials. VSL, QW, and RM were implemented in the traffic simulation for the I-4 corridor networks in the Downtown Orlando area. For VSL and QW, a new logic was developed to recommend variable speed limits. RM logic was based on traffic responsive metering using an open loop control. For the prediction of near-future traffic conditions with traffic control rules, a METANET model was employed and calibrated for freeways and arterials. Finally, travel time variability estimation models were developed. The travel time variability was estimated in real time by using the predicted traffic time rate provided by METANET for freeways and arterials.
The effectiveness of the developed DSS was analyzed under the condition of three levels of traffic congestion: moderate, heavy, and extreme. According to the evaluation results of the developed DSS, it is obvious that the developed DSS has an ability to select the best control values with the highest synergistic relationships among three ATM strategies in real time because the DSS was developed to choose proper control values among VSL/RM, QW/RM, and VSL/QW/RM. However, DSS did not improve the traffic conditions of the entire corridor network in all traffic congestion levels. DSS only improved the traffic conditions of the entire corridor network under moderate traffic conditions. This is because the improvement of the traffic condition on the adjacent arterials was restricted because of the limitation of the allowable residual capacity of arterials. Therefore, for more improvement of a corridor network, it is necessary to maximize the allowable capacity of arterials through the adjustment of the arterial traffic signal operation.
Nevertheless, the developed DSS achieved more balanced traffic conditions between freeways and arterials in all types of traffic congestion than three simple ATM strategies: VSL/RM, QW/RM, and VSL/QW/RM. Based on the real-time travel time variability evaluation of freeways and arterials, the developed DSS maximized the utilization of freeways and arterials without changing the existing traffic operation on arterials. Comparing the DSS with three ATM strategies, it was apparent that the improvement of the traffic condition on the freeways was maximized, and at the same time, the deterioration of the traffic condition on the arterials was mitigated. In conclusion, the developed DSS based on travel time reliability utilized the synergistic relationships of traffic management strategies, and the load balancing concept between freeways and arterials for the maximization of the effectiveness of IATM strategies.
It should be noted that the findings of this research are restricted to three ATM strategies. Hence, it might be advisable to include other strategies such as adaptive traffic signal operation, dynamic route diversion, and so on. Moreover, this study can be extended to the next-generation traffic management system using connected and automated vehicle technologies by dealing with travel time reliability or variability.
Footnotes
Acknowledgements
The authors are grateful to the Florida Department of Transportation (FDOT) for supporting this study. The authors also appreciate the data provided by FDOT and the Central Florida Expressway Authority.
Author Contributions
The authors confirm contribution to the paper as follows: study conception and design: Whoibin Chung, Mohamed Abdel-Aty, Ho-Chul Park, Qing Cai, and Raj Ponnaluri; data collection: Whoibin Chung, Ho-Chul Park, Qing Cai, and Raj Ponnaluri; analysis and interpretation of results: Whoibin Chung, Mohamed Abdel-Aty, and Ho-Chul Park; draft manuscript preparation: Whoibin Chung, and Mohamed Abdel-Aty; calibration and validation of traffic simulation: Mdhasibur Rahman, and Yaobang Gong. All authors reviewed the results and approved the final version of the manuscript. The author(s) do not have any conflicts of interest to declare.
Declaration of Conflicting Interests
The author(s) declared no potential conflicts of interest with respect to the research, authorship, and/or publication of this article.
Funding
The author(s) received no financial support for the research, authorship, and/or publication of this article.
All opinions are those of the authors and do not necessarily reflect the position of Florida Department of Transportation.