
Abstract
This study acts in support of the Wyoming Department of Transport (WYDOT) connected vehicle pilot efforts in the deployment of effective, safe, and user-centered connected vehicle (CV) applications and human machine interface (HMI) displays. This study sought to quantify the workload demands and distraction introduced by the pilot’s spot weather impact warning (SWIW) and work zone warning (WZW) applications on professional truck drivers. Using driving simulator experimentation and eye-tracking technology, the effects of exposure to the CV warnings on the participants’ glance behavior were quantified. The study revealed that the weather notifications did not invoke any notable workload or distraction to the participants. Conversely, the WZWs deteriorated the participants’ roadway scanning behavior and brought about prolonged off-road glances, and therefore could carry adverse safety impacts to drivers in real-life conditions. This was largely attributed to the fact that, unlike the weather notifications, the WZW application appeared to have over-communicated information to the participants during a short time window and under difficult driving conditions and resulted in a relatively cluttered HMI. In light of these findings, WYDOT, the leading pilot stakeholder, is amending the design of the WZW application in such a way that message flow rate is reduced and only necessary information is displayed. All in all, the methodology applied in this study was effective in uncovering the overall effects of exposure to CV warnings and therefore could be useful for evaluating workload and distraction in the context of emergent advanced driver assistance systems.
Human drivers predominantly rely on the visual sense to extract information from the driving environment. Research unequivocally demonstrates that driving is primarily a visual task; at least 90% of the information consumed as part of the driving task is the product of the streaming of visual information such as vehicle speed, road geometry, position relative to lane markings, brake lights of nearby vehicles, headway distance, and traffic signs, amongst a myriad of other elements ( 1 – 3 ). The traffic environment, by its very nature, is a dynamic and continually evolving visual–cognitive construct. As a result, the safe navigation of the traffic environment necessitates continual driver attention to operate the vehicle and scan the roadway for potential hazards ( 4 ). Relevant to this context, the driving task involves two fundamental mechanisms: 1) Acquiring information about the traffic environment via a continual flow of information, mainly through the visual sense, and 2) The effective cognitive processing of the acquired information or “raw data” in the way that serves the driver’s ultimate needs and objectives ( 1 , 5 , 6 ). Dysfunction can occur at the level of any of the two mechanisms, that is, at the level of acquiring information or at the cognitive processing level ( 1 , 5– 7 ). In practice, these sorts of dysfunction are often referred to as distraction. Expectedly, distraction when conjoined with unforeseen changes in the driving environment or “pop-up events” turns into a recipe for crashes/near crashes ( 5 , 8 ).
Truck drivers are a prime category of road users impacted by distracted driving ( 4 ). A truck cabin, by its very nature, is a complex and workload-sensitive environment ( 6 ). Vehicle characteristics such as size, braking distance, blind zones, and vehicle maneuverability, in addition to the need to perform work-related tasks while driving, do make the driving environment visually, physically, and cognitively demanding for heavy-truck drivers ( 6 ). Unsurprisingly, human factors lead the contributing factors for crashes involving large trucks. According to the Federal Motor Carrier Safety Administration (FMCSA), 87% of the motor vehicle crashes involving large trucks are coded with human error as the critical reason (23% “traveling too fast for conditions”, 22% “unfamiliar with roadway”, 13% “fatigue”, 10% “felt under work pressure from carrier”, 14% “inadequate surveillance”, 9% “inattention”, and 8% “external distraction”) ( 9 ).
With a widening array of attention-competing in-cabin systems, truck drivers are put under increased strain to multitask on the go. A study published by the National Highway Traffic Safety Administration (NHTSA) revealed that approximately 65% of commercial truck drivers and safety/regulatory personnel (police, fleet managers) recognize distraction brought about by in-cab devices such as fleet management devices, dispatch communication systems, and cell phones as being problematic for truck drivers ( 10 ). Additionally, almost half of the interviewed truck drivers in the study reported experiencing near-misses while using in-vehicle devices where the loss of situational awareness is the probable cause ( 10 ). It is noteworthy that truck drivers generally identify themselves as judicious as to when to use in-cabin devices ( 10 ).
Factoring out the safety benefits engendered from alerting drivers about potential traffic hazards using connected vehicle (CV) technology, off-road glances, regardless of their objective, can compromise the safety of drivers ( 8 ). A large-scale naturalistic driving Study by the NHTSA established a direct link between drivers’ visual distraction during/before “pop-up events” and crash/near-crash involvement. The study revealed that more prolonged off-road glances are generally associated with higher crash risk and deterioration of driving performance. Off-road glances exceeding 2 s in general, regardless of their purpose, increase the risk of being involved in a crash/near-crash by twofold compared with normal driving conditions ( 8 ). The study concluded that secondary tasks that are simple and brief generally carry little to no risks to the drivers ( 8 ).
Poorly designed human machine interfaces (HMI) can greatly impact driver performance, particularly when heavy workloads from the driving environment exist. This is considering the limited human ability to handle information ( 6 ). Drivers experiencing visual and cognitive workloads beyond their safe capacity to handle information become at higher risk of missing events in the driving environment, and, consequently, become at higher risk of being involved in crashes ( 6 ). Therefore, it is essential that HMI design takes full consideration of the various challenges drivers encounter. As an instance, Tijerina et al. conducted a real-life study on the effects of communicating messages via an in-cabin text messaging system of two lines or more on truck drivers’ behavior ( 11 ). The study revealed that the system diminished the amount of time spent by truck drivers monitoring the roadway and thus could degrade truck drivers’ safety ( 11 ).
To advance the deployment of CV technology, the U.S. Department of Transportation (U.S. DOT) launched the first wave of CV pilot in 2015 in three locations comprised of New York City; Tampa, FL; and Wyoming ( 12 ). The WYDOT CV pilot is being deployed over a 402-mi rural corridor of Wyoming’s Interstate 80. With a heavy truck and freight movement on this corridor, reaching as high as 70% during seasonal peaks, the pilot is freight focused ( 12 ). Using vehicle-to-vehicle (V2V) and vehicle-to-infrastructure (V2I) communications, a suite of freight-focused CV applications is being implemented to improve traffic safety and mobility on the corridor, particularly when hazardous road and weather conditions exist ( 12 ).
Among the suite of the CV applications are the work zone warning (WZW) and the spot weather impact warning (SWIW) applications. Together, these two applications will be the subject of focus of this study. The WZW seeks to inform drivers about work zones ahead, speed reduction areas, lane closures, and other work-zone-present conditions. The SWIW application alerts drivers about geo-specific weather and road conditions ( 12 ). In an earlier study, these applications were found effective in bringing about the desired response from the drivers ( 13 ). The SWIW application was found to prompt participants to reduce their speed and brought about smoother braking responses when adverse weather conditions were encountered. The communication of the WZWs was found to prompt an early lane merging behavior toward the work zone open lane, in addition to lowering the speed variability when navigating the work zone advance warning area under adverse weather conditions ( 13 , 14 ). Nonetheless, in the post-study questionnaires, a sizeable portion of the participants pointed out that the pilot’s CV warnings were moderately distracting ( 13 , 15 ).
Methodology
A prime concern from the pilot’s CV applications is the reliance on a visual HMI. The visual display of warnings (accompanied by auditory beeps) calls drivers to divert their visual resources away from the road scene to the HMI. Eye-tracking systems, widely used in the literature, provide a powerful tool to identify where a driver is looking within the visual scene and for how long. This study employs eye-tracking technology and seeks to provide an evidence-based assessment of the visual and cognitive workload and distraction impacts introduced by the pilot’s SWIW and WZW applications on professional truck drivers. All in all, this study provided valuable practice-focused insights that are being translated into enhancements to the Wyoming Department of Transport (WYDOT) CV pilot’s applications design and HMI displays.
Participants
Participants of this study were 20 male professional truck drivers, all of whom were full-time employees with WYDOT. WYDOT is the leading stakeholder for the Wyoming CV pilot deployment. This is because all of the study participants will be piloting CV-equipped trucks under the umbrella of the CV pilot. All participants had a valid commercial driver license (CDL) with an average experience exceeding 12 years. Moreover, all participants reported driving under reduced visibility conditions on Wyoming I-80 (snow, blizzards, fog, smoke, or heavy rain). Experiments were conducted in conformance with the University’s Institutional Review Board.
Apparatus
To simulate a CV environment for the study participants, a high-fidelity truck cab simulator modeled after a 2000 Sterling AT9500 18-wheeler semi-trailer was used. The simulator deploys motion feedback using three degrees of freedom (roll, pitch, and heave). In addition, the driving simulator is equipped with a high-definition SmartEye® Tracking system to track the subjects’ head position and gaze direction in three dimensions (3D). The system’s hardware uses three cameras mounted at different angles on the simulator. The accompanying software provides eye-tracking measurements in the form of raw data collected at a rate of 60 Hz. A 3D world model of the driving simulator objects was mapped into the eye-tracking software enabling the identification of the objects with which a subject’s gaze intersects. The HMI is an onboard display unit mounted on the center stack of the simulator, as shown in Figure 1, and was used to communicate CV warnings to drivers in the form of visual and auditory warnings.
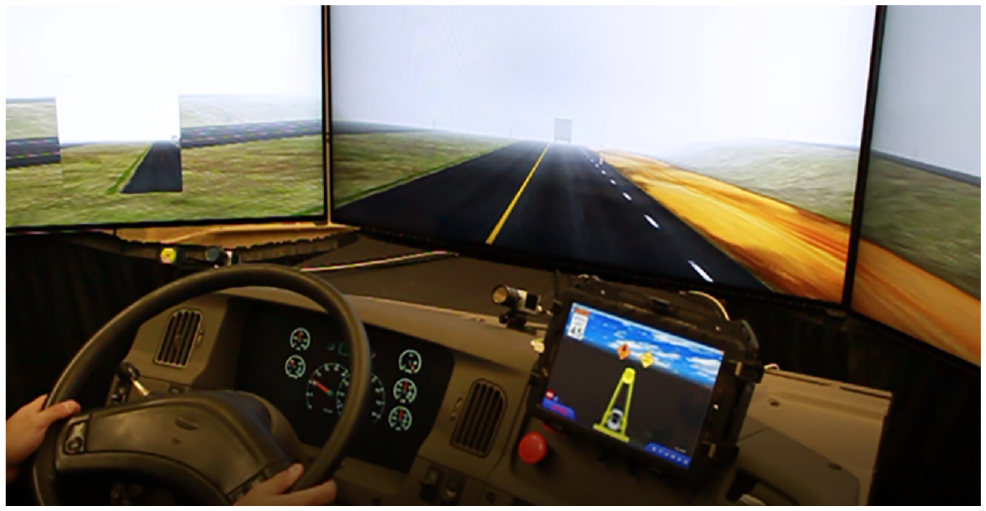
View of the human machine interface (HMI) and the SmartEye® tracking system.
Design of Experiment
The design of the experiment consisted of three phases: a preparation phase, a training phase, and a testing phase. In the preparation phase, participants were briefed on the WYDOT CV pilot and were requested to fill in pre-training questionnaires. The training phase consists of an E-training module and a hands-on module. The E-training module sought to train the participants on how to effectively interact with the HMI ( 16 ). The hands-on module consisted of a driving simulator warm-up session for the participants to get acquainted with the truck cab vehicle dynamics, in addition to driving simulator training on the individual CV applications encountered in the E-training. The testing phase sought to expose participants to real-life situations similar to those which drivers encounter on Wyoming’s I-80 and assess their driving behavior with and without the CV warnings. Before the simulator experimentation began, the eye-tracking hardware and software were calibrated for each subject following the manufacturer’s instructions.
Each participant navigated two layout-replicate scenarios with similar road and weather conditions, except once with the HMI being turned to communicate CV warnings (CV scenario), and a second time with the HMI turned off and drivers were unexposed to any of the CV warnings (baseline scenario). The order of the scenario encounter was randomly selected to prevent potential adaptation bias effects. Additionally, some randomization was introduced between the baseline and the CV scenarios to ensure that the scenarios would not be identical to the participants.
Given the context of this study, the HMI itself and the accompanying displays used in this study were based on the pilot’s existing design, at the time of the study. All warnings were communicated using visual displays accompanied by audible beeps. In addition, all visual displays were standard warning signs that are from/adapted from the Manual on Uniform Traffic Control Devices (MUTCD). This is in accordance with the Federal Highway Administration (FHWA)’s guidelines recommending the use of standard and easily recognizable signs, particularly those from the MUTCD for in-vehicle warning purposes ( 17 ). It is noteworthy that earlier research showed that professional truck drivers participating in the pilot’s education and training activities perceived the warnings as easy to understand ( 13 , 18 ).
The scenario involved the navigation of a two-lane freeway under clear weather conditions, at the outset. Once steady conditions were reached, participants in the CV scenario encountered the first wave of CV warnings triggered by the SWIW application consisting of two weather notifications, as illustrated in Figure 2. The first notification alerted drivers to the presence of a foggy area ahead. The second notification communicated a 55-mph advisory speed because of the upcoming reduction in visibility. Figure 3 exhibits what drivers observed on the HMI following the communication of the weather warnings. Shortly after, visibility conditions deteriorated, and visibility was diminished to 250 ft.
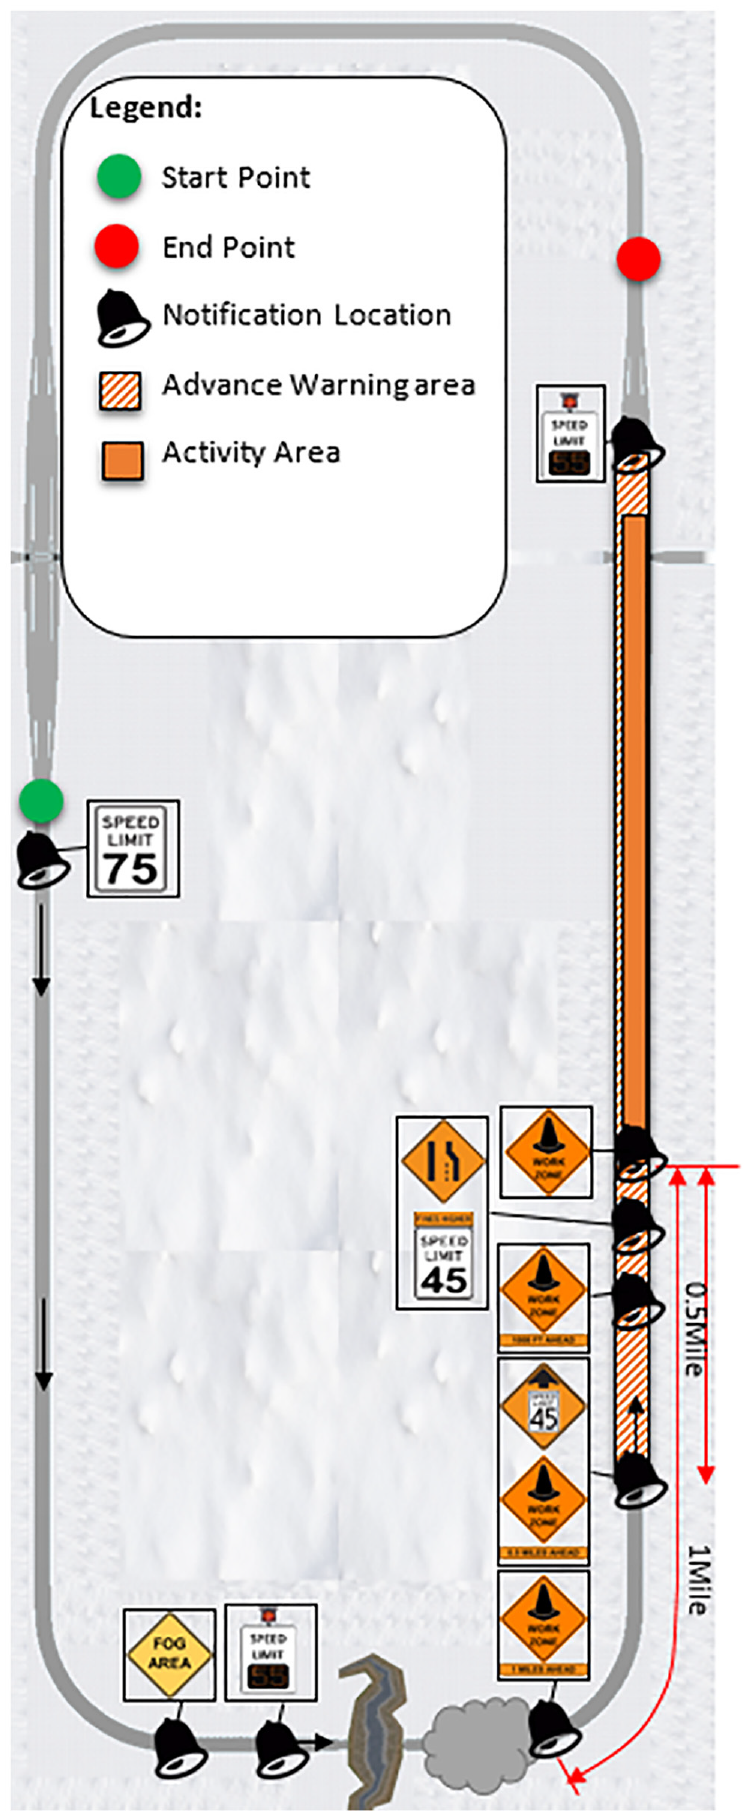
CV scenario layout ( 13 ).
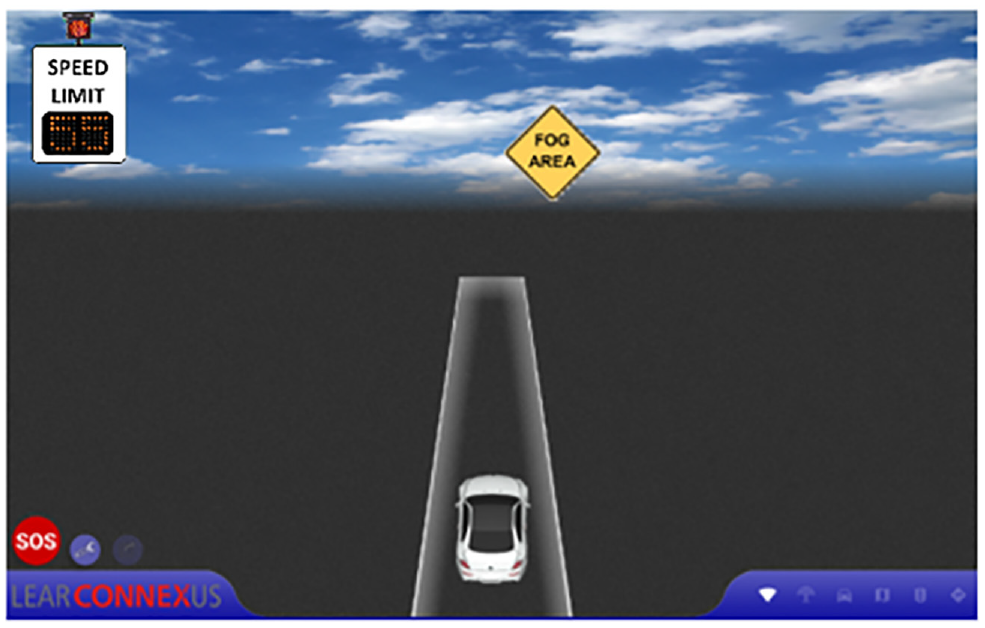
Display of the weather warnings on the human machine interface (HMI).
Next, participants were exposed to the second wave of CV warnings triggered by the WZW application. The latter provided navigation guidance to the participants regarding an upcoming work zone and consisted of four warnings communicated in the work zone advance warning area sequentially, under the reduced visibility conditions (Figure 2). The first work zone notification alerted drivers to the presence of a work zone in 1 mi. The second notification both adjusted the distance to the work zone to 0.5 mi and informed drivers of a reduced speed area ahead of 45 mph. The third notification changed the distance on the work zone activity area to 1,000 ft. In the last notification, a right-lane closure and a 45 mph speed limit were communicated. In the baseline scenario, no in-vehicle warnings were communicated and participants had to rely on the road traffic control devices.
Data Analysis and Dependent Variables
Eye glance behavior in driving research is a complex and convoluted research field ( 2 ). A robust analysis of the eye glance behavior predicates a multifaceted approach to capture the holistic effects associated with the use of an in-vehicle technology on driver workload and distraction ( 2 ). Before proceeding with the description of the study’s dependent variables, that is, the eye glance metrics, it is critical first to begin with laying the groundwork for the basic eye movement protocols:
Target: A target is a well-defined spatial region or object within the visual scene at which a driver may direct their gaze ( 6 ). Since the prime focus of this study is to assess the impacts of the display of the CV warnings on the HMI, two sorts of glances are considered: glances to the HMI (labeled as HMI glances), and off-road glances. Off-road glances consist of all glances away from the road scene, including the HMI.
Fixation: A fixation is the duration of time occurring within a glance in which a driver’s foveae (center of the field of vision occupying the highest visual acuity) fixate/concentrate on a particular point or location within an object (e.g., HMI, forward view, etc.). Relevant to this context, research elucidates that it is during fixations that the extraction/cognitive processing of visual information takes place ( 19 ). Fixations are duration sensitive and generally vary between 100 ms and 2,000 ms for in-vehicle devices, according to the provisions of the International Organization for Standardization’ ISO 2014 standards ( 6 ). Fixations of less than 100 ms are rare ( 19 ). In line with the ISO standard, glances identified in this study were based on fixations of minimum 100 ms durations.
Saccade: A saccade is used to denote the eye movements that occur between fixations on the same target ( 6 ), for example, a driver fixates on the left side of the HMI and then fixates on the center of the HMI.
Transition: Transitions are the eye movements that precede the fixations on a new target ( 2 , 6 ).
Dwell time: It is the total time spent with eyes directed towards a particular target: the sum of all fixations and saccades on the same target (e.g., HMI) ( 2 , 6 ).
Glance duration: Definitions can slightly vary in the literature; however, the most common definition, adopted in this study, is by the Society of Automotive Engineers—SAE J2396 ( 6 ). A glance duration is the total time that starts from the point in time at which a driver begins directing their gaze toward an area of interest (i.e., target) until the point in time at which the driver moves eyes away from that area of interest ( 2 , 6 ). The concept of glance duration will, in future, be pivotal for the remainder of this study.
This study leverages multiple eye-tracking metrics from/adapted from the literature to assess the visual and cognitive demands introduced by the display of the pilot’s CV warnings. It is noteworthy that, for the most part, eye-tracking metrics in driving research, thus far, have been mostly concerned with in-vehicle secondary tasks. As such, many of the metrics used in the literature may not be fully compatible with the nature of the CV notifications being investigated. Consequently, some of the eye-tracking metrics used in this study were slightly adapted based on widely adopted metrics in the literature. Table 1 provides a functional description of the eye-tracking metrics used in this study. All metrics were normalized based on the display features of the CV application being in study (i.e., the WZW or SWIW) and in consideration of the reference area in which the CV warnings were communicated (i.e., the weather notifications area where the SWIW warnings were communicated, or the work zone advance warning area in which the WZW warnings were displayed).
Definition of the Eye-tracking Metrics used in this Study
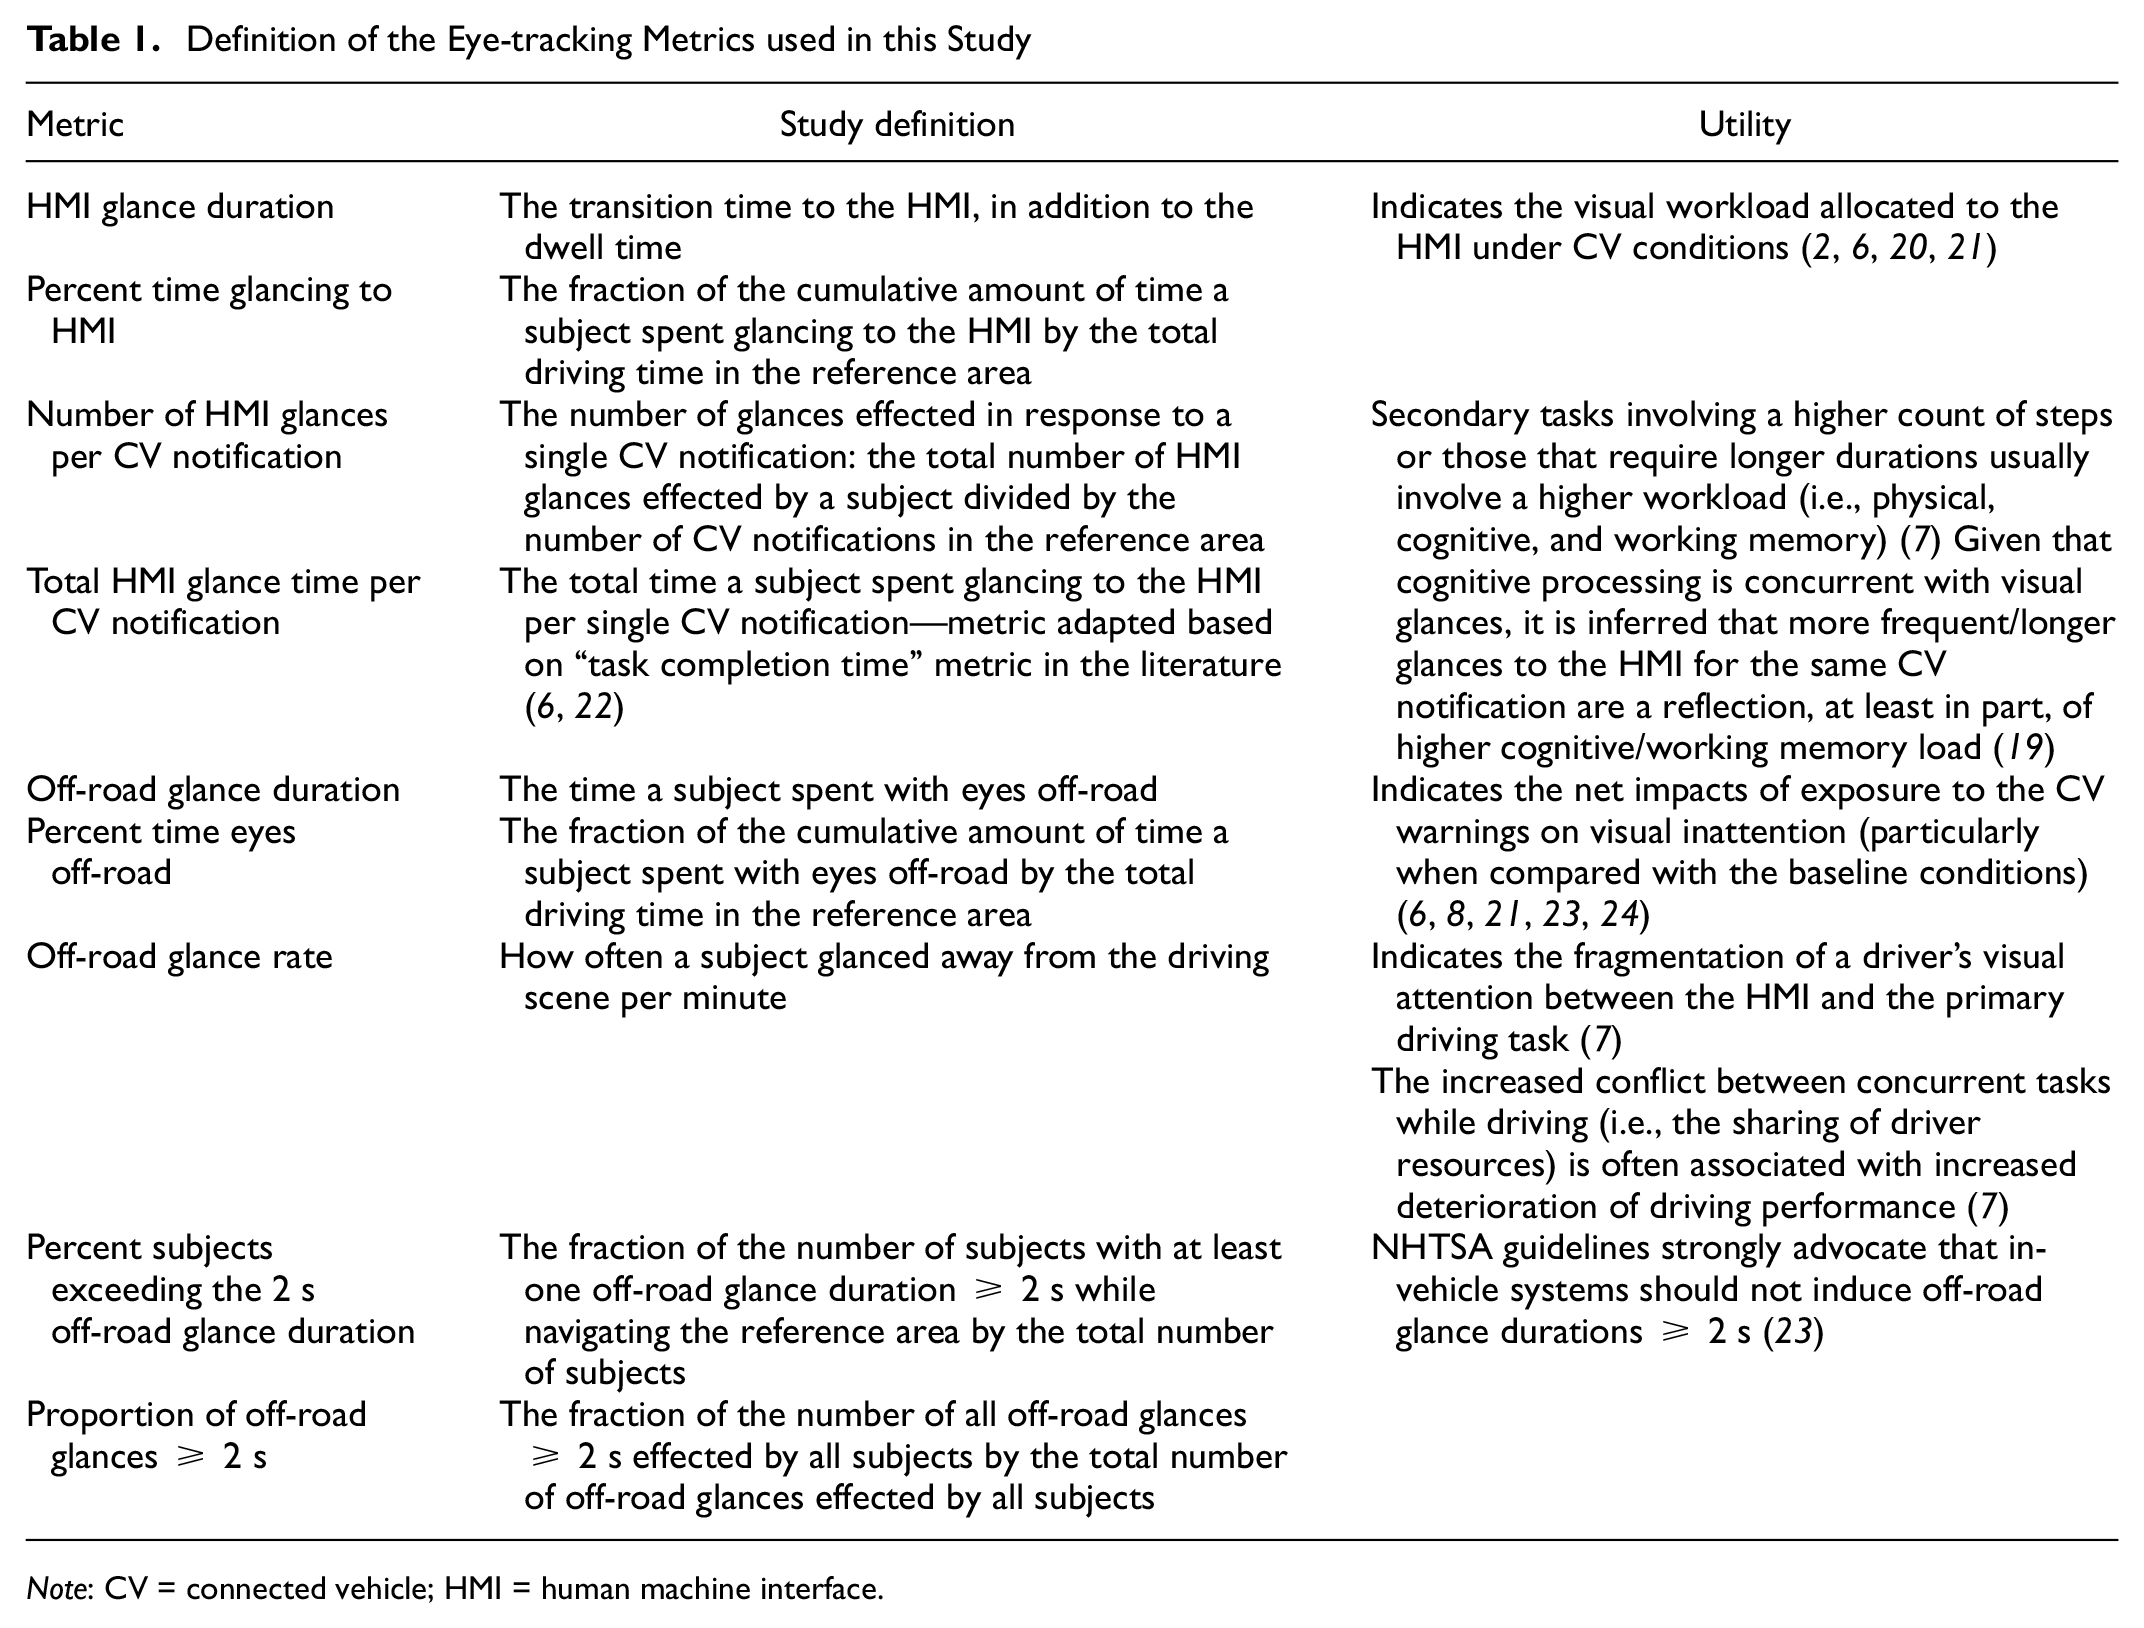
Note: CV = connected vehicle; HMI = human machine interface.
An algorithm was developed to identify the durations and the timestamps associated with HMI and off-road glances. The following procedure was used to extract the HMI glance (same procedure for off-road glances):
Identifying the fixations that coincide with the HMI with a minimum duration of 100 ms.
Determining the total dwell time during a glance to the HMI, by combining all consecutive saccades and fixations occurring within the same HMI glance.
Determining the total glance duration by appending the dwell time with the duration of the leading eye glance transition duration towards the HMI.
Subjectively validating that the algorithm-identified HMI glances are in agreement with the glance behavior observed in the video recordings of the driving simulator experiments. This step is not uncommon in the literature and was intensively applied in this study to validate the accuracy of the algorithm in detecting and measuring the duration of randomly selected glances for each driver ( 19 ).
Processing raw eye-tracking data presented several challenges turning the data reduction procedure into an intricate and labor-intensive process. Loosely defined algorithms are not uncommon in the literature and can produce an unusually high or low number of fixations, and thereby could misguide the analysis of data ( 19 ). All of the encountered challenges were dealt with according to, or in an adaptation of, common mitigation practices in eye-tracking research. The following section describes the main hurdles that were encountered and how they were resolved to preserve the accuracy of the eye glance behavior:
Track loss: the issue of track loss is well-encountered in eye-tracking research ( 25 ). This issue was encountered for several subjects in this study and therefore could have impacted the quality of the findings if left unaddressed. Track losses are typically missing eye-tracking readings and often take place when the eye-tracking system is unable to track the pupil or the center of the corneal reflection ( 25 ). To remedy this issue, the following procedure is applied: 1) Track losses occurring prior to a fixation or between fixations on the same area of interest (an off-road object or the HMI) were disregarded since they have no impact on the final glance duration; 2) In view of the corrections applied by Munn et al., track losses occurring within a fixation were incorporated into the overall fixation as long as the subject’s gaze was maintained on the same area of interest after the track loss ( 25 ).
Fragmented fixations: The eye-tracking software employs a velocity-based method to identify fixations. Eye movements with an angular velocity lower than a certain threshold would be identified as fixations; otherwise, they would be labeled as saccades. Research demonstrates that this method is inclined to mislabel fixations occurring at near-threshold velocities. Thus, a single fixation could be fragmented into multiple distinct fixations ( 19 ). In this study, this issue was manifested initially with algorithm producing several fixations that were below the 100 ms duration threshold and therefore were not considered as valid fixations. To remedy this issue, neighboring fixations groups were clustered into a single fixation as long the duration separation between the separate groups did not exceed 100 ms.
Eye-tracking data was collected for all 20 participants. In total, 40 eye-tracking data files were generated (two scenarios per subject: baseline and CV). For unforeseen reasons, the collected data of four subjects was corrupt beyond repair, and no data could be extracted from these files. Additionally, three data files affecting the baseline scenarios for three subjects were either corrupt or severely affected by track loss so that no reliable measurements could be extracted. All in all, data collected from 16 participants navigating the CV scenario was of high-quality and thus was used to quantify the visual demands exclusive to the HMI. The analyses conducted to assess and compare the net impacts of exposure with the CV warnings in reference to the baseline conditions were limited to the 13 subjects with complete CV and baseline data sets.
Multiple descriptive and inferential statistics were performed in this study. Statistical testing sought to: 1) assess the individual and comparative visual/cognitive workload demands associated with the CV applications; and 2) Quantify the net impacts of exposure to the CV warnings by using the baseline conditions as a reference. All tests were assessed at the 0.05 significance level.
Results
The results section is fourfold: The first part provides a description of participants’ visual behavior under the CV environment for each of the CV applications being investigated. The second part presents a quantitative/qualitative comparison between the visual/cognitive workloads invoked by each of the CV applications. The third part seeks to quantify the net visual/workload impacts brought about by the display of the CV warnings using the baseline conditions as a frame of reference. The last part evaluates the extent of the distraction introduced from each of the CV applications.
Description of the Drivers’ Visual Behavior under the CV Environment
The SWIW application consisted of two weather notifications communicated under clear weather conditions. In the weather notifications area (i.e., starting from the moment participants received the first weather warning until the reduction in visibility), the 16 participants on average spent 8.9% of the total time driving with their eyes directed/being directed towards the HMI. Each of the two SWIW notifications invoked, on average, 1.66 glances to the HMI where the average single HMI glance duration lasted approximately 0.83 s to completion. This is the equivalent of 1.41 s total glance time per single notification, on average.
On the other hand, the WZW application consisted of four work zone notifications communicated in the work zone advance warning area (i.e., the reference area for the WZW application). On average, the display of the WZWs prompted the participants to spend 9.1% of the total driving time with eyes being directed towards the HMI. Moreover, the display of each of the four WZW notifications on average induced 2.48 glances to the HMI where each glance lasted approximately 1 s to completion. This is the equivalent of 2.68 s total glance time per single notification.
Comparison of the Visual/Cognitive Workload Demands of the CV Applications
The comparison of the visual glance behavior induced by the SWIW and WZW applications reveals that: 1) The average participant glance duration to the HMI in response to a WZW was 0.20 s longer than that of a weather warning. Evidently, the difference in mean HMI glance duration between the two CV applications was found statistically significant using a paired t-test [t(15) = 2.52, p = 0.024]. 2) The WZW application induced more glances to the HMI per single notification in comparison with the SWIW application (Figure 4). Statistical significance using a paired t-test was also established [t(15) = 4.35, p < 0.001]. This result demonstrates that the display of a work zone notification required more glances to the HMI to extract and process the communicated information. 3) The display of a single work zone notification required nearly twice as much glance time in comparison with a weather notification, as Figure 4 illustrates. This result was also found statistically significant using a paired t-test [t(15) = 4.34, p < 0.001]. Taken together, these findings suggest that the work zone notifications invoked substantially higher visual/cognitive workload for the drivers to locate, recognize, and process the displayed information.
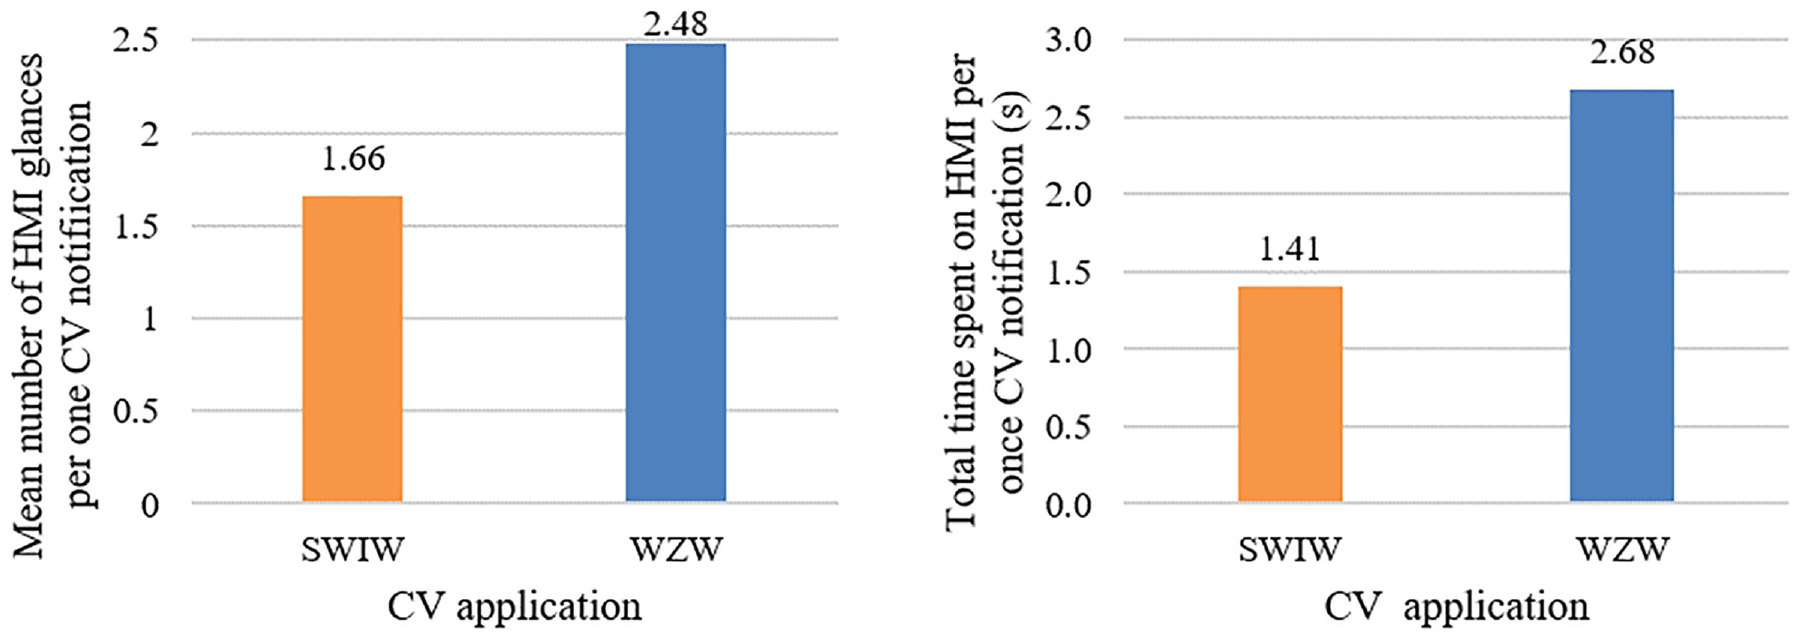
Mean number of glances and total time spent on human machine interface (HMI) per notification by connected vehicle (CV) application.
Effects of Exposure to the CV Warnings on Participants’ Visual/Cognitive Workload
This part quantifies the visual/cognitive workloads introduced as a result of exposure to the weather warnings and WZWs in reference to the baseline conditions. In the CV scenario, the workload demands are not just factors of the HMI display features, but also other factors related to the driving task, the driving environment, and the individual eye glance behavior of the participants. By comparing with the baseline conditions, off-road glance behavior offers an ideal medium to uncover the net safety impacts of exposure to the CV warnings, given that any time spent not acquiring visual information about the surrounding traffic environment entails an increase in crash risk ( 8 ).
The display of the weather notifications on the HMI was not found to invoke a notable impact on the mean off-road glance duration metric relative to the baseline conditions. The mean off-road glance duration diminished from 0.86 s in the baseline conditions to 0.83 s in the CV scenario (i.e., a negligible reduction of 0.03 s following exposure to the weather warnings). No statistical significance could be detected using a paired t-test [t(12) = 0.27, p = 0.79]. Proceeding on the same track, the display of the weather notifications prompted participants to divert their visual resources away from the road view by an additional 10% of the total driving time in the reference area in comparison with the baseline conditions (Figure 5).
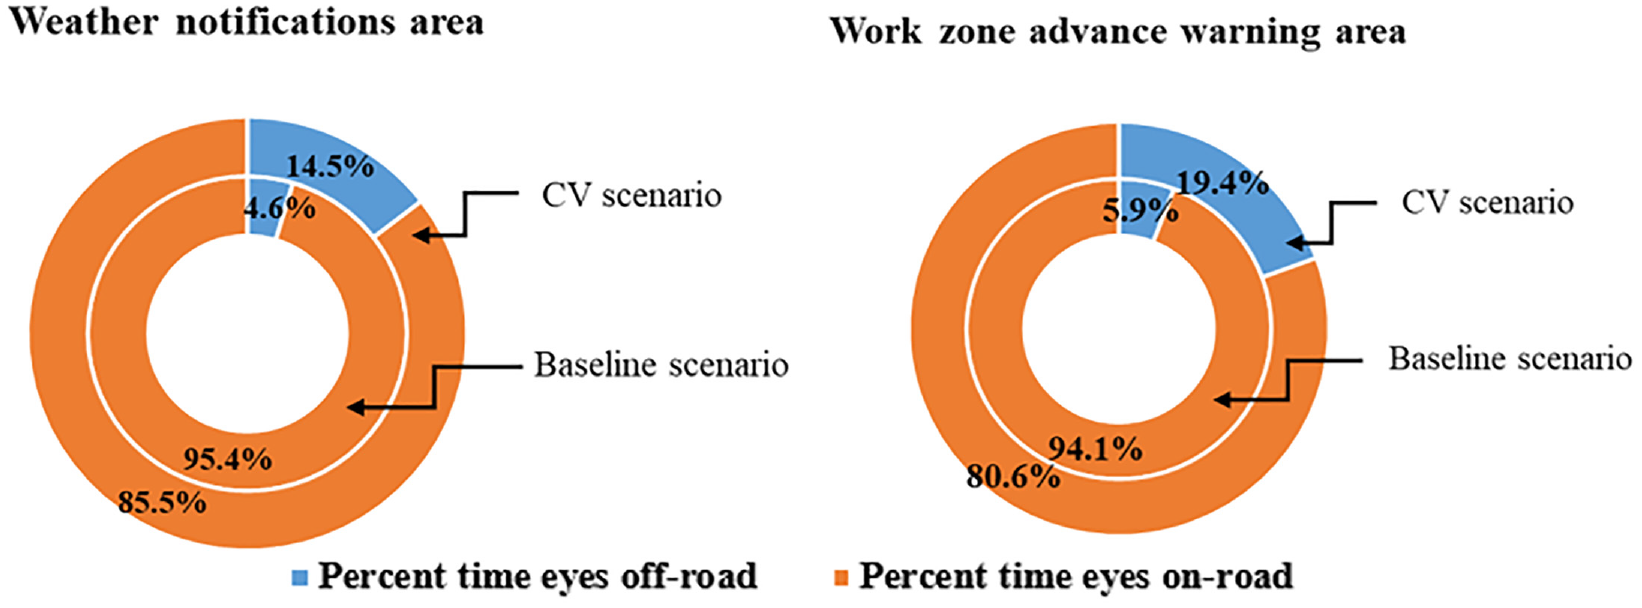
Effects of exposure to connected vehicle (CV) warnings on the percent time off-road.
On the other hand, the introduction of the WZWs in the advance warning area brought about a more notable shift in the mean off-road glance duration relative to the baseline conditions. The average off-road glance duration increased from 0.77 s in the baseline scenario to 0.92 s in the CV scenario, an equivalent increase of 0.15 s. This finding highlights a tendency towards effecting slightly longer off-road glances as a result of exposure to the WZWs. Nonetheless, no statistical significance could be detected for the mean off-road glance duration between the CV and baseline conditions [t(12) = 1.48, p = 0.16]. Alongside the relative increase in off-road glance durations, subjects spent substantially more cumulative time looking off-road when exposed to the CV WZWs. As Figure 5 illustrates, the activation of the WZWs triggered the allocation of an additional 13.5% of the visual resources away from the driving scene. The percent time eyes off-road measure more than tripled on average following exposure to the WZWs.
Impacts of Exposure to CV Warnings on Visual Distraction
Using the NHTSA’s 2 s off-road glance benchmark for measuring distraction, the proportion of glances exceeding 2 s from the total number of off-road glances effected by all subjects (i.e., the proportion of off-road glances ≥ 2 s) remained unchanged following exposure to the weather warnings. Besides, the number of participants exceeding the 2 s threshold (i.e., percent subjects exceeding the 2 s off-road glance duration) was also unaffected following exposure to the CV weather warnings. One participant exceeded the 2 s threshold on one occasion in the baseline conditions while navigating the weather notifications area and the same was true under the CV conditions (Table 2). Conversely, exposure to the WZW notifications almost tripled the proportion of off-road glances exceeding 2 s out of the pool of off-road glances effected by all subjects. Moreover, the number of subjects exceeding the 2 s threshold increased threefold following exposure to the CV WZWs (two subjects in the baseline conditions versus six subjects in the CV scenario). The substantial increase in the number of subjects exceeding 2 s is alarming; results indicate that nearly half of all participants (46% of all participants) exceeded the NHTSA’s threshold for demarcating unsafe glances.
Visual Demand Using Off-road Glance Metric
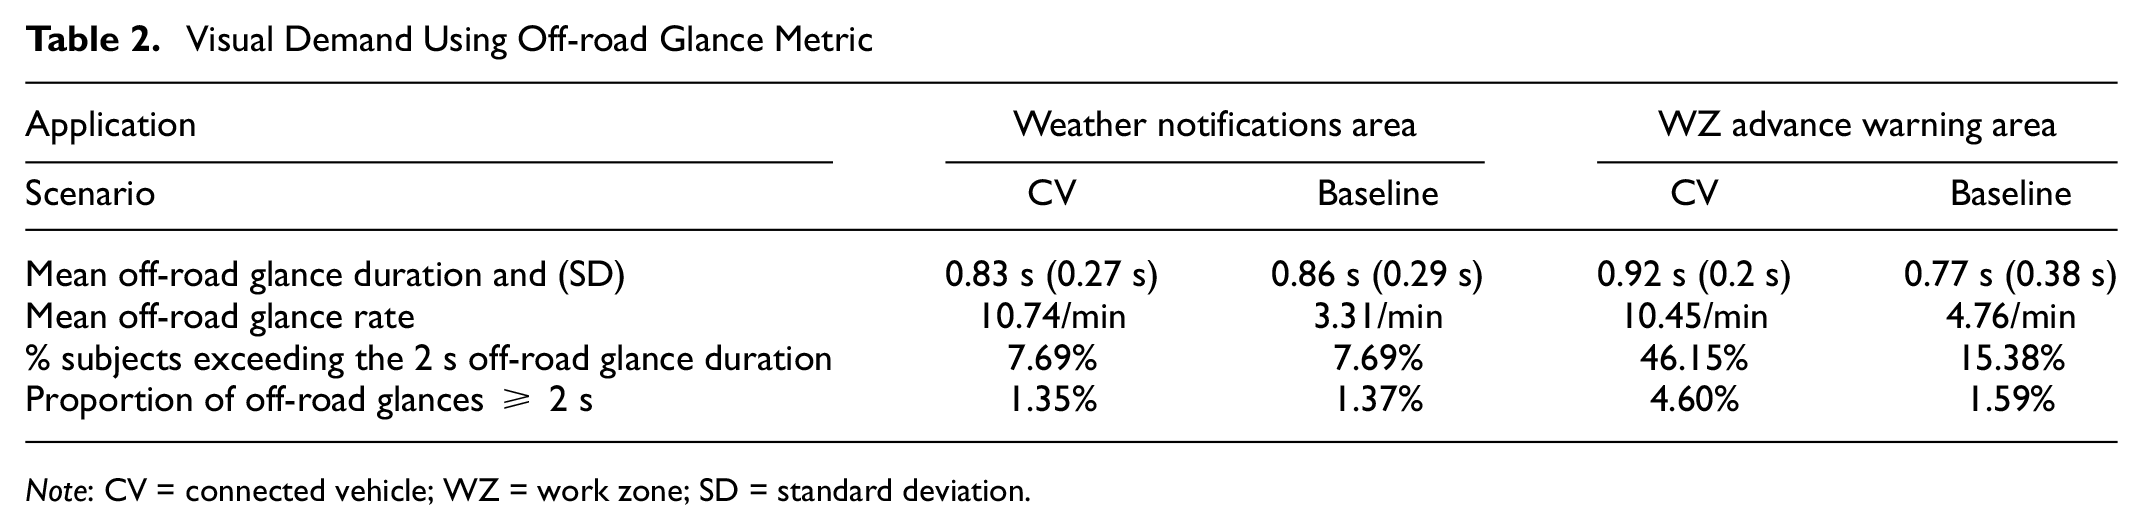
Note: CV = connected vehicle; WZ = work zone; SD = standard deviation.
To visualize the impacts of exposure to the CV WZWs on the subjects’ visual behavior, histograms of all off-road glance durations effected by the 13 subjects were plotted for both the CV and baseline conditions (Figure 6). While off-road glances with durations ranging between 0.4 s and 0.8 s remain the most common for both the CV and baseline conditions, the display of the CV WZWs seems to have augmented both the frequency and proportion of the longer off-road glance durations. Markedly, exposure to the WZWs ushered a new record for off-road glance durations surpassing 3 s. Upon a close review, it was recognized that three subjects exceeded the 3 s mark while navigating the work zone advance warning area under the CV conditions and each of these off-road glances were primarily driven by glancing at the HMI. To validate whether exposure to the CV WZWs increased the proportion of prolonged off-road glances, a chi-squared test for equality of proportions was conducted using off-road glance frequencies ranked below or higher than the 1 s duration mark used in ( 20 ). The examination revealed that the proportion of off-road glances exceeding the 1 s target of the total number of off-road glances effected by all subjects in the work zone advance warning area was significantly higher in the CV scenario comparative to the baseline scenario [χ2 (1,387) =11.98, p < 0.001]. It is noteworthy that this metric was not significant in the case of exposure to the CV weather warnings [χ2 (1,147) =0.57, p < 0.45].
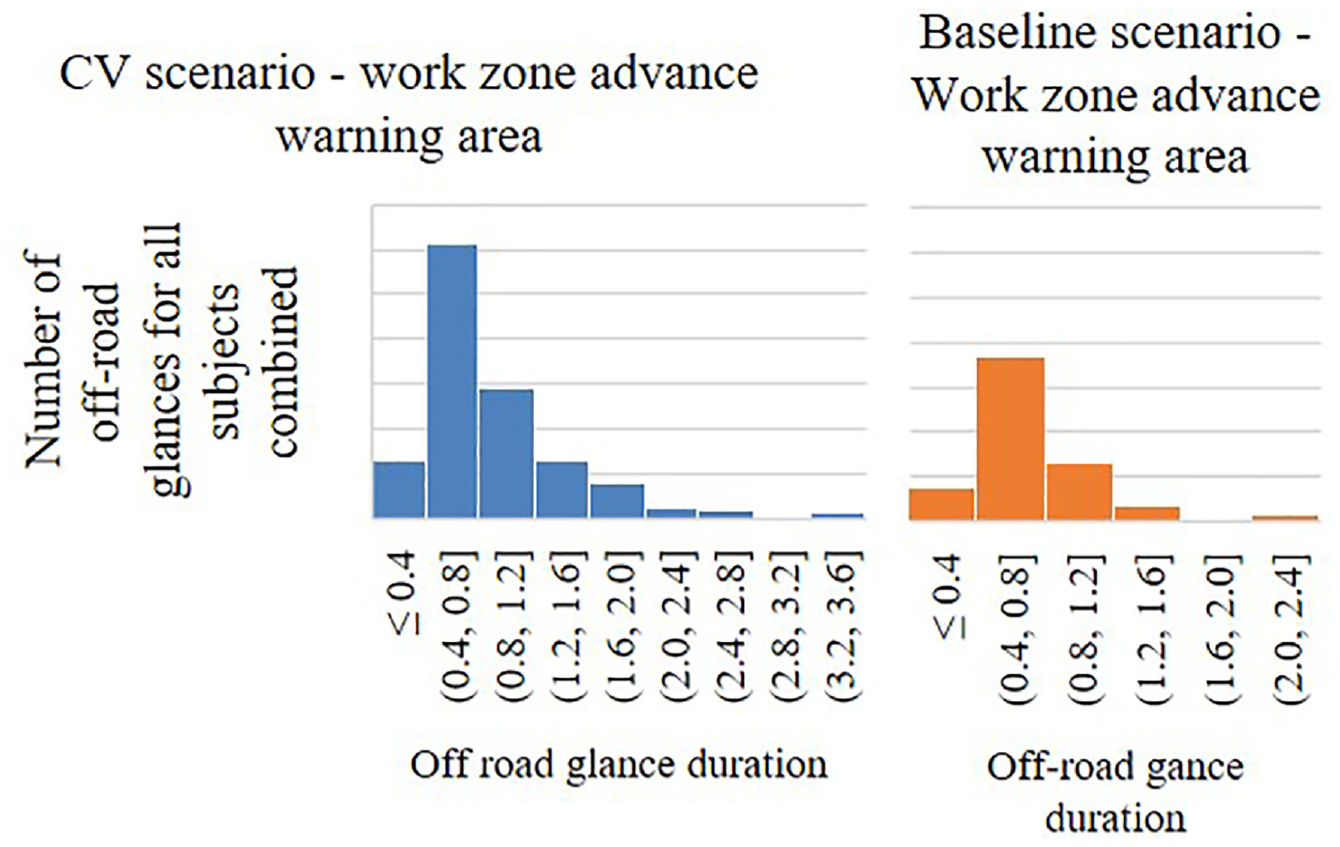
Distribution of all off-road glance durations in the work zone advance warning area.
Along with the substantial increase in the proportion of the prolonged off-road glances, exposure to the WZWs has almost doubled the off-road glance rate. Taken concomitantly, these results highlight an increased diversion of the subjects’ visual attention away from the primary driving task for prolonged durations while navigating the work zone advance warning area under CV conditions.
Discussion
The mean HMI glance durations were determined in the order of 0.83 s and 1.03 s in response to the weather warnings and WZWs, respectively. The mean glance durations for both CV applications fell well within the typical range of mean glance durations for in-vehicle devices reported in the literature. According to Birrell and Fowkes, in-vehicle devices typically invoke glances ranging between 0.8 s and 1.1 s ( 24 ). By the same token, the reported mean HMI glance durations are well comparable to the range of glance durations to effect secondary visual or visual/manual in-cab tasks for truck drivers (e.g., 1.42 s to compare posted speed with speedometer, 1.20 s to read clock, 1.10 s to adjust radio volume up/down, etc.) ( 22 ).
The comparison between the visual demands of the two CV applications revealed that the WZW applications invoked significantly more glances per CV notification. It is generally adopted in the literature that a higher number of glances to perform an in-vehicle task is an indication of a higher workload to extract and process the information ( 6 , 26 ). Moreover, HMI glances in response to the WZWs were notably longer than HMI glances for a weather warning (with statistical significance). Taken together, the WZW application seemed to invoke higher cognitive and visual workload from the drivers to locate, extract, and process the HMI-communicated information. It is noteworthy to reiterate that the WZW application presented two notifications with two items of information, which thereby appeared to require longer visual and cognitive processing time. This being the case, it is important not to underrate the effects of the challenging road and weather conditions as contributors to the heavy workload demands experienced during the communication of the WZWs.
The contrast between the SWIW and WZW visual/cognitive demands is consistent with what one would expect given that: 1) the SWIW application consisted of fewer notifications being communicated and overlaid on the HMI, and therefore fewer notifications for the participants to sort through when extracting visual information from the HMI. Conversely, the WZW application consisting of numerous notifications communicated under a short time window using small-sized displays overlaid next to each other, contributing to a relatively cluttered HMI; and 2) unlike the weather warnings, the WZWs were communicated during visually demanding conditions comprised of a work zone combined with reduced visibility conditions. As a result, subjects seem to have been compelled to distribute their visual and cognitive resources between the demanding driving task and the display of the CV notifications. This is mostly attestable because of the higher glance frequency per CV notification for the WZW application relative to its SWIW counterpart.
Although minor differences in the mean off-road glace durations were detected for the two CV applications in comparison with their corresponding baseline scenarios, no statistical significance was established. These findings are consistent with the findings reported in a study by Horrey and Wickens ( 27 ). The latter demonstrated that the mean off-road glance duration metric is mainly indifferent to the complexity of the in-vehicle task. Instead, complex tasks are associated with an increased proportion of prolonged off-road glances ( 27 ). For instance, exposure to the WZWs did not seem to make significant increases to the mean off-road glance duration. At the same time, the same exposure increased the proportion of off-road glances exceeding both the 2 s and 1 s thresholds and unlocked unprecedented long off-road durations exceeding 3 s. At the same time, the lack of situational awareness because of the poor visibility conditions may have prompted participants to seek out safety-beneficial information about the traffic environment via the HMI. In sum, these results do support participants’ reviews of the pilot’s CV warnings suggestive of potential distraction ( 13 , 15 ).
Finally, exposure to the CV warnings has more than doubled the off-road glance rate for the two CV applications. This result is particularly of concern for the work zone application as it involved not only several notifications communicated during demanding driving conditions and a short amount of time, but also the triggering of prolonged off-road glances. This finding highlights an increased fragmentation in the subjects’ visual/cognitive attention as a result of exposure to the CV WZWs. Scattering drivers’ visual resources in real life could carry serious safety repercussions, particularly under difficult driving conditions and complex in-cabin environments. In view of the distraction uncovered from the WZWs, the WZW application is being re-evaluated to minimize the distraction introduced to drivers. In particular, WYDOT is reducing the message flow rate to drivers from the WZW applications and is only disseminating warnings that are of high priority to drivers.
Research Limitations and Further Work
Considering that participants had limited time using the technology, the measured workload and distraction in this study may not give an accurate description of how participants will ultimately interact with the technology as they get accustomed to the CV warnings and HMI displays. Another obvious limitation of this study is the constrained experimental conditions under which the SWIW and WZW applications were experimented, that is, clear weather conditions for the SWIW applications, and reduced visibility conditions for the WZW application. As such, it would be beneficial for future driving simulator experiments to be conducted under varying traffic and weather conditions. Moreover, future studies will seek to recruit professional truck drivers from across the trucking industry, including private-sector carriers and fleet operators. These studies will aim to experiment with and enhance the usability and effectiveness of the CV technology for the variety of end-users and trucking organizations.
Conclusion
Eye glance behavior is a multi-faceted construct; understanding the whole-picture effects of exposure to the CV warnings necessitated a thoughtful examination of multiple distinct and interdependent metrics. Overall, the display of the CV weather warnings and WZWs were found to induce glances to the HMI that are well within the typical range of in-vehicle devices. Nonetheless, the mean HMI glance duration metric is not well posed to reflect the complexity of the interaction with the HMI. The interplay of the eye glance metrics suggested that the weather notifications did not induce any notable visual or cognitive workload demands to the truck drivers. This was attributed to the display of a few elements of information resulting in little to no clutter on the HMI. This is also considering in the favorable clear/normal driving conditions making the interaction with the HMI seemingly an easy task. On the other hand, exposure to the CV WZWs induced considerable visual/cognitive workload demands to the participants. This was substantiated across a wide array of eye glance metrics suggesting not only an increased allocation of the subjects’ visual resources away from the driving scene but also fragmentation in the subjects’ visual and cognitive attention between the WZW displays and the demanding driving environment. In light of these findings, the design of the WZW application is being re-evaluated by the WYDOT to minimize the distraction introduced from the application.
Footnotes
Acknowledgements
The authors gratefully acknowledge the support of the entire pilot participants. The authors would also like to recognize the contributions of Dr. Sherif Gaweesh with the conception and design of the driving simulator scenarios.
Author Contributions
The authors confirm contribution to the paper as follows: study conception and design: Mohamed M. Ahmed, and Omar Raddaoui; data collection: Omar Raddaoui; analysis and interpretation of results: Omar Raddaoui and Mohamed M. Ahmed; draft manuscript preparation: Omar Raddaoui and Mohamed M. Ahmed. Both authors reviewed the results and approved the final version of the manuscript.
Declaration of Conflicting Interests
The author(s) declared no potential conflicts of interest with respect to the research, authorship, and/or publication of this article.
Funding
The author(s) disclosed receipt of the following financial support for the research, authorship, and/or publication of this article: This research was funded by the Wyoming Department of Transportation #RS04218 and the U.S. Department of Transportation #DTFH6116RA00007.
The opinions, conclusions, and recommendations brought in this paper represent the authors’ views and not necessarily those by the sponsoring organizations.