
Abstract
In 2017 the Federal Transit Administration (FTA) awarded Pierce Transit of Lakewood, WA a $1.66 million grant for a bus collision avoidance and mitigation safety research and demonstration project. The project scope includes installation of an advanced technology package, the Pedestrian Avoidance Safety System (PASS) that uses lidar sensors to trigger an automated deceleration and braking system. An “alpha testing” phase included shipping a Pierce Transit bus to Blacksburg, VA for closed-course testing of PASS on Virginia Tech Transportation Institute’s (VTTI’s) Smart Road facility. In addition, VTTI developed a system to observe, measure, and analyze passenger motion during braking events. Following completion of testing at VTTI, the bus will be returned to Pierce Transit. Together with three additional buses currently being outfitted with PASS, all four will be equipped with Transit Event Logging System (TELS) video processers developed by University of Washington’s Smart Transportation Applications & Research (STAR) Lab to analyze PASS accuracy for “false positives” and “false negatives.” Upon successful completion of in-service engineering testing of the initial four buses, an additional 26 buses will be equipped with PASS and all 30 will be monitored using telematics for a year-long demonstration. This paper discusses project background and organization, describes the PASS being tested, provides an overview of the alpha testing, describes project data collection processes, and reviews the criteria and metrics being used to evaluate the system. The paper concludes with observations about lessons learned to date.
Although transit bus passengers are more than three times safer than automobile passengers when comparing the rate of fatalities per 100 million passenger miles ( 1 ), they can be made even safer. In 2017, a typical year, transit buses and vans were involved in 4,739 collisions, 16,353 injuries, 98 fatalities, and reported $717 million in casualty and liability expenses ( 2 ).
Of particular concern is the increasing trend in casualty and liability expenses shown in Figure 1. In a recent TRB Innovations Deserving Exploratory Analysis (IDEA) project, researchers estimated that 65% of $53 million in bus casualty and liability claims paid out resulted from preventable collisions ( 3 ).
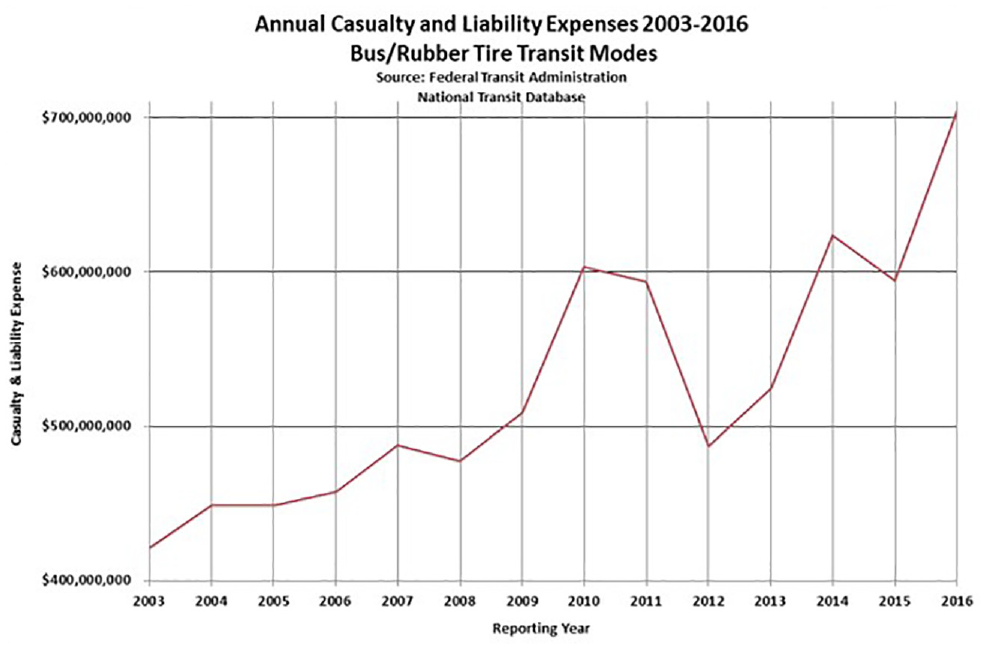
Annual casualty and liability expenses.
In 2016 the Federal Transit Administration (FTA) published a notice of funding opportunity (NOFO) and solicitation of proposals “to demonstrate and evaluate innovative technologies and safer designs to improve public transportation safety” ( 4 ). FTA allocated $7 million for the solicitation and explicitly encouraged the submission of proposals for innovative technologies for collision avoidance and mitigation.
Based on the IDEA project cited above, it was estimated that collision avoidance warning systems had the potential to reduce pedestrian collision claims by 43% and forward collision claims by 72% ( 5 ). With the addition of automatic emergency braking it was estimated that claims could be reduced even more because the systems have the ability to reduce perception and reaction times. With that in mind, Pierce Transit submitted a proposal in response to the NOFO. Pierce Transit’s proposal was one of 14 projects selected for funding by FTA in 2017.
In addition to Pierce Transit, the grantee, the team includes key partners: DCS Technologies, Inc. (DCS), Jerome M. Lutin, PhD, LLC, Munich Reinsurance America Inc., University of Washington, Virginia Tech Transportation Institute (VTTI), Veritas Forensic Accounting, and the Washington State Transit Insurance Pool (WSTIP).
Project Scope
Pierce Transit’s initial proposal was to deploy 176 buses equipped with second generation collision avoidance warning systems (CAWS) and to equip 30 of those buses with automatic deceleration and emergency braking (AEB) provided by another vendor. The initial scope was subsequently modified to eliminate further deployment of CAWS and reallocate resources to focus on automated braking. The primary objective is to not only deploy and demonstrate this life-saving technology, but to accurately determine the business case for investing in CAWS and AEB.
When the project was conceived, an existing CAWS was to be used to trigger a separate AEB system. The CAWS vendor and Pierce Transit were unable to reach agreement on contractual issues, therefore that vendor did not participate in the project. Consequently, the AEB system vendor agreed to undertake development of a sensor package to trigger deceleration and braking. That led to inclusion of the alpha testing phase in the project scope.
The project scope includes five phases. This paper selectively focuses on activities in some of the phases but not all.
Phase A. Test Planning, Instrumentation, and Documentation ○ Project management setup, work plan development, public board actions, and contract execution ○ Site visits and facility surveys at Pierce Transit and VTTI ○ Develop safety, installation, and test plans ○ Deliver a Pierce Transit bus to VTTI’s Smart Road test track in Blacksburg, VA
Phase B. Closed-Course Alpha Testing and Passenger Motion Testing ○ Develop test scripts for collision avoidance maneuvers ○ Equip first bus with collision avoidance system ○ Test collision avoidance system on test track ○ Test collision avoidance system under rain and fog on test track ○ Develop passenger motion testing methodology
Phase C. In-Service Engineering and Data Collection Testing ○ Develop on-board video processing for detection of false positives and false negatives ○ Install three systems for initial systems testing and engineering modifications at Pierce Transit ○ Develop driver survey questionnaires ○ Return first bus to Pierce Transit
Phase D. Revenue Service Field Demonstration ○ Develop data collection, storage, and analysis systems ○ Install collision avoidance systems on 26 additional buses for a total of 30 ○ Operate buses in revenue service in data collection mode only (stealth mode) ○ Train and survey drivers ○ Operate buses in active mode and collect data
Phase E. Project Reporting and Evaluation ○ Report on driver acceptance and system performance ○ Report on economic return on investment ○ Undertake knowledge transfer and outreach activities ○ Prepare interim and final reports
System Being Tested
The Pedestrian Avoidance Safety System (PASS) was developed initially as a SAE Level 1 system. It automatically decelerates the vehicle when an imminent pedestrian collision is identified by the detection and warning system. The system provides active (automatic deceleration) assistance to the driver in avoiding or reducing the severity of a collision. It uses a standalone microprocessor-based controller with proprietary sensor fusion algorithms to integrate pedestrian detection and warning sensor systems with the vehicle powertrain and brake systems. Monitoring the CAWS warning data and vehicle dynamics (speed, direction, throttle and brake position, etc.), the system determines within a fraction of a second if automatic action is required (
6
).
The vendor developed a pedestrian and forward vehicle detection sensor package to detect and calculate the potential for imminent collisions with the bus. It uses an array of three light detection and ranging (lidar) sensors attached to the front of the bus, as shown in Figure 2. The sensors are attached to a mounting bracket immediately below the foldable bicycle rack. The sensor array had been tested on several types of vehicles but had not been deployed on a bus. Consequently, the decision was made to conduct closed-course testing, “alpha testing,” at VTTI on the Virginia Smart Roads facility to characterize the system’s capabilities and fine tune it.
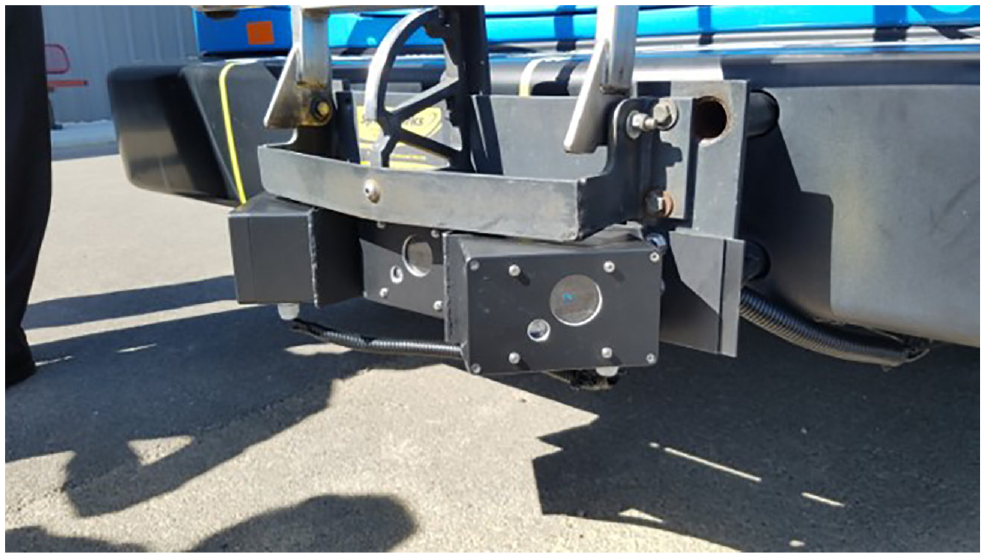
Lidar sensor package for collision avoidance.
Alpha Testing
VTTI and the vendor jointly developed a test plan for simulating collisions with pedestrians, “vulnerable road users” (VRUs
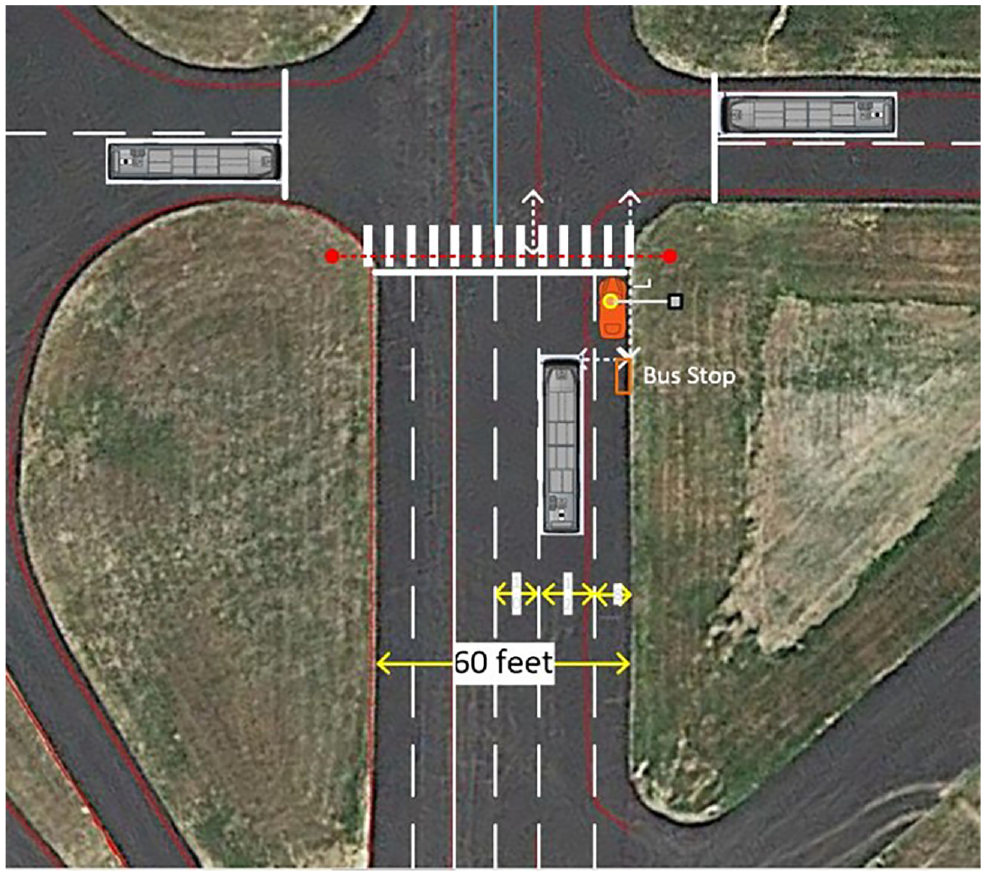
Drone view and graphical overlay of bus approaches on test track intersection.
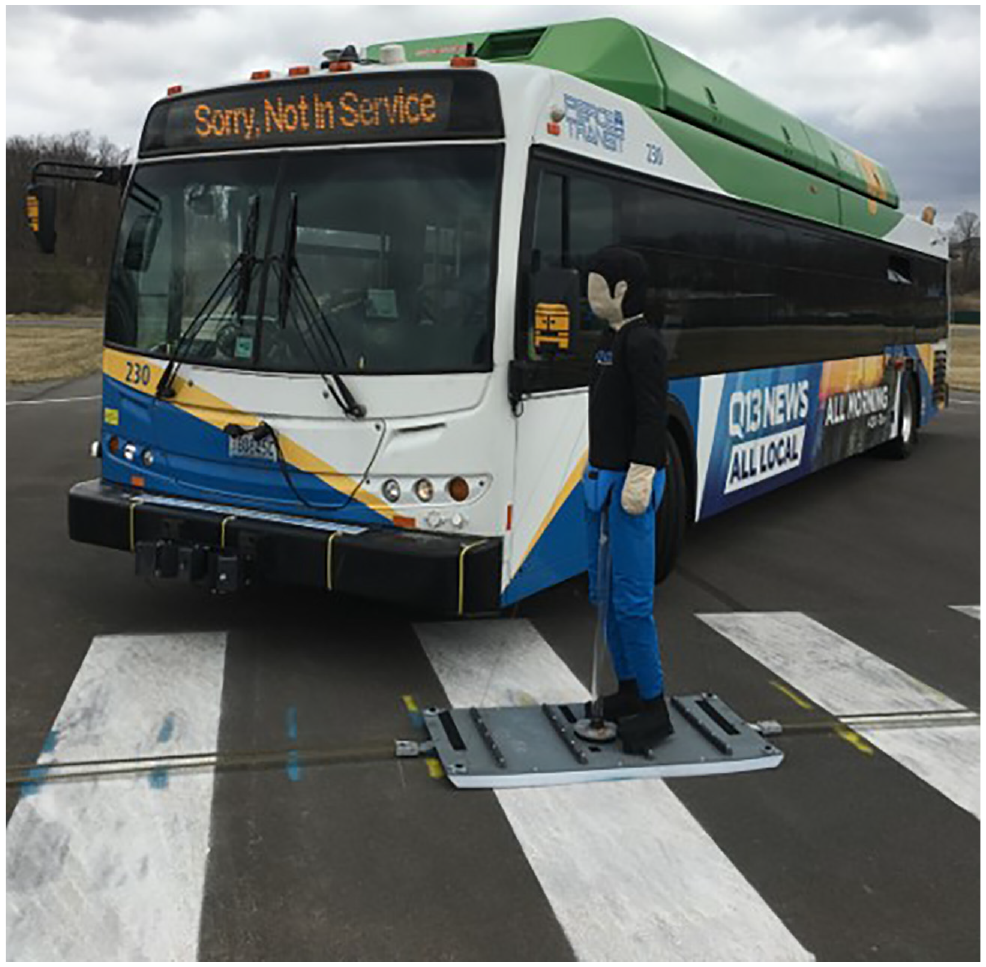
Vulnerable road user collision avoidance test.
Most of the alpha testing was conducted during two vendor site visits to VTTI, one in mid-March and the second in late April 2019. More than 400 test runs were conducted including collision avoidance bus runs at various speeds with static VRUs, walking and running VRUs, occluded VRUs, and forward collision avoidance with simulated moving vehicles. Both day and night testing were conducted for both VRUs and vehicles. Weather testing under simulated rain and fog conditions was conducted on April 30, 2019 and May 7, 2019. The technology was fine-tuned during the testing sessions and performance was deemed satisfactory for deployment in the next project phase.
Passenger Motion Testing
Though collision avoidance and emergency braking systems have been successfully developed for trucks and autos and are in widespread use, none has yet been deployed for transit buses. Unlike auto and truck passengers, transit bus passengers are unrestrained and may be standing. Consequently, automated braking for transit buses must be designed to avoid injuring passengers during deceleration, more precisely defined as negative acceleration. Deceleration, which is the rate at which speed is reduced, and “jerk,” which is the rate of change in acceleration or deceleration, must be closely controlled. Research in this area is limited ( 8 ). One classic study, conducted in 1932 for streetcars, tested the effects of braking on standing passengers ( 9 ). McGean provides braking limits for standees of 0.25 g for deceleration and 0.1 g/s for jerk, but cites no reference ( 10 ). A study by Jongkees and Groen in 1942 found that subjects could passively, meaning without support, maintain balance while undergoing up to 48 cm/s2 (0.48 m/s2) (11). More recently, a study by Graaf and Weperen in 1997 looked at the maintenance of balance while riding on public transit, including buses. Their study results led to recommendations that the restriction of the onset of acceleration, or jerk, should be limited to 0.5 to 0.6 m/s3 (12) However, again this guidance was limited to passive standing riders without support, whereas many standing riders on buses choose to remain supported using handrails or straps. Clearly, more work is needed in this domain, specifically based on in situ measurement.
VTTI was tasked to develop a methodology to measure and evaluate the effects of manual and automated braking on bus passengers to draft a standard for autonomous braking for buses. Data will be collected to compare manual braking with automated braking and determine passenger tolerance. VTTI has completed engineering of a passenger motion capture system that records the forces acting on passengers, signals from the PASS via the bus’s controller area network, (CAN bus), and captures videos of passenger motion. Images are blurred to protect individual privacy. VTTI’s institutional research board will review the protocol for approval.
The system uses software developed by VTTI running on a Neousys Technologies Nuvo in-vehicle edge computer using an NVIDIA graphics card. The Nuvo will collect the following data elements for two field buses on 2TB hard-drives: passenger motion stereo-vision measures, blurred interior camera (for motion verification), blurred forward camera (braking event context: vehicle, pedestrian, or other), vehicle CAN (e.g., brake status, speed), vehicle motion (i.e., accelerometers, 20 Hz), vehicle location (i.e., GPS 5 Hz), and PASS on vehicle CAN (i.e., warning and caution signals).
System Performance Monitoring
In the IDEA project cited earlier, it was found that collisions were rare events. WSTIP transit agencies participating in the pilot averaged one reportable collision per 812,335 mi and one injury per 344,964 mi. None of the CAWS-equipped buses in that study experienced collisions during the data collection period. Although none of the CAWS-equipped buses were involved in a reportable incident, the probability was that they might not have experienced a collision or injury had they not been equipped with CAWS, simply because of the limited test period ( 13 ). Consequently this project is increasing the number of buses and the number of miles traveled. The current plan includes operating 30 PASS-equipped buses over a full year. Based on prior years, the PASS-equipped fleet is estimated to accumulate just over one million miles of service. However, it is still possible that during the test period there may be insufficient numbers of collisions to calculate system effectiveness with statistical certainty, so other metrics are being used.
CAWS activations occur when a pedestrian or vehicle is calculated to be on a closing trajectory leading toward an imminent collision with the bus. If no collision takes place, these events are termed “near misses.” The previous study found that bus drivers who received warnings from the CAWS experienced fewer near misses per 1,000 mi than drivers on buses that had CAWS installed for collecting data without providing warnings. Those CAWS-equipped buses not issuing warnings were said to be operating in “stealth mode.”
The rate of near misses was used as a proxy measure for system effectiveness. This project will test that hypothesis. This project will test the frequency of near misses during a period of stealth mode operation and a subsequent period in which CAWS/AEB is active. The before-and-after data will be used to compare samples of CAWS/AEB-equipped buses with buses that are not so equipped. It will also examine changes in the rates of near misses experienced by drivers as they gain experience with CAWS/AEB.
False Positive and False Negative Processing
False positives are defined as events in which the collision avoidance system triggers a warning or activates emergency braking when there is no imminent collision. False negatives are defined as events in which a collision is imminent but the system neither warns the driver nor activates braking. False positives can produce an uncomfortable ride and irritate drivers. False negatives are more serious because they can lead to a collision. False positives and false negatives both can erode confidence in the technology.
Given the challenge of manually checking and recording the large amount of data associated with false positives and false negatives, University of Washington’s Smart Transportation Applications and Research Laboratory (STAR Lab) is developing a new on-board video processor, the Transit Event Logging System (TELS), which uses cameras to automatically filter out events less likely to contain an imminent collision, detect near misses, and identify false positives and false negatives. The video processor uses an NVIDIA Jetson TX2 embedded system to receive a continuous feed from a forward-facing camera whenever the bus engine is running.
Video clips will be stored continuously in a buffer for immediate retrieval. The video feed will be processed through an object detector that can categorize objects as VRUs or vehicles and measure their trajectory and closing rate (time to collision) with respect to the bus. If the trajectory and time to collision appear to lead to an imminent collision, the processor will record it as a near miss and record video scenes immediately before and after the event. The system has been tested and refined using more than 200 video clips taken from different on-board cameras. Figure 5 shows an example of the processor categorizing objects as persons and cars.
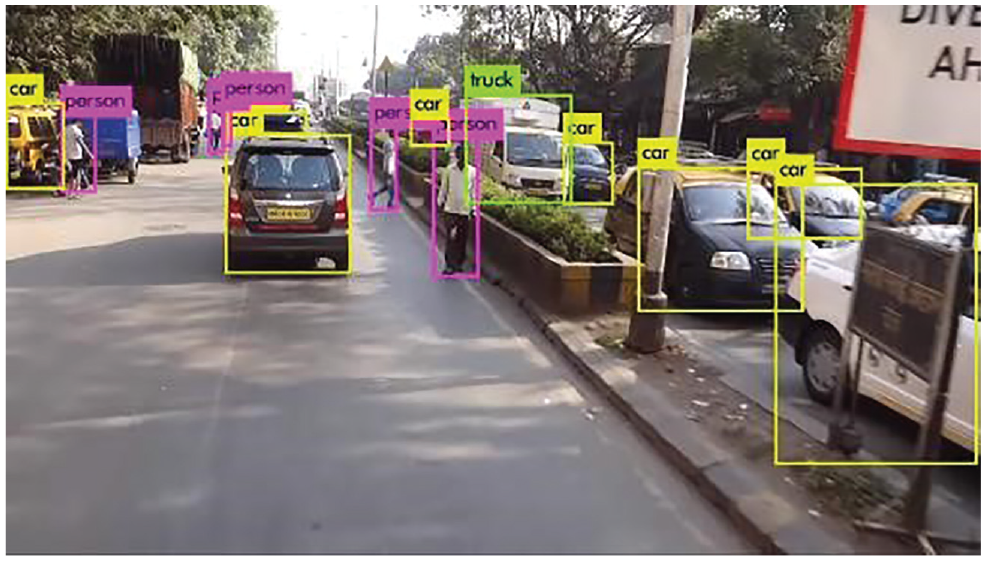
Video processing of objects.
TELS will be continuously searching its video feed for VRUs and vehicles. If a VRU or vehicle is estimated by TELS to be at risk of collision, it will check to determine whether PASS has sent an alert signal. If no signal is received from PASS, the video clip will be stored and labeled as a potential false negative.
In addition, the PASS will signal the TELS processor if PASS’s lidar detectors identify an imminent collision. TELS will then retrieve a video clip for several seconds before and after the signal and check the video for the presence of a VRU or vehicle. If neither is identified, the clip will be saved for analysis and labeled as a potential false positive.
Recorded video clips will be downloaded and checked manually to validate false positives and negatives. In addition, random samples of video will be downloaded and manually checked for the presence of VRUs or vehicles to verify the accuracy of TELS and patterns that may be missed by both PASS and TELS.
Data Collection Process
Under the terms of the FTA grant, data collection and sharing constitute a significant part of the project scope. Three aspects of the project will collect significant amounts of data on a daily basis: PASS performance data from 30 buses, false positive and false negative data from four of those buses, and passenger motion data from two of the 30 buses. Passenger motion data will be downloaded by manually exchanging the 2TB on-board drives periodically and transferring the files to a secure server. False negative and false positive data and PASS performance data will be downloaded wirelessly to a secure server. Pierce Transit is providing access to its cellular data plan for wireless downloads from the buses.
To enable data analysis at a granular level for each bus and each driver, data will be extracted from Pierce Transit’s existing computer-aided dispatch/automatic vehicle locator (CAD/AVL) system. The CAD/AVL data include identification numbers for each bus, driver, route, trip, time point, and schedule on-time performance. Table 1 provides a summary of the data being collected.
Data to be Collected
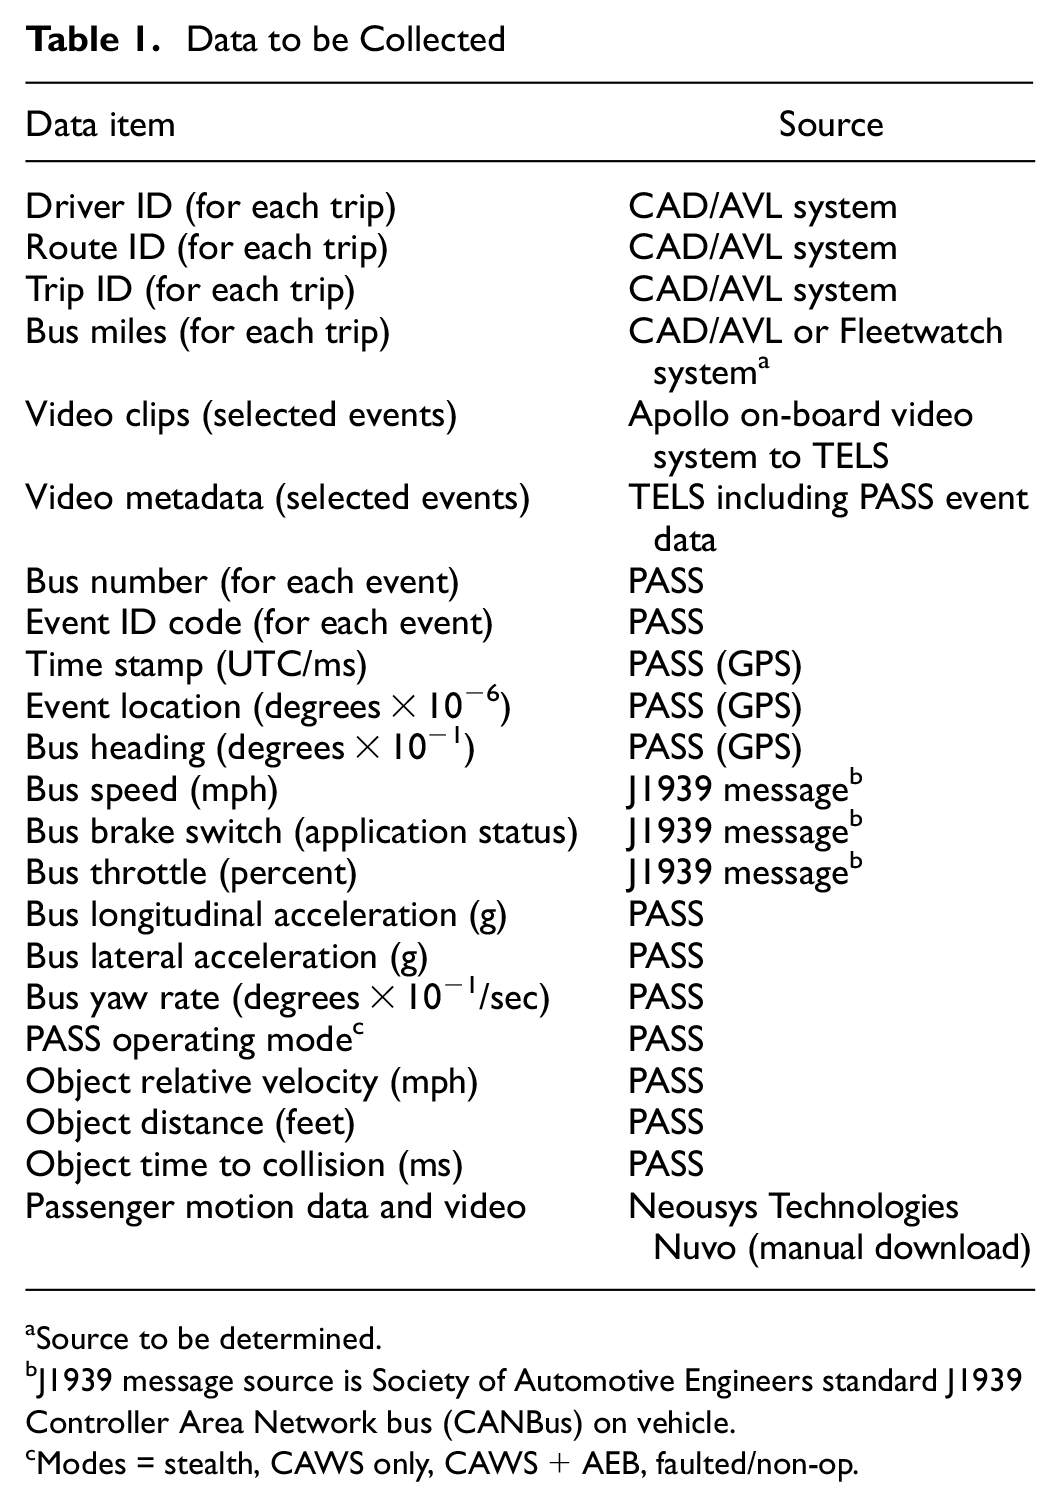
Source to be determined.
J1939 message source is Society of Automotive Engineers standard J1939 Controller Area Network bus (CANBus) on vehicle.
Modes = stealth, CAWS only, CAWS+AEB, faulted/non-op.
Project Evaluation Criteria and Metrics
The project has well-defined performance metrics that will be documented at key milestones and in the interim and final reports. The metrics include:
Accuracy of CAWS in relation to false positives and false negatives per 1,000 mi.
Reductions in collision near misses by comparison of CAWS warnings per 1,000 mi before and after driver warning displays are activated.
Long-term driver performance changes measured in CAWS warnings per 1,000 mi for individual drivers over the duration of the data collection period.
Reduction in reaction time because of CAWS/AEB.
Reductions in collisions, injuries, and fatalities, measured over the data collection period and compared with historical data for prior years.
Reductions in insurance claims expenses measured by the monetary value of claims incurred over the data collection period compared with historical data for prior years.
Net future benefit measured by estimated reductions in claims and internal costs not reimbursed by insurance less the installation and maintenance costs for CAWS/AEB, and extrapolated to other WSTIP members.
Driver acceptance of CAWS/AEB measured through questionnaire surveys of drivers during the project.
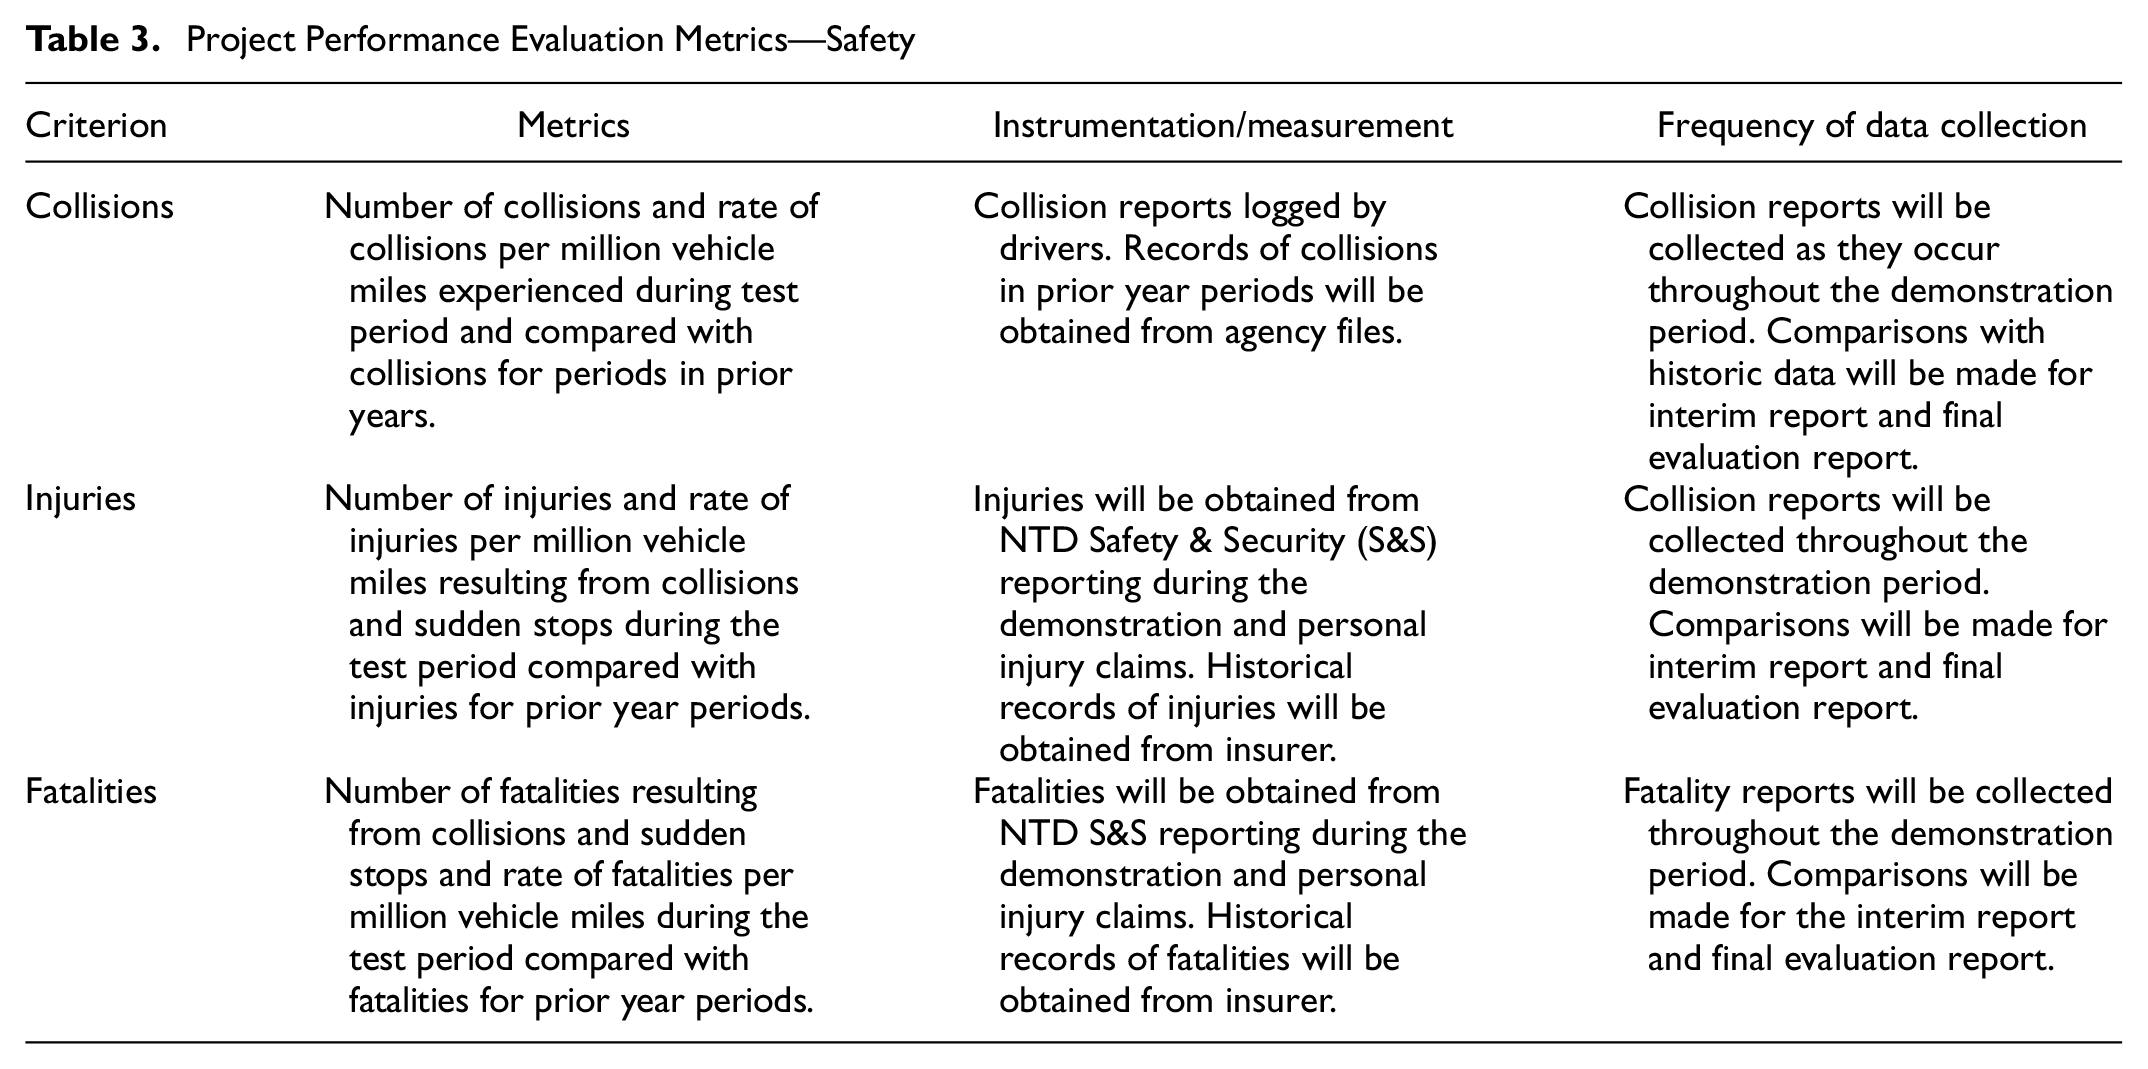
Tables 2 to 4 show performance evaluation metrics: system effectiveness, safety, and return on investment. For each category several criteria are presented together with the metrics used, instrumentation or records collected, and frequency of collection.
Project Performance Evaluation Metrics—System Effectiveness
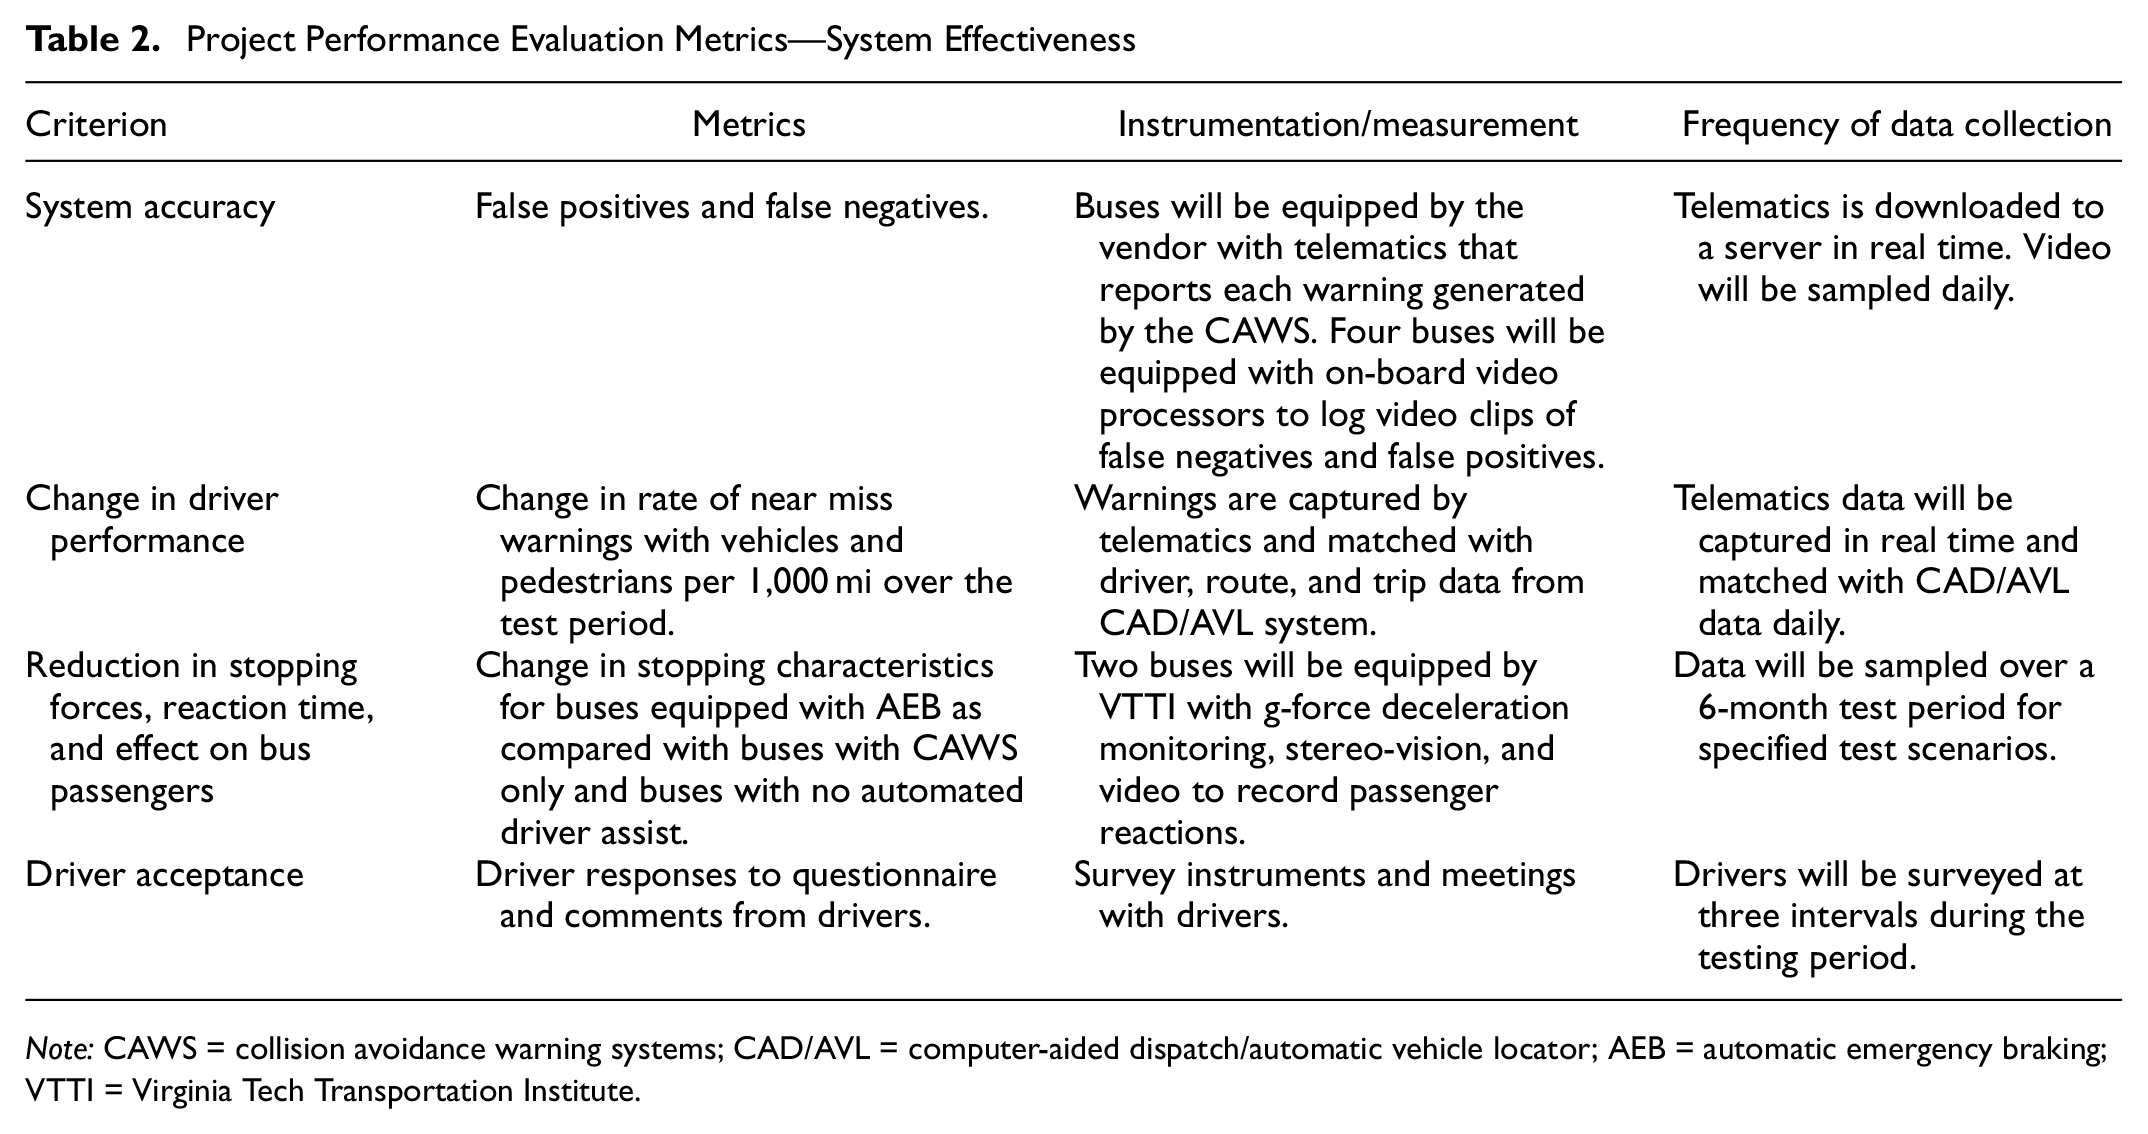
Note: CAWS = collision avoidance warning systems; CAD/AVL = computer-aided dispatch/automatic vehicle locator; AEB = automatic emergency braking; VTTI = Virginia Tech Transportation Institute.
Project Performance Evaluation Metrics—Safety
Project Performance Evaluation Metrics—Return on Investment
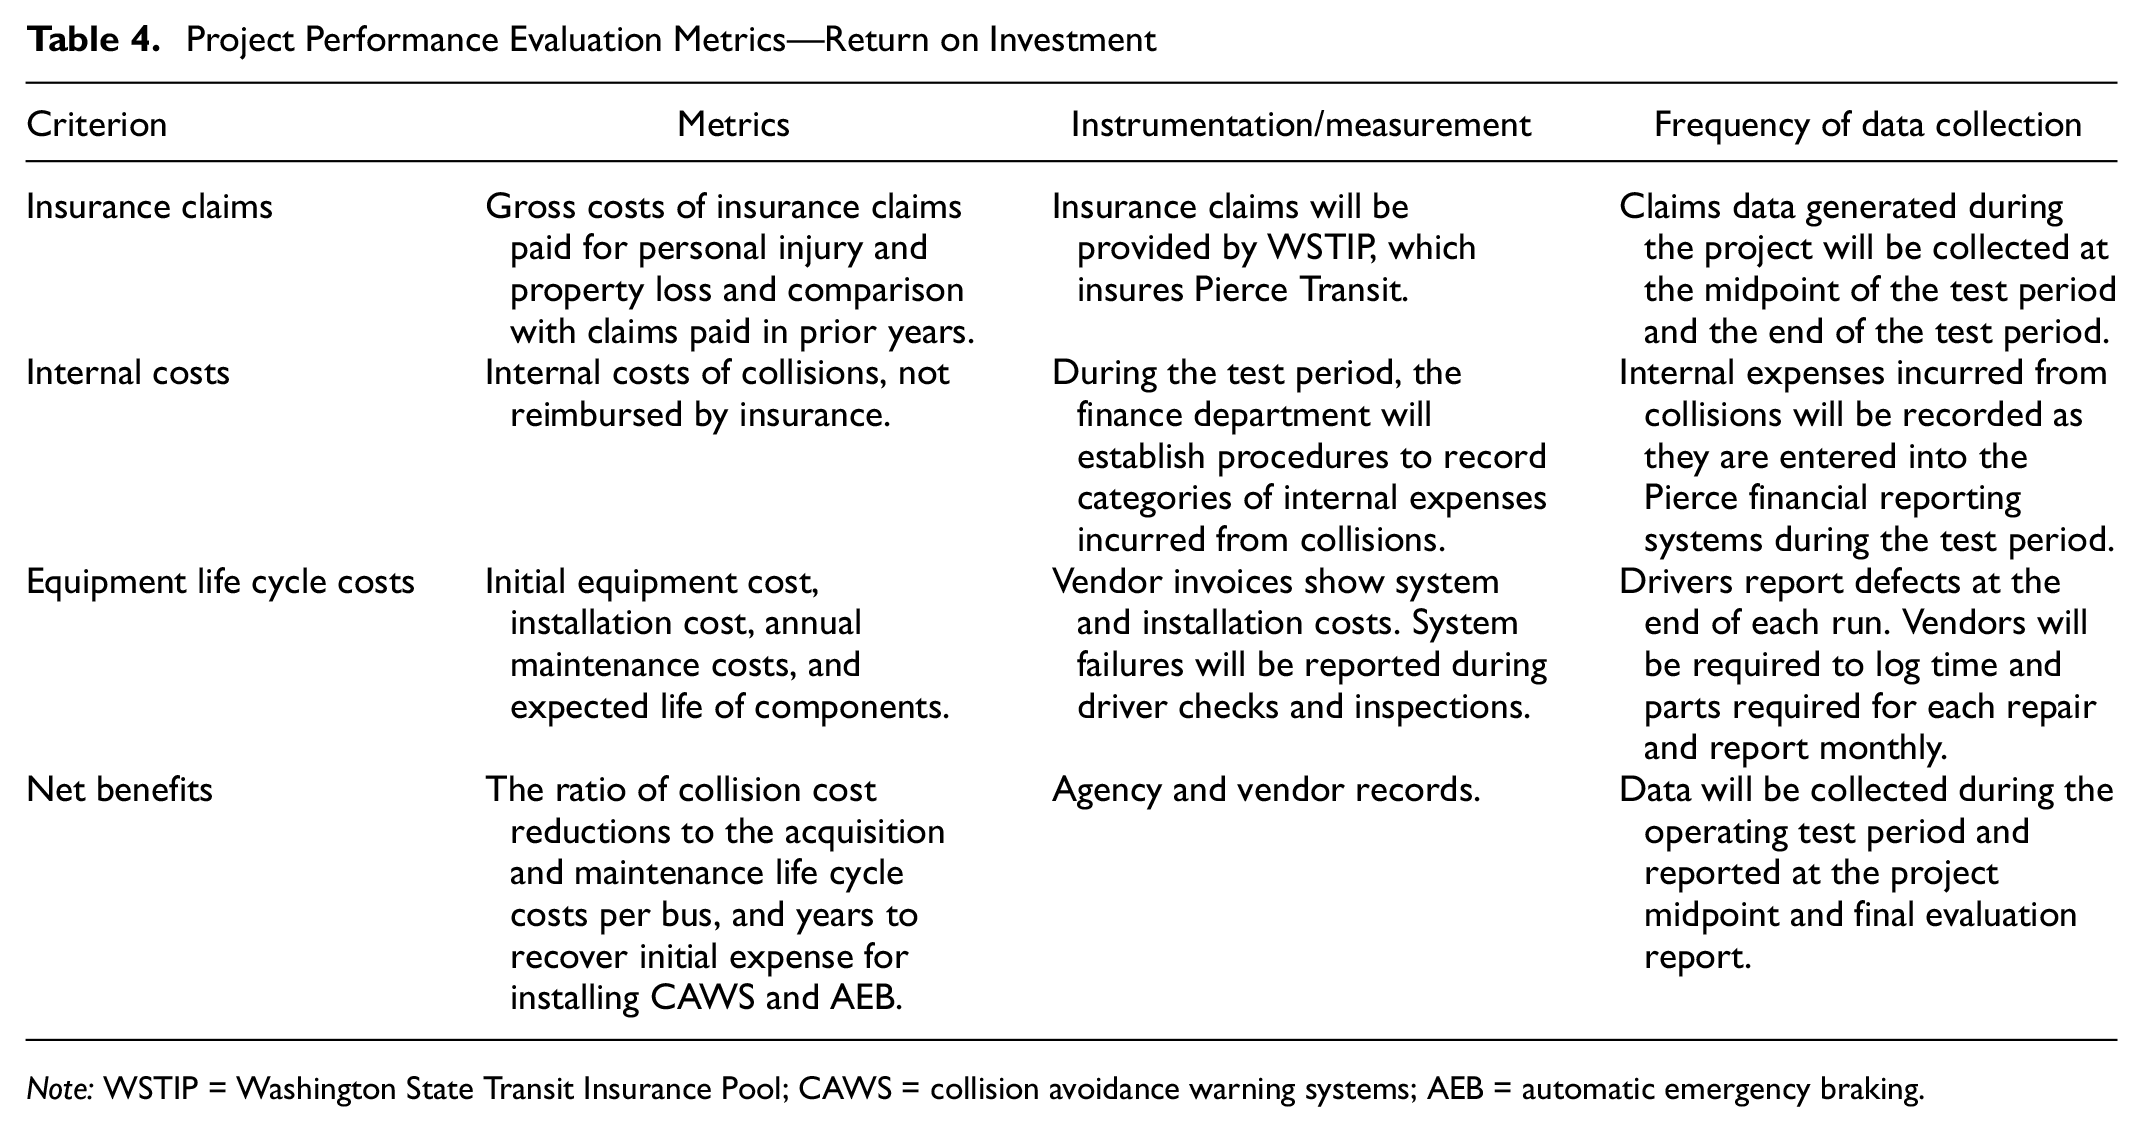
Note: WSTIP = Washington State Transit Insurance Pool; CAWS = collision avoidance warning systems; AEB = automatic emergency braking.
Lessons Learned so Far
Lessons learned so far fall into two main categories, undertaking research in the transit environment and retrofitting buses with advanced technology.
Undertaking Research in the Transit Environment
The primary mission of transit agencies is to provide safe and reliable transportation to the public. Transit agencies are highly visible and responsible for providing consistent, good service daily with no interruptions or disruptions. On average, fares pay for only about 25% of the cost to transport a passenger. For agency staff, resources are highly constrained. Most transit agencies are governed by public boards or other governmental bodies. The responsibility for funding and operating transit ultimately rests with state and local governments that are sensitive to safety, costs, and customer complaints. These constraints frame the background for the collaboration needed for a successful project. Research into technology to improve safety involves many unknowns in relation to resource requirements and potential outcomes, creating a scenario diametrically in conflict with normal transit operations.
The lesson learned is that champions for transit research projects are needed at the highest levels of the agency. They are the ones who can allocate the resources needed and get things done. In addition, vendors and researchers need to be sensitive to the needs and mission of the transit agency.
Because of the risk elements inherent in adopting new safety technology, involvement of insurers can help smooth the way. WSTIP, which serves as insurer for Pierce Transit and 24 other transit agencies in the state of Washington, championed this project and contributed funding as part of its loss prevention program. WSTIP manages the research partners and will encourage sharing of the data and information produced by this project with its members. Munich Reinsurance America, Inc., which provides reinsurance to WSTIP, is also contributing funding to the project.
The Time Needed for Contract Negotiations was Underestimated
There were lengthy negotiations with one vendor involving intellectual property and integration with equipment supplied by a second vendor. The negotiations did not lead to contract execution and the first vendor did not participate in the project. That necessitated modification of the scope of work and reallocation of resources among other partners, which delayed the project. The lesson learned is to confirm early in the proposal stage that all partners agree on data sharing and integration of components.
The Time Needed for Board Approvals was Underestimated
Transit agency boards typically meet monthly. Several weeks are needed for staff work, preparation of resolutions and supporting documentation, and internal approvals before each board meeting. In this project actions were needed by the Pierce Transit board and the WSTIP board that had to be sequenced one after the other. The lesson learned is to understand the need and time requirements for agency approval processes when building the project schedule.
Scope Changes Led to the Need for Additional Expertise and Testing Facilities
When a proven sensor was no longer available to trigger the PASS AEB system, it was necessary to develop an alternative solution, which needed to be tested under closed-course conditions. The lessons learned were that having a creative engineering team can save a project, and that access to a testing facility and experienced technical staff should have been a priority in preparing the proposal. Fortunately, there were partners on the team who could meet those needs.
Retrofitting Buses with Advanced Technology
Building hardware and software systems for retrofit and use in a legacy bus presents different challenges from building stationary systems or integrating systems into new automotive designs. If federal funding is used for bus purchases, buses must remain in service for at least 12 years. Most agencies seek to keep buses in service even longer, typically for 15 to 18 years. To reap the benefits of advanced safety technology as soon as possible, retrofits are needed.
Most buses in use now were not designed to anticipate installation of sensors, additional heat-producing electrical equipment, additional antennae, and additional sources of electromagnetic interference. Nor were the electrical systems designed to power numerous electronic components that would be sensitive to fluctuations in voltage. As a result, several lessons were learned.
Locating Sensors on the Front of the Bus was a Challenge
Lidar sensors needed unobstructed fields of view and could not be located inside behind the windshield. Folding bicycle racks took up much of the prime sensor real estate on the front of the buses. The vendor overcame this challenge by attaching the sensors to a bracket under the bicycle rack as shown in Figure 2. The lesson learned here is the need for flexibility in sensor placement requirements, and a bit of engineering creativity.
Equipment Space is at a Premium
In addition to the sensor package, space was required for the PASS data logger, the actuation unit, and connections to the CAN bus. In addition, space is needed on four of the buses for the Jetson video processors and on two of the buses space is needed for the Nuvo passenger motion processor. Additional space in other locations on the bus is needed for GPS antennae and cameras associated with the Jetson and Nuvo processors.
Most of the equipment can be installed in an existing locally fabricated electrical cabinet above the left front wheel well immediately behind the driver. Space in the cabinet is already taken up by the Orion CAD/AVL equipment, Orca fare collection equipment, Apollo video system and recorder, and the bus radio system. Pierce Transit granted permission to reposition some of the existing equipment within the cabinet to accommodate some new components. The lesson learned is to size new retrofit equipment as compactly as possible and look for opportunities to relocate existing equipment to accommodate new devices.
Bus Electrical Power can be Unstable
The DC Voltage on test buses was found to vary widely, in one example from 9 to 34 V. In addition, power on the direct battery circuit, from which most of the electronics are powered, can be “knifed” or cut off unexpectedly in the middle of data and software uploads and downloads. The lessons learned are to use ruggedized automotive grade power regulators and to build robust operating systems that can reboot and restore automatically.
Conclusion
Although the project is still in the early phases, there is much information that can be transferred to the research community from this project. Project phasing, data collection, evaluation methodology, and lessons learned have relevance to other safety research projects and can help other researchers avoid some of the challenges that had to be overcome in this project. The research team is happy to answer questions and share information.
Footnotes
Acknowledgements
We thank Vincent Valdes, Associate Administrator and Roy Wei Shun Chen, Safety Research Program Manager of the FTA. We wish to thank Tracey Christianson, Executive Director and Matthew Branson, Member Services Manager, of WSTIP, and Joanne Kerrigan, former Member Services Manager of WSTIP. We also extend our gratitude to Sisinnio Concas, Director Autonomous and Connected Mobility Evaluation Program, Lisa Staes, Director Transit Safety and Workforce Development Programs, and s Jodi Godfrey, Senior Research Associate, of the Center for Urban Transportation Research, University of South Florida. We also thank Michael Scrudato, Senior Vice President, Strategic Innovation Leader, and Bruce Weisgerber, Mobility Solutions Center Leader of Munich Reinsurance America, Inc. We also extend our gratitude to the staff at the Virginia Smart Roads facility and Pierce Transit who have made invaluable contributions to the project. We especially wish to thank Janet Gates, Project Coordinator, for her invaluable contributions to the project.
Author Contributions
The authors confirm contribution to the paper as follows: study conception and design: J. Lutin, H. Soule, S. Huck, A. Krum, Y. Wang, D. Valadez, D. Sellers; data collection: A. Krum, D. Valadez, D. Sellers, R. Ke; analysis and interpretation of results: A. Krum, D. Valadez, D. Sellers, Y. Wang, R. Ke; draft manuscript preparation: J. Lutin, A. Krum, D. Valadez, D. Sellers, Y. Wang, R. Ke. All authors reviewed the results and approved the final version of the manuscript.
Declaration of Conflicting Interests
The author(s) declared no potential conflicts of interest with respect to the research, authorship, and/or publication of this article.
Funding
The author(s) disclosed receipt of the following financial support for the research, authorship, and/or publication of this article: Funding for this project was provided through a grant from the FTA administered by the Office of Research, Demonstration, and Innovation. Additional funding was provided by Pierce Transit, the Washington State Transit Insurance Pool, and Munich Reinsurance America, Inc., and PacTrans, U.S. Department of Transportation University Transportation Center for Federal Region 10.