
Abstract
In the past decade, transportation network companies (TNCs) such as Uber, Lyft, and Via have established themselves as a viable transportation alternative to other modes. However, the popularity of these services has come with a fair share of criticism for their negative externalities such as increasing vehicle miles traveled and congestion in cities. Pooled ride-hailing trips, in which all or a part of two individual (or group) trips are combined in and served by a single vehicle, have the potential to reduce these externalities. Pooling of rides is an effective solution to reduce congestion and travel cost, but pooled rides still represent a small percentage of the total trips served (and miles driven) by TNCs relative to single-occupancy (and without customer) vehicle miles. Both TNCs and cities alike will benefit from understanding what factors encourage or deter pooling a ride-hailing trip. In this study, newly available Chicago transportation network provider data were explored to identify the extent to which different socioeconomic, spatiotemporal, and trip characteristics affect willingness to pool (WTP) in ride-hailing trips. Multivariate linear regression and machine-learning models were employed to understand and predict WTP based on location, time, and trip factors. The results show intuitive trends, with income level at drop-off and pickup locations and airport trips as the most important predictors of WTP. Results from this study can help TNCs and cities devise strategies that increase pooled ride-hailing, thereby reducing adverse transportation and energy impacts from ride-hailing modes.
The Highway Act of 1956, signed by President Dwight David Eisenhower, focused on creating an efficient and safe highway network for transcontinental travel ( 1 ). Subsequently, significant investment in a 41,000-mi interstate system combined with breakthroughs in automobile manufacturing helped boost personal mobility in the U.S.A. An unintended consequence of these advances was that the U.S.A. became an auto-dependent nation. Privately owned cars have been the dominant travel choice for Americans due to two primary factors: (i) speed and travel time—no other mode provides (end-to-end) travel speeds and travel times close to that of cars; and (ii) convenience—a privately owned automobile (coupled with ample parking) is available anywhere, anytime. Because cars were chosen as the primary mode of travel by a vast majority of the American populace, many American cities have developed to be auto-centric in nature, creating a cycle of vehicle ownership and auto-oriented city development. From 1980 to 2010, mode share for commuting alone by car rose from 64.4% to 76.6% ( 2 ), leading to significant road congestion estimated to have cost $305 billion in 2017 ( 3 ). While affinity toward the omnipresent car mode is partly a reason for this, lack of time- and cost-efficient alternatives to cars is also to blame. For example, while transit might be a cost-efficient travel mode, the typical drawback for transit is time inefficiency (constrained by schedules, limited routes, or both). On the other hand, while a taxi could get people to their destinations quickly, taxis have traditionally been an expensive alternative compared with the private car. More than a century after the invention of the automobile, a travel alternative that can be compared with privately owned vehicles in relation to convenience, and time- and cost-efficiencies was introduced in the form of app-enabled services, generally known as ride-hailing, offered by transportation network companies (TNCs) such as Uber, Lyft, and Via.
Uber started offering rides in 2009, with Lyft launching a similar service in 2012 ( 4 , 5 ). Enabled by technology, TNCs provide end-to-end travel similar to taxis, yet at lower cost, shorter wait times, higher convenience of payment, and at speeds comparable to cars ( 6 ). All these factors helped in the rapid rise of Uber and Lyft in the space of just 10 years, with combined market cap in 2019 at around $100 billion ( 4 , 5 ). While TNCs have promoted themselves as an answer to the auto-centric trend, such claims are yet to be proven true. In the years following the introduction of Uber and Lyft services, evidence emerged to show that TNCs may be causing more harm than good by drawing mode share from other more sustainable modes of transportation ( 7 , 8 ) and increasing vehicle miles traveled (VMT) and congestion ( 9 ) due to an increasing proportion of empty vehicle travel, also known as deadheading ( 10 , 11 ). The ability to pool a trip through offerings such as UberPool or LyftShare, introduced in 2014 by both Uber and Lyft, was seen as a way to mitigate the negative impacts of TNC services while improving accessibility and reducing travel cost to the end user.
In a pooled ride-hailing trip (sometimes referred to as a shared ride or ridesplitting), two or more people (or groups) occupy a vehicle simultaneously for all or a portion of their trip. Despite TNCs offering ride-hailing services for close to six years, most Uber and Lyft rides are shown to serve a single passenger, with an average occupancy of 1.3 passengers per trip ( 10 ). The reasons for this could be varied and are not well understood. For instance, pooled rides can take longer than private ride-hailing trips. Therefore, such trips might not be a viable option when traveling to time-sensitive appointments (work, doctor’s visit, airport, etc.) or for riders who place a high value on travel time. Some travelers might also be hesitant to pool with a stranger. With pooled rides costing less than regular trips, individuals would have to weigh the cost savings against increased travel times, as well as discomfort (if any) in traveling with strangers. Pooling could also be influenced by spatiotemporal factors (origin, destination, time of day, etc.), as well as ride-hailing demand density and supply factors. While there are a lot of questions that need to be explored to understand the characteristics of ride-hailing travel, particularly pooled rides, research on this topic is hindered by the lack of quality data.
In observing current trends in the prevalence of pooled rides, an active research question that is yet to be answered is whether ride-hailing will prove to be a sustainable transportation alternative. A key premise may be whether the proportion of pooled ride-hailing trips can reach a significant magnitude ( 12 ). Both TNCs and cities are therefore trying to understand factors that motivate or deter people from choosing pooling. The problem, however, is the lack of access to robust empirical data to answer questions such as estimates for pooling requests from total ride-hailing trips, pooling match rates, and willingness to pool ( 13 ). In an effort to address the data availability problem, some researchers have collected first-hand information on ride-hailing trips ( 10 ), while others have resorted to revealed and stated preference surveys to understand ride-hailing adoption and usage ( 8 , 14 , 15 ). Many cities have recognized the importance of having robust TNC data to better understand and regulate this mode. One such example comes from the city of Chicago, in which any active TNC operator is required to provide data as mutually agreed upon by both the city and the TNC.
In April 2019 Chicago announced the public release of data provided by three major ride-hailing service providers: Uber, Lyft, and Via ( 16 ). In this study, the data from Chicago transportation network providers (TNP, used synonymously here with TNC) are used to understand factors that influence the “proportion of trips in which individuals indicated a willingness to pool.” The Chicago TNP data are combined with data from other sources, such as the American Community Survey and the Local Area Transportation Characteristics for Households Survey (LATCH Survey), to help answer research questions such as: (i) What are the factors that affect the proportion of trips in which individuals indicated a willingness to pool? and (ii) Can a model be built to predict accurately the proportion of trips in which individuals indicated a willingness to pool? While some studies have explored factors influencing the adoption and use of ride-hailing ( 7 , 14 , 15 ), to our knowledge, no study has yet explored the factors influencing willingness to pool ride-hailing trips. This study aims to address this gap in knowledge.
Literature Review
An extensive body of travel behavior literature is dedicated to understanding factors that influence an individual’s modal preferences. Explanatory variables such as travel times and costs ( 17 ), built environment ( 18 ), and socioeconomic factors ( 19 ) have all been shown to have significant impacts on choosing (or not choosing) certain travel modes. On the other hand, studies that explain ride-hailing travel patterns are not as extensive. When explaining behaviors such as ride pooling, researchers have made attempts to understand the levers that motivate a shift from single-occupant vehicle modes to high-occupancy vehicles. Dating back to the 1970s, Tischer and Phillips ( 20 ) identified schedule flexibility, cost, and congestion as key factors that positively influence a shift toward pooling rides. In a more recent study, Buliung et al. ( 21 ) identified spatial accessibility to matches, household auto ownership, and socio-demographics as critical factors influencing pooling behavior. Even though pooling rides is identified as a way to reduce congestion ( 22 ), pooling trends have tilted in the wrong direction for decades, even during commuting hours of peak daily travel ( 2 ). This issue begs the questions: Though ride pooling is a strategy to reduce the negative impacts of TNCs, will it ever be widely adopted? If so, what are the influencing factors?
Early studies exploring ride-hailing travel behavior have shown that mode share from several other forms of transportation, including public transit, walking, or biking, has shifted toward ride-hailing ( 11 , 23 ). However, few researchers have explored the factors that influence these shifts in behavior. For example, a mode shift from driving to ride-hailing was found to be heavily dependent on alcohol consumption, parking costs (at places such as airports), and parking availability in dense areas ( 11 , 24 ).
While the impacts of ride-hailing on travel patterns noted in the literature have included increased VMT and congestion ( 9 ), some researchers have identified pooling as one of the key elements contributing to a sustainable transportation future ( 25 ). Compared with transit, ride-hailing services such as UberPool have been shown to reduce travel time by an average of 67.6% between certain neighborhoods in Chicago ( 26 ). Algorithms have recently been developed to meet demand with a ride-hailing fleet dedicated exclusively to pooling. For example, using New York City taxi data and assuming a vehicle fleet with passenger capacity of four, Alonso-Mora et al. ( 27 ) show that 98% of taxi trip demand in a given week in Manhattan can be served with 15% of the existing fleet of 13,000 taxis. While this study helps show the potential for reduction in taxi fleet size and related road congestion, it has the drawback of simply assuming that every trip is a candidate for ride pooling, when in reality certain trips (based on location, time, traffic characteristics, and passenger preferences) have a higher likelihood of being pooled than others. Addressing this drawback, Tachet et al. ( 28 ) analyzed taxi trip data from New York City, San Francisco, Singapore, and Vienna to develop a simple mathematical model (labeled the “shareability law”) to predict the potential for ride pooling based on traffic speed and trip density. However, this work falls short of specifying spatiotemporal details that govern the willingness to pool ride-hailing trips.
Converging evidence from literature and empirical data suggest that aspirations for increases in pooled ride-hailing trips are yet to become a reality, despite new forms of experimentation. Both TNCs and cities would benefit from answers to who, why, when, and where passengers are more willing to pool trips. While the Chicago TNP data do not divulge details on characteristics of people with a high willingness to pool (WTP) (respecting privacy concerns), the data can still be leveraged to answer important questions associated with propensity for ride pooling. Thus, the goal of this research endeavor is to investigate the “why, when, and where” factors that motivate WTP in ride-hailing trips.
Data Description
The Chicago TNP data set is distinct from TNC operation data available from other cities in that its release is mandated by the city and all trips recorded either start or end in one of the 801 census tracts of the Chicago metropolitan region. The data set originates directly from the TNCs and contains a greater level of detail on certain key parameters than any other TNC data set available publicly ( 9 , 29 ). The data set consists of three separate tables: (i) a trip table containing various details regarding individual trips (a total of 45.3 million records), (ii) a driver table describing the activity of TNC drivers (5.13 million records), and (iii) a vehicle table including make-model-year information for TNC vehicles that provided rides during the reporting period (5.18 million records).
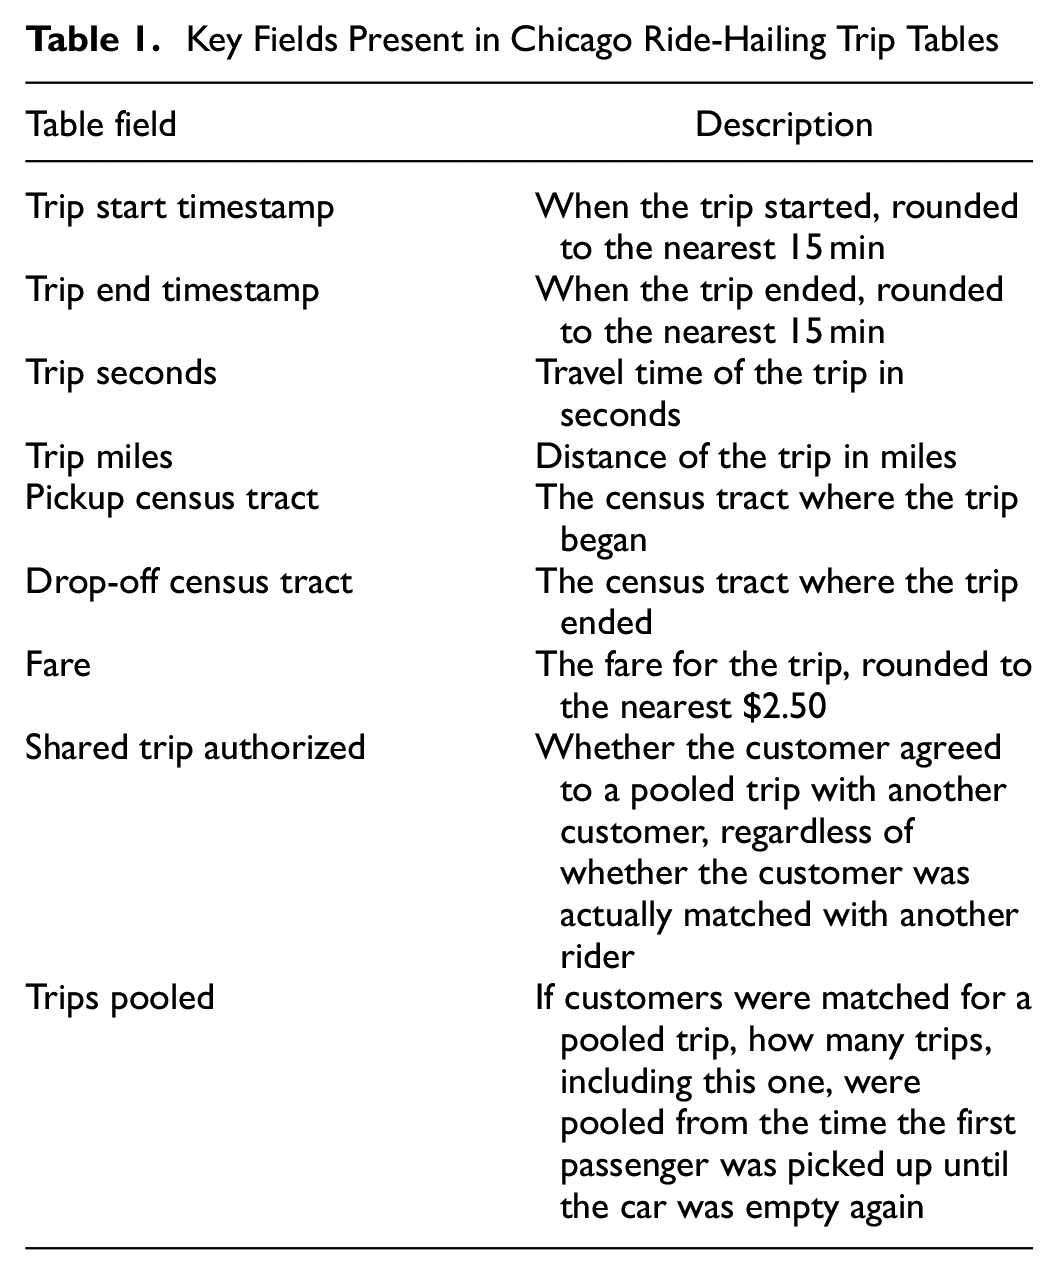
The trip table is particularly of interest for this study, as it contains the fields “Shared Trip Authorized,” indicating a rider’s selection of a pooled trip option such as UberPool or Lyft Shared, and “Trips Pooled,” which describes the number of consecutive riders that were successfully pooled (at least a portion of the counted riders’ trips overlapped with one or more of the other counted riders). Trips that are authorized for pooling but are not successfully matched with another rider are still present in the data set (with Shared Trip Authorized = True and Trips Pooled = 1). The inclusion of both these fields permits analysis surrounding the ratios of WTP expressed by passengers, as well as the likelihood that such requests may be successfully matched.
The aggregated Chicago TNP data maintain customer anonymity and obscure proprietary information (e.g., fares are rounded to the nearest $2.50, and trip pickup and drop-off timestamps are aggregated into 15-min bins). In addition, the data do not disclose which TNC provider serviced a given trip. Key features reported in the trip table data are outlined in Table 1.
Key Fields Present in Chicago Ride-Hailing Trip Tables
From the data set, a total of 45,338,599 trips taken between November 1, 2018 and March 31, 2019 were downloaded for analysis. To ensure a robust sample for analysis, a data-processing exercise was undertaken. First, trips with missing pickup, drop-off coordinates, or both were removed. Next, trips with a pickup timestamp larger than the drop-off timestamp or with durations less than 1 min were excluded. Finally, trips with fares larger than $100 or equal to $ 0 were excluded from this analysis. The data-processing criteria eliminated approximately 15% of the trips, bringing the total number for this sample down to 38,983,953. From the analysis sample, 25.8% of trip requests indicated willingness to pool a ride, and approximately seven out of 10 WTP trips (where the requester selected the pooled option) were actually matched. Average distance and duration of the trips from the analysis sample were 4.67 mi and 16 min, respectively.
The dependent variable of interest for this analysis is the proportion of trips for which passengers expressed a WTP between two Chicago census tracts in a given 15-min time bin (regardless of whether or not these trips were successfully pooled). This variable, represented by the purple trace in Figure 1, shows recurring trends by day of week. Exploration of the WTP trend revealed that the proportion of trips in which TNC customers indicated a WTP was highest during midweek and the lowest on Saturdays (with tick marks on the x-axis indicating the first and third Sundays of each month).
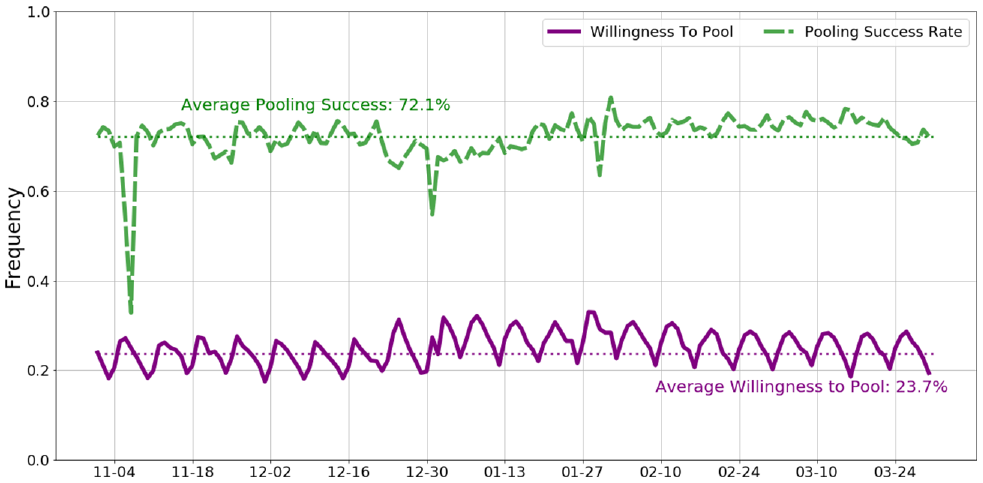
Willingness to pool and the pooling success rate of authorized trips over time.
The trip data were integrated with supplementary publicly available data for information pertaining to employment, population, income, and weather to explore how these factors might influence the proportion of WTP trips. Hypothesized contributing factors can be grouped into three categories: (i) trip-specific characteristics (e.g., trip distance, trip duration, whether the trips are airport related, and proportion of fare to be saved if pooled), (ii) temporal and environmental characteristics (e.g., day of week, time of day, weather), and (iii) location-based characteristics (e.g., population density, job density, median household income at trip origin/destination census tract).
Initial analysis of the Chicago TNP data performed by the Chicago Metropolitan Agency for Planning (CMAP) indicated that trips starting or ending in economically disadvantaged areas are more likely to be authorized for pooled rides ( 30 ). To corroborate this finding, WTP trips were aggregated at the census tract level and plotted in Figure 2a in comparison with median income in Figure 2b. These plots (as well as a statistically significant correlation coefficient of −0.714 between these variables) support the conclusions reached by CMAP and motivate the inclusion of income data in this analysis.
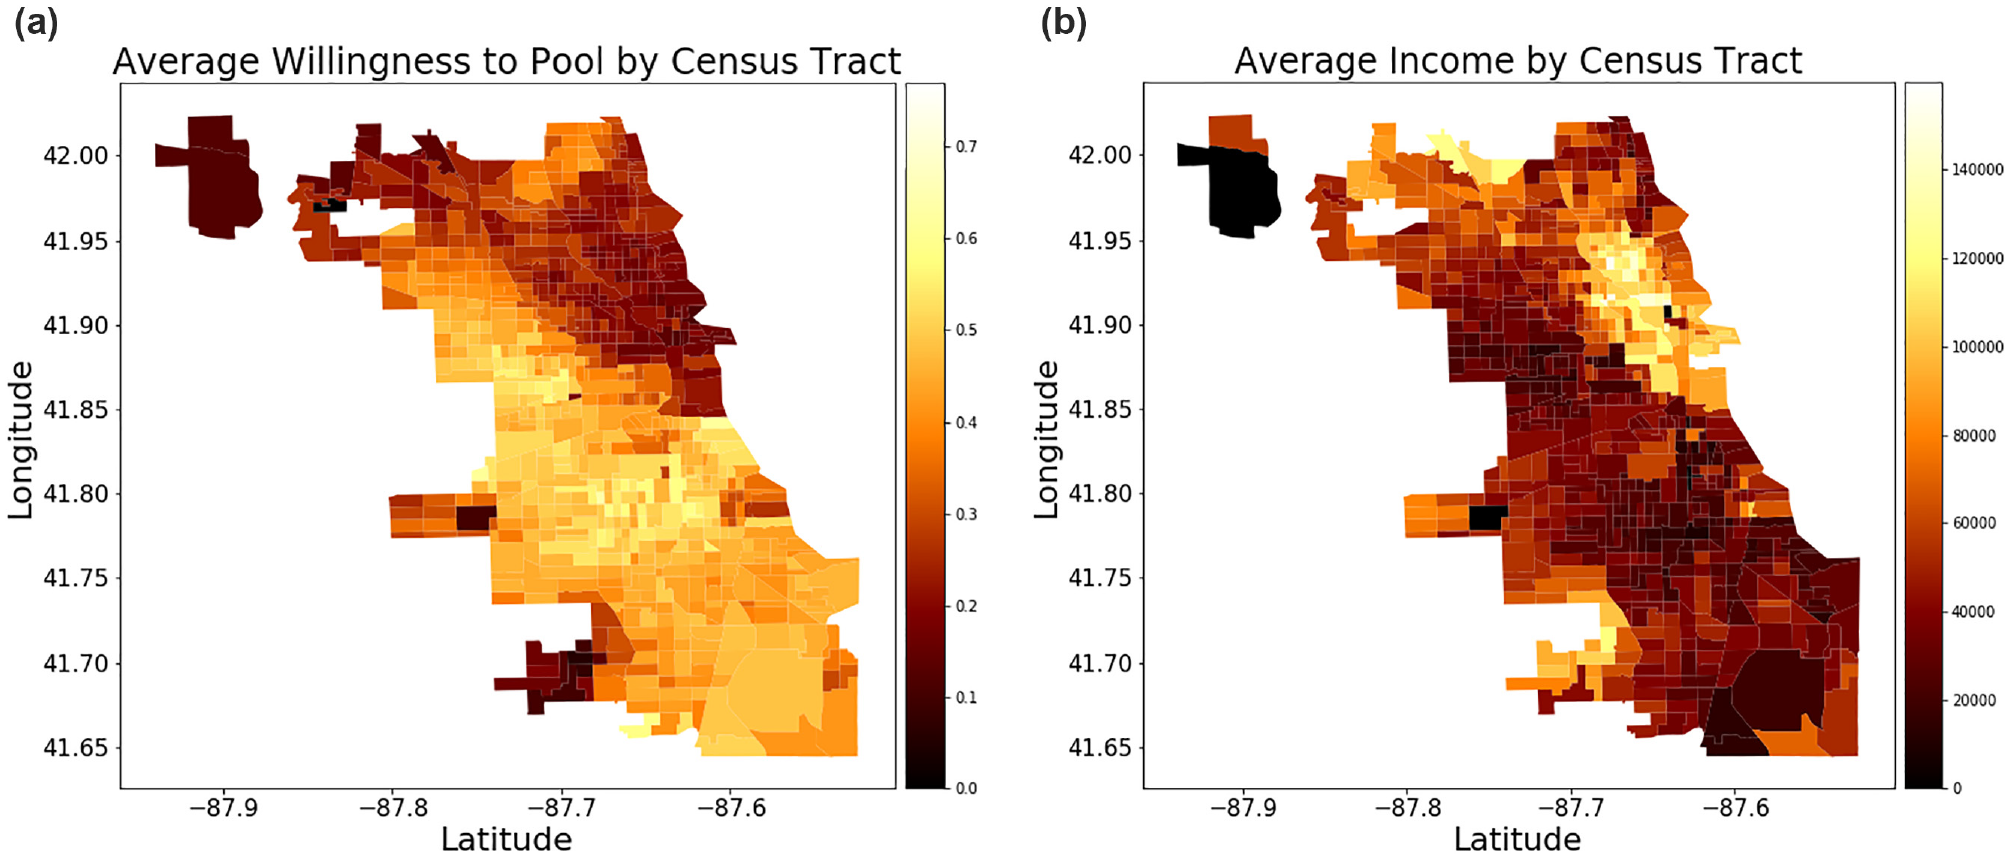
Spatial visualizations of (a) WTP likelihood and (b) median income at the census tract levels throughout Chicago.
Methodology
Data Aggregation
The data were aggregated to obtain the proportion of WTP trips for specific census tract origin–destination pairs and 15-min time bins. After the univariate analysis, it was found that all hypothesized contributing factors (in the list below) were relevant except weather (which was therefore left out of the analyses). Data were grouped into bins by the following variables: census tracts of origin–destination pairs, time of day, weekend or not, airport drop-off or not, airport pickup or not. Time of day was labeled as five time periods: midnight, morning peak, non-peak, evening peak, and night. Grouped bins with less than 100 trips were removed from the estimation set, to avoid outlier bias. Detailed descriptions of all the variables used for analysis are provided below:
Multiple Linear Regression
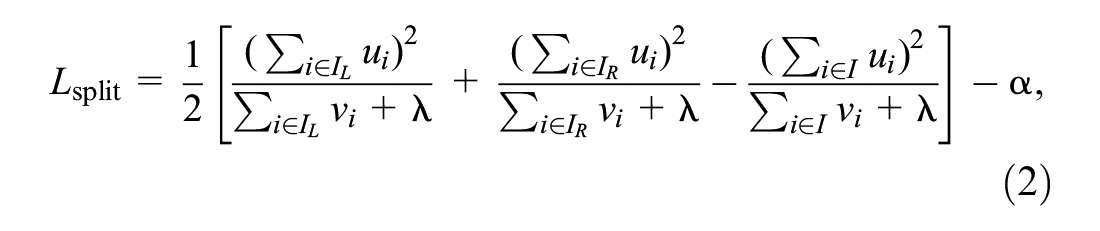
A multiple linear regression model was chosen to analyze the associations of various factors (e.g., ride-hailing trip duration, airport trip purpose, population/job density, and income) on the dependent variable WTP ratio (i.e., proportion of trips in which individuals have indicated a WTP). A linear regression model was sufficient to explore the relationship between a continuous dependent variable and an array of trip-level, day-level, and location-based factors. A linear regression model also has the benefit of offering simple and straightforward explanations between the dependent and the independent variables. The equation estimated to understand the factors influencing proportion of WTP trips is:

where:
XGBoost
While statistical models have the advantage of offering intuitive explanations between the dependent and independent variables, machine-learning models are shown to offer a higher predictive performance compared with statistical models ( 31 ). To compare these methods, a machine-learning algorithm called XGBoost was estimated alongside a simple linear regression model. Details on the XGBoost method are provided below.
XGBoost is a recently developed machine-learning algorithm in the boosted tree family ( 32 ). Similar to other boosting methods, the model is trained in a forward stagewise manner to minimize the loss function. However, the objective function of XGBoost at each iteration contains not only the training loss but also a regularization parameter.
The basic steps of XGBoost are illustrated below:
For a. Fit a regression tree
where b. Stop splitting once the maximum tree depth (set by the analyst) is reached. c. Update model
where ∈ is a shrinkage parameter.

Output
To estimate the multivariate linear regression model and XGBoost model, the data set was split into an 80:20 sample. Models were estimated using the training set (80% sample) and validated on the 20% holdout sample. Both methods were evaluated using mean absolute error (MAE) and mean square error (MSE):


where
Results
As a precursor to the model estimation exercise, a correlation analysis was carried out to unmask correlations between various parameters considered for explaining the WTP ratio. Figure 3 presents correlations observed between variables used in the final regression and XGBoost models.
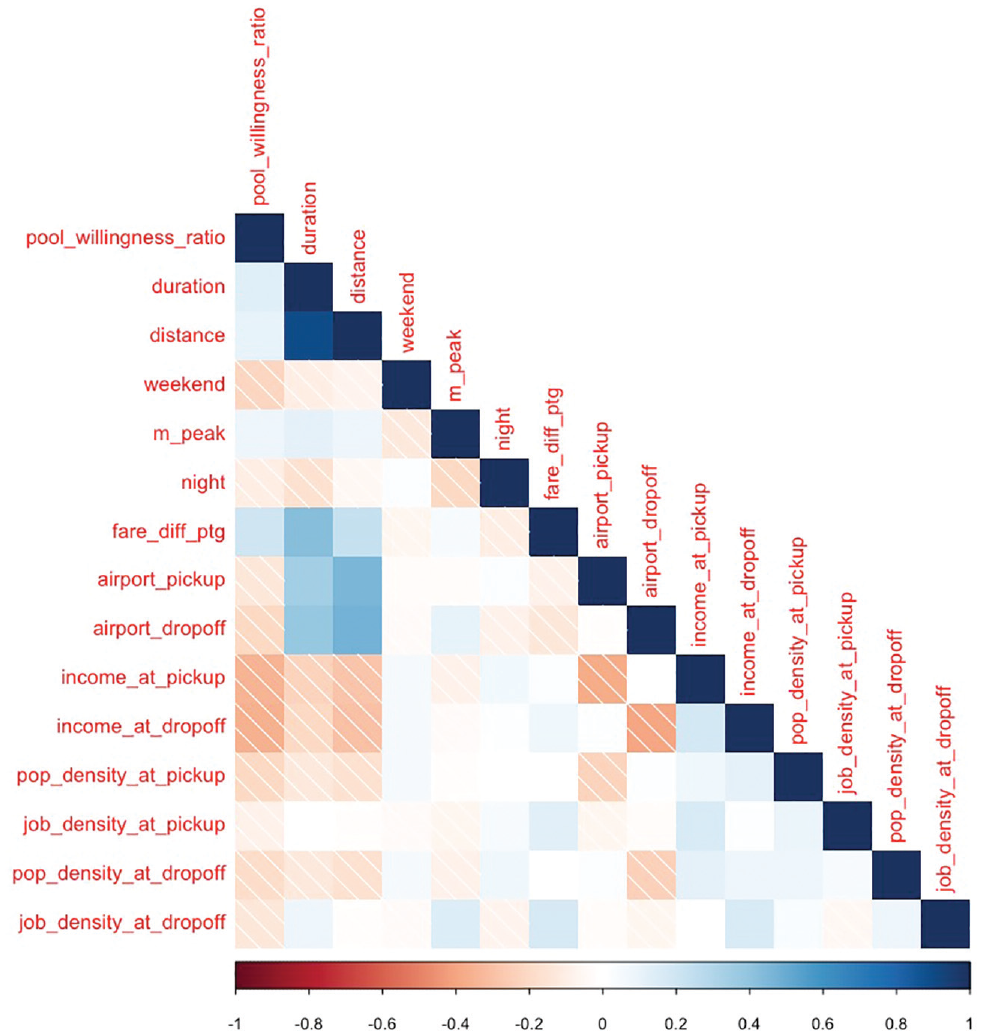
Correlations between variables.
In Figure 3, the striped cells represent a negative correlation and solid colored cells represent a positive correlation, with the color gradient representing the magnitude of the correlation (denser color depicts a stronger correlation) between the variables being compared. From the first column, it can be seen that WTP ratio (i.e., proportion of trips in which individuals have indicated a WTP) is positively correlated with distance, duration, and fare difference percentage, meaning that the WTP ratio increases as the average duration, distance, and fare difference percentage of trips increase. It can also be seen from Figure 3 that airport drop-offs and pickups are positively correlated with distance and duration, which indicates that airport ride-hailing trips are longer, on average, than non-airport ride-hailing trips. A general observation of the trends from the correlation analysis reveals that the WTP ratio is correlated with most of the explanatory variables, but not correlated with variables such as midnight, non-peak period, and evening peak, corroborating the choice of variables for regression and XGBoost estimations.
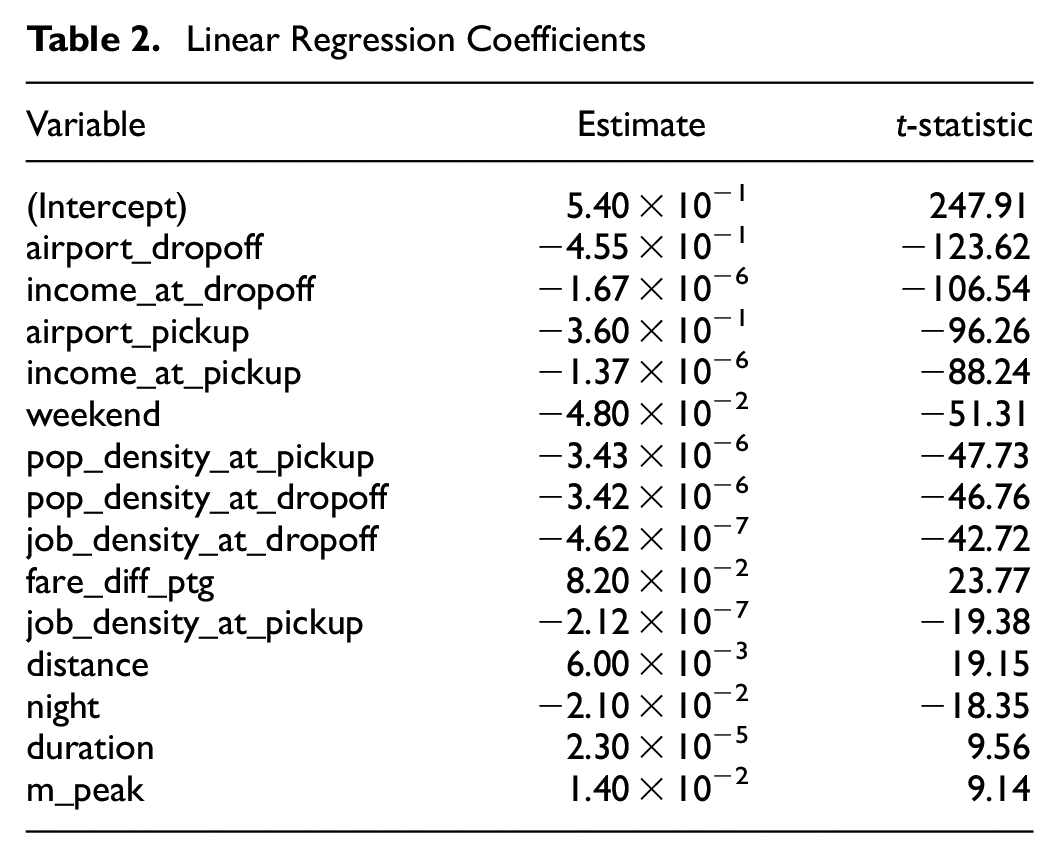
While linear regression produces coefficients that are easy to interpret, its machine-learning counterpart does not. However, based on how each variable contributes to the aggregated decrease of node impurity across all tree splits, a relative variable importance list can be generated from the output of the XGBoost method. Results of the linear regression analysis are presented in Table 2, while the variable importance ordering from XGBoost is displayed in Figure 4. The first and most important observation from comparing results of the linear regression and XGBoost models is the striking similarity in the variable significance order across both models. Using t-statistic as the indicator for statistical significance in the regression model (and ignoring the sign for comparison purposes), it can be seen that the variables for airport drop-off, median income at drop-off location, airport pickup, and weekend day turn out to have the highest statistically significant relationship to the explanatory variable WTP ratio in both models. On the flip side, distance, duration, nighttime, and percent of fare difference seem to have the lowest significance compared with other variables (in both models) in explaining the WTP ratio. As for the goodness-of-fit statistics between these two models, the linear regression has r-squared values of 0.55 and 0.56 for the training and test data sets, whereas the XGBoost method has r-squared values of 0.90 and 0.83 for the training and test data sets respectively. The proximity of r-squared values for both training and test data indicates that linear regression and XGBoost do not overfit the training data set.
Linear Regression Coefficients
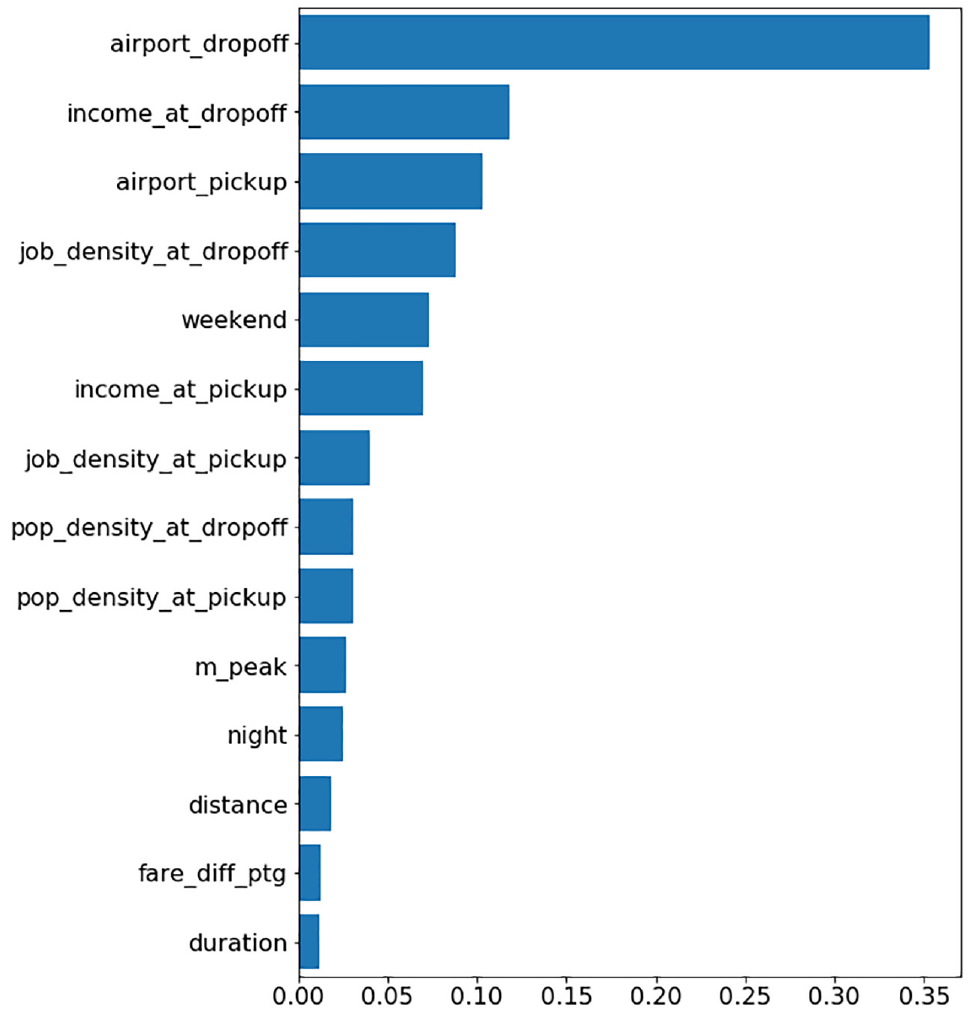
Variable importance from XGBoost.
The linear regression results presented in Table 2 are used to interpret the relationship between explanatory variables and the dependent variable WTP ratio (i.e., proportion of trips in which individuals have indicated a WTP a ride-hailing trip). From the results, it can be observed that trips to and from the airport generally have a low WTP ratio. This finding is consistent with expectations, as airport trips often tend to be made under a time constraint (in order to catch a flight), with family, with luggage, or a combination of all these factors, making them less attractive for pooling. Therefore, it is intuitive that trips that were picked up or dropped off at the airport would have a lower WTP ratio. Another interesting nuance between these two variables is that the airport drop-off variable has a higher negative correlation with WTP ratio, indicating the relative flexibility in airport pickups (which are not time constrained) than drop-offs. A similar phenomenon can be observed between WTP ratio and income. Ride-hailing trips starting or ending in zones with higher median income have a low WTP ratio, which is in line with findings from CMAP ( 30 ), where it was observed that trips starting or ending in economically disadvantaged areas (zones with low median income) are more likely to have higher WTP ratios.
WTP ratios are lower for weekend trips compared to weekday trips, which is also observed from the recurring patterns for average daily WTP in Figure 1. In general, it was observed that trips starting or ending in zones with high population or job density have a lower WTP ratio, motivating a need to further explore potential confounding factors in future analyses. Controlling for all other factors, the elasticity of the distance variable shows that ride-hailing trips with longer trip length have a higher WTP ratio (increasing by 0.63% for a 1-mi increase in trip length). The positive influence of average duration and distance on the WTP ratio is intuitive, as empirical evidence suggests that the longer the trip, the greater the absolute savings for a pooled versus non-pooled ride ( 33 ). This conjecture is corroborated by the positive impact of average percent fare difference (between pooled and regular rides) on WTP ratio. For example, the fare_diff_ptg estimate from the regression result (controlling for all other factors) shows that for every 10% fare difference between a regular trip and a pooled trip, the WTP ratio increases by 0.82%. All else being equal, if a ride-hailing trip is requested during nighttime, the WTP ratio decreases by 2.12%. Safety or an increased value of time at late hours could be possible explanations for this effect.
While understanding the factors that influence the WTP ratio is useful, cities and TNCs may benefit even more from having a predictive model of the WTP ratio, given a set of external inputs. Such a model can help cities understand correlations between the built environment and the WTP ratio, which can be useful for designing management strategies around TNCs for enhanced public–private benefits. On the other hand, it could be useful for TNC companies to understand the sensitivity of the WTP ratio to various factors, both as a market share predictor for pooled trips (in cities where they have not offered services before) and to help devise location- and time-specific strategies to encourage pooling behavior. With these uses of the model in mind, both the linear regression and XGBoost models were applied to the holdout sample to see how well they can predict WTP ratios. Figure 5 presents the results of the residual analysis from both models.
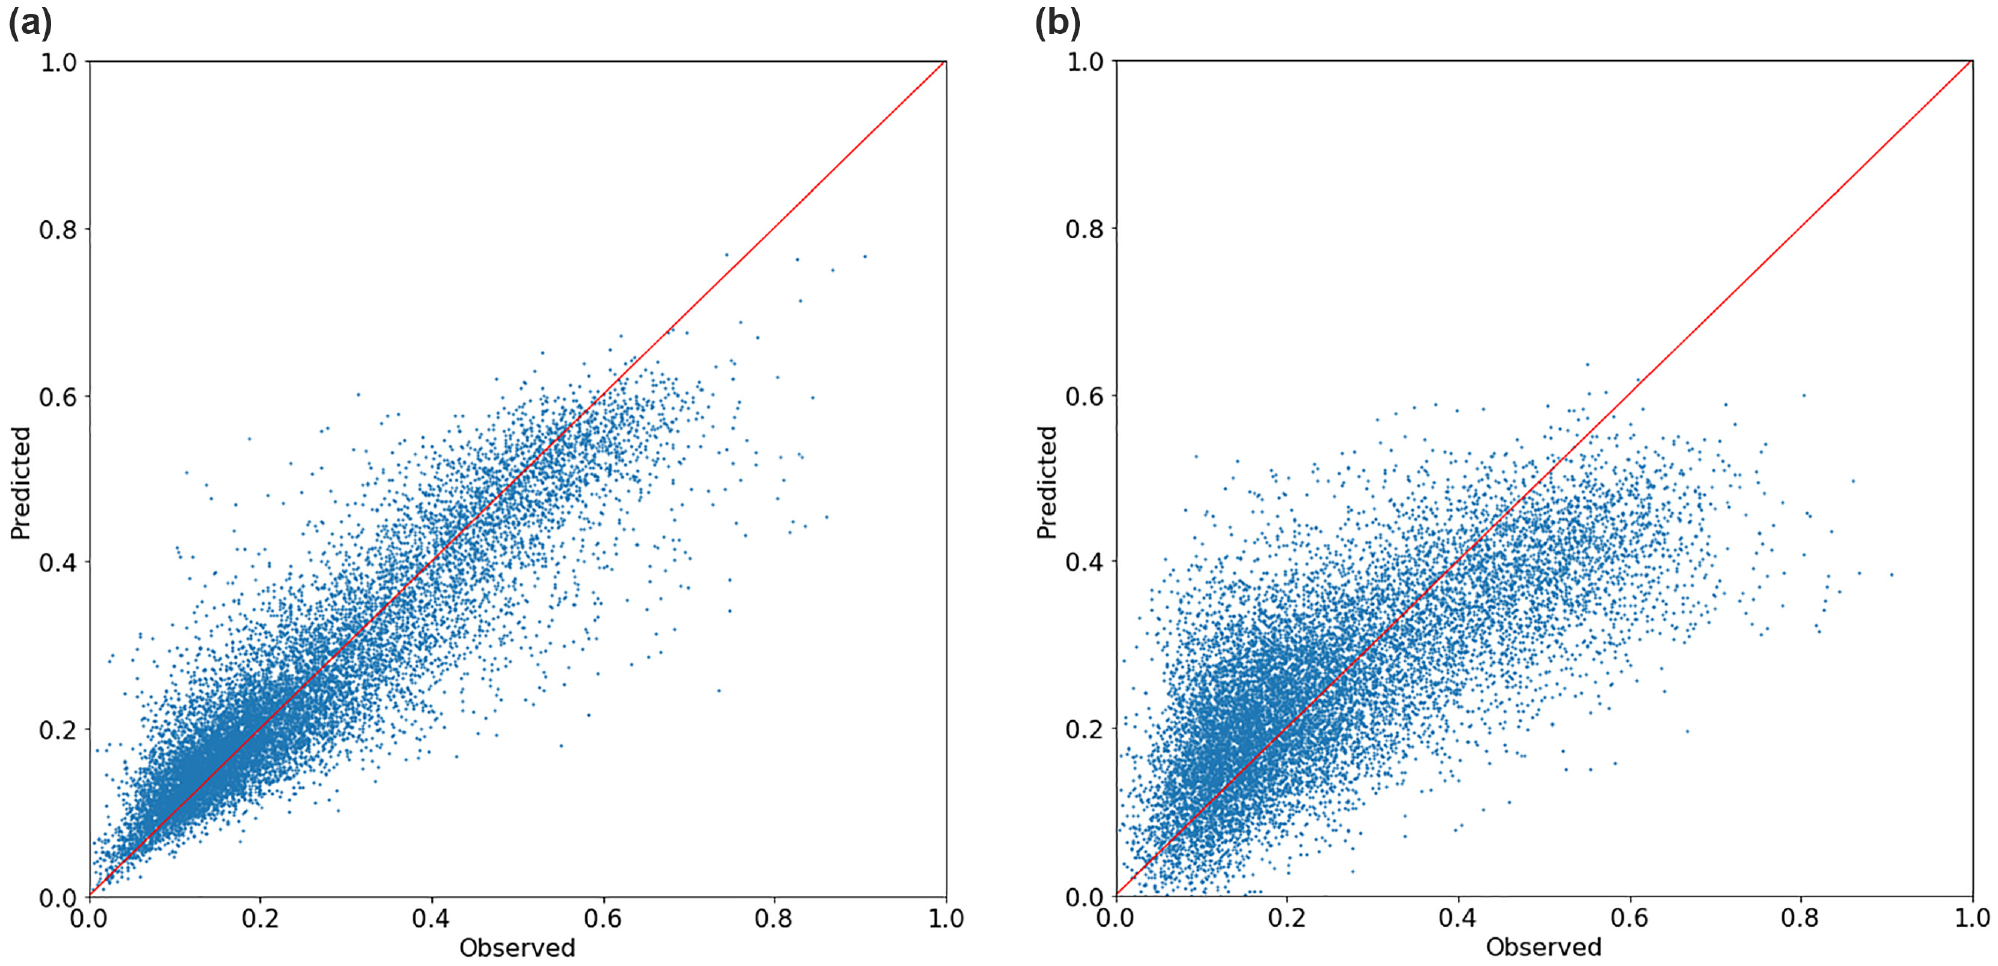
Residual analysis from (a) linear regression and (b) XGBoost.
It can be seen from the figure that the XGBoost model outperforms the regression model with a MAE of 4.6%, compared with a MAE of 7.9% from the regression model. The MSE of the XGBoost model is also much better in comparison with that of the regression model.
Conclusion and Discussion
In the ten years since the inception of ride-hailing, TNCs have been met both with accolades—for providing an alternative that can compete with a privately owned car in cost and convenience—and criticism—for increasing congestion and VMT. Pooled ride-hailing services (such as Via, UberPool, and LyftShare) have the potential for reducing consumer costs, VMT, and congestion, as one vehicle is able to serve multiple passengers simultaneously who may have otherwise traveled in separate vehicles. Though pooled ride-hailing can offer a win-win-win proposition for riders, TNCs, and cities, significant adoption has yet to become a reality. Evidence from the recently released Chicago TNP data set reveals that only a quarter of the ride-hailing trips are requested as pooled rides in Chicago, and therefore it remains important to investigate behavioral, economic, and other key contextual factors that enable or deter pooling of these rides.
The Chicago TNP data set contains information on ride-hailing trips, drivers, and vehicles. The trip data set reports information on approximately 45 million trips and is of particular relevance to this study in understanding the factors associated with the “when, where, and why” of WTP ride-hailing trips. In this paper, the variable WTP from the Chicago TNP data is used to answer the research question, “How do trip characteristics, spatiotemporal factors, and the built environment influence the proportion of ride-hailing trips in which individuals indicated a willingness to pool?” From the results of the regression model, it was observed that traveling to/from airports has a negative impact on WTP ratio, a finding consistent with expectation, as air travel is associated with time, luggage, and other constraints (such as traveling with family, business travel, or both). Future research and behavioral surveys could explore differences among specific populations, such as business, leisure, or airport employee travelers. Average trip duration and distance, on the other hand, seem to have a positive impact on the WTP ratio. This relationship is intuitive, as longer trips are more expensive and therefore offer higher absolute cost savings when pooled. Aligned with this finding, the percent difference between average fares of regular and pooled trips has a positive impact of WTP ratio. For a 10% difference between regular and pooled trips from a location (with all else remaining the same), the WTP ratio increases 0.82%. Similarly, trips occurring at night have a lower WTP ratio, which may be motivated by safety concerns or a higher value of travel time. In relation to predictive ability, the XGBoost model exhibits a better performance compared with the regression model in predicting WTP ratios in the holdout sample.
Findings from this study are relevant to cities, TNCs, and the growing body of knowledge to understand the levers that motivate pooled ride-hailing. TNCs can use this information to devise strategies that improve the current WTP ratio (from approximately 25%, as seen from the TNC data in Chicago), and cities can use insights from this model to develop new strategies with TNCs. The research analysis presented in this study comes with a few shortcomings, which will be addressed in future efforts. First, a linear regression model was adopted in this study for the simplicity it provides in explaining associations between dependent and independent variables. However, the linear regression model itself is not able to detect and address correlations between different variables used in the analysis. Advanced models that can accurately capture the confounding effects among various factors need to be explored. Future efforts will focus on exploring the factors at the level of the individual that impact WTP. A trip-level WTP prediction model could be built by fusing the Chicago TNP data with travel survey data (to get information on the individual characteristics) and more detailed trip characteristics to investigate additional factors influencing WTP and pooling success. Also, a higher quality of built-environment data (e.g., street network design, distance to transit, and destination accessibility) can help decipher more nuanced impacts of land use on the WTP ratio and will be addressed in future research endeavors.
Footnotes
Acknowledgements
This work was authored by the National Renewable Energy Laboratory, operated by Alliance for Sustainable Energy, LLC, for the U.S. Department of Energy (DOE) under Contract No. DE-AC36-08GO28308. The authors acknowledge Stan Young of the National Renewable Energy Laboratory for leading the Urban Science Pillar and Anna Spurlock of Lawrence Berkeley National Laboratory for leading the Mobility Decision Science Pillar of the SMART Mobility Laboratory Consortium. The following managers from the DOE Office of Energy Efficiency and Renewable Energy (EERE) played important roles in establishing the project concept, advancing implementation, and providing ongoing guidance: Prasad Gupte, Erin Boyd, Heather Croteau, and David Anderson.
Author Contributions
The authors confirm contribution to the paper as follows: study conception and design: Y. Hou, V. Garikapati; data collection: Y. Hou, D. Weigl; analysis and interpretation of results: Y. Hou, D. Weigl, V. Garikapati, A. Henao, J. Sperling, M. Moniot; draft manuscript preparation: Y. Hou, D. Weigl, V. Garikapati, A. Henao, J. Sperling, M. Moniot. All authors reviewed the results and approved the final version of the manuscript.
Declaration of Conflicting Interests
The author(s) declared no potential conflicts of interest with respect to the research, authorship, and/or publication of this article.
Funding
The author(s) disclosed receipt of the following financial support for the research, authorship, and/or publication of this article: This work was supported and funding was provided by the U.S. Department of Energy, Vehicle Technology Office under the Systems and Modeling for Accelerated Research in Transportation (SMART) Mobility Laboratory Consortium, an initiative of the Energy Efficient Mobility Systems (EEMS) Program.
The views expressed in the paper do not necessarily represent the views of the U.S. Department of Energy or the U.S. Government. The U.S. Government retains—and the publisher, by accepting the article for publication, acknowledges that the U.S. Government retains—a nonexclusive, paid-up, irrevocable, worldwide license to publish or reproduce the published form of this work, or allow others to do so, for U.S. Government purposes.