
Abstract
Hurricanes and their cascading hazards have been responsible for widespread damage to life and property, and are the largest contributor to insured annual losses in coastal areas of the U.S.A. Such losses are expected to increase because of changing climate and growing coastal population density. An effective methodology to assess hurricane wind and surge hazard risks to coastal bridges under changing climate conditions is proposed. The influence of climate change scenarios on hurricane intensity and frequency is explored. A framework that couples the hurricane tracking model (consisting of genesis, track, and intensity) with a height-resolving analytical wind model and a newly developed machine learning-based surge model is used for risk assessment. The proposed methodology is applied to a coastal bridge to obtain its traffic closure rate resulting from the observed (historical) and future (projected) hurricane winds and storm surges, demonstrating the effects of changing climate on the civil infrastructure in a hurricane-prone region.
Climate change has long been recognized as a serious phenomenon with severe implications for the planet, its inhabitants, and our built infrastructure. Melting glaciers, droughts, and flooding are expected outcomes of increasing concentrations of greenhouse gases in the atmosphere. Hurricane-related hazards, namely, strong wind speeds coupled with torrential rainfall and powerful storm surge, are expected to increase significantly in the coming years because of the effects of global warming (1–3). Direct and indirect economic losses associated with these hazards are expected to increase with growing coastal populations and associated infrastructure in coastal regions ( 4 ). Based on the emission scenarios of the Intergovernmental Panel on Climate Change (IPCC) assessment reports, several climate models have been used to estimate the impact of climate change on our planet. These studies provide a rich source of climate data that are inputs to hurricane risk assessment. Although results provided by the climate models can differ substantially, because of inherent uncertainties and model differences ( 5 ), the majority of these models project significant changes in several environmental factors, including sea surface temperature (SST), environmental vertical wind shear, and moisture content and temperature at the tropopause level ( 6 ). Researchers in the wind engineering community have predicted a considerable increase in maximum hurricane wind speeds because of global warming (6–10). However, most of the models used in those studies are based on purely statistical approaches, which limits their predictive capabilities.
In this study, the projected effects of changing climate on hurricane winds and storm surges are investigated for the northeast U.S. coastline. The population density in the selected areas is high, and large increases in important environmental factors (e.g., SST) are expected based on simulation results from global climate models. To investigate the impact of changing climate, 10,000 years of Atlantic Ocean hurricanes (130,000 full tracks from genesis to end of storm) are simulated for two climate conditions: (i) observed (or historic) from 1991 to 2010, and (ii) future, from 2081 to 2100, where the latter is generated using the Representative Concentration Pathway 8.5 (RCP 8.5) scenario of the IPCC fifth assessment report ( 11 ). The hurricane tracking methodology uses a physics-based, intensity model ( 12 ). A height-resolving, analytical wind model ( 13 , 14 ) is used for the wind field simulations, together with a moist entropy-based gradient wind model ( 12 ) that is able to account for the contributions of several important environmental quantities (i.e., SST, moisture content and temperature at the tropopause level). A machine learning-based model is developed for the storm surge field simulations. The annual exceedance probabilities of wind speed and storm surge under the observed (historical) and future climate scenarios are then investigated and compared. Mean recurrence interval (MRI) is used to present results to link outcomes to codes and standards used by engineers in the U.S.A. The proposed methodology is applied to a coastal bridge to calculate the traffic closure rate for observed (historical) and future hurricane winds and storm surges, to illustrate the effects of climate change on critical civil infrastructure in a hurricane-prone area.
Theoretical Background and Problem Formulation
For hurricane risk calculations, many samples or realizations of the hazards (e.g., wind and surge) need to be generated. An example of the application of such an approach is the design wind maps in American Society of Civil Engineers/Structural Engineering Institute (ASCE/SEI) Standard 7, where the design wind speeds are determined for various MRIs (or return periods) ( 15 ). A similar approach can be adopted in the context of changing climate, wherein the environmental parameters that are expected to change because of global warming can be integrated into the simulations to generate synthetic hurricanes. Once the hazard probabilities are determined, vulnerability models such as those available in HAZUS ( 16 ) can be used to estimate losses.
Study Region
In this study, the northeast U.S. coast is selected as a test case to assess the effects of climate change on wind speed and storm surge. This region is chosen because of its high population density and simulation results from global climate models predict significant increases in several environmental factors such as the SST. Figure 1 depicts the projected changes in the future SST under the RCP 4.5 and RCP 8.5 climate scenarios. (Note that different legends are used in Figure 1, a and b .) These results are obtained from the Ocean Climate Change web portal (https://www.esrl.noaa.gov/psd/ipcc/) of NOAA (National Oceanic and Atmospheric Administration) designed for the CMIP5 (World Climate Program fifth Coupled Model Inter-comparison Project) experiments. The largest increase in the SST will be realized in the northeast U.S. for both RCP 4.5 and RCP 8.5, with the greatest increase for RCP 8.5.
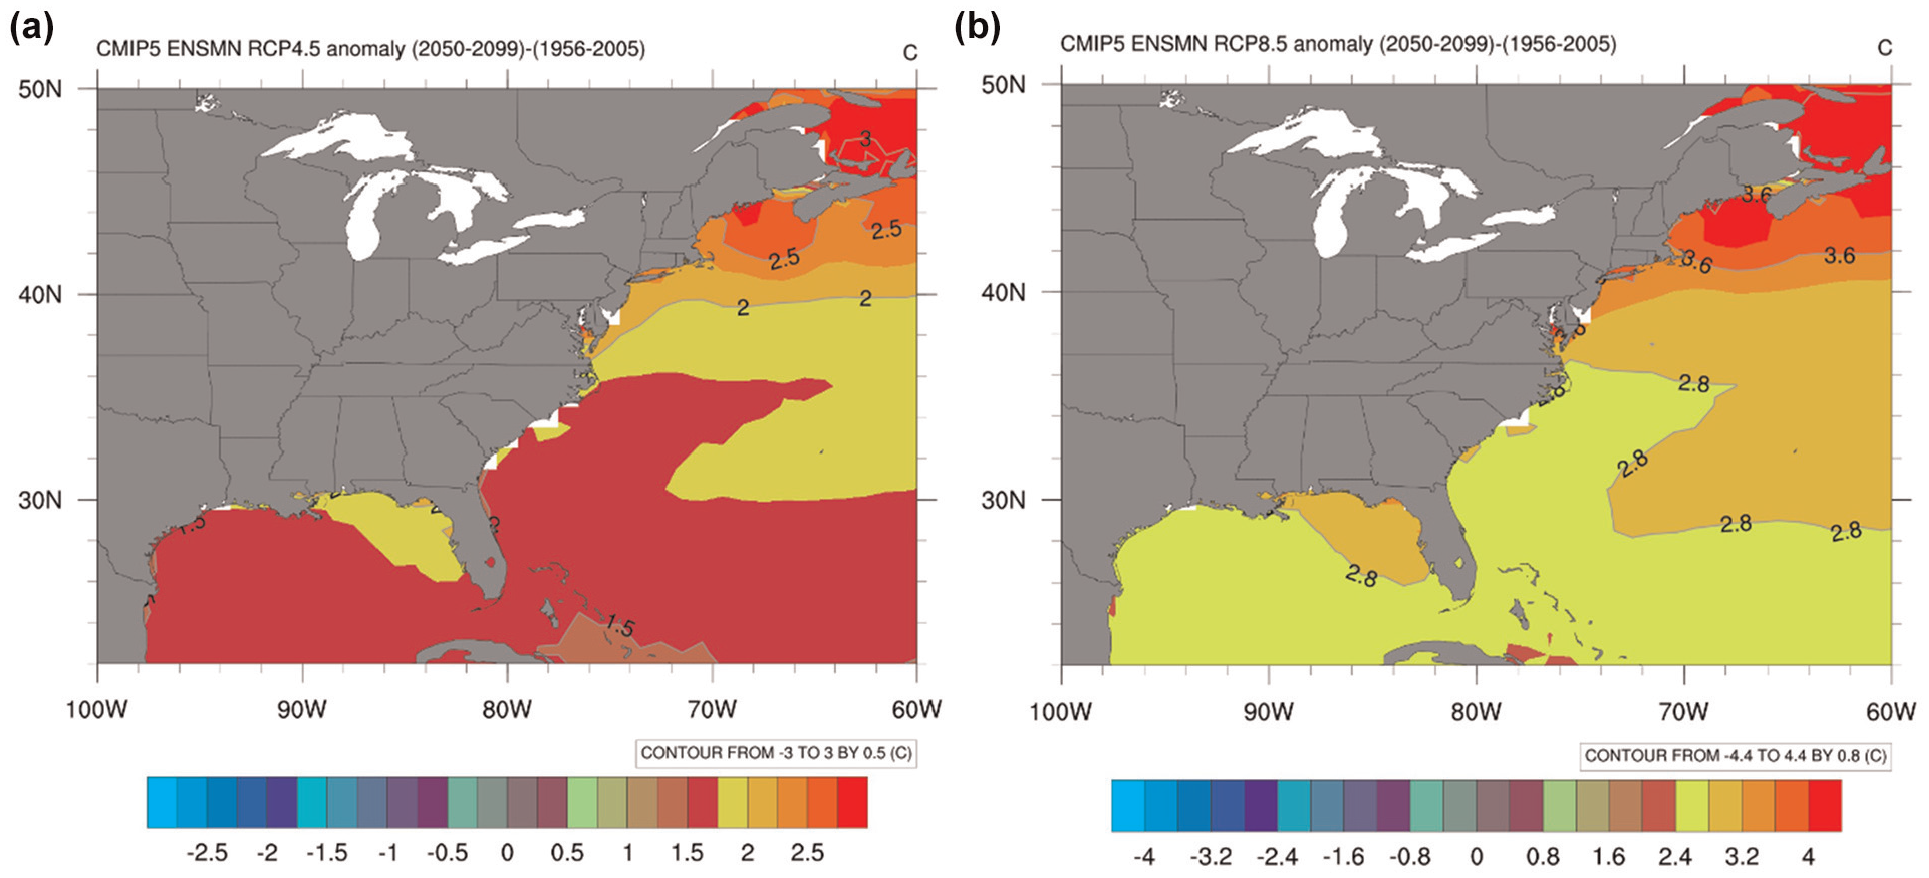
Difference in mean sea surface temperature in the future time period (2050–2099) compared with the historical reference period (1956–2005) for (a) RCP 4.5 and (b) RCP 8.5, extracted from the National Oceanic and Atmospheric Administration Ocean Climate Change web portal.
Data Sources
The observed climate during the period from 1991 to 2010 is used here to represent the baseline (historical) condition and various databases are utilized to extract the corresponding data. The HURDAT2 (https://oasishub.co/dataset/hurdat-2-atlantic-hurricane-database), maintained by the National Hurricane Center, contains the most complete sets of hurricane tracks and environmental parameters since 1851 ( 17 , 18 ). Each hurricane track record provides the 6-h hurricane center location (in latitude and longitude) with the translational speed, heading angle, and hurricane intensity. Based on this database, the genesis and propagation track are statistically characterized ( 12 ). Other environmental factors such as the 850–200 hPa vertical shear are obtained from the Global Forecast System analyses produced by the National Centers for Environmental Prediction or the statistical hurricane intensity prediction scheme ( 19 ) reanalysis database. The SST data are extracted from the Hadley Centre Sea Ice and Sea Surface Temperature Version 1 (HasISST1) data set ( 20 ), which provides monthly SSTs from 1870 to the present time, with a spatial resolution of 1° latitude by 1° longitude.
Future climate conditions, corresponding to the period from 2081 to 2100 ( 5 ), are based on the representative concentration pathways (RCP) scenarios of the IPCC fifth assessment report ( 21 ) and those data are used here. The RCP is the greenhouse gas concentration trajectory adopted by the IPCC since its fifth assessment report. Several RCP scenarios have been generated: RCP 2.6, RCP 4.5, RCP 6.0, and RCP 8.5. These scenarios are based on different projected radiative forcing values that are related to greenhouse gas emissions. The higher the radiative forcing, the greater the surface temperature. In this study, the extreme case (i.e., RCP 8.5), which corresponds to 8.5 W/m2 of total radiative forcing of greenhouse gas emission and 1,350 ppm CO2 concentration, is assumed. The output data from NOAA’s Geophysical Fluid Dynamics Laboratory Earth System Model Version 2G (GFDL-ESM2G) is utilized to represent the future climate conditions. The GFDL-ESM2G is a model that evaluates the impact of changing climate on ecosystems and has been developed mainly by NOAA’s Geophysical Fluid Dynamics Laboratory (GFDL). It is coupled with atmospheric and ocean circulation data and integrates biogeochemistry and a closed carbon cycle that represent climate and ecosystem interactions. Only the NOAA Earth System Model is used in this study, and therefore uncertainty associated with the choice of climate model is not considered.
The database used to train the machine learning-based surge model is from the North Atlantic Comprehensive Coastal Study (NACCS, https://www.nad.usace.army.mil/CompStudy/), released by the U.S. Army Corps of Engineers. This database contains 1,050 synthetic tropical storm simulations, generated using high-fidelity numerical models that include wave-surge interactions, namely the wave model, steady state spectral wave (STWAVE) and advanced circulation model (ADCIRC).
Simulation Procedures
The simulation procedure adopted in this study follows the general framework in Vickery et al. ( 15 ) wherein the tracking model was determined statistically. However, Vickery’s hurricane tracking model is enhanced here by integrating the physics-based intensity model developed by Snaiki and Wu ( 12 ). A moist entropy-based gradient wind model ( 12 ) is used to consider the effects of climate change in the hurricane simulations. A height-resolving, analytical wind model ( 13 , 14 ) and machine learning-based surge model are employed to obtain wind and surge hazard distributions, respectively. Monte Carlo simulations are performed in which the hurricane is simulated from its genesis through its dissipation stage, as illustrated in the flowchart of Figure 2.
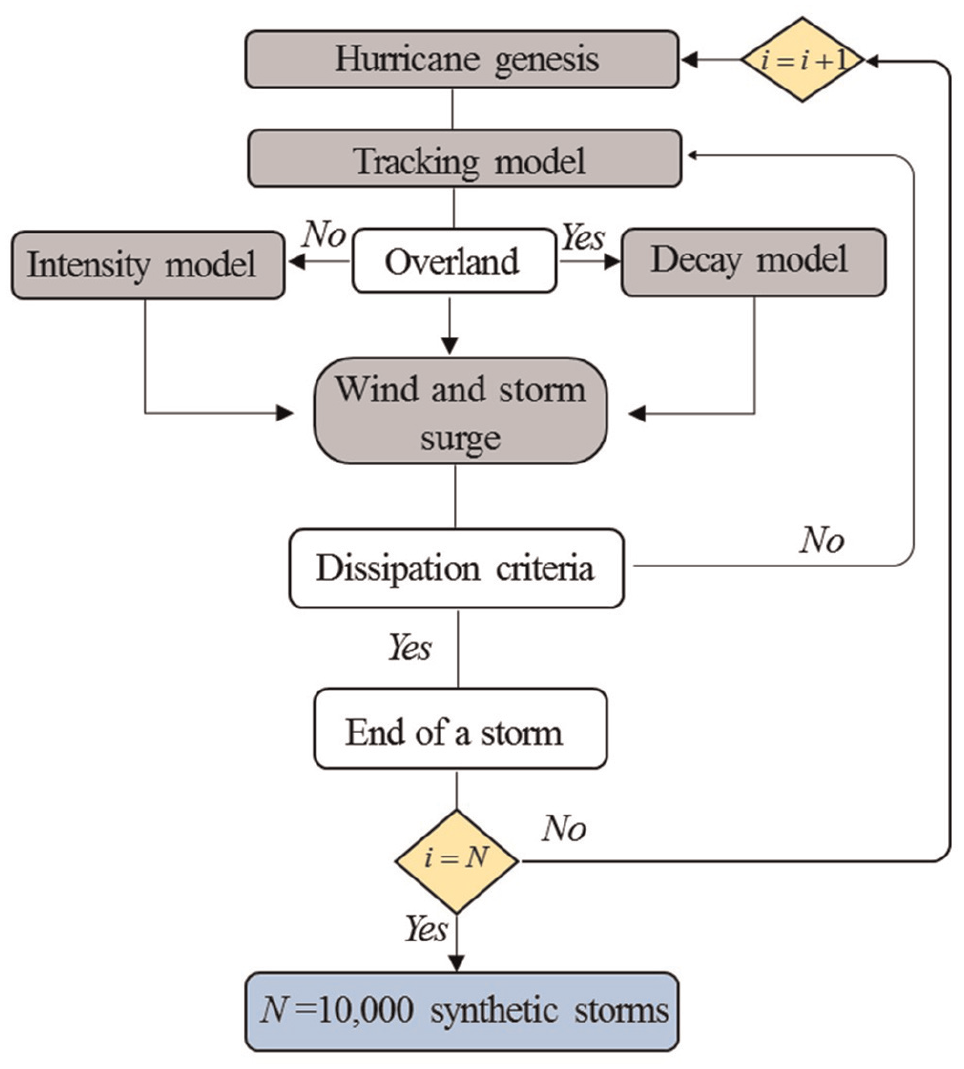
Monte Carlo simulations for synthetic hurricane generation.
The simulation begins by determining an annual hurricane genesis frequency that is generated based on either a Poisson process or a negative binomial distribution (
6
). The initial parameters needed to drive each single synthetic hurricane, such as the initial location, heading angle, forward speed and hurricane intensity, are randomly selected from the HURDAT database. The statistical hurricane track is then used to advance the hurricane into the next time step (6-h interval). The intensity model, which is an important component in the hurricane track simulation framework, is utilized at each time step. For engineering applications, a linear regression model, which relates hurricane relative intensity to SST, is usually utilized. However, as demonstrated by Snaiki and Wu (
12
), the purely statistical linear autoregressive schemes ignore several physical properties and the inherent nonlinearities in hurricane intensity (22–25). In this study, the physics-based intensity model developed in Snaiki and Wu (
12
) is employed. The hurricane intensity, in relation to the maximum wind speed,

where
Wind Model
A moist entropy-based gradient wind model ( 12 ) is used, in which:
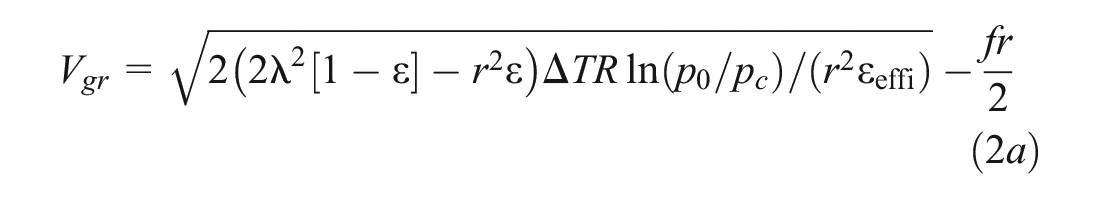
and
where
Surge Model
An efficient, artificial neural network-based model (i.e., multi-layer feedforward backpropagation network) is developed here to predict peak storm surge using the standard hurricane parameters as inputs, namely, central pressure, translational speed, radius of maximum winds, and storm track. The machine learning-based model is constructed using the large database of synthetic tropical storms obtained from the U.S. Army Corp of Engineers through NACCS. The NACCS database is accessible through the Coastal Hazards System web tool (https://chs.erdc.dren.mil/default.aspx). As an example, Figure 3 shows the time series of the pressure and sea level elevation at selected point #3922 subjected to the synthetic hurricane #349.
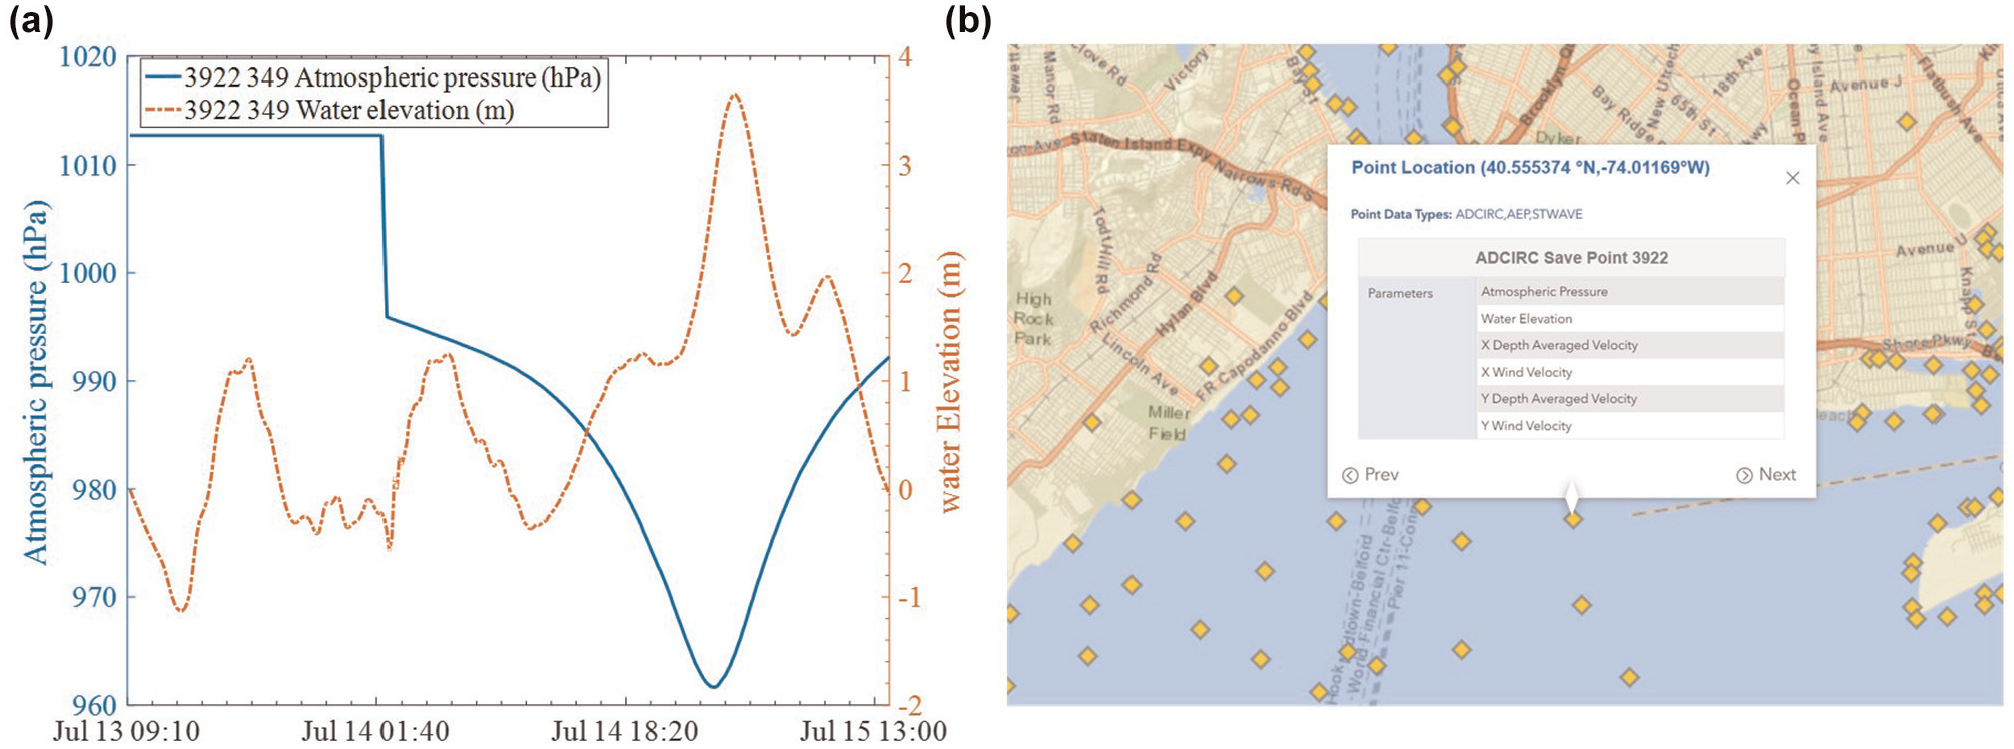
Time series of the pressure and sea level elevation at selected point #3922 subjected to the synthetic hurricane #349 (a) and location (40.55° N –74.01° W) for the selected point (b). Adapted from Coastal Hazards System web portal.
The use of machine learning techniques is motivated by their ability to capture hidden or obscured patterns in data as well as any inherent nonlinearities. The recent success of state-of-the-art machine learning algorithms (e.g., deep convolutional and recurrent networks) is due mainly to significant increases in the sizes of databases and computational power ( 31 ). A typical multi-layer feedforward backpropagation network structure consists of an input layer, an output layer, and several hidden layers, as illustrated in Figure 4.
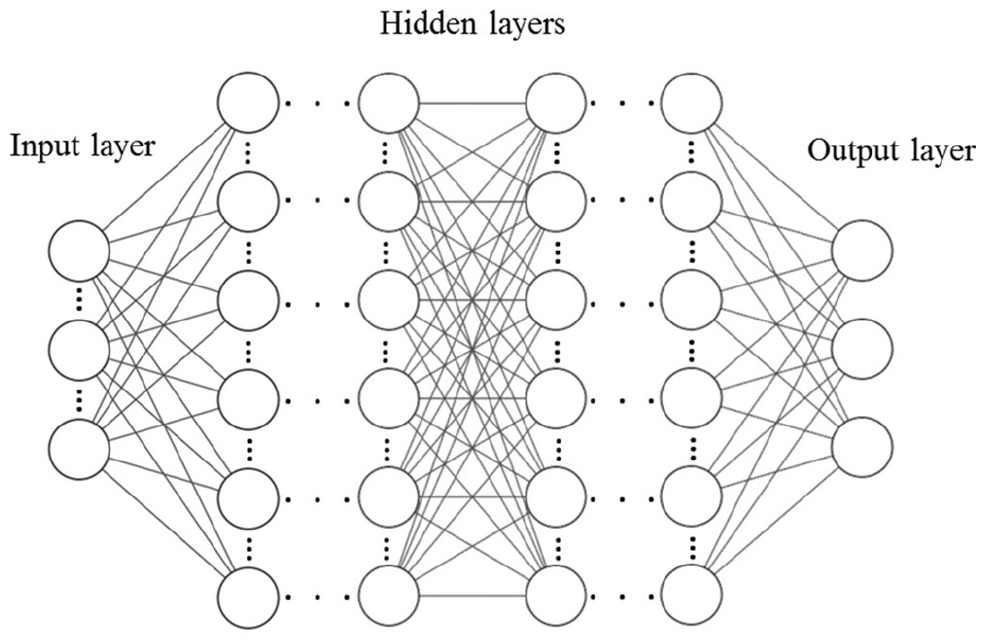
Structure of a typical multi-layer feedforward backpropagation network.
Each hidden layer is composed of multiple artificial neurons, the most fundamental elements in the neural network architecture. The output y of an artificial neuron can be obtained as follows:

where
The selected network architecture is 6-10-10-1 (one input layer [with six inputs], two hidden layers [each with 10 neurons] and one output layer [with one output]), and a hyperbolic activation function is used. The loss is minimized using the L-BFGS-B optimization algorithm because of its superior rate of convergence for a wide range of physical problems (
39
,
40
), together with the popular Xavier’s normal initialization scheme (
41
) to properly initialize the weights of the employed deep neural network. The weights are chosen from a random uniform distribution over the interval
Simulation Results and Discussion
The above procedure is used to generate a 10,000-year simulation of full-track synthetic hurricanes based on historical (1991–2010) and future (2081–2100) climate scenarios. Two important quantities delivered by the simulations are investigated, namely, surface wind speed and storm surge height.
Hurricane Intensity and Frequency
A database of synthetic Atlantic Ocean hurricanes spanning 10,000 years is simulated for the two climate data sets compared here: (i) observed (1991–2010), and (ii) projected (2081–2100) according to RCP8.5. Fourteen mileposts along the coastline of the selected region were chosen (Figure 5a) to characterize the effects of changing climate on hurricane intensity and frequency. Sample synthetic hurricane tracks are presented in Figure 5b.
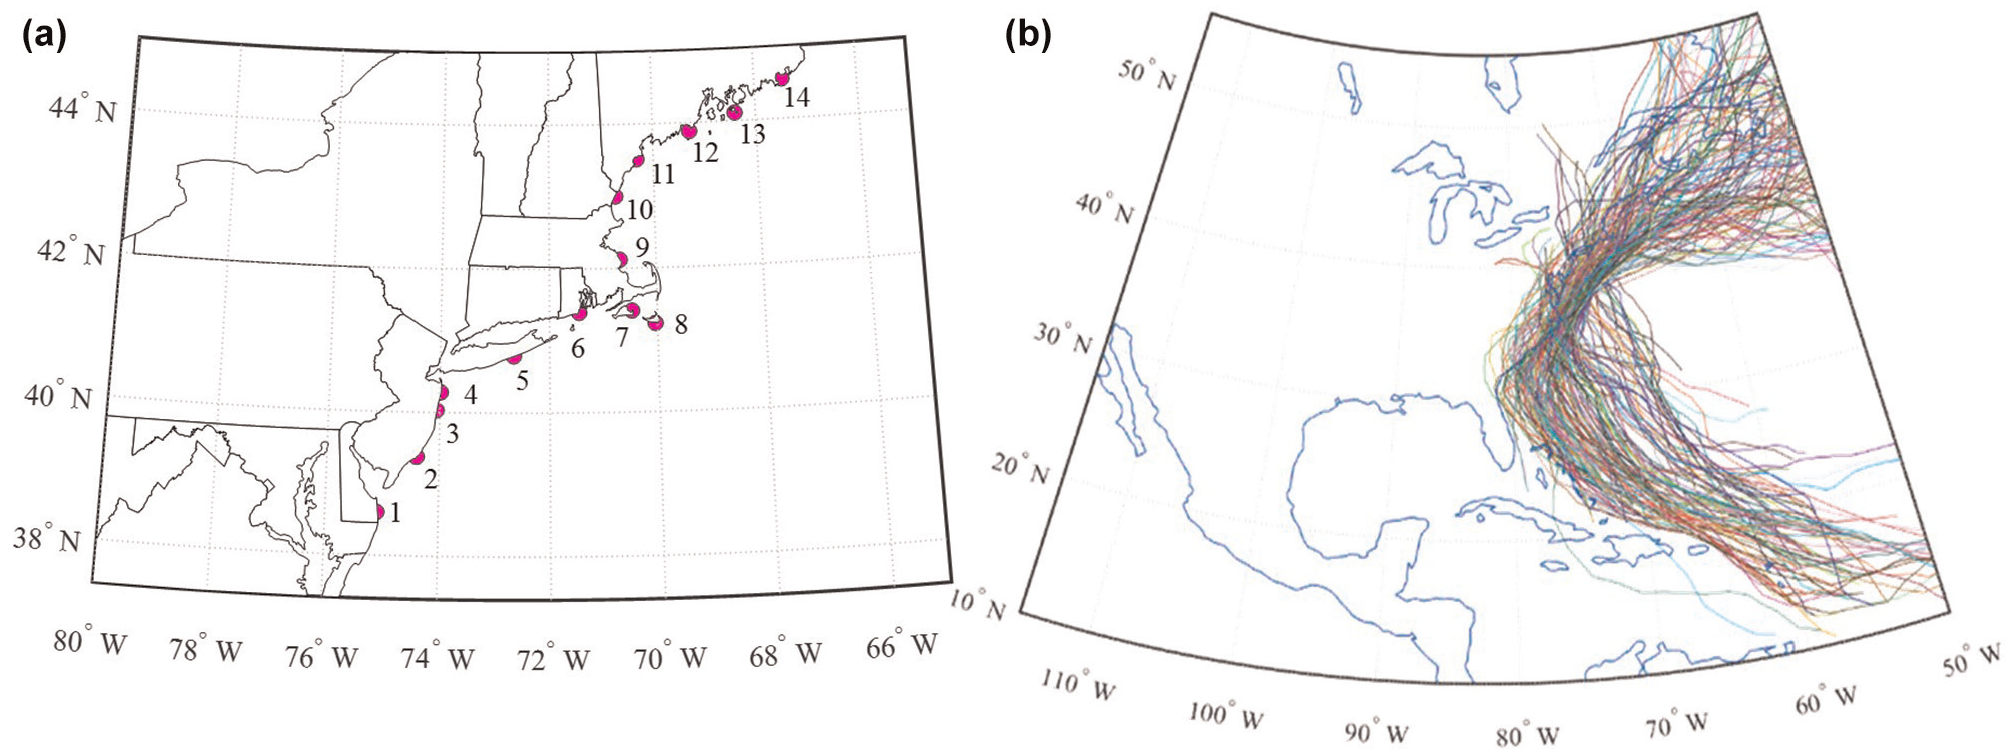
Mileposts along the coastline of the selected study region (a) and sample synthetic hurricane tracks (b).
Results of simulations for the observed (1991–2010) and projected (2081–2100) climate scenarios, in relation to hurricane intensity and annual occurrence rate, at the 14 selected mileposts, are presented in Figure 6. Although hurricane intensity is significantly increased (more than 10% at some mileposts), the annual occurrence rate is changed only slightly for the RCP 8.5 scenario.
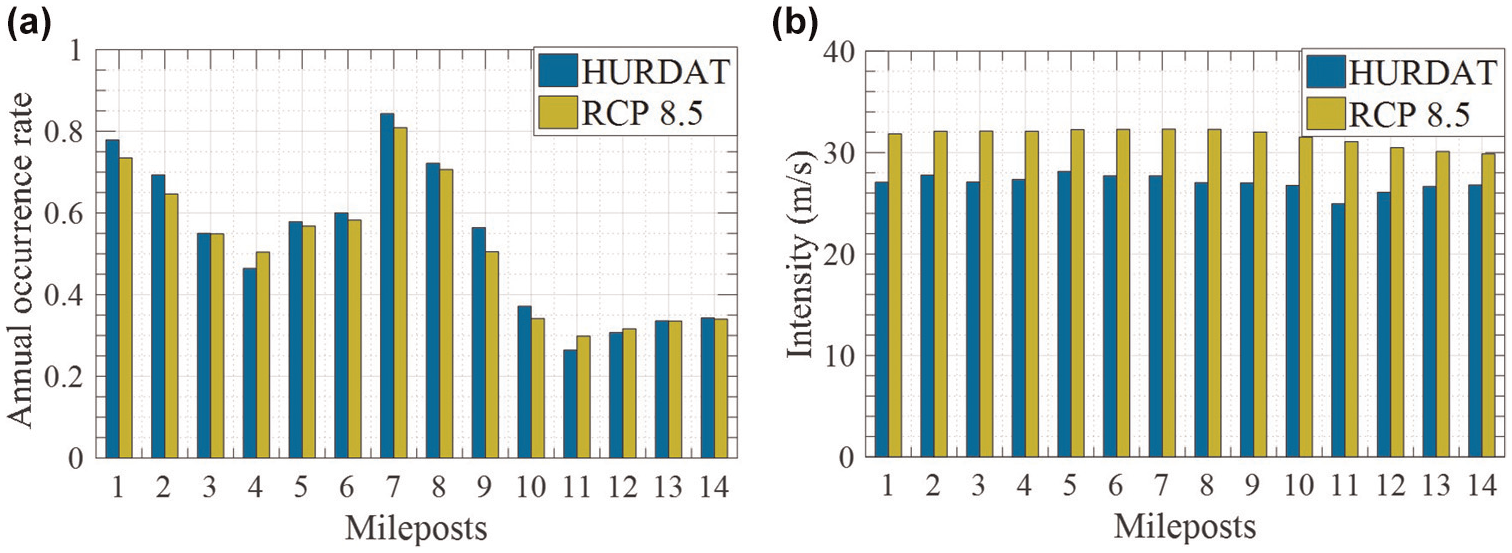
Effect of climate change using past and projected data at 14 mileposts: (a) annual occurrence rate and (b) hurricane intensity.
Application to Coastal Bridges
According to the Federal Highway Administration, around 36,000 bridges are located within 15 mi of the coastline in the U.S.A. Coastal bridges can be seriously impacted by hurricane-induced hazards of wind and storm surge. This exposure risk is expected to worsen because of changing climate. Although hurricane winds alone can directly trigger bridge closure and traffic disruption, a significant fraction of the observed damage to bridges can be attributed to storm surge and wave scour, and hydrodynamic loads from waves and tidal currents on bridge decks. A substantial increase in water level through storm surge (due mainly to wind stresses), high tides and rainfall induced inland flooding will produce both uplift and horizontal forces on a bridge deck, potentially leading to catastrophic failure. For example, Hurricane Irene (2011) damaged over 200 roads and bridges in the New England area, and Hurricane Katrina (2005) damaged more than 40 bridges in Louisiana and neighboring states.
In this study, the hurricane hazard is assessed using MRI, which is the reciprocal of return period. The MRI of a given quantity

where
MRI for Surface Wind Speed and Storm Surge Height under the Historical and Future Climate Scenarios
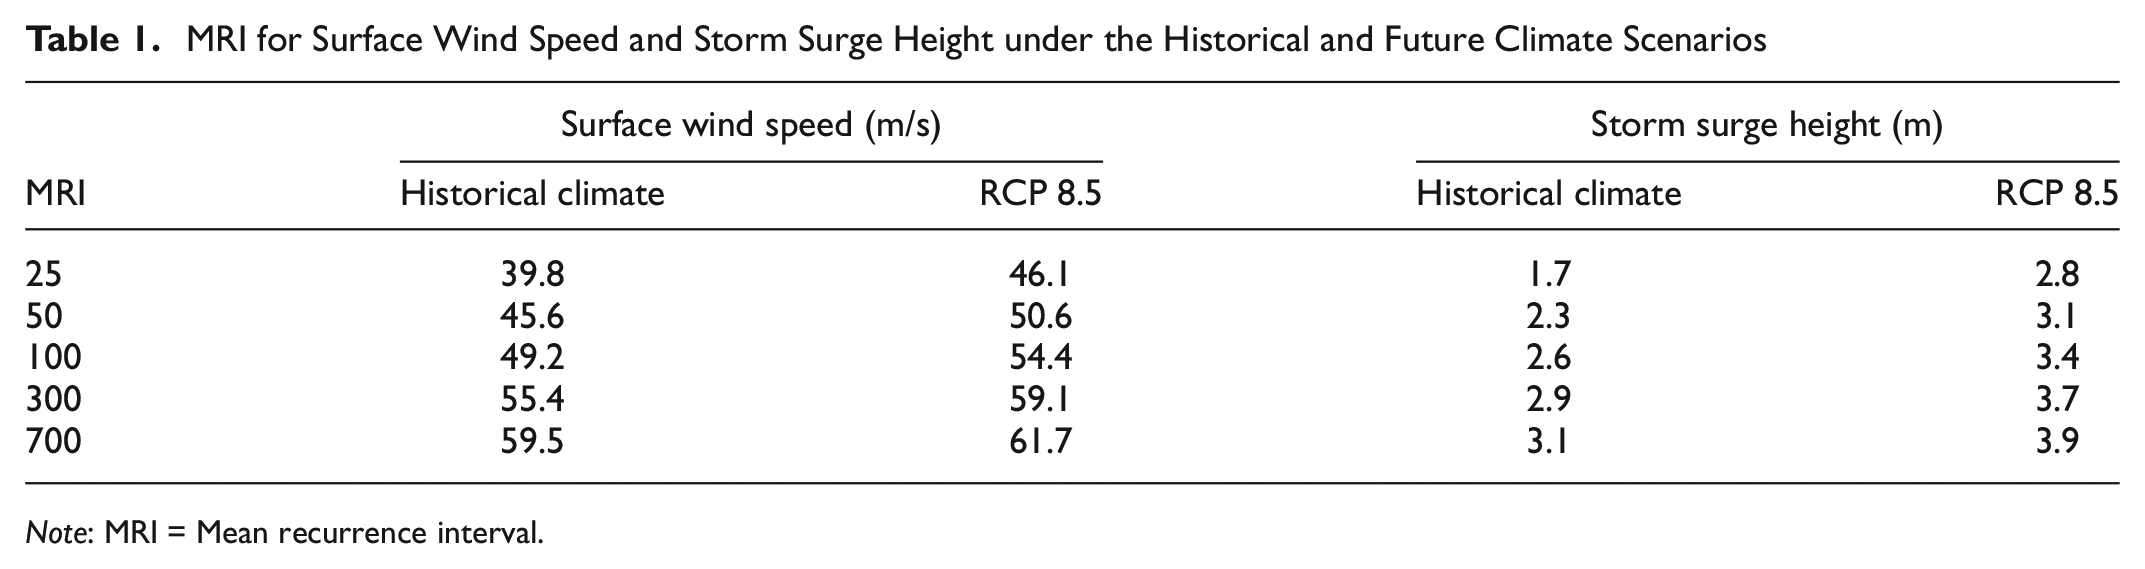
Note: MRI = Mean recurrence interval.
The terrain surrounding the sample bridge and its effect on wind speed are not considered here because the purpose is to illustrate the use of the framework and not for site-specific design or assessment. The MRIs obtained for the surface wind speed and storm surge height are important to demonstrate how a changing climate could affect hurricane hazards using the risk framework. For example, the design wind speed for the 50-year return period based on historical records is 45.6 m/s, whereas it is projected to reach 50.6 m/s for RCP 8.5, an increase of 11%. Furthermore, the results indicate that the current 50-year design wind speed may occur every 25 years or less in the event of RCP 8.5—a significant climate-related impact. The 50-year storm surge height, which corresponds to an elevation with 2% annual probability of exceedance, is expected to reach 3.1 m under the RCP 8.5 scenario, which is a 30+% increase over the 2.3 m associated with historical climate. It should be noted the selected region is also impacted by extratropical cyclones (also known as Nor’easters) that can generate strong winds and heavy precipitation with large waves ( 42 , 43 ), also leading to large direct and indirect financial losses. Nor’easters are generally weaker than hurricanes, but are more frequent with longer durations. Extreme wind and cascading hazards for short return periods may be mainly governed by extratropical cyclones and not hurricanes, and so should be explicitly included in a formal extreme wind hazard assessment.
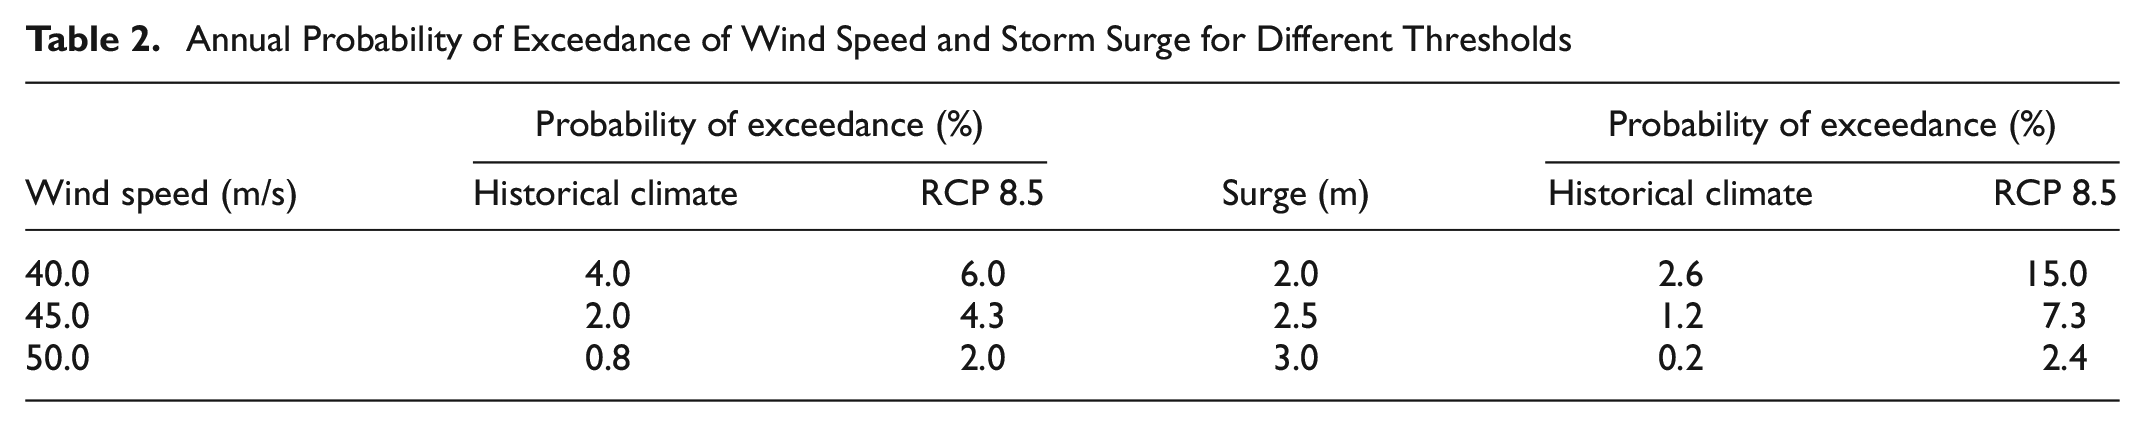
According to the Highway-Bridge Closure Policies Report (https://www.i95coalition.org/), there are several criteria that trigger bridge closures based on the wind speed, storm surge, or both. These criteria are formulated in relation to predefined thresholds (e.g., maximum wind speed, storm surge level, or both) that vary by state. Table 2 presents the annual exceedance probabilities of wind speed (10 m above the ground surface) and storm surge for the historical climate and RCP 8.5 for different closure thresholds. It may be concluded from these simulation results that changing climate will have a significant, negative effect on the annualized rate of bridge closures, with the attendant direct and indirect economic losses. For example, the annual probability of exceedance increases from 2.6% under the historical climate to approximately 15% under RCP 8.5 for a 2 m storm surge threshold. For a 2.5 m surge threshold, the annual probability of exceedance increases six times under RCP 8.5. The annual rate of bridge closure increases 50% for RCP 8.5 if the wind speed threshold of 40 m/s wind speed is used. The significant increase of wind and storm surge return levels suggests that new mitigation approaches (e.g., storm surge barriers) may be necessary to limit the impacts of these hurricane hazards on coastal areas.
Annual Probability of Exceedance of Wind Speed and Storm Surge for Different Thresholds
Concluding Remarks
In this study, the risk assessment of hurricane wind and storm surge hazards under changing climate was investigated along the northeast U.S. coast. A physics-based intensity model was utilized in the risk framework to overcome some of the shortcomings of the widely used statistical models (e.g., nonlinearities neglected). A height-resolving, analytical wind model was utilized along with a moist entropy-based gradient wind model, integrating the contributions of several environmental factors such as the outflow temperature, to effectively simulate the spatial distribution of the wind field in the boundary-layer region. An efficient, multi-layer feedforward backpropagation network model was developed to predict storm surge elevations using standard hurricane parameters, namely, central pressure, translational speed, radius of maximum winds, and storm track. The training datasets needed for the newly developed machine learning-based surge model were retrieved from the high-fidelity NACCS database.
Ten thousand years of Atlantic Ocean hurricanes were simulated for two climate conditions: (i) observed (1991–2010), and (ii) future (2081–2100), where RCP 8.5 was used for the future scenario. The simulations indicate a significant increase in the hurricane intensity (greater than 10%), with a slight decrease in frequency. Hurricane surface wind speed and storm surge height were characterized using MRI. Greater wind speeds and higher storm surge elevations are expected with changing climate. Threshold values of these hazards will occur more frequently with climate change. For example, the current 50-year design wind speed is expected to be exceeded every 25 years (or less), and the 50-year storm surge level is expected to be exceeded every 10 years (or less). Furthermore, it was demonstrated that the annual exceedance probabilities of surface wind speed and storm surge elevation might increase by up to a factor of 12 under RCP 8.5. This observation has significant implications for the bridge closure rate and increased structural damage. These results suggest that codes and standards should explicitly address the effects of changing climate on wind and storm surge hazards to ensure the serviceability and safety of coastal infrastructure for their expected 50–100 year design life.
Footnotes
Acknowledgements
The support for this project provided by the NSF Grant # CMMI 15-37431 and the Institute of Bridge Engineering (IBE) at University at Buffalo is gratefully acknowledged.
Author Contributions
The authors confirm contribution to the paper as follows: study conception and design: T. Wu, R. Snaiki; data collection: R. Snaiki, T. Wu; analysis and interpretation of results: R. Snaiki, T. Wu, A. Whittaker, J. Atkinson; draft manuscript preparation: R. Snaiki, T. Wu, A. Whittaker, J. Atkinson. All authors reviewed the results and approved the final version of the manuscript.
Declaration of Conflicting Interests
The author(s) declared no potential conflicts of interest with respect to the research, authorship, and/or publication of this article.
Funding
The author(s) disclosed receipt of the following financial support for the research, authorship, and/or publication of this article: The work in this research project was partially funded by NSF Grant # CMMI 15-37431 and the Institute of Bridge Engineering (IBE) at University at Buffalo.