
Abstract
Transportation Network Companies (TNCs) have been steadily increasing the share of total trips in metropolitan areas across the world. Micro-modeling TNC operation is essential for large-scale transportation systems simulation. In this study, an agent-based approach for analyzing supply and demand aspects of ride-sourcing operation is done using POLARIS, a high-performance simulation tool. On the demand side, a mode-choice model for the agent and a vehicle-ownership model that informs this choice are developed. On the supply side, TNC vehicle-assignment strategies, pick-up and drop-off operations, and vehicle repositioning are modeled with congestion feedback, an outcome of the mesoscopic traffic simulation. Two case studies of Bloomington and Chicago in Illinois are used to study the framework’s computational speed for large-scale operations and the effect of TNC fleets on a region’s congestion patterns. Simulation results show that a zone-based vehicle-assignment strategy scales better than relying on matching closest vehicles to requests. For large regions like Chicago, large fleets are seen to be detrimental to congestion, especially in a future in which more travelers will use TNCs. From an operational point of view, an efficient relocation strategy is critical for large regions with concentrated demand, but not regulating repositioning can worsen empty travel and, consequently, congestion. The TNC simulation framework developed in this study is of special interest to cities and regions, since it can be used to model both demand and supply aspects for large regions at scale, and in reasonably low computational time.
Transportation Network Companies (TNCs) are now an established and convenient transportation mode in metropolitan areas. Such services provide door-to-door transportation through traveler requests and traveler-driver interaction mediated by smartphone applications ( 1 ). The prevalence of these services will likely increase with the emergence of autonomous vehicles (2–5), with TNCs serving riders with a fleet of shared autonomous vehicles (SAVs). Modeling and simulating such services is, therefore, essential for forecasting their effect on the transportation system in the coming years.
Recent research has explored the potential effects of TNCs from an operations perspective, especially while considering an SAV fleet. Two studies, one with a hypothetical grid network ( 3 ) and another for Austin, Texas ( 6 ), found that one SAV can replace around 10 conventional vehicles with a reduction in total vehicle-miles traveled (VMT) through pooling or dynamic ride-sharing (DRS). A Singapore study simulated taxi trips as SAVs and found that one-third of the existing fleet was sufficient to meet the demand ( 2 ). Rising VMT was found to be a concern, which is especially true with induced demand. A larger replacement rate was found in Stockholm, reaching 20 vehicles when DRS was employed ( 7 ). In Berlin, researchers simulated a fleet of 100,000 vehicles which was able to serve all trips previously performed by 1.1 million private cars ( 5 ). The same study also found an increase of 17% in the time spent completing those trips. A Lisbon study simulated SAVs with different seating capacities to compare mode share changes ( 8 ). Using 4-, 8-, and 16-seaters, the authors observed the effect that solo travel and sharing rides had on the network when transit and walking modes were available. Large average vehicle occupancies (AVO) of 2.0 for 4-seaters, 4.2 for 8-seaters, and 11.4 for 16-seaters were accompanied by 20%–40% VMT savings. The strategy behind matching vehicles to travelers was perceived as the key factor in reducing empty VMT (eVMT) and travelers’ waiting time. Another study tested and compared several real-time dispatching strategies ( 9 ). The method was applied to the City of Chicago, U.S.A., where taxi data is available. The optimization-based schemes fared better among all strategies, and the share of eVMT was about 20%. Similarly, the use of short-term demand forecasting with smart SAV relocation to meet anticipated demand has been studied ( 10 ). This study helped show that even spatially aggregate forecasts of high quality help improve SAV performance. Two studies in Austin, Texas looked at the effect of pricing SAVs and other modes with assumptions on rich information available from using AVs, concluding that for Austin pricing with, and without, DRS helped curb the increase in VMT, but could not show considerable savings ( 11 , 12 ). An interface has been created using the multi-agent simulation tool, or MATSim ( 13 ), to test SAV operations uniformly across case studies ( 14 , 15 ), with the only drawback being the use of a fixed demand and itinerary for every agent to begin with. Although the studies mentioned so far modeled SAV operations in detail, the anticipated change in traveler behavior with SAVs was not incorporated in sync with SAV operations forecasting.
Travel behavior has typically been studied only with stated-preference surveys since because of the minimal data provided by TNCs, and the lack thereof for a non-existent future scenario. A survey with riders found important differences between taxi and ride-hailing travelers ( 16 ). Their results also showed that the increase in TNCs’ mode share was occurring at the expense of other transportation modes. Key characteristics of SAV users were captured in another survey ( 17 ), finding that they were largely young, well-educated adults with higher incomes, which was corroborated by ( 18 ) for TNC use. Higher ridership was observed in high-density areas as expected. A suburban population and older people were found to be less likely to adopt AVs ( 19 ), be it for ownership or for use in SAV fleets. Another survey studied traveler behavior in the context of privacy and willingness to use DRS, and found that people expect to be comfortable with DRS in the future ( 20 ). These aspects should be taken into account when forecasting future TNC ridership, in sync with SAV operational performance.
Many previous studies have highlighted the importance of integrated modeling in transportation (21–24), but despite increasing literature in the area, very few studies have modeled TNC operation with explicit models for both demand and supply. The mobiTopp framework can be used to jointly model demand and supply aspects at the zone level ( 25 ). Their SAV simulation for Stuttgart, Germany showed considerable VMT savings potential. Congestion effects on the links are not observed, and the SAV framework did not allow vehicle repositioning, which may reduce some of the savings but may be used by SAV fleet operators to maximize revenue. A study using MATSim incorporated an individual’s willingness to use SAVs and user trust, and compared it with the in-house mode-choice model that uses a co-evolutionary algorithm and some randomness ( 26 ). This France-based study showed that incorporating the demand-side model considerably affected the demographic for SAV use bringing more realism to the model. SimMobility is able to integrate supply and demand fully, and was used to compare current TNC operation with an SAV fleet for Singapore ( 27 , 28 ), with results showcasing a benefit from centralized control. However, no study has been able to integrate supply and demand while being able to study a 24-h simulation at scale (i.e., full population). The scale of analysis has been found to be of particular relevance for SAV operation when considering pooling ( 29 ).
This paper presents an agent-based approach for analyzing the operational aspects of TNCs at scale, while also using demand-side models to improve forecasting accuracy. The package is built on the top of the agent-based tool POLARIS ( 30 ) and integrates both demand and supply aspects. On the demand side, a vehicle-ownership model is used at the household level to distribute vehicles based on household characteristics. A vehicle fleet distribution model takes care of the percentage of human-driven vehicles and AVs in the simulation. Cost of travel in a TNC vehicle and outcomes of the vehicle ownership and fleet distribution models inform the mode-choice model for a traveler, and this is repeated in a cycle for convergence. On the supply side, trip travel times and congestion effects are an outcome of the mesoscopic traffic assignment model, which also takes care of transit schedules and TNC vehicles for an integrated operations simulation. The implementation is generalized so that current TNC operation and future SAV systems can both be simulated.
The remaining sections of this paper are organized as follows: the agent-based model, POLARIS, and underlying principles are introduced next, followed by the methodology used to model TNCs and SAVs, concluding with the analysis conducted using two case studies, their results and discussion.
The Agent-Based Model: POLARIS
The evolving complexity of travel behavior and transportation networks have led to the integrated modeling of travel demand and network supply as opposed to the traditional sequential process. In particular, agent-based models capture these interactions on the perspective of co-evolving agents that engage in activities (demand) based on time-dependent travel times using the different modes available (supply). The travel times, in turn, are an outcome of all the agents’ decisions and the congestion effects in the network. Therefore, in these tools, demand and supply are mutually dependent as opposed to traditional four-step modeling. The sequential process practiced widely by many metropolitan planning organizations misses the interaction between demand generation and supply, and they will have to eventually shift to using tools like MATSim ( 13 ), SimMobility ( 31 ) or POLARIS ( 30 ). In this study, POLARIS was extended to micromodel TNC operations.
POLARIS is a high-performance, open-source, agent-based modeling framework that can simulate large-scale multi-modal transportation systems at a mesoscopic level that includes 100% of the population as agents in the model. It features integrated travel demand, network flow, and a traffic assignment model in which key aspects of travel decisions (activity planning, route choice, and tactical-level driving decisions) can be modeled simultaneously in a continuous and fully integrated manner.
The activity models adapted from existing research controls each traveler’s decision-making process for within-day, mid-term, and long-term timeframes taking into account activity types, and preferred modes and destinations ( 32 , 33 ). The mid-term and within-day travel behavior decisions include the process of individual activity episode planning and engagement. These decisions are constrained by long-term choices in relation to home and workplace choice, and household vehicle choices, and, in turn, these influence activity and travel planning, and realization.
The traffic flow model uses a mesoscopic representation of vehicles’ movements based on Newell’s kinematic wave model ( 34 ), with updates that represent interactions with traffic control infrastructure ( 35 ). The traffic flow simulation works seamlessly with a dynamic traffic assignment (DTA) algorithm ( 36 ) that assign routes to individual vehicles using a time-dependent A* shortest path router ( 37 ) based on the prevailing traffic condition, as well as updated skim travel times. Travelers’ routing behavior from large delay is also captured by allowing re-routing. The effect of ITS infrastructure ( 30 ) and information mixing ( 36 ) on travel demand and behavior has also been incorporated, and the flow model takes into account connectivity and automation to observe likely behavior by personal AVs in the future ( 38 ). This functionality is inherited for the TNC model for futuristic SAV simulation. POLARIS also provides functionality for microscopic transit simulation. Transit lines and schedules in a region are simulated with capacity truncation in transit vehicles. Traveler and transit-vehicle interaction is captured for boarding and alighting, and trip delays take into account real-time transit movement based on congestion on the network through an iteratively updated travel-time skim. The array of supply- and demand-side models in POLARIS, paired with low computational times, make it a suitable choice for large-scale TNC fleet simulation.
TNC Fleet Simulation
TNC fleets are modeled jointly from both the demand and supply perspectives in POLARIS. The demand side takes care of TNC request generation using a household vehicle-ownership model and a mode-choice model that takes into account fares and travel times to identify the preferred mode. For the supply, TNC vehicle operation is modeled through two main components: the TNC fleet operator and the TNC vehicle. The demand and supply aspects of the TNC simulation used in this study are explained in detail next.
TNC Demand: Vehicle Ownership, Mode Choice, and TNC Requests
Mode-Choice Model
POLARIS uses three separate mode-choice models depending on an activity’s purpose: home-based work/school, home-based other, and non-home-based—similar to traditional modeling. The nested-logit formulation used to model mode choice include nine modes: drive alone, TNC use, ride as passenger, walk, bike, bus with walk access, bus with drive access, rail with walk access, and rail with drive access. Among these, drive alone and TNC use are grouped under the auto nest, and the two rail modes are grouped under the rail nest, as shown in Figure 1. The model includes a variety of demographic variables, accessibility information, and level of service (LOS) variables. The demographic variables include individual demographics such as education, employment status, possession of a driver’s license, and household demographics such as household income, household size, and vehicle and bike ownership among others. Road-network density and activity density of the destination zone are used to capture the characteristics of land use and the transportation network. The TNC-specific LOS variables used in the model include in-vehicle travel time and wait time (obtained from the simulation), and input fare. The TNC fare comprises of a fixed cost per trip, a distance-varying component, and a time-varying component. The model is developed and calibrated against the household travel survey data collected from the local region’s metropolitan planning organization.
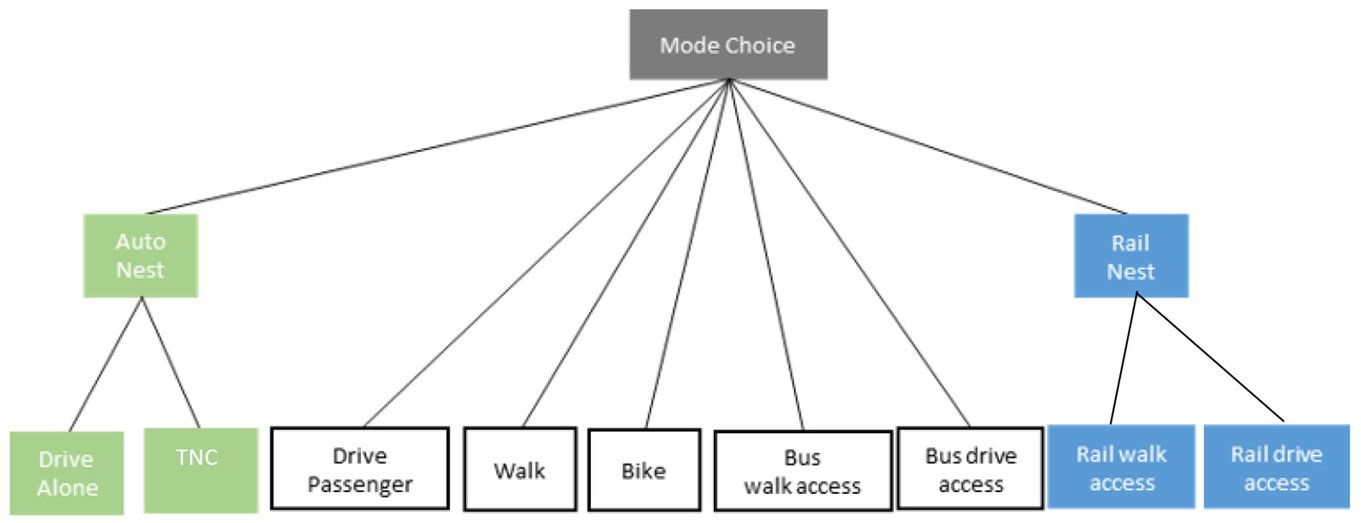
Nested-logit mode-choice structure used in POLARIS.
Vehicle-Ownership Model
Household vehicle ownership is expected to change in response to the high penetration rate of TNCs. To account for the change in a household’s vehicle ownership, a household vehicle-disposal model is implemented in POLARIS, in addition to the baseline vehicle-ownership model. Two separate ordered-probit models are implemented to capture the vehicle-disposal propensity of one- and multi-vehicle households, respectively ( 39 ). The ordered-probit models quantify the household’s likelihood of disposing of vehicles from the existing household vehicle fleet. Consequently, the vehicle count is reduced for the households that express high likelihood of relinquishing their vehicle in response to increased penetration of TNCs. A random draw from a triangular distribution of unit base is used to determine the exact number of vehicles discarded by multi-vehicle households. The ordered-probit model uses a variety of demographic characteristics of the household (such as household size and income), as well as information on the primary driver in the household (such as gender, ethnicity, and education status). Travel characteristics such as the average travel duration on a regular day and time spent in searching for parking are also included in the model. The model is sensitive to TNCs’ service characteristics such as fare and fleet size. Accessibility of a household’s location is also used to capture behavior leading to households located near an urban core being more likely to give up vehicles compared with the households located in the suburbs, and is depicted in Figure 2 for Chicago, Illinois. The accessibility is calculated for each zone based on how attractive a destination zone is for its activity opportunities (e.g., government offices, service opportunities, manufacturing, retail, and industrial opportunities) weighted by the travel time between the origin and destination zones. Activity opportunities at a zone farther away from the origin zone are weighted less favorably compared with the activity opportunities provided by a zone closer to the origin zone. Therefore, in the simulation, a household having a high accessibility score indicates that the household has good access to zones with favorable activity opportunities. Alternatively, households having a low accessibility score indicates that favorable activity opportunities are limited.
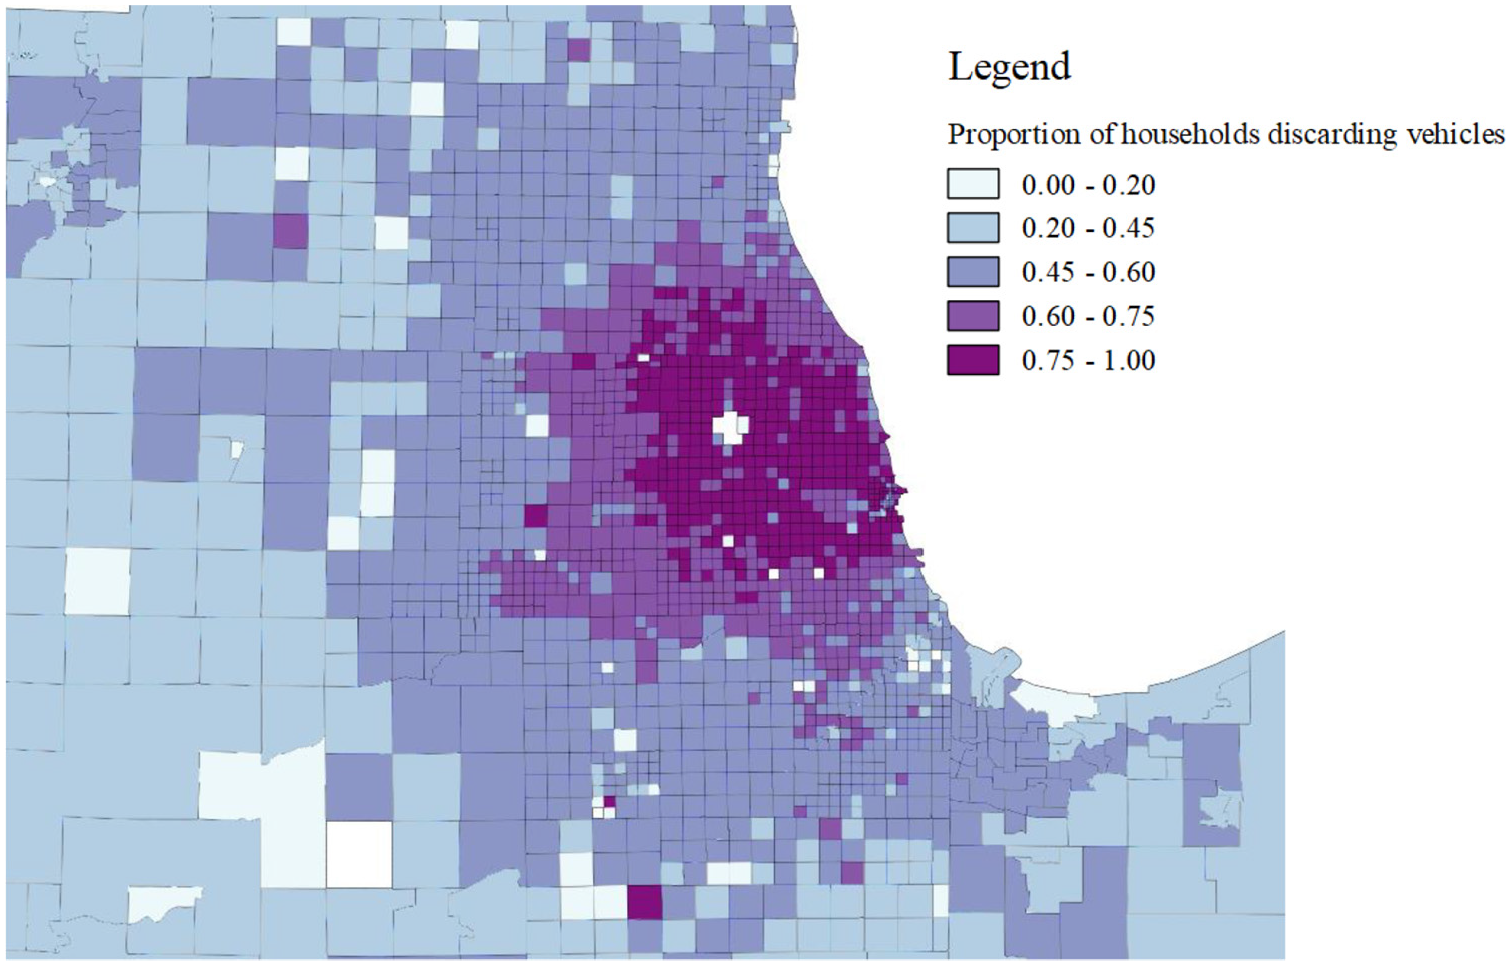
Distribution of households discarding vehicles in response to high transportation network companies penetration in the Chicago region.
TNC Supply
The TNC operator and TNC vehicle are modeled to mimic operations which are currently observed from a consumer’s perspective. The operator assigns requests centrally to individual vehicles depending on the assignment strategy and monitors the demand-to-supply ratio to determine if repositioning is required. The TNC vehicle executes the pick-up, drop-off and repositioning tasks depending on the instruction received from the operator. The TNC vehicle is able to store requests that are being executed and those that need to be executed in the future.
Assignment Strategy
When a TNC trip request is made, the fleet operator attempts to assign it to the closest available vehicle to reduce total eVMT, as well as to minimize the traveler waiting time. Two assignment strategies are included in POLARIS: a coordinate-based search and a zone-based architecture. The coordinate-based search utilizes vehicle coordinates which are updated continuously throughout the simulation to create an R-tree ( 40 ). The R-tree improves spatial searches and, therefore, the coordinates of an incoming request can be used to find the closest vehicle assessed using the Euclidian distance and the R-tree structure. Despite R-tree being an efficient spatial data structure, it may have some drawbacks. The Euclidian distance may not necessarily reflect the travel times between vehicles and requests since mean speeds vary along different routes in the network depending on congestion and network characteristics. Another aspect critical in large-scale simulations is the computational burden. R-tree’s insertions, deletions, and queries take considerably more time compared with basic data structures (in the order of milliseconds compared with microseconds for the latter). However, this does not significantly grow with fleet size for individual operations. While this is not an issue to simulate present-day TNC systems that enjoy a relatively small share of trips, it may be significant for future scenarios in which millions of trips are potentially served by SAV fleets.
To account for this, an adapted version of the zone-based structure in ( 5 ) is implemented to be able to simulate large-scale scenarios with a reasonably low computation time. The zone-based architecture is generated using the traffic analysis zones (TAZs) which are included in POLARIS. The TNC operator constructs an array of all neighboring zones, for each zone in the region, in ascending order of free-flow travel times defined with respect to a reference zone. This array is truncated using a predefined threshold for wait times so that a minimum LOS is maintained by the TNC service. By definition, the first zone in each array is the reference zone itself, which would mean minimal wait time. When a trip is requested, the operator checks for any available vehicle, starting from the origin zone and in the same order defined by the array, and assigns an unoccupied vehicle from the first neighboring zone that has a vehicle available. Since vehicles in these arrays are stored with longest-idling vehicle first, they need not be the closest available vehicle, but are expected to serve the request in reasonably less time. Both the assignment strategies described here can be adapted to match requests to current trips to simulate pooling. However, DRS was not executed for this study but is in the works.
Vehicle Operation
Once the request is assigned, the TNC vehicle handles the remainder of the request. Each vehicle stores a sorted list of tasks to be performed. A pick-up and a drop-off operation is added to this list for every request assigned to the vehicle. Each task in the list involves the vehicle moving between its location to either the pick-up point or the drop-off point. Depending on the task, the vehicle identifies the path from its current location to the next operation location. At the end of each trip, the total trip distance, travel time, and empty travel, are computed and recorded. At the vehicle’s destination after drop-off, the vehicle may receive a new set of tasks and repeat the same process again. If there is no task to be performed, the vehicle stays idle at the last task’s destination and awaits new trip assignment. Without DRS, only one task is executed at a time to speed up the assignment process, which only uses available vehicles (i.e., those that are idle).
Repositioning
Depending on the pattern of origins and destinations of incoming trip requests, there can be an uneven spatial distribution of the TNC fleet. The TAZs that have more trip beginnings tend not to have vehicles close to them to serve the incoming demand. Conversely, areas that are common destinations, but with a dearth in trip beginnings, have a concentration of vehicles. These vehicles will probably wait a long time to be assigned a new trip, and the consequent eVMT is likely to be long. Therefore, vehicles also need to be able to perform repositioning trips in addition to pick-up and drop-off tasks.
The repositioning strategy in this study is undertaken in a decentralized manner, with vehicles performing repositioning trips based on their current location, demand (number of requests), and supply (number of vehicles) aggregated at the TAZ level. The number of requests per TAZ is averaged over a predefined moving time-window, K. Based on the demand and the fleet size, S, a desirable number of vehicles per zone is computed as:

where
Based on the zone’s desired number of vehicles,

where
Case Study and Results
The TNC model implemented in POLARIS comprises of several moving parts. There are two assignment strategies modeled, which can be compared for computational burden in large-scale simulations. Traveler interaction with TNC vehicles shows the fleet’s LOS, and the TNC operation, of a TNC operator controlling a fleet of vehicles, can be studied to observe the impact on system VMT and induced congestion from eVMT. On the demand side, interest in TNC use based on vehicle-ownership and vehicle-disposal models and TNC use costs helps to understand the future of such a service.
The demand and supply perspectives implemented in this paper were tested using two case studies for Bloomington and Chicago in Illinois, United States. The two regions are a few orders of magnitude apart in their spatial extent, population, travel demand, and network complexity, making them good test beds. Bloomington houses about 120,000 people who make around 614,000 person-trips. On the other hand, the Chicago region is home to about 10 million people who make 27 million person-trips. Figure 3 shows the Bloomington network, which consists of about 4,000 links and 2,500 nodes, next to the Chicago network, which has about 31,000 links and 19,000 nodes.
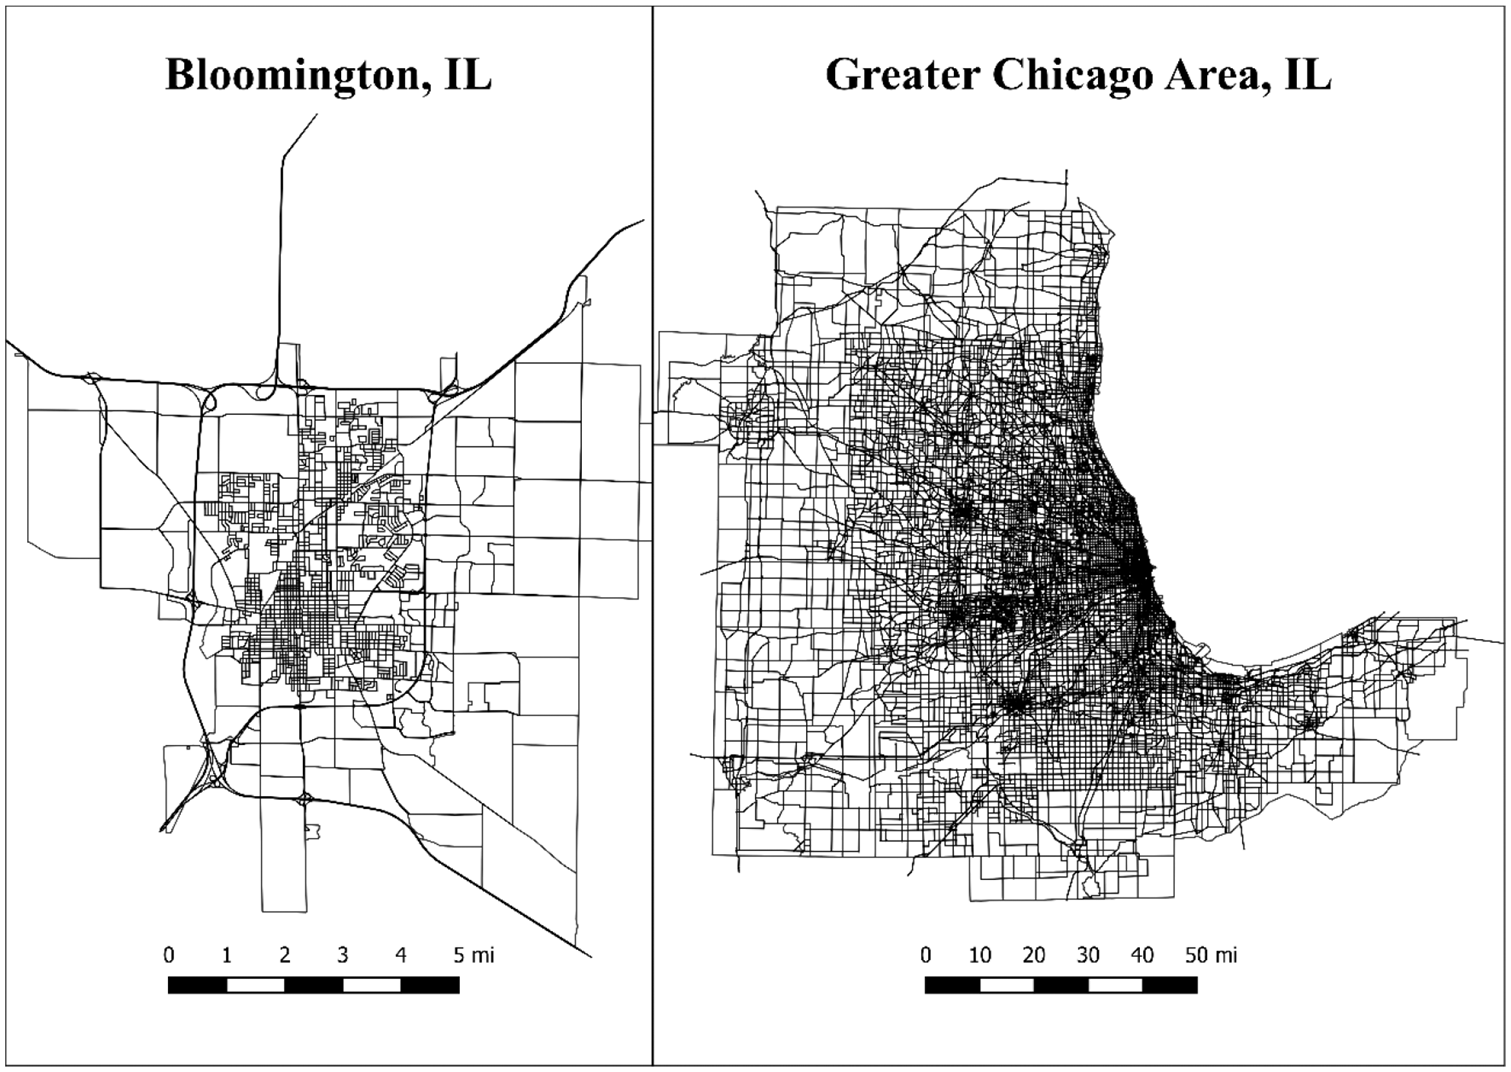
Bloomington and Chicago networks in Illinois, U.S.A.
Computational Burden and Effect on Wait Time
The smaller region of Bloomington was used in comparing the computational burden of TNC vehicle-to-request assignment for the two strategies that were modeled. The lower run time allowed simulation of multiple combinations of fleet sizes and maximum threshold wait times, which are important inputs to these strategies. In the present-day context, about 2% to 3% of all person-trips in Bloomington are made using TNCs and taxis. Fleet sizes varying as one TNC vehicle for every 75, 150, and 300 residents, were tested using the coordinate-based search and zone-based architecture, defined earlier. Since the zone-based architecture is created based on the threshold wait time allowed, wait times of 10, 15, and 20 min were simulated. The cumulative time taken in seconds for assignment is reported for each scenario, and the impact of these strategies on average wait time is discussed.
Figure 4a illustrates the computational burden of each vehicle-assignment strategy implemented using simulations for Bloomington. R-tree has a significantly higher fixed computational cost, about twice that of the zone-based architecture implemented. This only increases with fleet size although the average wait time is lowered by assigning closest vehicles to requests. The zone-based architecture performs equally well when taking into account the computational cost. Average wait times differ by less than a minute even when using this architecture as depicted in Figure 4b. The size of TAZs may play an important role in the effectiveness of the architecture, but was not analyzed since it was obtained from the local metropolitan planning organization’s travel demand model.
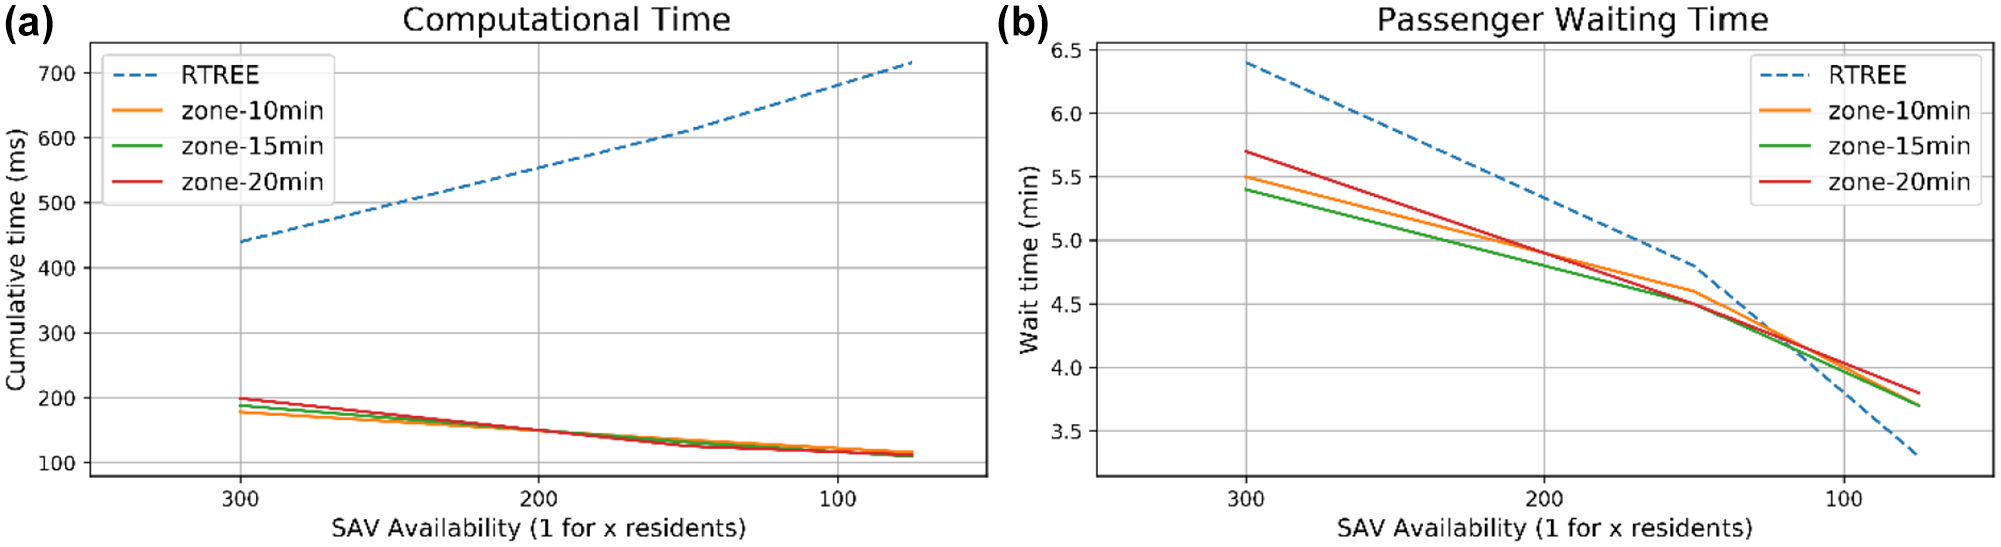
Computation and traveler wait times for each vehicle-assignment strategy.
Large-Scale Effects from Repositioning
The larger region of Chicago was studied to validate the micro-modeling of TNC operations at scale. Fleet sizes of one TNC vehicle for every 25, 35, 50, and 100 residents, were tested for present-day conditions, and two levels of future reduction in vehicle ownership informed by the implemented model. The scenarios tested here are named A1–A4 for smaller change in vehicle ownership in the region, with 1–4 denoting increasing fleet size, or decreasing fleet availability. Similarly, B1–B4 denote the larger change in vehicle ownership that will considerably increase the demand for TNCs. The zone-based architecture was used for the assignment strategy with a maximum wait-time threshold of 30 min. Repositioning of TNC vehicles was allowed to occur at 10-min intervals based on the demand-supply balancing algorithm with the time-window of 4 h for averaging trip requests. The average wait time, percentage of TNC trip requests served, percentage of eVMT and rVMT, and average trips made by each TNC vehicle are reported to analyze the effect of such fleets on the system.
Results from the large-scale simulation of the Chicago region were obtained from running POLARIS on a desktop with two Intel Xeon processors, each with six cores, running at 3.4 GHz and having access to 128 GB of RAM. The convergent simulation of the Chicago travel demand model with TNC vehicles takes about 8 h on the machine described with repositioning enabled. Table 1 summarizes the fleet characteristics for all the scenarios tested. In all the scenarios analyzed, there are trips unserved even when there is a higher vehicle availability. Most of the unserved requests occur during the morning peak as can be observed from Figure 5, which depicts the temporal distribution of the unserved requests across the different scenarios. In the morning peak, there is high demand of requests originating in the suburbs by travelers wanting to go to the central areas, causing an outflux of vehicles from that area. In addition to this, a reposition trip tends to be long as these areas are sparse. This explains the higher percentage rVMT observed as fleet size increases across cases A and B.
TNC Fleet Effect by Size and Demand
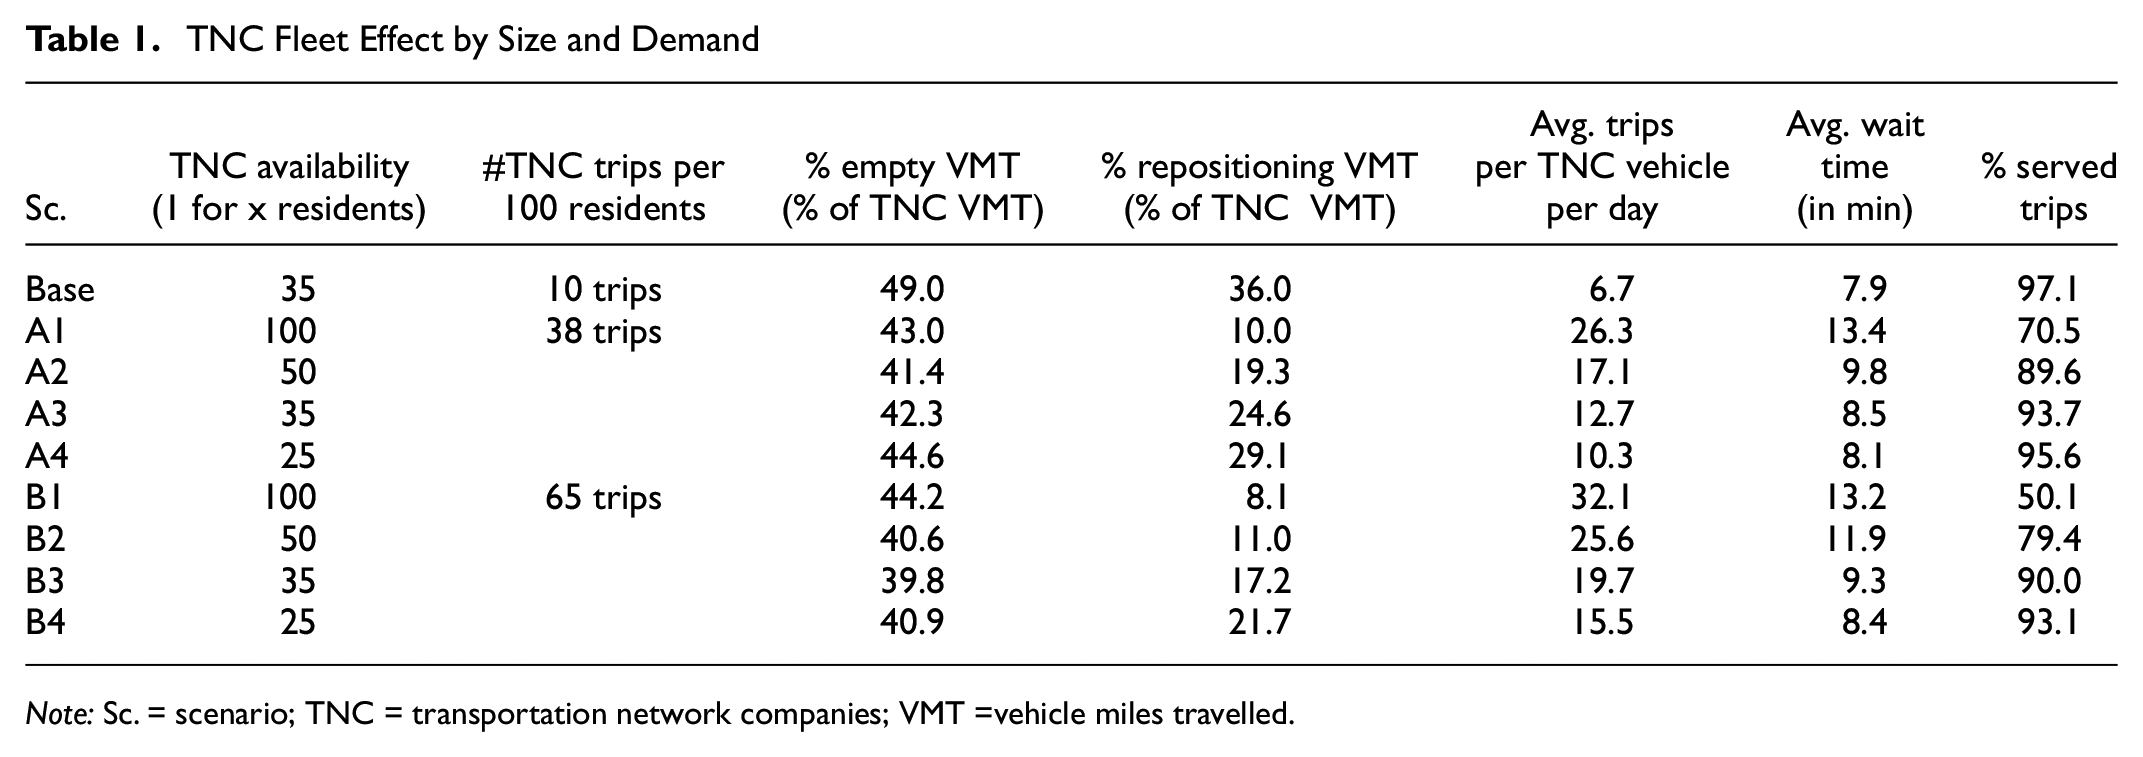
Note: Sc. = scenario; TNC = transportation network companies; VMT =vehicle miles travelled.
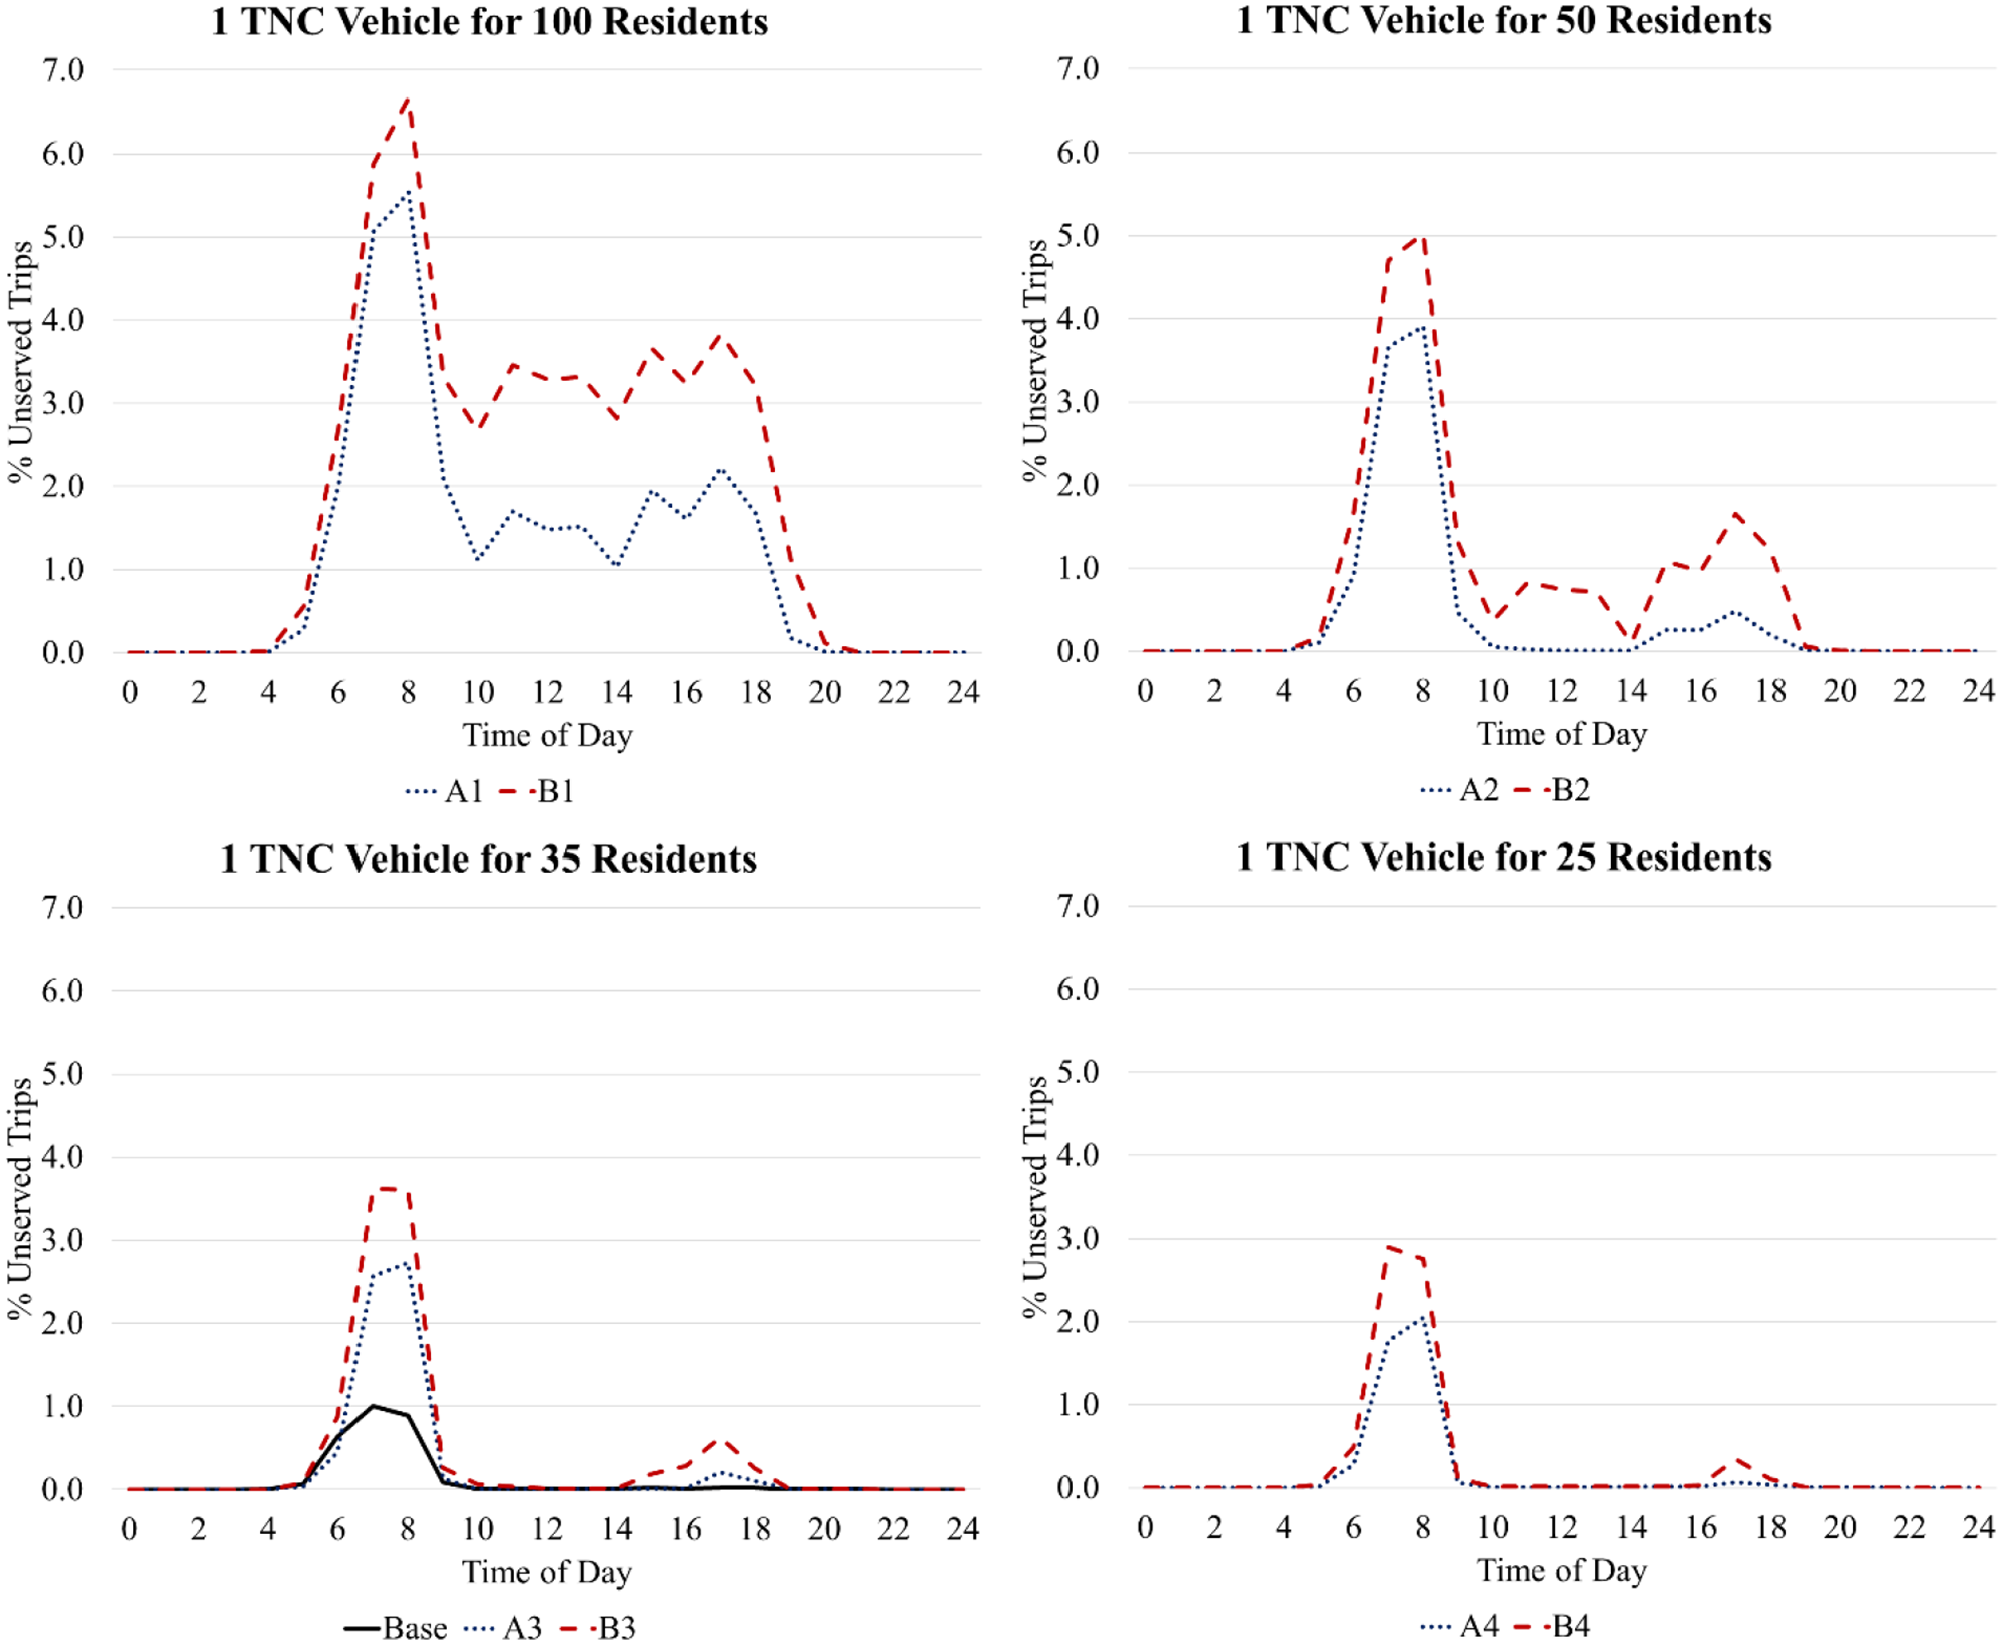
Percentage of requests unserved by time of day across scenarios.
The VMT in repositioning and pick-up trips is a critical aspect of TNC/SAV operation as the vehicles travel empty (or without any customer), referred to as eVMT in this paper. Across scenarios A and B, the eVMT as a percentage of VMT stayed around 40%, with the exception of the base scenario. In the present-day context, TNC vehicles serving trips across the region were found to have about 41% eVMT by ( 41 ). As the repositioning strategy resembles the current TNC operation (with driver/vehicle driving to high demand areas without a central coordination), results in this study were close. In the base scenario, this share was higher as more vehicles were available to take long repositioning trips to suburban areas, which caused the base case to have the highest share of repositioning VMT (rVMT) across all scenarios. A more sophisticated repositioning and assignment strategy could potentially reduce both eVMT and rVMT. Additionally, there are maximum savings of about 2% in total vehicle hours traveled (VHT) in the A scenarios and a maximum of about 22% in the B scenarios. However, these savings may be higher if smaller fleets are more efficient. Large fleet sizes decrease saved travel times, especially when the mode share of single-occupant vehicles is high, as in scenarios A3 and A4.
Across both future scenarios of change in vehicle ownership, the TNC availability and percentage rVMT was seen to be an influential factor in large percentage eVMT values. The larger the TNC demand, the more imperative it is that regions regulate TNC fleet sizes. Small fleets are able to be more efficient with high average trips made per vehicle per day when there is higher demand, serving trips with similar average wait times. This becomes clear in Figure 6, which shows the share of vehicles performing different operations or idling. Figure 6a shows the shares for cases A1 and A4, while Figure 6b shows the same for scenarios B1 and B4. For the smaller fleets (dashed lines, cases A1 and B1), most of the vehicles are either performing pick-up or drop-off trips and the share of idle vehicles is small throughout the day. As the fleet increases, there are more idle vehicles and some of these vehicles are able to perform repositioning trips to other areas of the network.
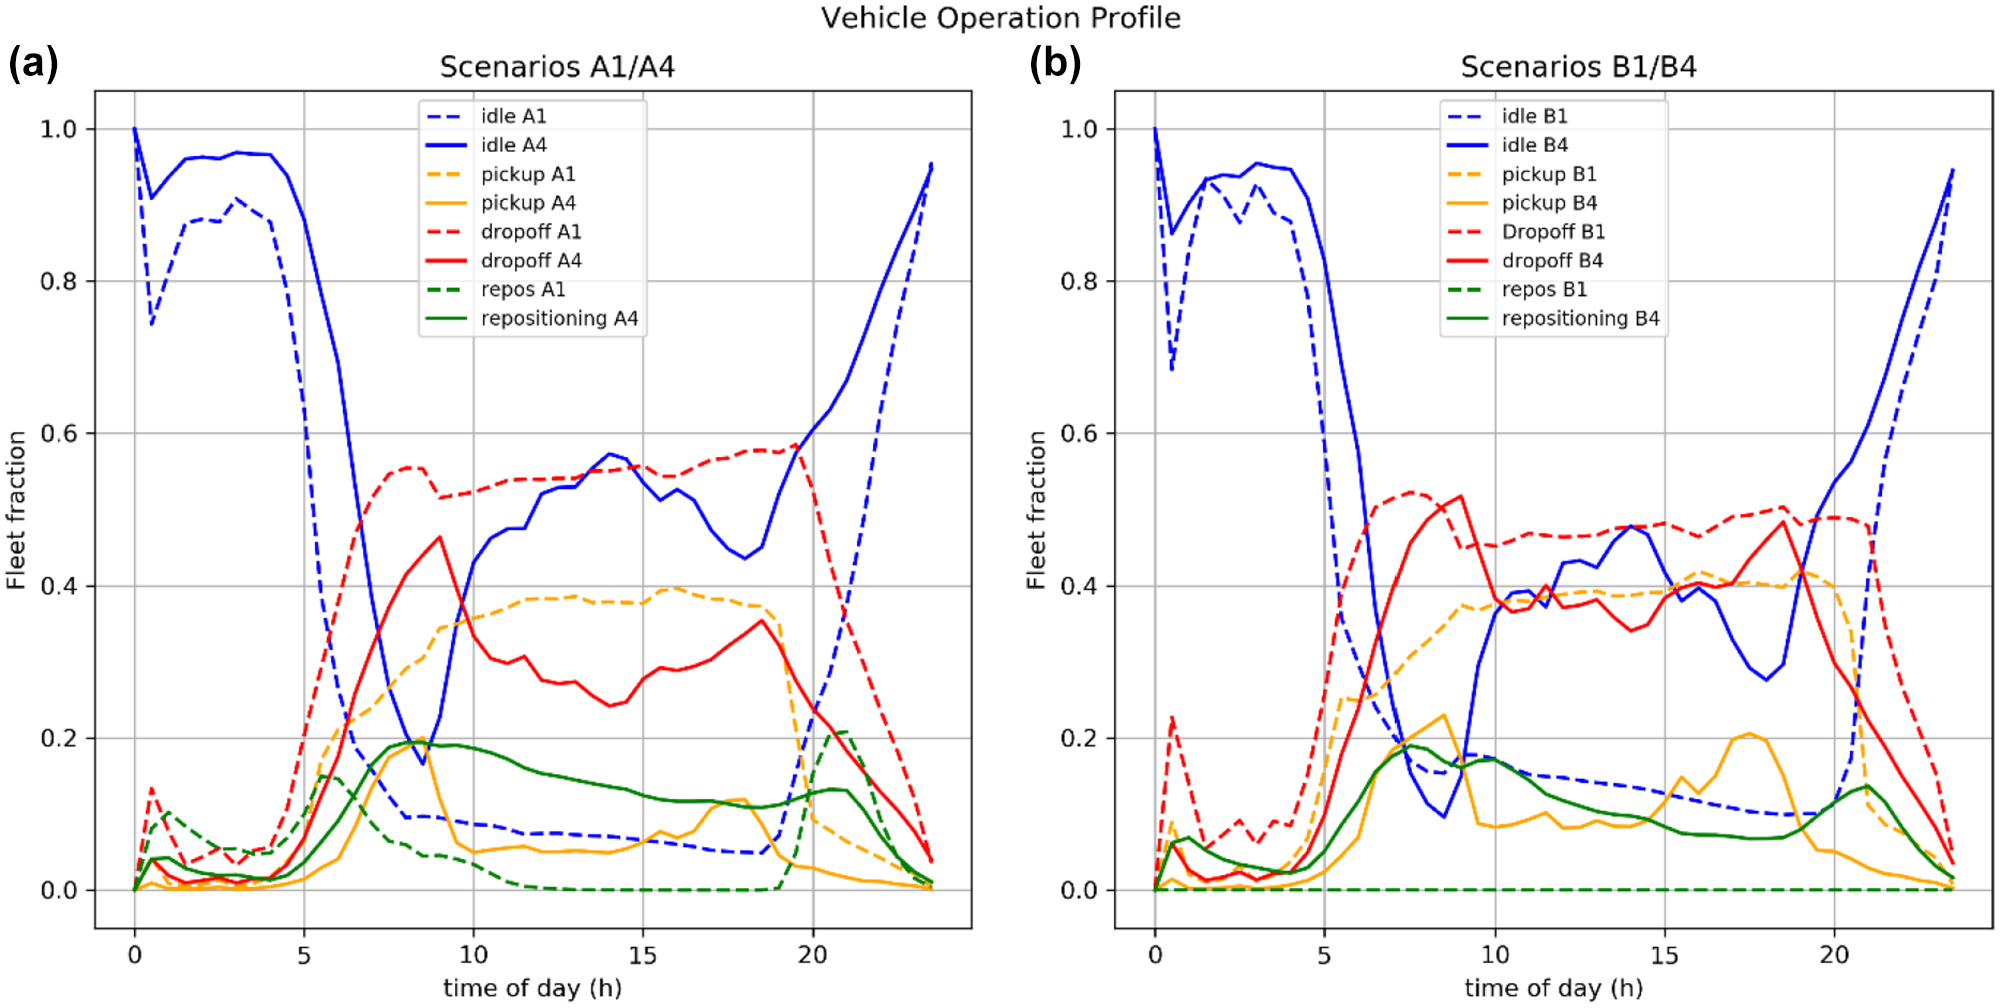
Share of vehicles idle or performing pick-up, drop-off, and repositioning trips by time of day for scenarios: (a) A1 and A4; and (b) B1 and B4.
Conclusion
Ride-sourcing use has seen exceptional growth, and this is only expected to increase exponentially with AVs in the mix. TNC operation is implemented in POLARIS in this study, to simulate the interaction between TNC vehicles, travelers, and the network accurately and to allow for different operational strategies. This supply model is integrated with the demand side by modeling TNC requests at the household level depending on vehicle ownership and a mode-choice model. The framework supports simulation of large regions at scale in reasonably low computational time.
A case study for Bloomington, Illinois is used to show that a heuristic vehicle-to-request assignment strategy compares well with the closest vehicle search using a specialized data structure. The zone-based architecture is faster, and insensitive to the fleet size at the expense of a marginal increase in pick-up distance and pick-up travel time. Overall, both strategies lead to similar wait times, depending only on higher TNC vehicle availability to lower traveler wait times. Despite being effective, the closest vehicle search would significantly increase the computational time with millions of trips being assigned in quick succession. The zone-based implementation is then validated for large-scale use by simulating travel in Chicago, Illinois. Results from this analysis reveal that repositioning may be the reason behind lower eVMT reported in the literature. Although the algorithm to balance demand and supply implemented here is a heuristic, fleet sizes need to be regulated for anticipated changes in TNC demand so as to keep added VMT in check. This anticipated change in demand, replicated here using a vehicle-disposal model informs regions as to the concentration of new demand in urban cores, where households are likely to own fewer vehicles. Percentage eVMT was around 40% across all scenarios, and the percentage rVMT increased as the fleet size increased whatever the demand. A small, but non-zero, percentage of TNC demand was not served even when employing larger fleet sizes. The unserved trips are concentrated in the morning peaks, and in suburban areas.
The methodology here is a step forward in integrating demand and supply for large regions. There were some key drawbacks that were observed during the analysis. On the demand side, TNCs operate based on drivers for hire, serving as contractors, who drop in and out of working for the TNC during different times of the day. A constant fleet assumption modeled here can be improved using time-dependent fleet sizing based on dynamic pricing. Similarly, a thorough TNC demand model needs to include the human tendency for cruising similar to ( 28 ). Once pooling is modeled, a choice dimension for choosing to pool can also improve realism and is ongoing work. On the supply side, the zone-based architecture implemented relies on the underlying framework of TAZs that is typically used by local metropolitan organizations. They are not uniformly distributed across a region, and this can play an important role in the effectiveness of this assignment strategy. The repositioning of trips using a demand and supply balancing algorithm is a heuristic that does not take into account a maximum distance or travel time that a repositioning trip should last. When this is combined with an ineffective TAZ size, it can lead to larger than usual levels of repositioning. DRS options that are offered by TNCs can nowadays save travelers some money and help lower congestion, but these were not explored in this study. Similar evaluations, as done in this study, need to be performed along with modeling DRS. Results originating from using heuristics that are used here need to be compared with optimization-based strategies for vehicle-assignment and repositioning for a TNC/SAV fleet operation as it can significantly affect eVMT and VHT. These are out of the scope of this study, but are in the works.
Footnotes
Author Contributions
The authors confirm contribution to the paper as follows: study conception and design: Gurumurthy, K.M., de Souza, F., and Enam, A.; analysis and interpretation of results: Gurumurthy, K.M. and de Souza, F.; draft manuscript preparation: Gurumurthy, K.M., de Souza, F., Enam, A., and Auld, J. All authors reviewed the results and approved the final version of the manuscript.
Declaration of Conflicting Interests
The author(s) declared no potential conflicts of interest with respect to the research, authorship, and/or publication of this article.
Funding
The authors disclosed receipt of the following financial support for the research, authorship, and/or publication of this article: This report and the work described were sponsored by the U.S. Department of Energy Vehicle Technologies Office under the Systems and Modeling for Accelerated Research in Transportation Mobility Laboratory Consortium, an initiative of the Energy Efficient Mobility Systems Program. David Anderson, a Department of Energy Office of Energy Efficiency and Renewable Energy manager, played an important role in establishing the project concept, advancing implementation, and providing ongoing guidance.