
Abstract
Knowledge of the root cause(s) of delays in transit networks has obvious value; it can be used to direct resources toward mitigation efforts and measure the effectiveness of those efforts. However, delays with indirect causes can be difficult to attribute, and may be assigned to broad categories that indicate “overcrowding,” incorrectly naming heavy ridership, train congestion, or both, as the cause. This paper describes a methodology to improve such incident assignments using historical train movement and incident data to determine if there is a root-cause incident responsible for the delay. It is intended as first step toward improved, data-driven delay recording to help time-strapped dispatchers investigate incident impacts. This methodology considers a train’s previous trip and when it arrived at the terminal to begin its next trip, as well as en route running times and dwell times. If the largest source of delay can be traced to a specific incident, that incident is suggested as the cause. For New York City Transit (NYCT), this methodology reassigns about 7% of trains originally without a root cause identified by dispatchers. Its results are provided to NYCT’s Rail Control Center staff via automated daily reports which, along with other improvements to delay recording procedures, has reduced these “overcrowding” categories from making up 38% of all delays in early 2018 to only 28% in 2019. The results confirm both that it is possible to improve delay cause diagnoses with algorithms and that there are delays for which both humans and algorithms find it difficult to determine a cause.
Incidents and delays are inevitable in any transit network, and in large, complex, or older systems, daily delays can number in the thousands. Understanding the cause of incidents and delays can have great benefit for a transit agency, ensuring that the correct steps are taken to prevent similar incidents from happening again, or at least lessening their impact on service. While the source of the delay is obvious in some cases, in others there may have been multiple small problems during the trip or even no clear reason for the delay at all. If an agency lacks the resources to delve into these more challenging delays, they may miss trends in performance and not address them promptly.
In New York City Transit’s (NYCT) subway system, there are tens of thousands of delayed trains each month, and dozens of major incidents (affecting more than 50 trains) in addition to smaller incidents. In a system as complex as NYCT, which has 27 lines and significant interlining, it can be particularly challenging to determine the cause of a delay. Though NYCT’s delay recording process has recently been modernized, train dispatchers still manually assign trains to incidents based on the best knowledge available. Often, trains with no clear cause are assigned to broad categories indicating heavy ridership, train congestion, or both. With more than one third of delayed trains consistently falling into these categories in 2018, the Metropolitan Transportation Network (MTA) board and transit advocates began to take notice.
This paper describes a methodology to try to reduce this percentage and assign more trains to root-cause incidents as opposed to symptoms of those incidents, like congestion or crowding. It uses train location data and incident data to analyze where the most delay occurred along a trip and whether nearby trains were assigned to root-cause incidents. If a relationship can be shown, a new incident is suggested. In the near term, this provides better delay data, making the agency’s reporting more accurate.
However, the process described in this paper is seen as only a first step toward more automated or real-time delay recording. The goal of this phase of the project was not to fully automate the system, but to work with train dispatchers and quality control staff to provide them with recommendations of what delays to update, and, critically, learn from them to improve the program’s logic. Currently, NYCT train dispatchers are often pulled away from their primary service management role for several tasks, including delay recording. Taking advantage of all the data now at the agency’s disposal and the lessons learned in this phase of the project can help develop new processes for delay recording, allowing dispatchers to devote more time and energy to improving train service. In addition, having delays better categorized can help the agency plan preventative measures and allocate resources to the system’s true sources of delay.
The rest of this paper is organized as follows: the next section provides more background about delay recording at NYCT and delay categorization more generally. The section after that details the methodology piloted at NYCT to better assign delayed trains to incidents. The penultimate section then describes the results of putting this method into practice, both in relation to its success at finding better incident assignment as well as its reception by staff at the Rail Control Center. The final section concludes the paper with suggested future directions for this work.
Background
Delay Recording at NYCT
In the New York City subway system, trains are considered “delayed” if they arrive at their destination terminal more than 5 min later than scheduled, or if they do not run to all scheduled stops, whether canceled or given a service change (reroute, skip, etc.). Train dispatchers are responsible for determining the source of these delays or changes and providing a reason for each one.
To do this, each dispatcher at the Rail Control Center (RCC) is assigned a set of terminal stations to monitor. Once trains have completed their trips, the dispatchers use train movement data to see how the trip compared with schedule along the line, as well as notes from conversations with field staff about issues they encountered. In the past, this process was highly manual, requiring dispatchers to hand write the information about late and adjusted trains. Now, use of NYCT’s Integrated Train Register Activity Console (ITRAC) system makes it more automated, but determining how to assign trains still relies on human judgement. Ultimately, all delay and incident data is stored in NYCT’s Subway Incident Recording System (SIRS) database.
For train delays without an obvious cause, it can be difficult for dispatchers to find an appropriate incident using their available tools. In many cases, the train is instead given an “operating environment” (OE) code: insufficient capacity/crowding, person(s) holding doors, excess dwell time, terminal holdout, or delayed by lay-up/put-in. Delays associated with such incidents are typically not large, nor are many delays assigned to any particular incident, but nevertheless, over 10,000 trains a month typically end up in this category.
Past Research
Overcrowding is known to be an issue in major transit systems, including the Underground in London, and major systems in Asia like Hong Kong’s MTR and Tokyo’s railways ( 1 , 2 ). In Tokyo, a recent report found that most delays of less than 10 min were caused by passengers ( 3 ). However, newer transit systems like those in Hong Kong and Japan are generally able to manage these passenger loads and maintain reputations for good service.
NYCT’s “overcrowding” problems were met with skepticism by advocates, journalists, and even system president Andy Byford ( 4 ). The New York Times published a major investigation into the system’s delay records, finding that delays were increasing even as ridership fell, that there had been known issues with incident recording processes, and that other causes were contributing to a general slow-down of service ( 5 ). Researchers have also begun to pick up on this issue, with NYCT inspiring work to better understand the relationship between overcrowding and other underlying causes of delays through microsimulation models ( 6 ).
Understanding the root cause of incidents has benefits for improving safety, understanding the source of recurrent operational delays, and preventative maintenance issues ( 7 – 9 ). Several researchers have developed frameworks for analyzing transportation delays, including establishing categories for grouping similar types of incidents. A taxonomy for rail delays defines six groups: engineering and mechanical malfunctions, programmed track work, transportation crew failures, passenger-related issues, weather, and cascades ( 10 ). They found cascade delays, also known as knock-on effects, to make up about 20% of all delay minutes, the second most after engineering failures.
In reviewing delay recovery techniques, Schmocker et al. divided rail transit incidents into minor incidents, slow moving delays or bottlenecks, and blockages or major incidents ( 11 ). Minor incidents are often caused by passengers (e.g., holding doors) and major incidents are often because of car or track infrastructure failure. Slow moving delays include circuit or signal failures, where the trains can still move, just at lower speeds or capacity, as well as passenger crowding, which increases dwell times.
These minor delays are the ones that best fit NYCT’s “OE” incident types, but itis the slow moving delays or cascade delays that this paper is more focused on. These delays may be hard to match to an incident, either because the source of passenger crowding is unknown to dispatchers, or the delay is caused by earlier slowdowns, making the root cause hard to determine. Tracking cascade delays explicitly can help agencies understand the initial and subsequent impacts of an incident, but it is still useful to match these trains to a root-cause incident to understand the incident’s full impact.
Methodology
To determine whether train delays could have been caused by a specific incident, delay data is linked to actual and typical historical train movement data. The basic structure of this process is shown in Figure 1
Basic structure of operating environment (OE) delay reassignment process.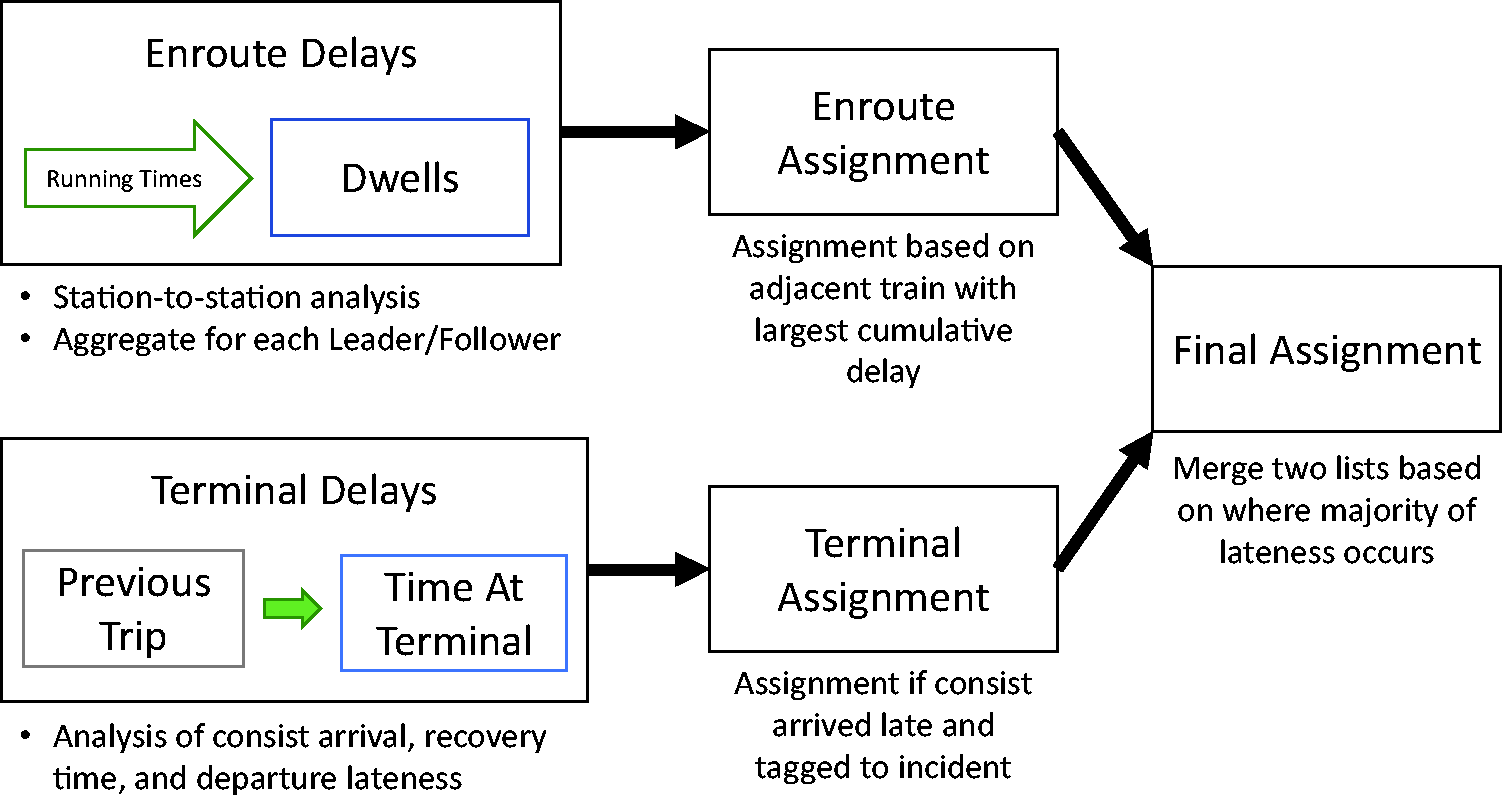
Several specific criteria and thresholds are used in this process based on their applicability to the NYCT system and available data. These may need to be adjusted for different contexts, either by changing which qualities to analyze or the thresholds being used.
Input Data
Three types of data are used in this process: delay and incident data, disaggregate train movement data, and historical typical train movement data.
The delay data is pulled from NYCT’s SIRS system, introduced above, which holds records for all incidents and late/adjusted trains. The data is stored in several relational database tables, and includes high-level information about each incident, including the primary train affected, the time of the incident, and the code(s) the incident is categorized as. Though train-level data for the service adjustments associated to each incident has long been available, similar data about late trains only became available in April 2018. This new data source prompted new analyses of delays and incidents, including the one described here.
Train movement data at NYCT comes from several sources. For the A Division lines (1–6, Grand Central Shuttle), data comes from the system’s track circuits and is generally consistently available and accurate. Data for the B Division lines (7, and the lettered lines) comes from several sources, including communications-based train control (CBTC), track circuits, Bluetooth beacons, and dispatcher records. The data source for a given station is not necessarily the same from day to day, and several of these sources lack the accuracy and precision necessary to break down running times down into small segments. Therefore, this analysis was performed only for A Division lines.
Finally, the en route analysis also uses a pre-aggregated set of typical run and dwell times with which to compare the travel times of trips being analyzed. This data set includes median run times between each station and dwell times at each station for each hour of the day, type of day (weekday or weekend), and line. (Dwell times include only the time trains spend in stations; any time spent “dwelling” between stations is captured in the running time.) It is based on several recent months of data.
Reassignment Process
The reassignment process has four steps:
Pull Delay and Train Movement Data
En route Analysis and Assignment
Terminal Analysis and Assignment
Final Assignment
Each of these are described below.
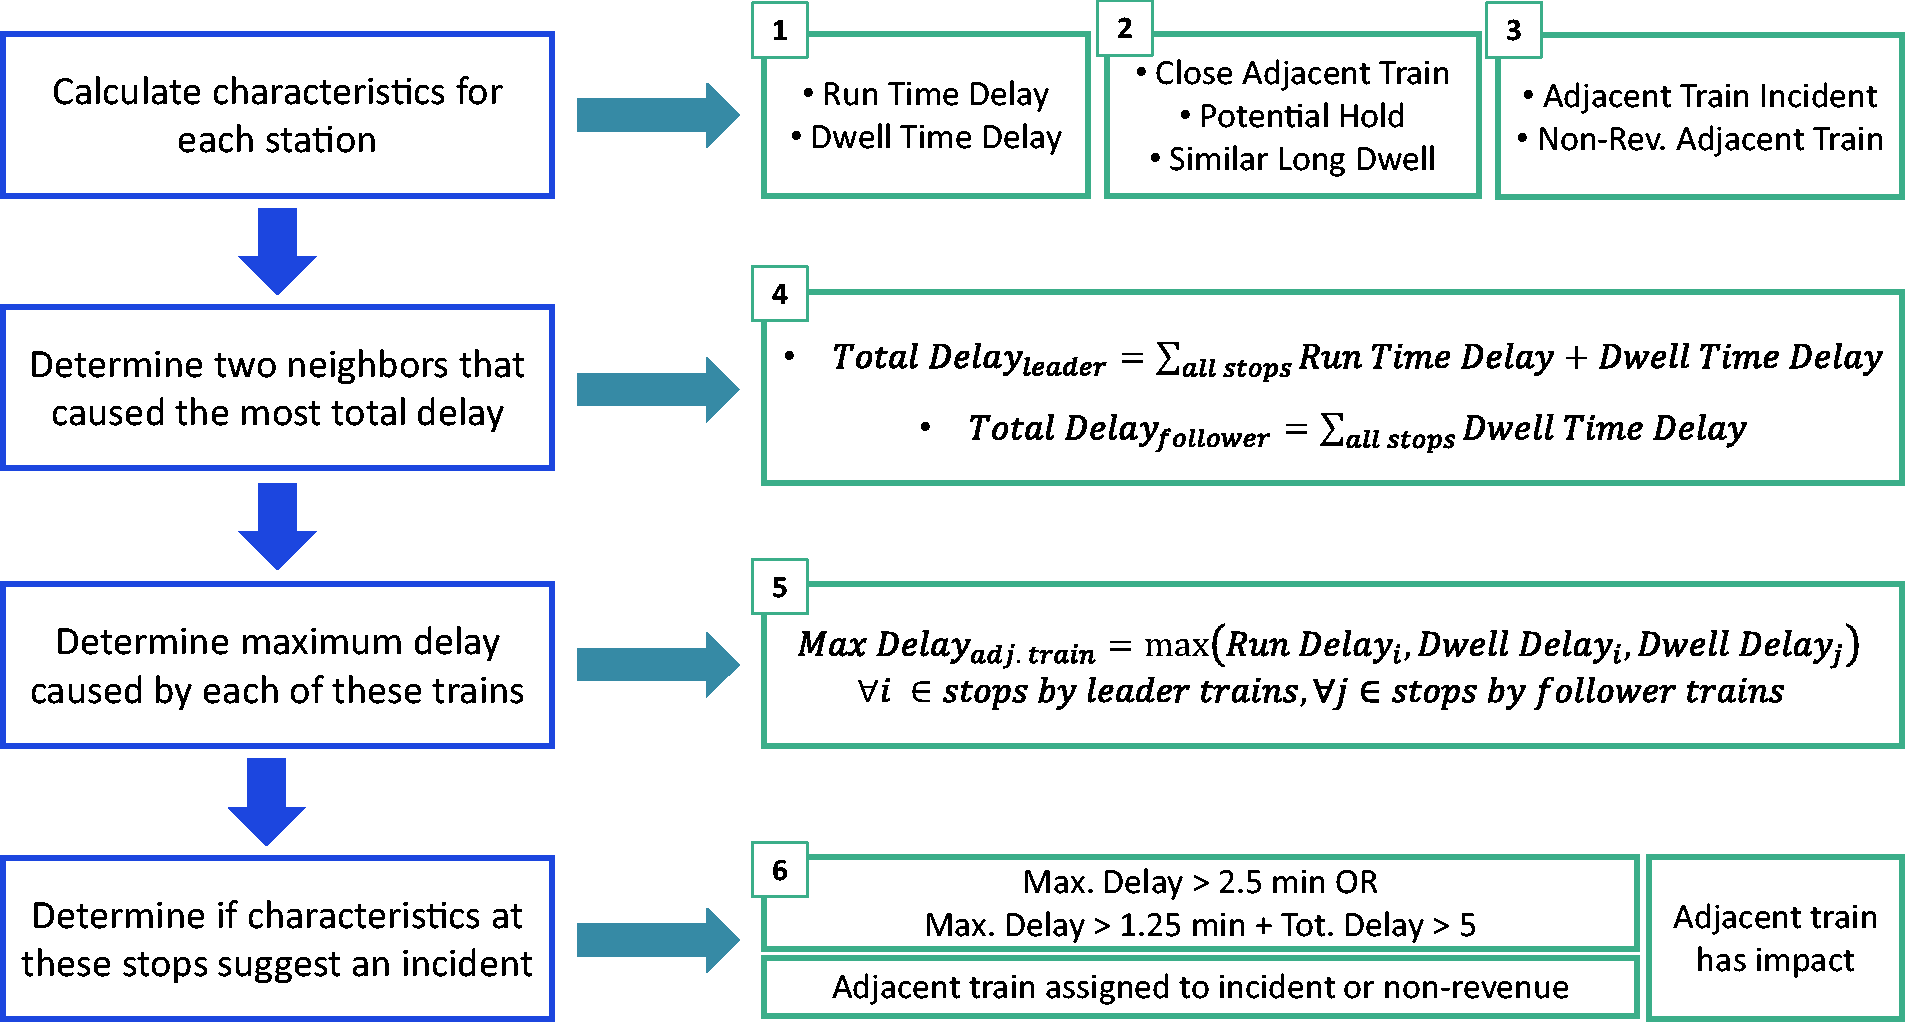
Pull Delay Data The first step of the process is to pull any train that was late or had an en route service adjustment into a single table. This table joins all the relevant fields from various SIRS tables into a single place and is later used to store the results of this process. En route Analysis and Assignment The en route analysis begins by assembling all the data that will be used in this step, structured as a table with rows for each station stop of A Division trains assigned to OE delays. It includes stop-level train movement data, split into dwell times and run times, and the applicable historical median travel times for those trains. In addition, relevant data about leader and follower trains’ incidents and train movements is included, as this is the basis for finding root-cause incidents. Figure 2
Overview of the en route assignment process, with calculation steps on the left and outputs or criteria on the right. Delay: The typical running and dwell times are subtracted from the actual times to get the delay (or time savings, if the trip is faster than typical) at each station. Adjacent Train Impact: True if the train falls into any of the following categories related to whether the adjacent train’s movements could have caused a delay:
Delay in that segment involved running time and the leader train was less than 3 min ahead Delay in that segment involved dwell time and either:
The leader train was less than 3 min ahead There is a potential hold because of the leader, based on the logic of NYCT’s service management tool, SIRE, and the leader is less than 4 min ahead (
12
) There is a potential hold because of the follower Both trains had dwell times of at least 5 min at the same time Adjacent Train Incident or Non-Revenue: True if the adjacent train has been assigned to a root-cause incident (that has already occurred) or if the adjacent train is a non-revenue train (work train, layup train etc.) Then the train is analyzed to narrow down potential causes of delay. The focus of this process is to find the adjacent train(s) that caused the most delay, either at a single station or over all the stations for which two trains were adjacent. Though this means that cases where a small perturbation leads to larger problems later in a trip are missed, it was felt to be a more transparent rule that would be easier to explain to both Rail Control Center staff and users of delay data. The adjacent trains “causing” the most delay are determined by calculating the total delay accumulated along each leader train and each follower train (Figure 2, row 2): Gradual Total Delay Along Adjacent Train: The sum of all the delays, calculated in (1), for the segments, stations, or both, where two trains are adjacent. For leader trains, the total delay includes both running time and dwell time delay. For follower trains, it includes only dwell time delay, under the assumption a train will never be forced to stop because of its follower, as it might be because of a stalled leader. The train could, however, be proactively held by a dispatcher to prevent a gap from growing behind it. This typically done when a train reaches a station, so it would be observable only in dwell time. Only the two adjacent trains that caused the most delay are considered candidates for causing an incident. (The top two, rather than only one, are kept in the event that they have similar total delay but only one has an incident, and to deal with edge effects at the beginning and end of a trip.) Next, the maximum delay the train experienced along each of these two adjacent trains is determined (Figure 3
The operating environment (OE) reassignment process is good at finding: (a) incidents on other lines, (b) residual delays, and (c) long concurrent delays. Single Station Delay: The maximum delays in each segment identified in (5) at a single station or station-station segment. Again, for leader trains, the maximum delay can be either the single largest running time delay or dwell time, while for follower trains, only dwell times are considered. Finally, as the last row of Figure 2 shows, an incident is suggested for trains meet the criteria defined for assigning a new incident: Incident Assignment: The train must meet criteria for delays, adjacent train incident, and adjacent train impact:
Either a pronounced single station delay (>2.5 min), or a moderate single station delay (1.25–2.5 min) and gradual total delay along the adjacent train (>5 min, matching NYCT’s lateness threshold), AND The adjacent train was assigned to an incident or was not in revenue service at the point of maximum delay, AND The adjacent train met the impact criteria at the point of maximum delay If these criteria are met by both adjacent trains and there are multiple incidents suggested, either the one from the adjacent train that caused more total delay or, if this is the same, the one that occurred earlier is suggested. The suggested incident code and ID, the maximum delay and station associated to the incident, and how late the train was at that time, are saved to compare with the terminal results of the next section. Terminal Analysis and Assignment All trains assigned to OE delays are checked to flag if their vehicle’s prior trip was late at its arriving terminal, and if so, whether there was an incident during its trip, or if there could have been an issue at the terminal itself. To do this, the following factors are assessed:
Late Departure: True if the trip departed the terminal more than gld—the departure lateness, set at 1.5 min—minutes late Terminal Segment: True if the trip accrued the majority of its lateness in the terminal First Segment: True if the train accrued the majority of its lateness within the terminal and the first en route segment Turn Time: True if the time between the vehicle’s arrival at and departure from the terminal is greater than gtu, a system-wide typical turnaround time of 2 min Previous Trip: True if the vehicle’s previous trip was late, finishing its trip more than 5 min later than scheduled Leader Headway: True if the ratio of the headway between the last trip to depart the terminal and the current trip over the scheduled headway of these two intervals is more than glh, set at 1.6. With this series of binary flags in place, the trains are analyzed to determine if an incident from the reverse direction can be suggested. Trains that meet the following criteria are given a preliminary Possible Reverse Direction Incident code:
The previous trip for the trains consist was late, AND The train did not take more time than necessary to depart on the next trip, AND EITHER
The trip lost the majority of its time at the terminal, OR The trip did not lose the majority of its time at the terminal, AND
The trip departed late, AND The trip lost most of the majority of its time during the first segment, AND The terminal headway of the leader was large Trains falling into this category are those whose delays can be linked to an incident which affected the incoming consist availability. If these trains were assigned to a root-case incident on a previous trip, that incident is proposed to reassignment.
Final Assignment

If a train receives a new incident assignment through both the en route and terminal assignments, the one causing greater delay is selected as the final reassignment suggestion. Otherwise, the single suggestion from one of the processes is used. These are saved in the table from Step 1 along with the initial delay data.
The process is run iteratively, using the reassignment suggestions for prior rounds to inform new suggestions. For NYCT it is run five times, though the vast majority of suggestions come from the first iteration.
Production Process
A Python script runs this process each morning at 8:30 a.m. to analyze the data from the previous day. It takes about 7 min to complete. In the event that data need to be rerun at a later date, the script can run either a single day or a longer time period.
Results
When this process was first introduced in Fall 2018, new incidents were recommended for about 8% of A Division trains assigned to OE incidents for being late or needing en route service adjustments. However, the percentage has fallen slightly over time to about 6.5% in Spring 2019. This is explained by a concurrent RCC initiative to better assign delayed trains to incidents from the start. Among A Division trains, OE incidents went from contributing about 40% of delays in early 2018 to 27% in 2019 before any reassignment, so many of the low-hanging fruit were already taken care of.
Examples of Reassignment
Trains that get reassigned typically fall into a few categories, which are shown on Stringline diagrams in Figure 3.
Incident on Another Line: Incident assignment is done by terminal, with dispatchers responsible for all the trains arriving at their assigned terminal stations. This means that the dispatchers typically only deal with delayed trains from a single line and may not be aware of incidents that started on other lines. Because of its reliance on reviewing leader and follower trains no matter the train line, the OE reassignment process can catch these situations, especially when it happens to a series of trains. This is shown in Figure 3a for a series of northbound 4 and 5 trains (highlighted in blue), where the northbound 4 trains were assigned to work-related delays and the northbound 5’s to excess dwell time, despite the slowdowns occurring in the same area. Residual Delays: It can be difficult for dispatchers to catch residual delays—trains that are more indirectly affected by an earlier incident. This is shown in Figure 3b, where a 1 Train with a car problem delayed its followers. Though assigned to an OE incident, the train highlighted in blue is on time until it reaches the end of the line, where the car problem was slowing trains. It should likely be assigned to that incident too. Long Concurrent Delays: Some OE assignments can be the result of necessary actions taken by dispatchers in response to an incident, and not due directly to the incident itself. This process reassigns several trains like those in Figure 3c, where a train was held because of a car issue ahead. This assignment was made on the basis of concurrent long dwell times rather than the trains’ proximity. The inclusion of this criteria came from Department of Subways staff; it had not initially been included, but was found to be a valuable addition to the process. Wrap-Around Delays: While an incident in one direction may not immediately affect the ability to provide service in the opposite direction, NYCT’s rolling stock and terminal space limitations can eventually result in a lack of physical trains to provide this reverse direction service. This can result in delays that appear to be because of crowding in the reverse direction as customers try to fit onto fewer available trains. For example, this process reassigned a northbound 6 train originally assigned to excess dwell time to a door problem. That incident initially affected southbound trains, but because the line’s southern terminal is a loop, no extra trains can be held to fill gaps. The long gaps caused by the door incident continued northbound and grew as there were additional crowding delays.
In fact, 85% of reassignment suggestions are for trains where the initial incident occurred to a train on another line, a train that was going in another direction, or a non-revenue train.
Reasons for No Reassignment
Figure 4
About 7% of operating environment (OE) trains received a suggested assignment, with the remainder lacking sufficient delay or neighbor characteristics en route, or appropriate characteristics at the terminal.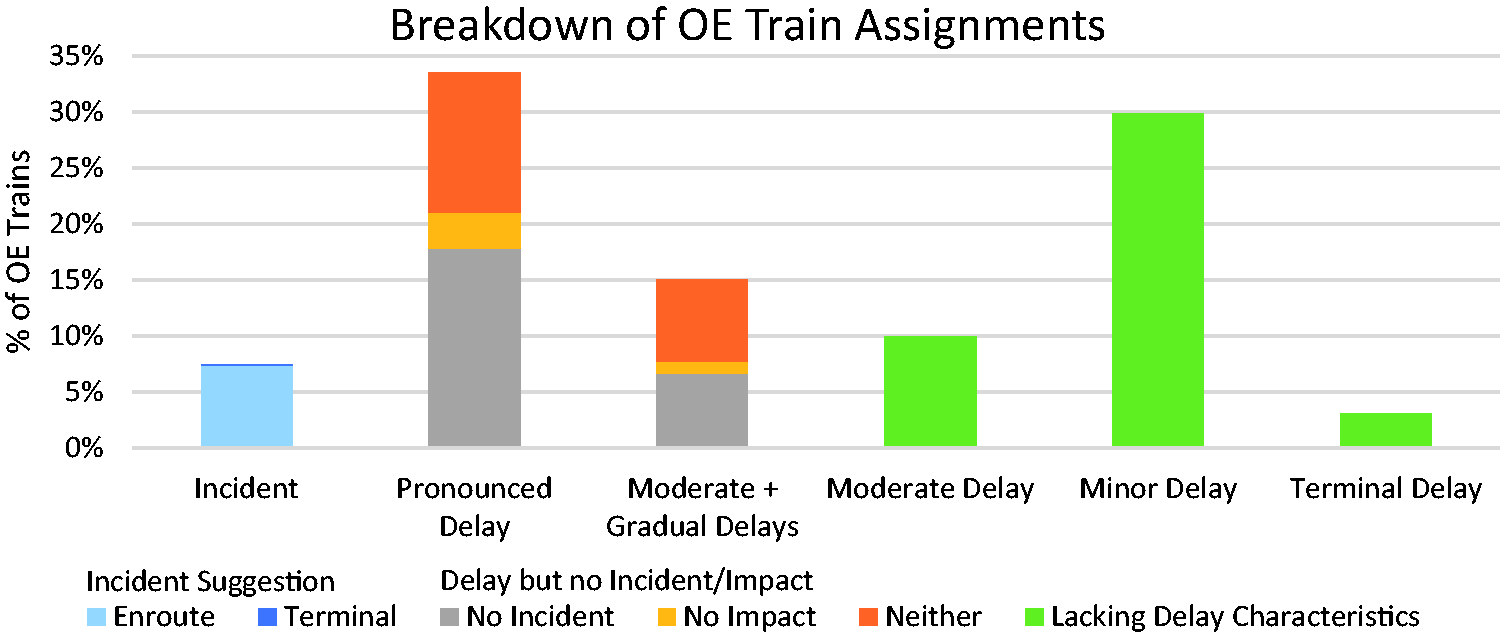
Of the OE trains that could not be assigned to a new incident, about a third only ever had minor delays and were simply a little bit slow along the entire line. These are likely good contenders for actual OE delays (or reviewing operator and conductor performance). About 3% of OE trains had the most delay at the terminal, but it was unclear what caused this—perhaps crewing or rolling stock issues that were not relayed to the dispatcher, larger schedule inconsistencies, or issues with the leading train soon after coming out of the terminal.
The rest of the OE trains did have larger delays at some point (split about equally between pronounced and moderate), but their neighbors were not close enough to assign an incident, did not have an incident, or both. These trains may also have had an OE incident, like unexpected surge crowding at a station, or the dispatchers may have not received complete information about the trip from onboard staff. Further investigation of these trains could also suggest ways to improve the process to improve matching.
Impacts on Delay Reporting
Several reports were developed in collaboration with RCC and other Department of Subways personnel to share the results of the reassignment process. The primary report shows the results of the reassignment process, and was revised several times to best meet the RCC’s needs. Two supporting reports that include other outcomes of the reassignment process were also developed to provide staff with additional information they felt would be useful.
These reports are automatically generated on Operating Planning’s reporting server at 9:00 a.m. after the Python process has run. PDFs of these reports are automatically emailed to the RCC’s QA team but they are also available to run on demand online if different parameters are desired or if other staff want to review the results.
The reports, and the process itself, have been well received by RCC staff. The QA team reviews the reports and works with dispatchers to reassign trains as they see fit. Throughout the development of this process, Operations Planning has been clear that they are producing only recommendations and RCC staff should fully review each train to determine if a train should be reassigned. Between January and June 2019, 1,465 trains that had been assigned to OE incidents were given suggestion for reassignment (approximately 7%) and 670, over 45%, were followed by RCC staff, who worked with train dispatchers to actually change the incident the trains were assigned to.
Conclusions and Future Work
The methodology described in this paper for reassigning OE delays to root-cause incidents did have some success. There was a relatively small percentage of trains given suggestions for new incidents which introduces two possibilities: either more work is needed to develop the logic for delay reassignment, or most of these trains are correctly categorized to begin with, given the information available. Analyzing the trains that were not assigned to incidents suggests that it is a mixture of both. There were several trains which had only minor or moderate delays during their trip, and were never particularly close to an adjacent, incident-affected train. These trains may have just had slightly long dwells that added up over the trip, or were trains that became bunched after a merge and had to go slow to maintain safe spacing.
However, there is also room to continue to refine the logic used by this process so more trains are included. Continuing to work with the QA team to understand which reassignment suggestions were useful and why others were determined not applicable will be of great value for this. Over time, other parameters may be found better suited either generally, or for specific lines, terminals, and times of day. RCC staff can also continue to propose other criteria to consider, as they have already done, in suggesting to look at trains that have long dwells at the same time. For example, giving precedence to terminal delays, which can have an outsized impact on service later in the trip, or trying to incorporate incidents from trains that are not direct leaders, followers, or previous trips.
The results also suggest the there is room to improve information sharing at the RCC; nearly 85% of reassignment suggestions were for incidents that began on other lines or the other direction than where the delay occurred. This could be built in to the existing front-end systems that dispatchers use, or dispatchers could be encouraged to make more use of existing tools, like Stringlines to see how a delay on one train propagates to others ( 13 ).
As discussed in the introduction, a longer-term goal for this project is to better automate delay recording or make the suggestions available in real time. This could involve introducing more sophisticated techniques to model the relationship between delays and incidents, though some dispatcher input will likely still be required to provide the initial cause of delay. Still, being able to prepopulate delays with suggested incidents soon after trips are completed would free up dispatchers’ time, allowing them to focus on service management. This could in turn further reduce issues with the OE. In the nearer term, with better train movement data coming to NYCT’s lettered lines, this process can be extended to those lines and continue to be improved ( 14 ).
Footnotes
Acknowledgments
The authors would like to thank the NYCT Department of Subways staff for the valuable support and feedback they provided to this project: Antoinette Poinsette, Barry Greenblatt, and Jackie Kuhls.
Author Contributions
The authors confirm contribution to the paper as follows: study conception and design: A. Halvorsen, D. Jefferson, T. Stasko, A. Reddy; data collection: A. Halvorsen, D. Jefferson; analysis and interpretation of results: A. Halvorsen, D. Jefferson, T. Stasko; draft manuscript preparation: A. Halvorsen, D. Jefferson, T. Stasko. All authors reviewed the results and approved the final version of the manuscript.
Declaration of Conflicting Interests
The author(s) declared no potential conflicts of interest with respect to the research, authorship, and/or publication of this article.
Funding
The author(s) received no financial support for the research, authorship, and/or publication of this article.