
Abstract
Cooperative adaptive cruise control (CACC) vehicle string operations have the potential to improve significantly the mobility and energy consumption performance of congested freeway corridors. This study examines the impact of CACC string operations on vehicle speed and fuel economy on the 13-mi SR-99 corridor, near Sacramento, CA. It extends the existing body of knowledge by performing a multi-scenario simulation analysis of the freeway corridor. A simulation study evaluated the performance of the corridor under various CACC market penetration scenarios and traffic demand inputs. The CACC string operation was also analyzed when vehicle awareness device (VAD) and CACC managed lane (ML) strategies were implemented. The case study revealed that the average vehicle speed increased by 70% when the CACC market penetration increased from 0% to 100%. The highest average fuel economy, expressed in miles per gallon (mpg), was achieved under the 50% CACC scenario where mpg was 27. This was 10% higher than the baseline scenario. However, when the CACC market penetration was 50% or higher, the vehicle fuel efficiency only had minor increases. When CACC market penetration reached 100%, the corridor allowed 30% more traffic to enter the network without experiencing reduced average speed. Results also indicate that the VAD strategy increased the speed by 8% when the CACC market penetration was 20% or 40%, while there was a minor decrease in mpg. The ML strategy decreased the corridor performance when implemented alone.
Cooperative adaptive cruise control (CACC) is a connected automated vehicle (CAV) system that offers coordinated automated car following capabilities for equipped vehicles. The system uses dedicated short-range communications (DSRC) to enable real-time vehicle-to-vehicle (V2V) information interchange with less than 20 ms latency (
1
). This allows a CACC vehicle to respond quickly to speed variations of the preceding CACC vehicle, enabling the subject vehicle to adopt car following time gaps of less than 1 s while operating in CACC vehicle strings in the freeway traffic stream (
2
). Since the CACC time gap is more than 50% smaller than the time gap of a typical human driver (
3
), the freeway facility can theoretically serve twice as many CACC vehicles as manually driven vehicles. In addition, as all the followers in a string can respond consistently to the speed changes of the string leader, it helps dampen traffic disturbances, which could otherwise propagate upstream and develop into traffic congestion. The flow smoothing effect of CACC strings is expected to improve the energy efficiency of the freeway traffic flow. The authors’ previous studies have quantified the following traffic mobility and energy efficiency benefits of CACC at an isolated freeway on-ramp bottleneck as follows (
4
,
5
):
92% freeway pipeline capacity increase under 100% CACC market penetration; 50%–67% freeway on-ramp bottleneck capacity increase under 100% CACC market penetration; and 12%–16% reduction in average vehicle energy consumption under 100% CACC market penetration.
The above findings were identified at an isolated freeway segment where the mainline traffic stream was only affected by the merging flow from a single on-ramp. However, the impact of CACC on real-world freeway corridors may be substantially different because the spatiotemporal congestion pattern of a corridor can often be attributed to the interplay among multiple bottlenecks of the corridor. It is likely that CACC improves the output flow of a minor bottleneck while a downstream major bottleneck cannot accommodate the resulting extra input demand. As a result, the traffic congestion of the major bottleneck is further intensified, making the congestion region grow backward and eventually clog the output flow of the minor bottleneck. Because CACC potentially has both positive and negative effects on the freeway corridor performance, it is necessary to examine such impacts to identify the best implementation strategies.
To address the above challenge, this study performed a comprehensive CACC case study on a 13-mi SR-99 freeway corridor to the south of Sacramento, California. The impacts of the CACC string operation on average speed and average vehicle energy consumption were quantified using a state-of-the-art microsocpic traffic flow model ( 4 ). The research also investigated the benefits of CACC management strategies that aimed to increase the CACC string numbers in the traffic stream. With those analyses, this research aimed to identify factors of the corridor-level traffic flow that affect the CACC string operation. The findings can suggest future studies that assess advanced traffic management strategies and develop new CACC controllers for enhancing the effectiveness of CACC in complicated mixed traffic flows. This research finding is essential for implementing CACC in the highway system for overall system performance improvement, without requiring costly investment in infrastructure upgrades.
Literature Review
The development and evaluation of CAV have been gaining momentum in recent years. There are many representative studies that have aimed to explore the impacts of CAV systems on freeway traffic. Some of them aimed to explore the relationship between the CAV characteristics and freeway capacity analytically. For example, in Amir et al. ( 6 ), the researchers presented an analytical model that described the capacity of a single lane freeway as a function of the CAV market penetration rate, platoon intensity, and headway distributions. The study found that the freeway capacity increased with the CAV market penetration rate and platoon intensity only when the headway between a CAV and a manually driven vehicle was smaller than the average of headways between two CAVs and two manually driven vehicles. This finding gave a useful guideline for designing the car following strategies for CAVs. A similar study is found in Chen et al. ( 7 ) where the capacity of a freeway segment was depicted as a function of CAV market penetration rate, platoon size, inter-/intra-platoon spacing, and different lane policies. The model was further used to determine the optimal lane policy to maximize the roadway capacity by exploiting the CAV platooning capability. Talebpour and Mahmassani ( 8 ) developed a simulation framework that could depict the interactions of manually driven vehicles, connected manually driven vehicles, and automated vehicles. Their stability analyses indicated that both connected vehicles and automated vehicles could maintain a string stable flow only when the speed was very low (e.g., less than 5 m/s). In case studies with a one-lane freeway, the automated vehicles were found to outperform the connected vehicles in relation to increasing the stability region and freeway capacity.
Other studies exploited the benefits of specific CAV applications. Rios-Torres and Malikopoulos ( 9 ) proposed a centralized controller to coordinate the merging of traffic. This controller minimized the level of acceleration of vehicles in both the freeway mainline and the on-ramps by allowing them to enter the merging area without conflict. In their simulation studies, the algorithm could decrease the travel time by 7.1%–13.5%, and the total fuel consumption by 48.1%–52.7%. Xie et al. ( 10 ) reported a similar centralized automated merging system that coordinated the merging behaviors of fully connected automated systems. The algorithm aimed to maximize the speed of all vehicles in the control region. The simulation studies identified that the proposed system was able to maintain high travel speed for all vehicles with the increase of on-ramp demand. It also brought throughput benefit to the on-ramp bottlenecks. Letter and Elefteriadou ( 11 ) developed a centralized merging algorithm that aims to maximize the overall speed of fully connected and automated vehicles. They identified 7%–36% reduction in travel time and 4%–53% increase in speed because of the proposed algorithm. The algorithm was found to have the largest benefit under 1 s minimum gap and traffic demand level of 2,200 vehicles per hour.
The impact of CACC on traffic flow performance has also been investigated. In an early study, van Arem et al. ( 12 ) identified the benefit of CACC for a lane-drop bottleneck in relation to increasing the average speed and reducing the shockwaves. The freeway capacity was found to be slightly increased. In Shladover et al. ( 13 ), the capacity impact of CACC was tested in a simulated single lane freeway. A quadratic increase trend of capacity was identified with the CACC market penetration. A 97% increase in capacity was found when the CACC market penetration increased from 0% to 100%. Liu et al. ( 14 ) analyzed the multilane freeway merge capacity using a CACC model developed based on empirical CACC test datasets. The study quantified the freeway capacity under various CACC market penetration rates and traffic demand levels. The results indicated that the CACC string operation could bring about quadratic capacity increase regardless of the level of on-ramp traffic input.
While most of the existing CACC studies were conducted for isolated freeway bottlenecks, the current study extends the impact analysis of CACC to a complex freeway corridor. The traffic and vehicle energy consumption influence of CACC string operations were identified under various CACC market penetration rates, CACC string operation strategies, and corridor traffic demand levels. The methodology and findings of the study are presented as follows. The next section gives a brief description of the simulation model that depicts the behaviors of CACC vehicles and manually driven vehicles. The following section describes the study network and existing traffic management strategies. The next section presents the impacts of the CACC string operation on freeway corridor speed and energy consumption under various traffic demand inputs, CACC market penetration rates, and CACC management strategies. The final section provides concluding remarks about the research.
Simulating Manually Driven and CACC Vehicles
A state-of-the-art simulation modeling framework was used in the study to depict the longitudinal and lateral interactions between manually driven vehicles and CACC vehicles. The modeling framework was developed based on the NGSIM oversaturated flow human driver model reported in Yeo et al. ( 15 ) and the ACC/CACC car following model developed based on the ACC/CACC field test data. (16,17) The human driver model was calibrated using field data collected in the study freeway corridor ( 18 ) and its modeling capability was cross-validated with the MOTUS microsimulation model ( 19 ). The ACC/CACC model has been tested against the trajectory data obtained from a real-world CACC string ( 17 ). The lane changing behaviors of CACC vehicles and the algorithms for implementing the VAD and ML strategies were described in Liu et al. ( 4 ). The simulation framework was implemented in Aimsun via its microSDK interface. The researchers applied the Aimsun framework to code the study freeway corridor and visualize the simulation experiments. The built-in demand generation functions were adopted to provide various traffic demand inputs for the freeway network. The Aimsun database interface recorded the simulation results.
Human driver models were used to depict the car following and lane changing behaviors of passenger cars and heavy-duty trucks. For passenger cars, the models were applied for manually driven vehicles and ACC/CACC vehicles when they were not operating under the ACC/CACC mode. In this study, we did not consider truck platooning scenarios. All trucks were assumed to be manually driven. The scenarios concerning passenger car strings combined with truck strings will be tackled in future research.
This study adopted the models developed in Milanes and Shladover ( 17 ) to depict the ACC and CACC car following behaviors. CACC vehicles exhibit significantly different car following behavior from manual drivers and can form strings that allow them to follow the preceding vehicles with short gaps. Drivers of CACC equipped vehicles can also exit their closely coupled string and switch off CACC to make lane changes or exit the freeway. Although CACC system implementation relies on information received from the leading vehicle in the CACC string as well as from the immediately preceding vehicle, the empirical models used in the simulation provide a simplified description of the closed loop, vehicle following dynamics that are achieved relative to the immediately preceding vehicle. The simplified approach is suitable for modeling many CACC vehicles.
In addition to the scenarios where CACC vehicles were randomly distributed in the traffic stream, this research considered two traffic management strategies that aimed to increase the CACC market penetration locally. The two strategies are defined as follows:
Implementation of VAD on manually driven vehicles: The VAD vehicles have a wireless communication capability enabling them to broadcast real-time information in relation to their operation status and route choice. Although they do not have an automated controller to perform the car following task, they can serve as the leaders of CACC vehicle strings. With this strategy, the probability for CACC vehicles to be able to travel in the CACC mode greatly increases. It thus offers incentives for users to equip with CACC, even when the CACC market penetration is low. CACC Managed Lane strategy: The managed lane (ML) strategy has been widely used to serve high-occupancy vehicles or drivers willing to pay a toll, with the purpose of improving the overall efficiency of the highway system. The CACC ML strategy adopts a similar operational concept that only allows CACC vehicles and VAD vehicles to enter the managed lane. It physically separates the CAV traffic stream and the regular traffic. As the CACC and VAD vehicles concentrate in the managed lane, they will have a higher probability of traveling in CACC strings. The managed lane also reduces the interaction between the CACC vehicles and manually driven vehicles, so the CACC strings are less likely to be interrupted in the managed lane.
The human driver models discussed above are directly used to depict the behavior of VAD vehicles. In this case, the car following and lane changing behaviors of VAD vehicle drivers are the same as for the drivers of conventional vehicles, even when the VAD vehicle is leading a CACC vehicle string. To capture the connectivity of VAD vehicles, this study implemented a communication module that allows CACC vehicles within 1,000 ft of a host VAD to receive its real-time speed, location, and acceleration information. A perfect communication environment was assumed that enables CACC vehicles to receive the VAD information without communication delay or packet loss when the CACC vehicle is in communication range.
The ML strategy is achieved by using the anticipatory lane changing model developed by the authors in a previous study ( 4 ). When the ML strategy is active, CACC vehicles entering from an on-ramp will be motivated to change lanes toward the managed lane if the average speed of the managed lane is higher than the speed of the general purpose lane. The motivated CACC drivers will follow the anticipatory lane changing behavior—they will actively search for downstream gaps for making lane changes. In the meantime, they will accept smaller car following gaps and higher desired speed to increase the probability of identifying an acceptable gap. If a CACC vehicle is making an anticipatory lane change, it will use the manual driving mode. The vehicle is therefore temporarily unable to perform CACC string operation. While the managed lane attracts CACC vehicles, it does not allow manually driven vehicles to merge into it. This creates a dedicated lane for CACC and VAD vehicles only.
Study Freeway Corridor
The SR-99 corridor to the south of Sacramento, California, has been selected as the study corridor. The 13-mi (20 km) corridor starts at the on-ramp of Elk Grove and extends to the off-ramp toward SR-50. It contains 16 on-ramps and 12 off-ramps, as shown in Figure 1. The study segment contains three lanes with one high-occupancy vehicle lane and two general purpose lanes in each direction upstream of the Calvine Road interchange, while an additional general purpose lane is added downstream of that interchange. The on-ramp merging and weaving sections located downstream of the Elk Grove Blvd. interchange, as well as the off-ramp at the US-50 freeway interchange, contribute to the recurrent traffic congestion observed during the morning peak in this corridor. This peak period typically begins at 6:30 a.m. and ends around 9:00 a.m., and the morning congestion pattern is the result of the high demand for suburb-to-downtown trips during the morning hours. The free flow speed is 65 mph for the freeway and 45 mph for the ramps.
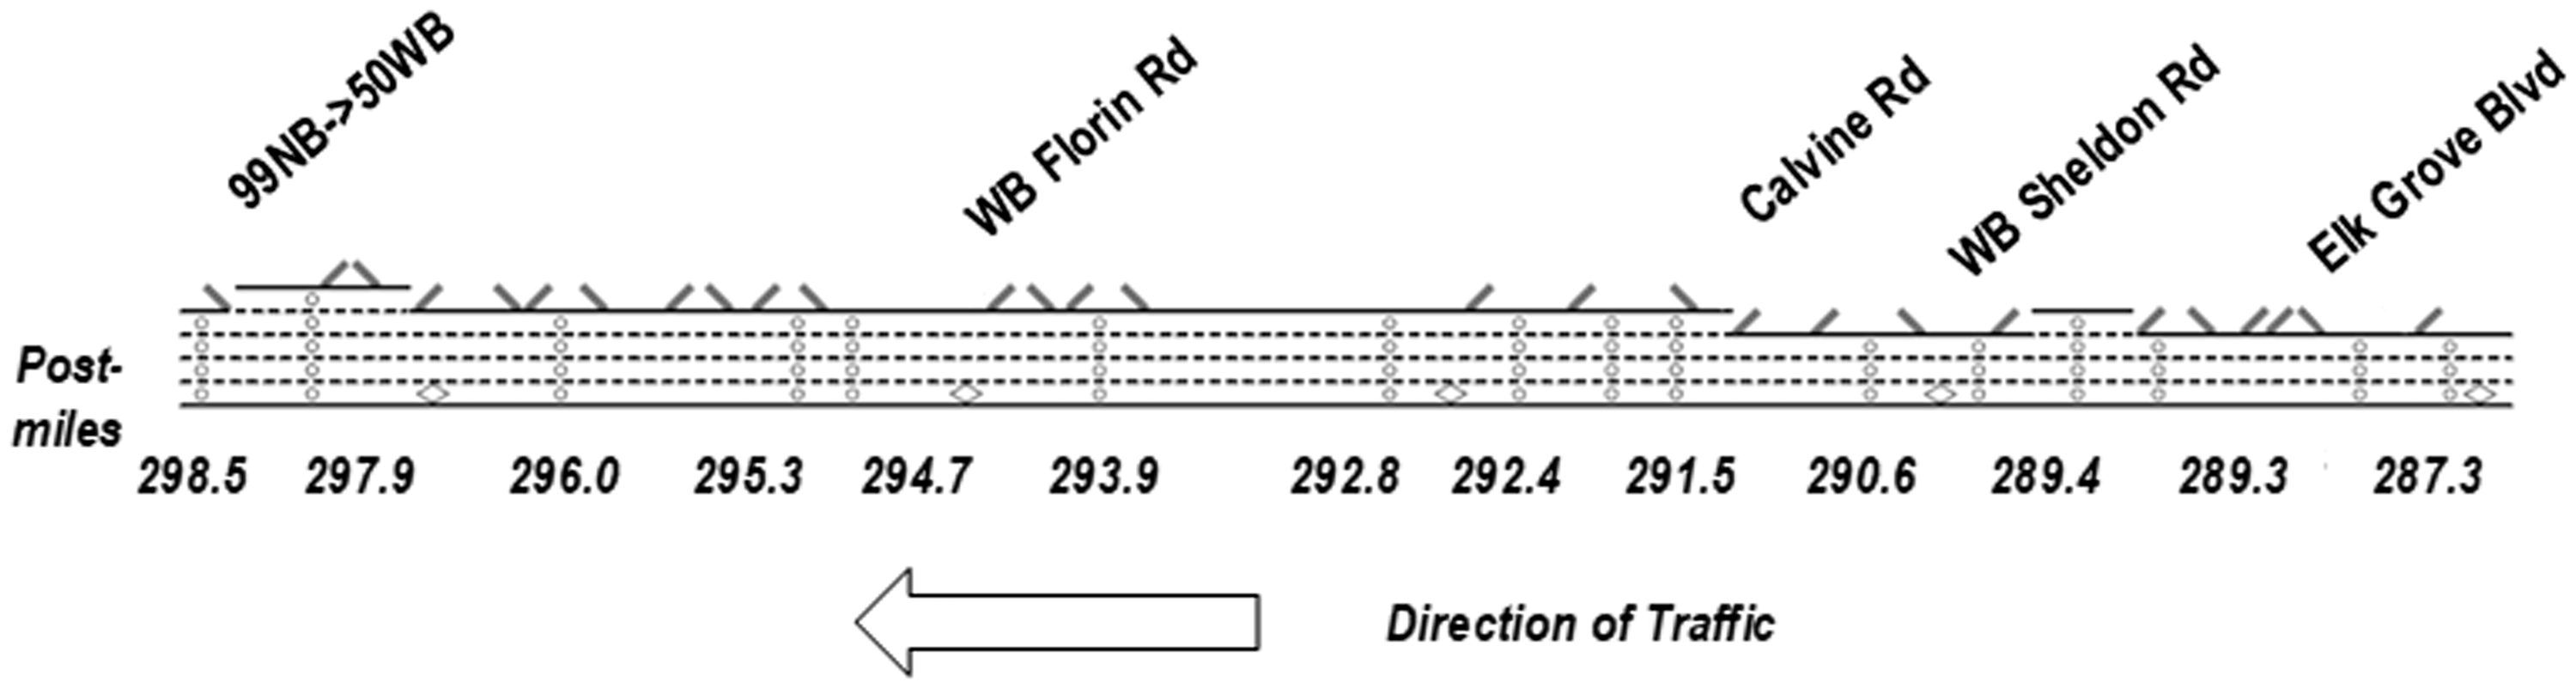
The study site on the SR-99 freeway south of downtown Sacramento, CA.
The on-ramps of the study corridor are metered using a local responsive ramp metering (LRRM) and a coordinated ramp metering (CRM) algorithm to control the flow of on-ramp traffic and mitigate the peak hour congestion ( 18 ). The LRRM is used for the five upstream on-ramps of the SR-99 corridor (some interchanges may have several on-ramps). An optimized CRM algorithm has been implemented for the 11 downstream ramp meters. The CRM algorithm is essentially different from LRRM in that LRRM determines the ramp meter rate for an on-ramp based only on the local mainline occupancy/flow of its immediate upstream detector, while CRM determines the meter rate by looking at the mainline occupancy/flow of the whole corridor and the demands of all on-ramps. The CRM algorithm implemented in this corridor was developed based on an optimal control approach. The objective function was the difference between total vehicle hours traveled (VHT) and total vehicle miles traveled (VMT); VHT–αVMT, where α is a positive number that converts the unit of VMT into VHT. The VHT term allows the CRM to minimize the overall freeway mainline travel time. If there is only the VHT term, however, the CRM will simply execute the lowest metering rate, leading to excessive delay for the on-ramp traffic. To address this problem, the objective function also includes the negative VMT term. In this case, the system will maximize the VMT by encouraging as many on-ramp vehicles to enter the freeway as possible. Intuitively, the implemented algorithm intends to control the SR-99 corridor as a long discharging section in the sense that the downstream should not be more congested than the upstream traffic on average. This is the best way to dump the overall traffic in the fastest manner.
Impacts of the CACC String Operation
This study examined traffic performance and vehicle fuel consumption on the SR-99 corridor under three cases. Case 1 explored the effects of CACC under various CACC market penetrations. The traffic demand input of the case was the real-world traffic volume observed in a typical morning peak at the study site. Case 2 examined the effects of the VAD and ML strategy on the corridor performance. In this case study, the average speed and vehicle fuel consumption with and without the ML and VAD strategies were compared. It was assumed that all manually driven vehicles were equipped with VAD when the VAD strategy was active. The final case identified the CACC impacts when the traffic demand input increased. The demand input increase ranged from 5% to 40%, in 5% increments.
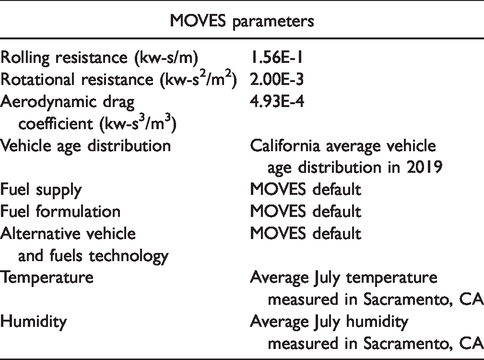
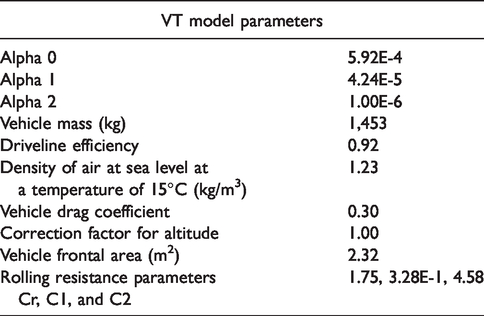
The fuel consumption results were computed using two models: the Virginia Tech (VT) comprehensive power-based fuel consumption model ( 19 ) and the motor vehicle emission simulator (MOVES) model ( 20 ). Results from the two models could provide a comprehensive picture of the effectiveness of the CV speed adaptation. The parameters used in the two fuel models are listed in Tables 1 and 2.
Fuel Consumption Model Parameters of Motor Vehicle Emission Simulator (MOVES)
Fuel Consumption Model Parameters of the Virginia Tech (VT) Model
Effects of CACC at Different Market Penetration Rates
The effects of CACC vehicle strings on average vehicle speed and average vehicle fuel economy are shown in Figure 2. The calculation counted vehicles on both the freeway mainline and on/off-ramp lanes. The speed curve shows that the average vehicle speed increases nearly linearly as CACC market penetration grows. At the 100% CACC level, the average speed is about 56 mph, which is 70% higher than the speed at the 0% CACC level. The average speed of 56 mph is close to free flow speed, which indicates that traffic congestion is nearly eliminated when all vehicles are equipped with CACC. As traffic congestion decreases with the increase of the CACC market penetration, the average vehicle energy fuel economy improves as well. When the CACC market penetration is 40% or higher, the vehicle fuel economy does not increase as rapidly as the cases with lower CACC market penetration rates.
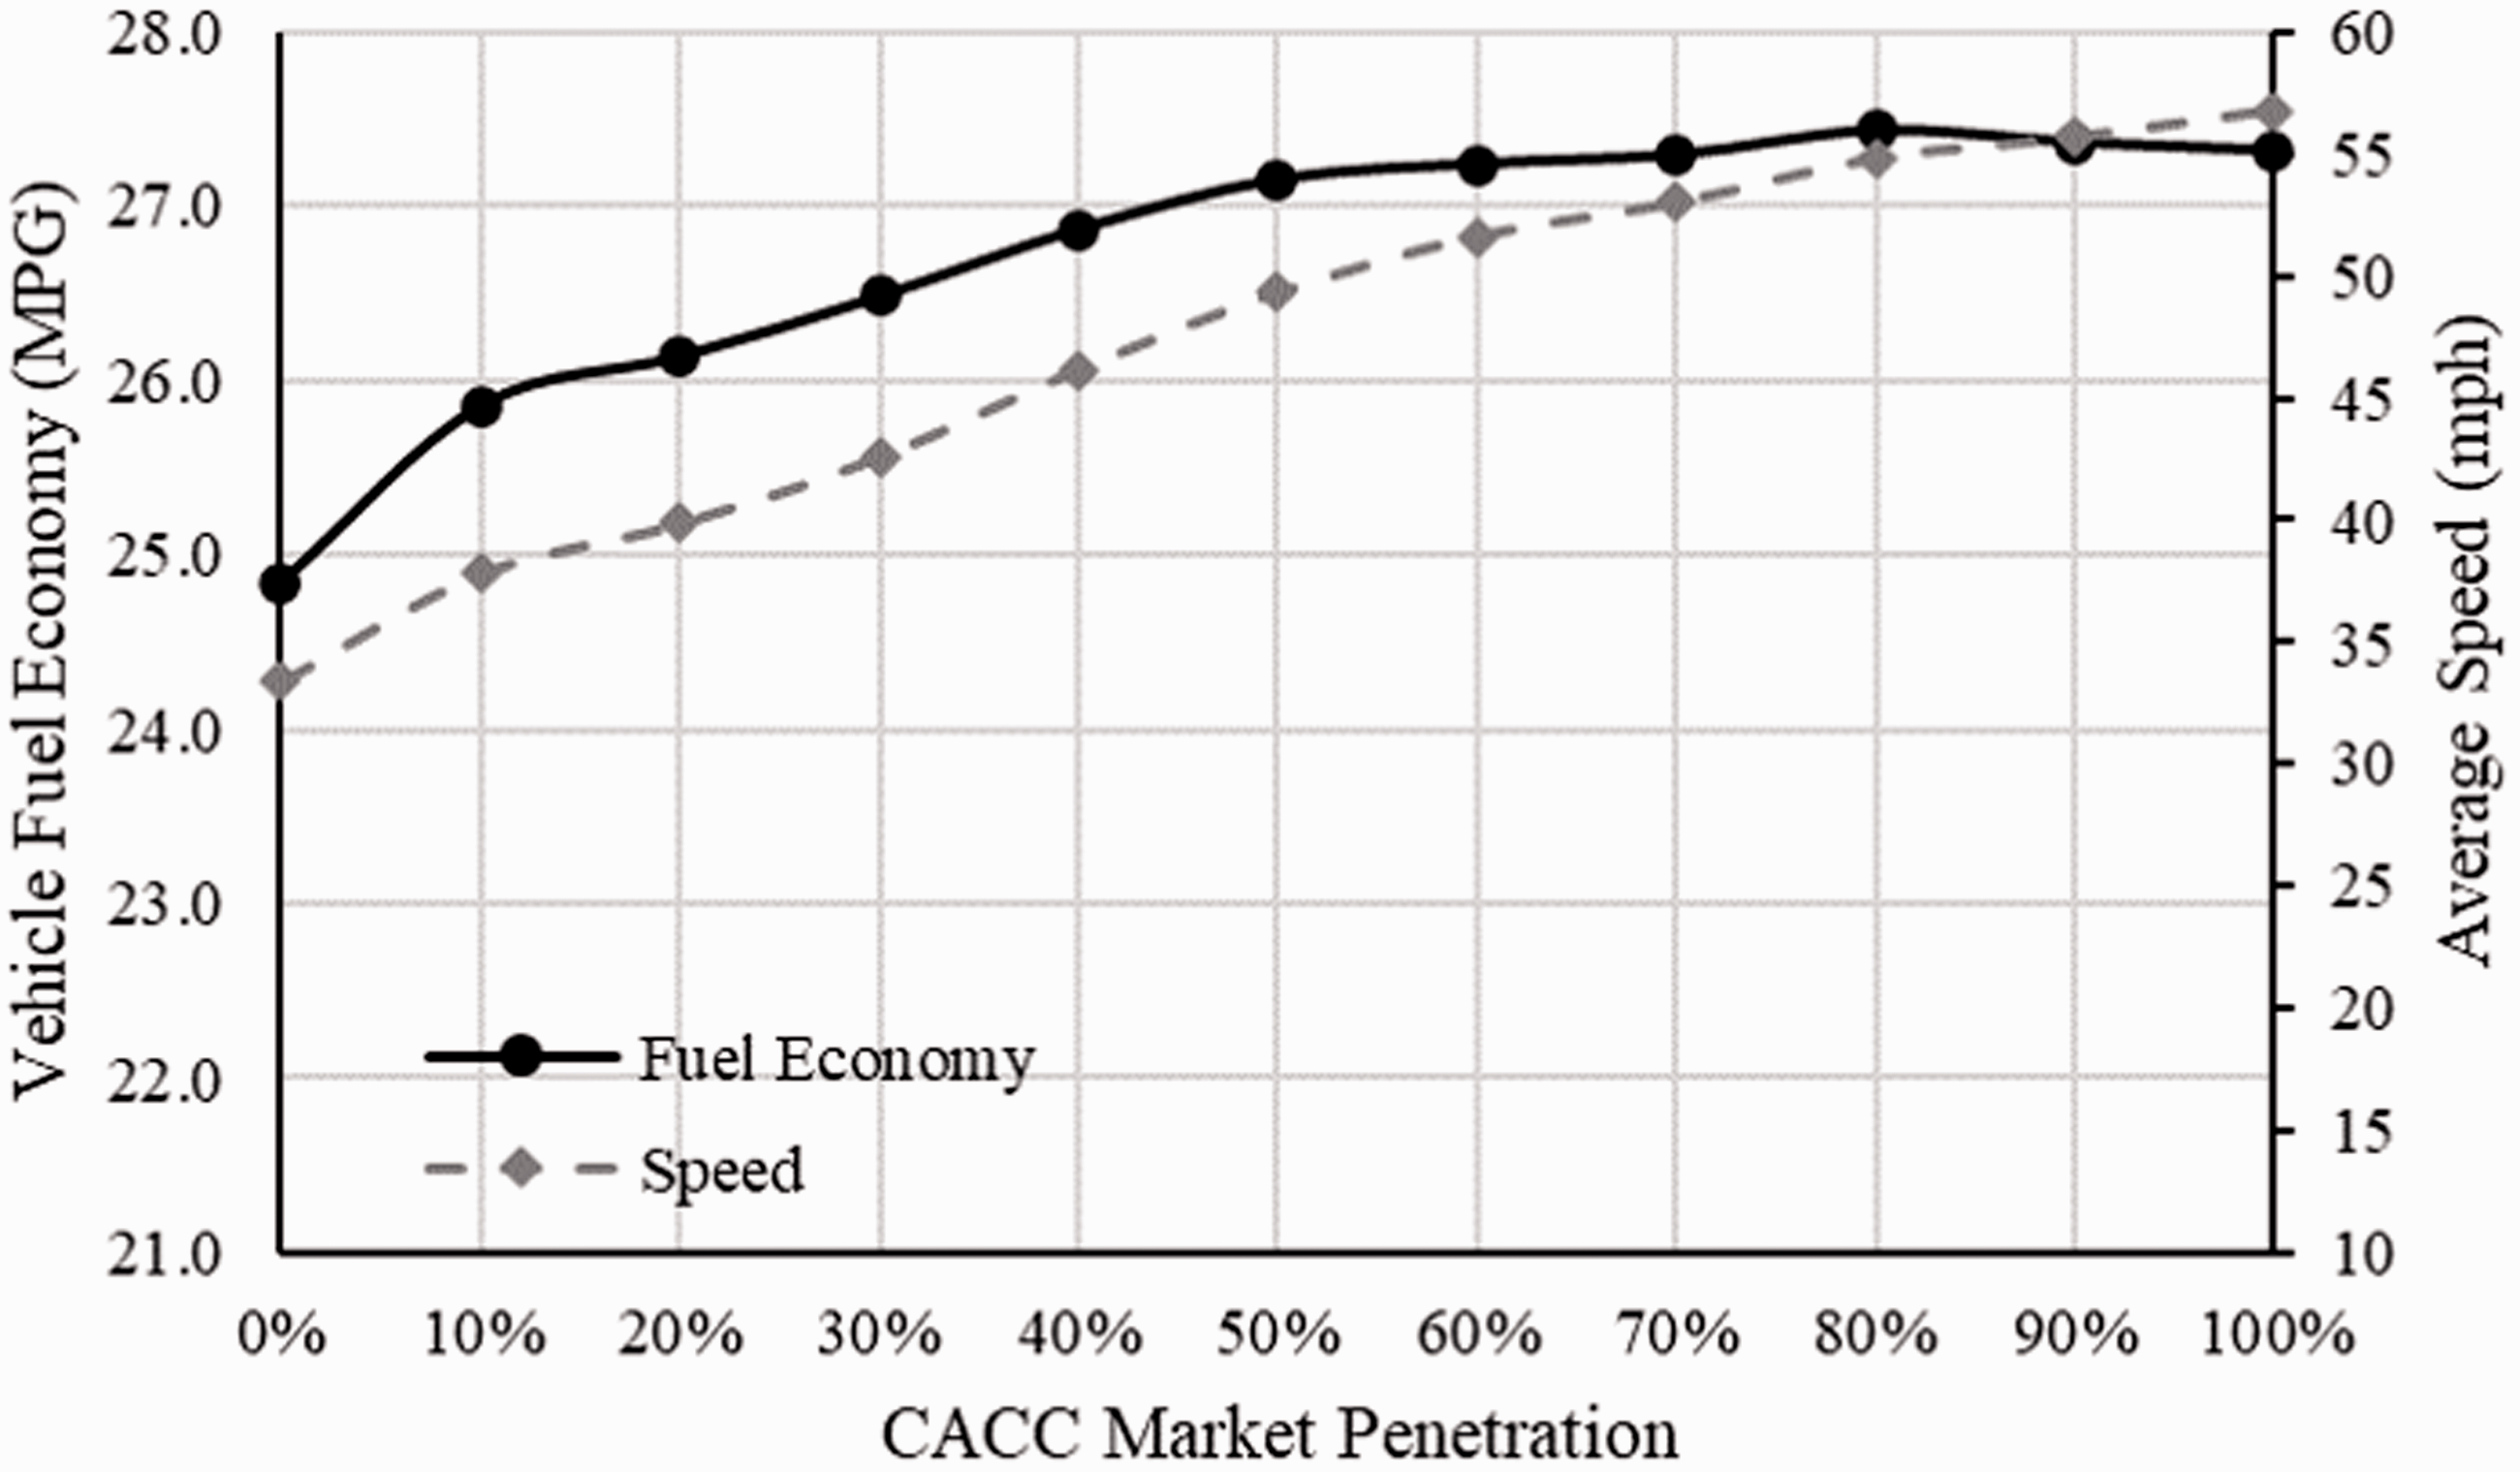
Average speed and fuel economy using motor vehicle emission simulator (MOVES) model under various cooperative adaptive cruise control market penetration rates.
To examine the energy efficiency further, this study also applied the VT model to estimate the average vehicle fuel economy. The resulting comparison between the VT model and the MOVES model is shown in Figures 3 and 4. Figure 3 shows the performance under non-peak traffic condition (i.e., 4:00–5:00 a.m.), and Figure 4 depicts the peak hour traffic condition (i.e., 6:30–8:30 a.m.). The percentages beside the VT curves represent the difference between the VT results and the MOVES results. The vehicle average speed and the standard deviation of the speed are also displayed in the two plots. The results show that the VT model and MOVES model give consistent estimations when the CACC market penetration is 30% or less. The VT model would provide a higher vehicle fuel efficiency than the MOVES model because the VT model adopts the engine parameters of a typical 2010 passenger car while the MOVES model uses parameters representing the average passenger car age of California. As the former applies more recent vehicle characteristics, it generates higher fuel economy estimates. When the CACC market penetration is 40% or larger, the results of the two fuel models become inconsistent. The increase of CACC market penetration leads to the increase of speed. At the same time, the standard deviation of speed remains at a relatively constant level. The analysis of the speed variations suggests that the VT model is more sensitive to speed variability at high speed ranges than the MOVES model. The VT model will give a high fuel consumption result if a vehicle goes through deceleration–acceleration cycles under high-speed status. Based on the existing modeling outputs, it is not certain that the VT model captured the true vehicle energy pattern or whether it was over-sensitive to the speed variability under high-speed conditions.
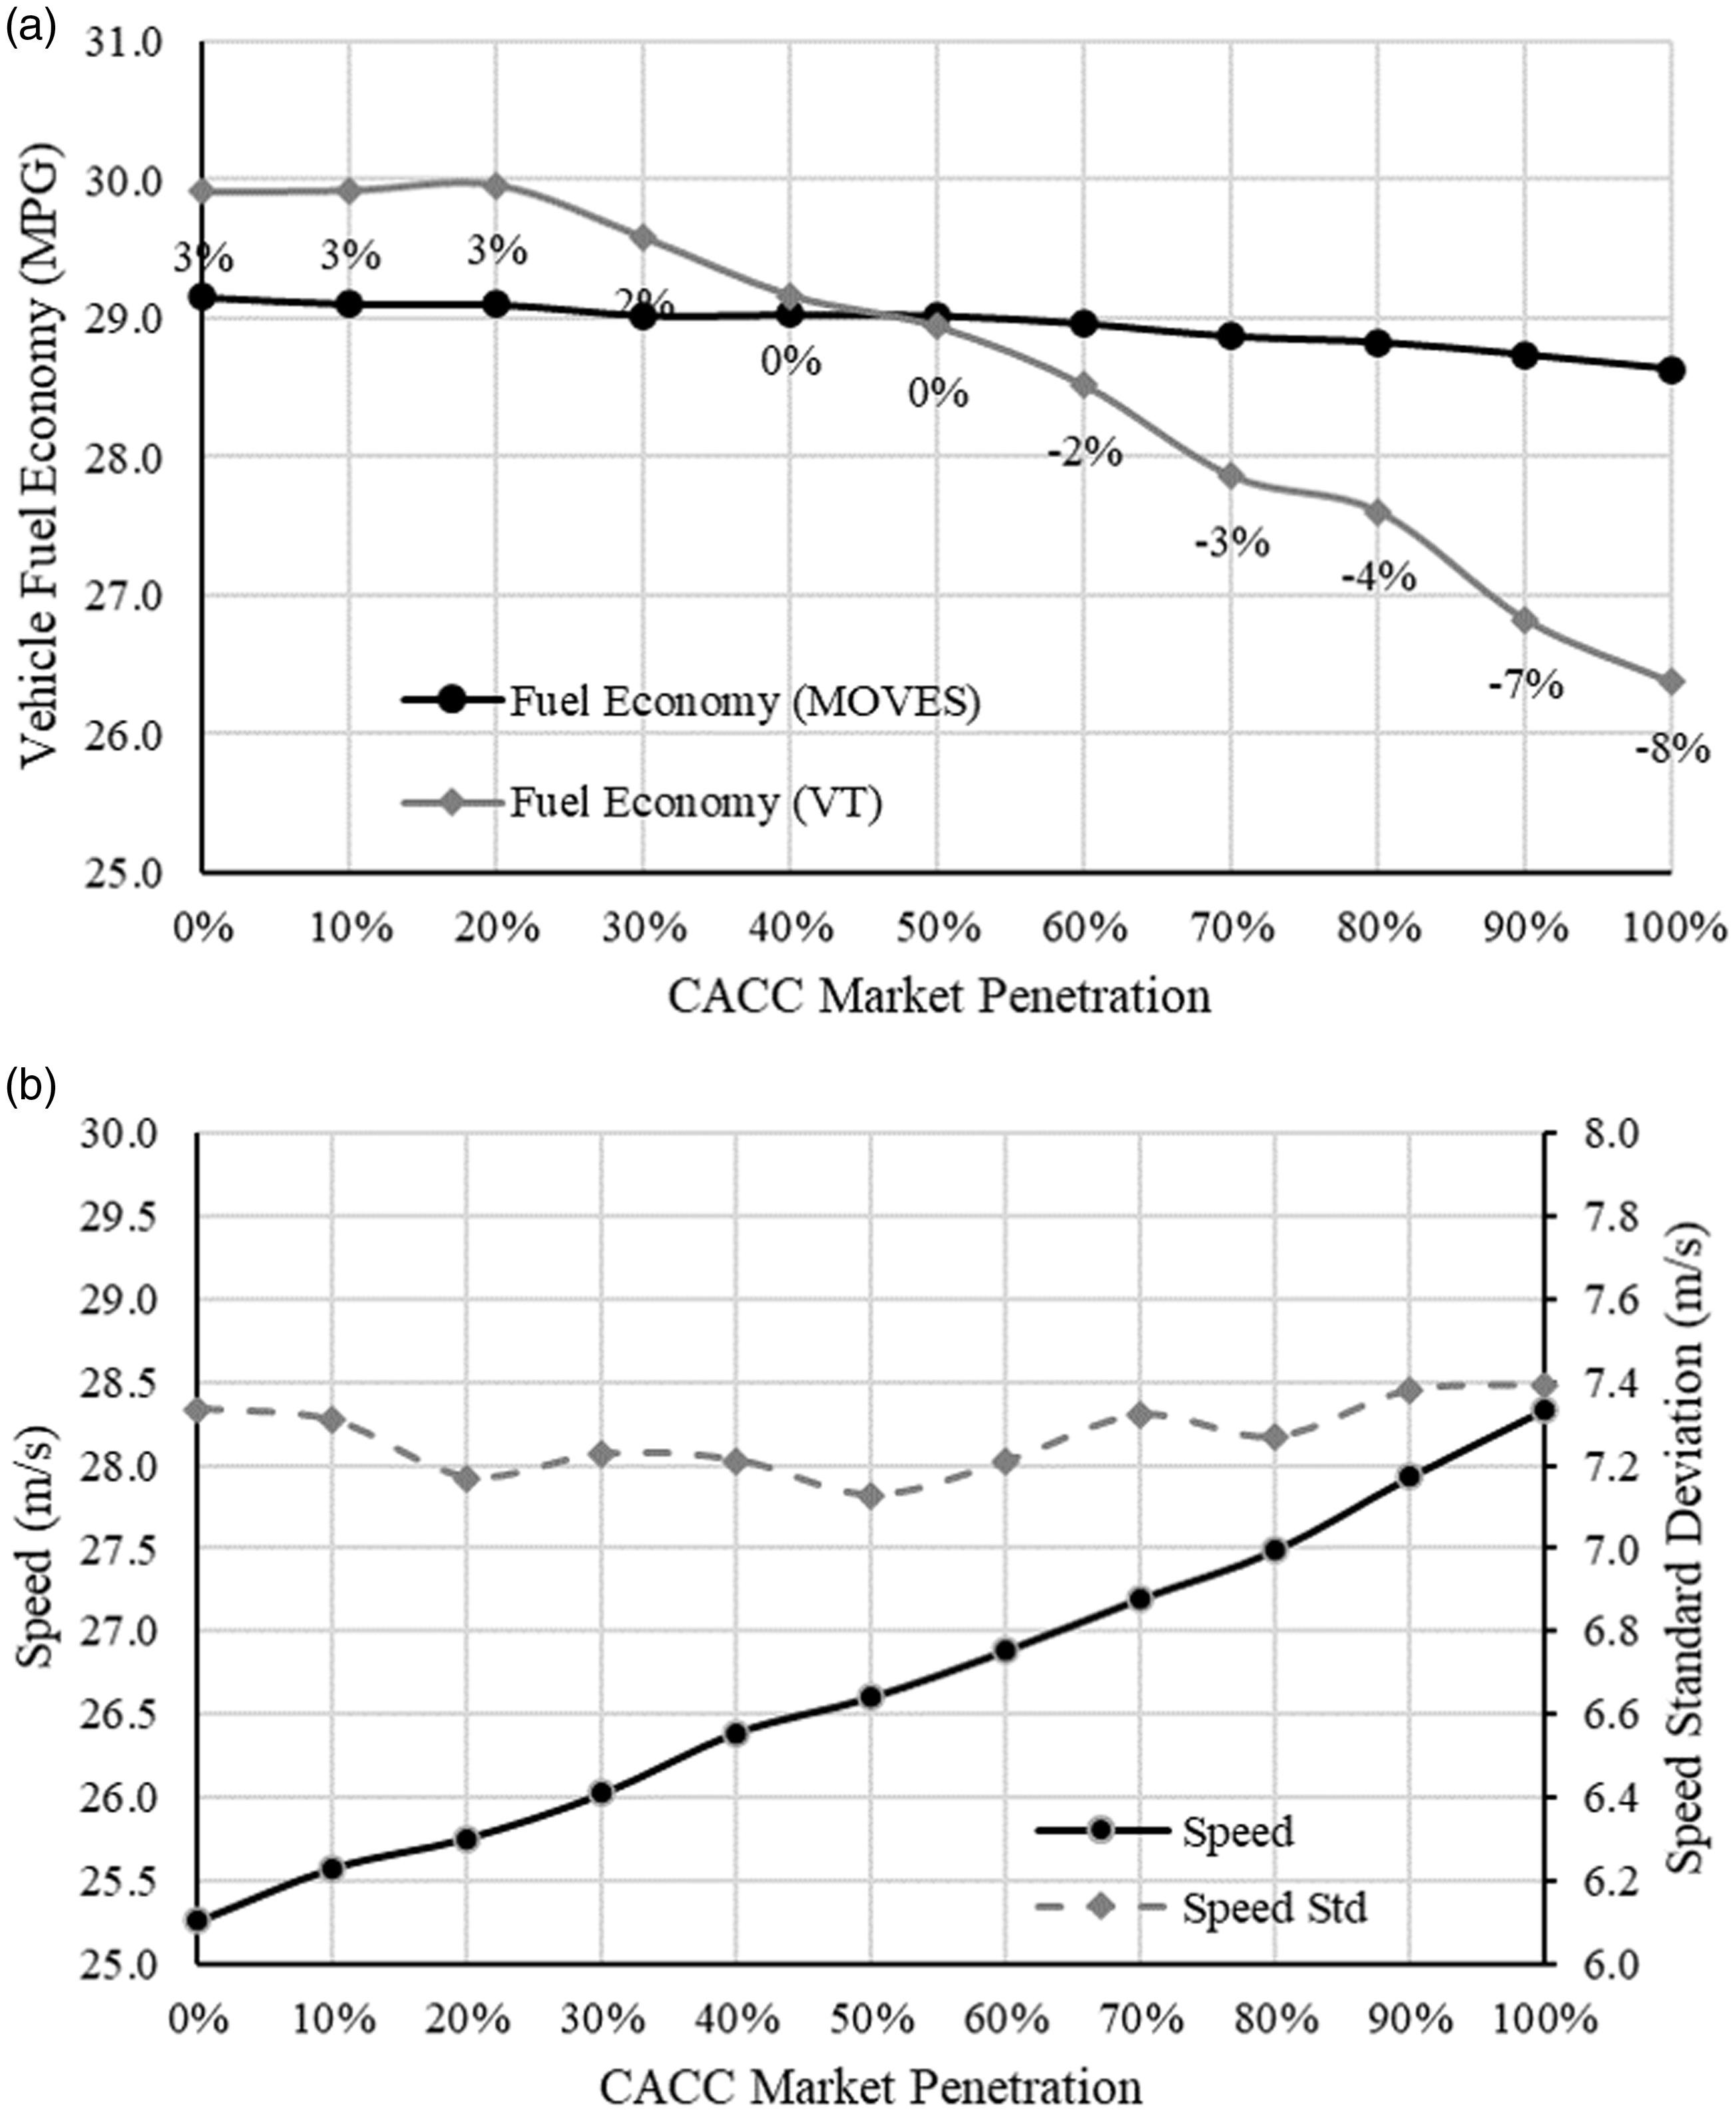
Comparison of the Virginia Tech (VT) and motor vehicle emission simulator (MOVES) models under free flow conditions: (a) fuel economy, (b) speed.
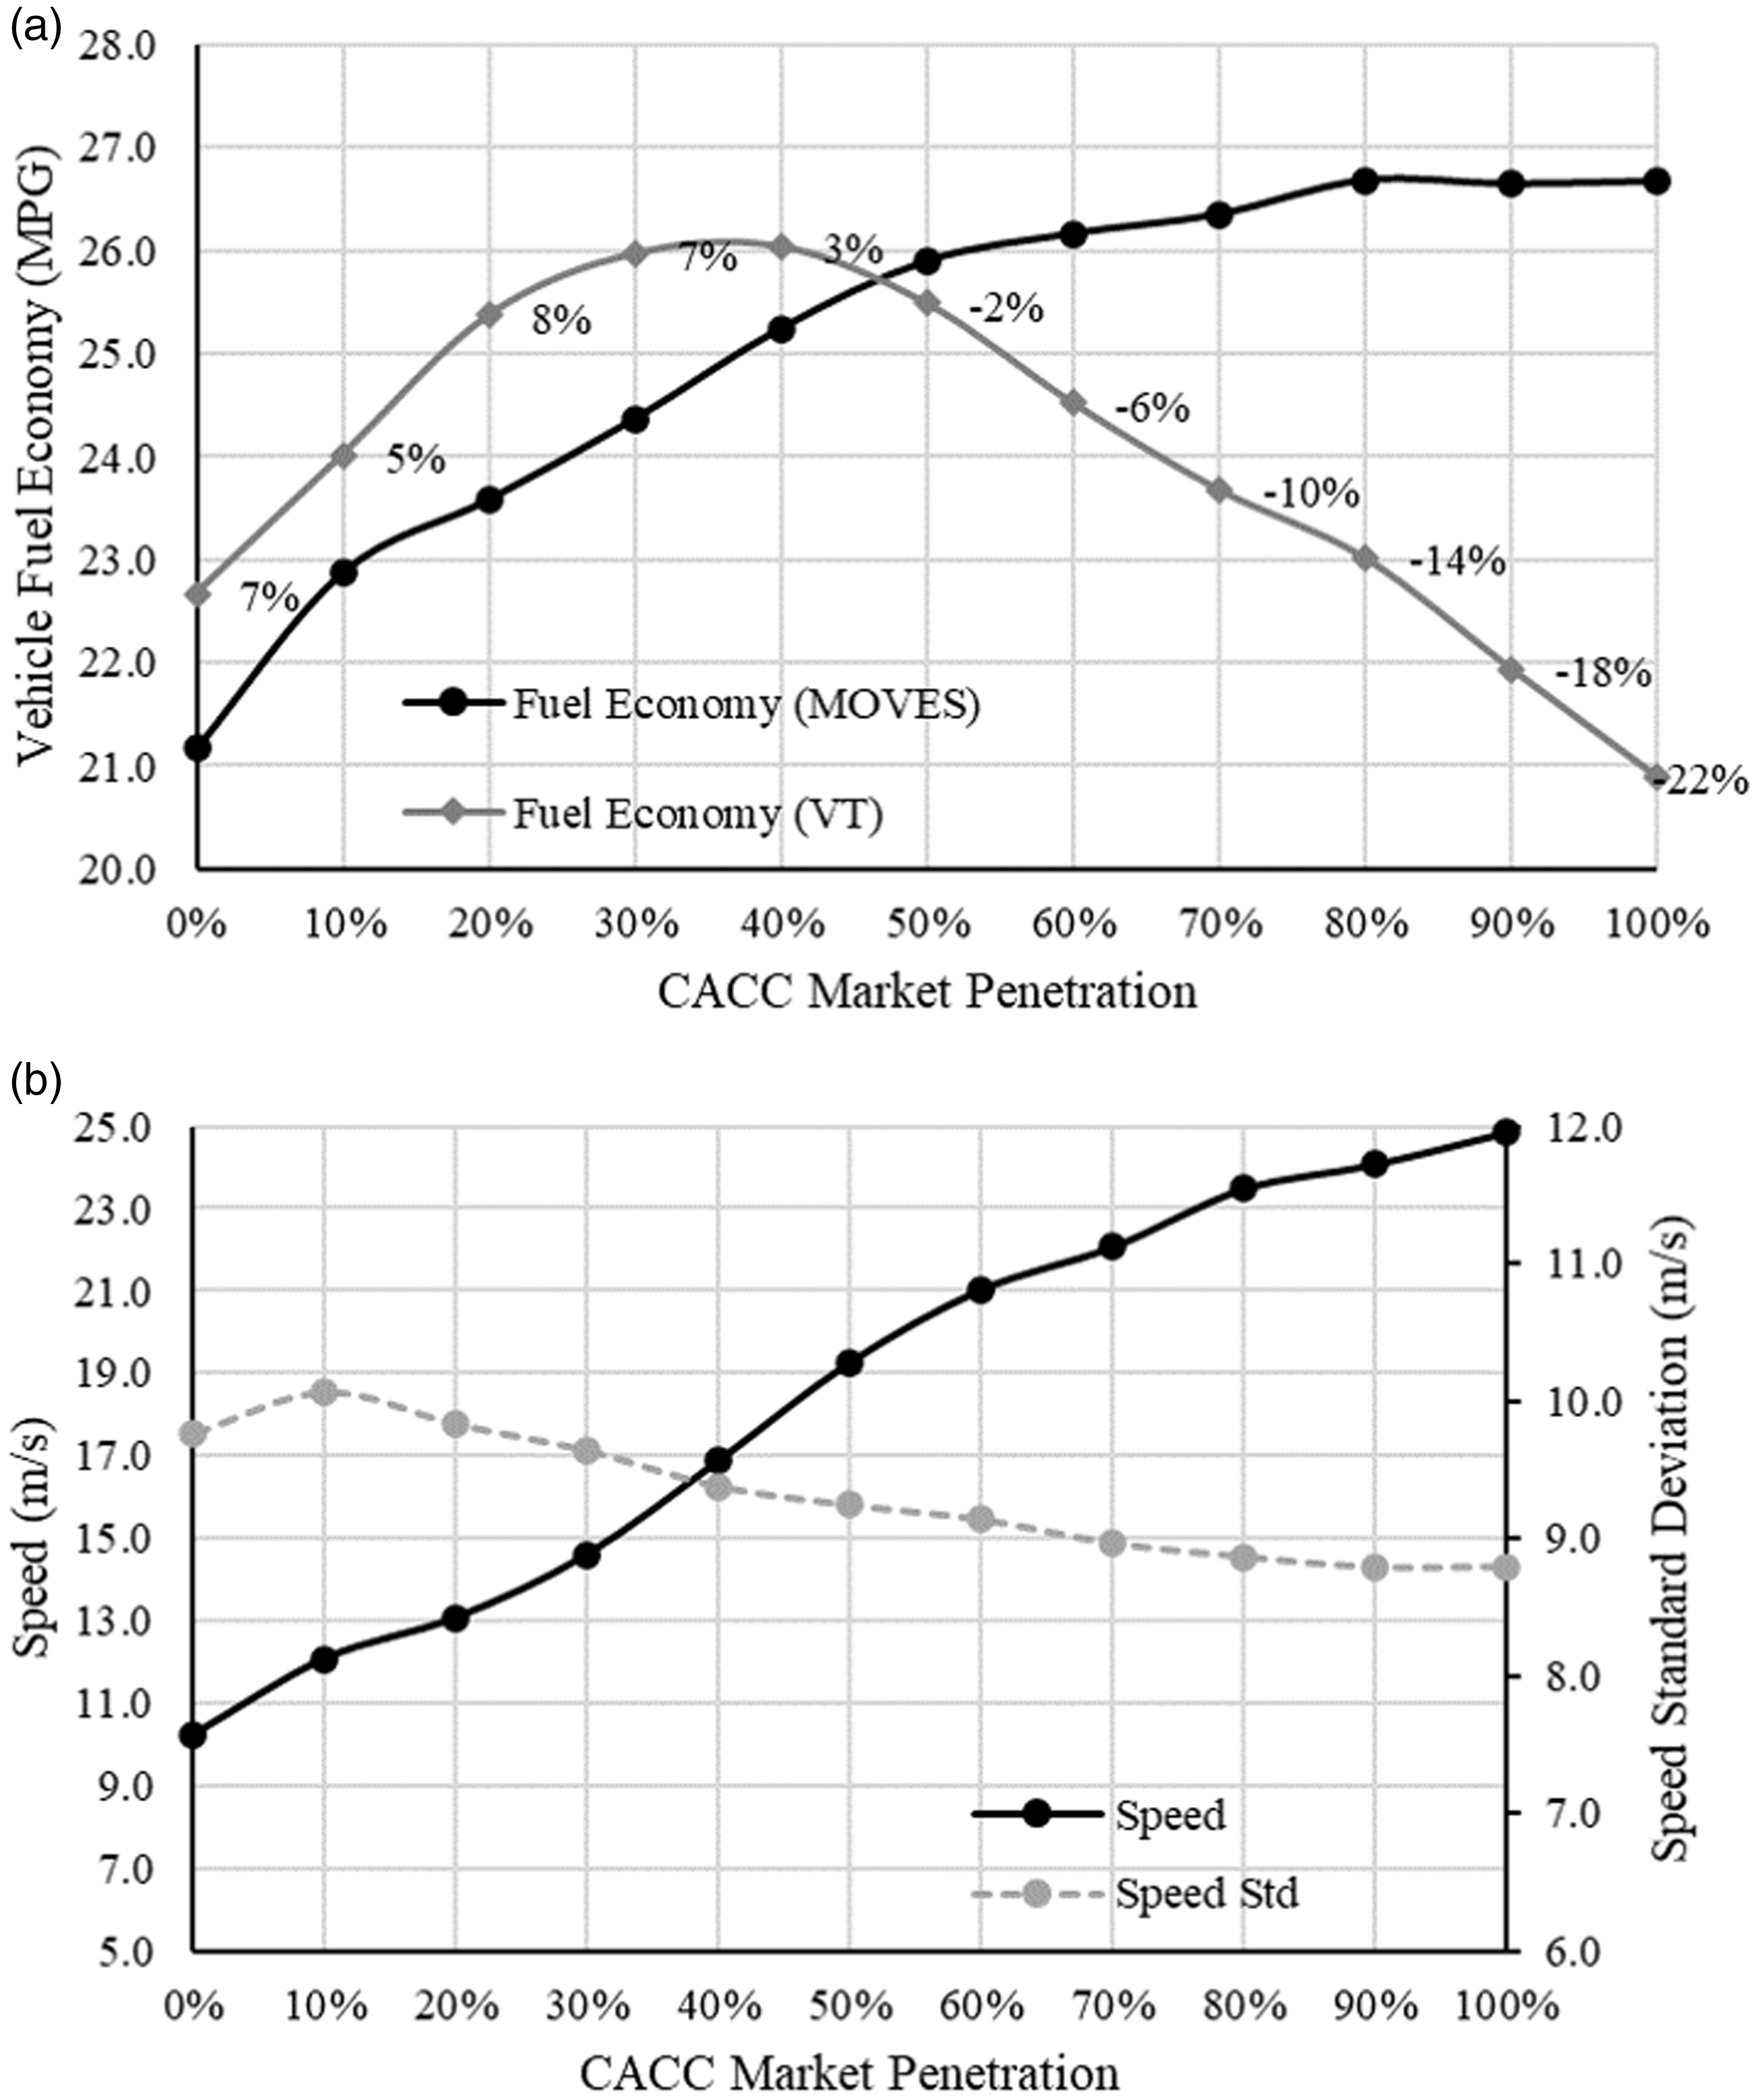
Comparison of the Virginia Tech (VT) and motor vehicle emission simulator (MOVES) models under congested conditions: (a) fuel economy, (b) speed.
Since the MOVES results seem to be more consistent with the implication of the traffic flow results, the MOVES results are adopted in the following analysis. Note that a vehicle’s energy consumption is closely associated with many factors including the powertrain, real-time engine speed and torque, and vehicle size and load. However, MOVES only offers a simplified energy consumption model that does not take into account the detailed vehicle engine operations. Unfortunately, the authors could not identify a more suitable model that would consider the detailed vehicle engine operation parameters and generate reasonable results for different vehicle types under various traffic conditions, while demanding a computation overhead acceptable for large-scale traffic simulation studies. More detailed investigation of such energy models is left to future studies.
When traffic flow changed from a congested state to an uncongested state (e.g., when the market penetration rate of CACC vehicles increased from 0% to 40%), vehicles had fewer acceleration–deceleration cycles because of the improvement of the traffic flow smoothness, leading to significant improvement of vehicle fuel economy. However, as traffic flow became faster when CACC market penetration reached beyond 40%, the vehicles started to travel at high speed ranges. The increase in speed resulted in a slight decrease in fuel economy. That is reason why the vehicle fuel economy curve becomes flatter under higher CACC market penetration cases.
This research also examined the string operation based on the results shown in Figure 5. The probability of a CACC vehicle operating in a CACC string was calculated by dividing the number of CACC vehicles in string by the total number of CACC vehicles in the freeway corridor. Both CACC string leader and follower are counted as vehicles operating in the CACC string. This calculation was performed at every simulation interval. The resulting probability was then averaged over the simulation period to obtain the data points in Figure 5. The figure shows that the probability increases with CACC market penetration. This was expected because CACC vehicles had more opportunity to form strings as market penetration rates rose. However, the probability curve became flatter as the CACC market penetration increased. Even when all vehicles were CACC capable, the probability was about 80%, indicating that the remaining 20% of CACC capable vehicles could not travel in strings. This was because those isolated vehicles were so far from the downstream or upstream strings that they could not send to or receive real-time information from the strings. It was also possible that CACC vehicle strings were nearby but traveling in different lanes. The CACC drivers were not sufficiently motivated to make lane changes to join the strings. In both cases, a local or regional CACC string-forming algorithm that provides those isolated vehicle drivers with string formulation guidance could be useful. The string-forming information can help the isolated vehicle drivers plan their trajectories and eventually join the string.
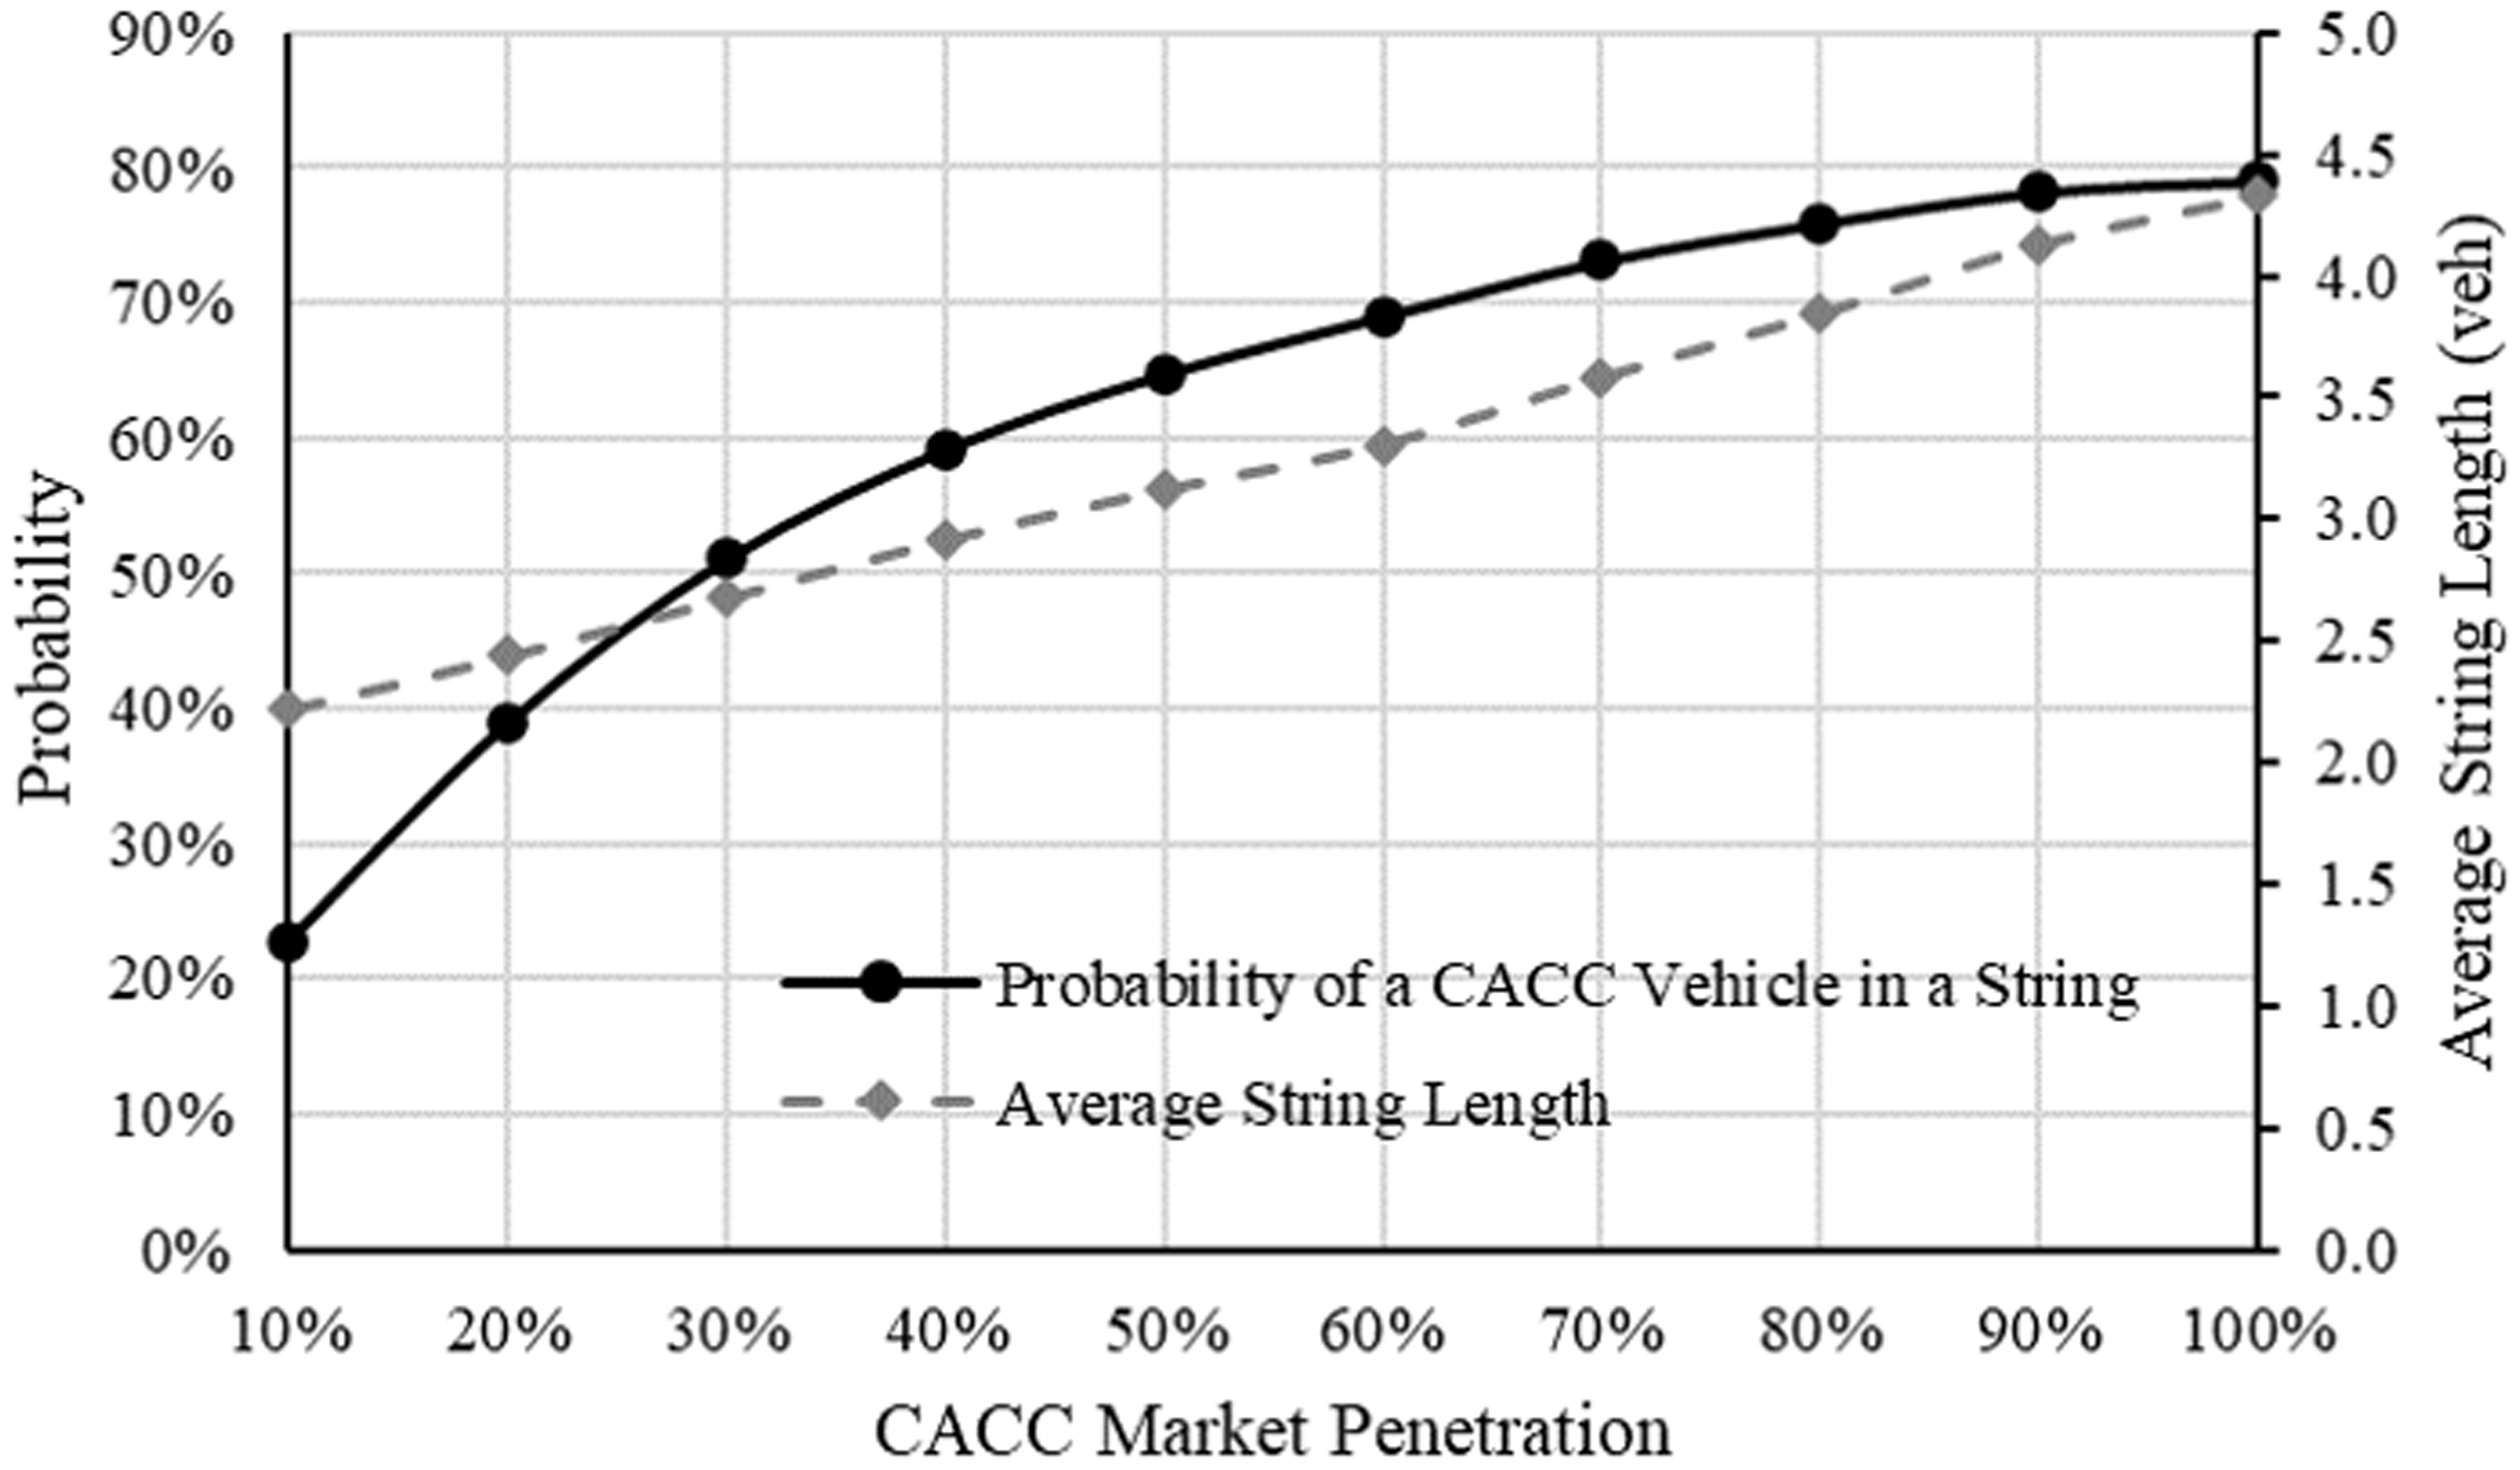
Probability of a cooperative adaptive cruise control (CACC) vehicle being in a string and average string length under various CACC market penetration rates.
The shape of the average string length is different from the shape of the string probability curve. The string length increases linearly with CACC market penetration. In the simulation, the maximum string length was 15 vehicles. However, the average string length was substantially smaller than the maximum string length even when all vehicles were CACC capable. In mixed traffic, where manually driven vehicles could cut into or cut out from the strings, it was difficult for strings to reach the maximum length limit. In addition, the CACC vehicles had different desired speeds. The CACC string followers would not be able to catch up with the string leader if it had a higher desired speed. This led to splitting of strings, thus reducing the average string length.
Effects of VAD and CACC ML Strategies
The effects of VAD on speed and vehicle fuel economy are shown in Figures 6 and 7. The application of VAD had significant effects on average vehicle speed when CACC market penetration was 40% or lower. In those scenarios, CACC vehicles had difficulty finding string leaders because they were randomly distributed in the traffic stream. After VAD was deployed, the VAD vehicles could serve as the string leaders, enabling isolated CACC vehicles to enter and operate in the string. The increase of CACC strings helped stabilize the traffic flow and increase overall speed. When CACC market penetration was greater than 40%, it became easier for CACC vehicles to identify CACC vehicle leaders (i.e., the string probability was 70% or more, see Figure 5). In this case, the connectivity capability of VAD vehicles was less needed, and the influence of VAD strategy on speed therefore decreased. On the other hand, the VAD strategy had a minor negative influence on the vehicle fuel consumption.
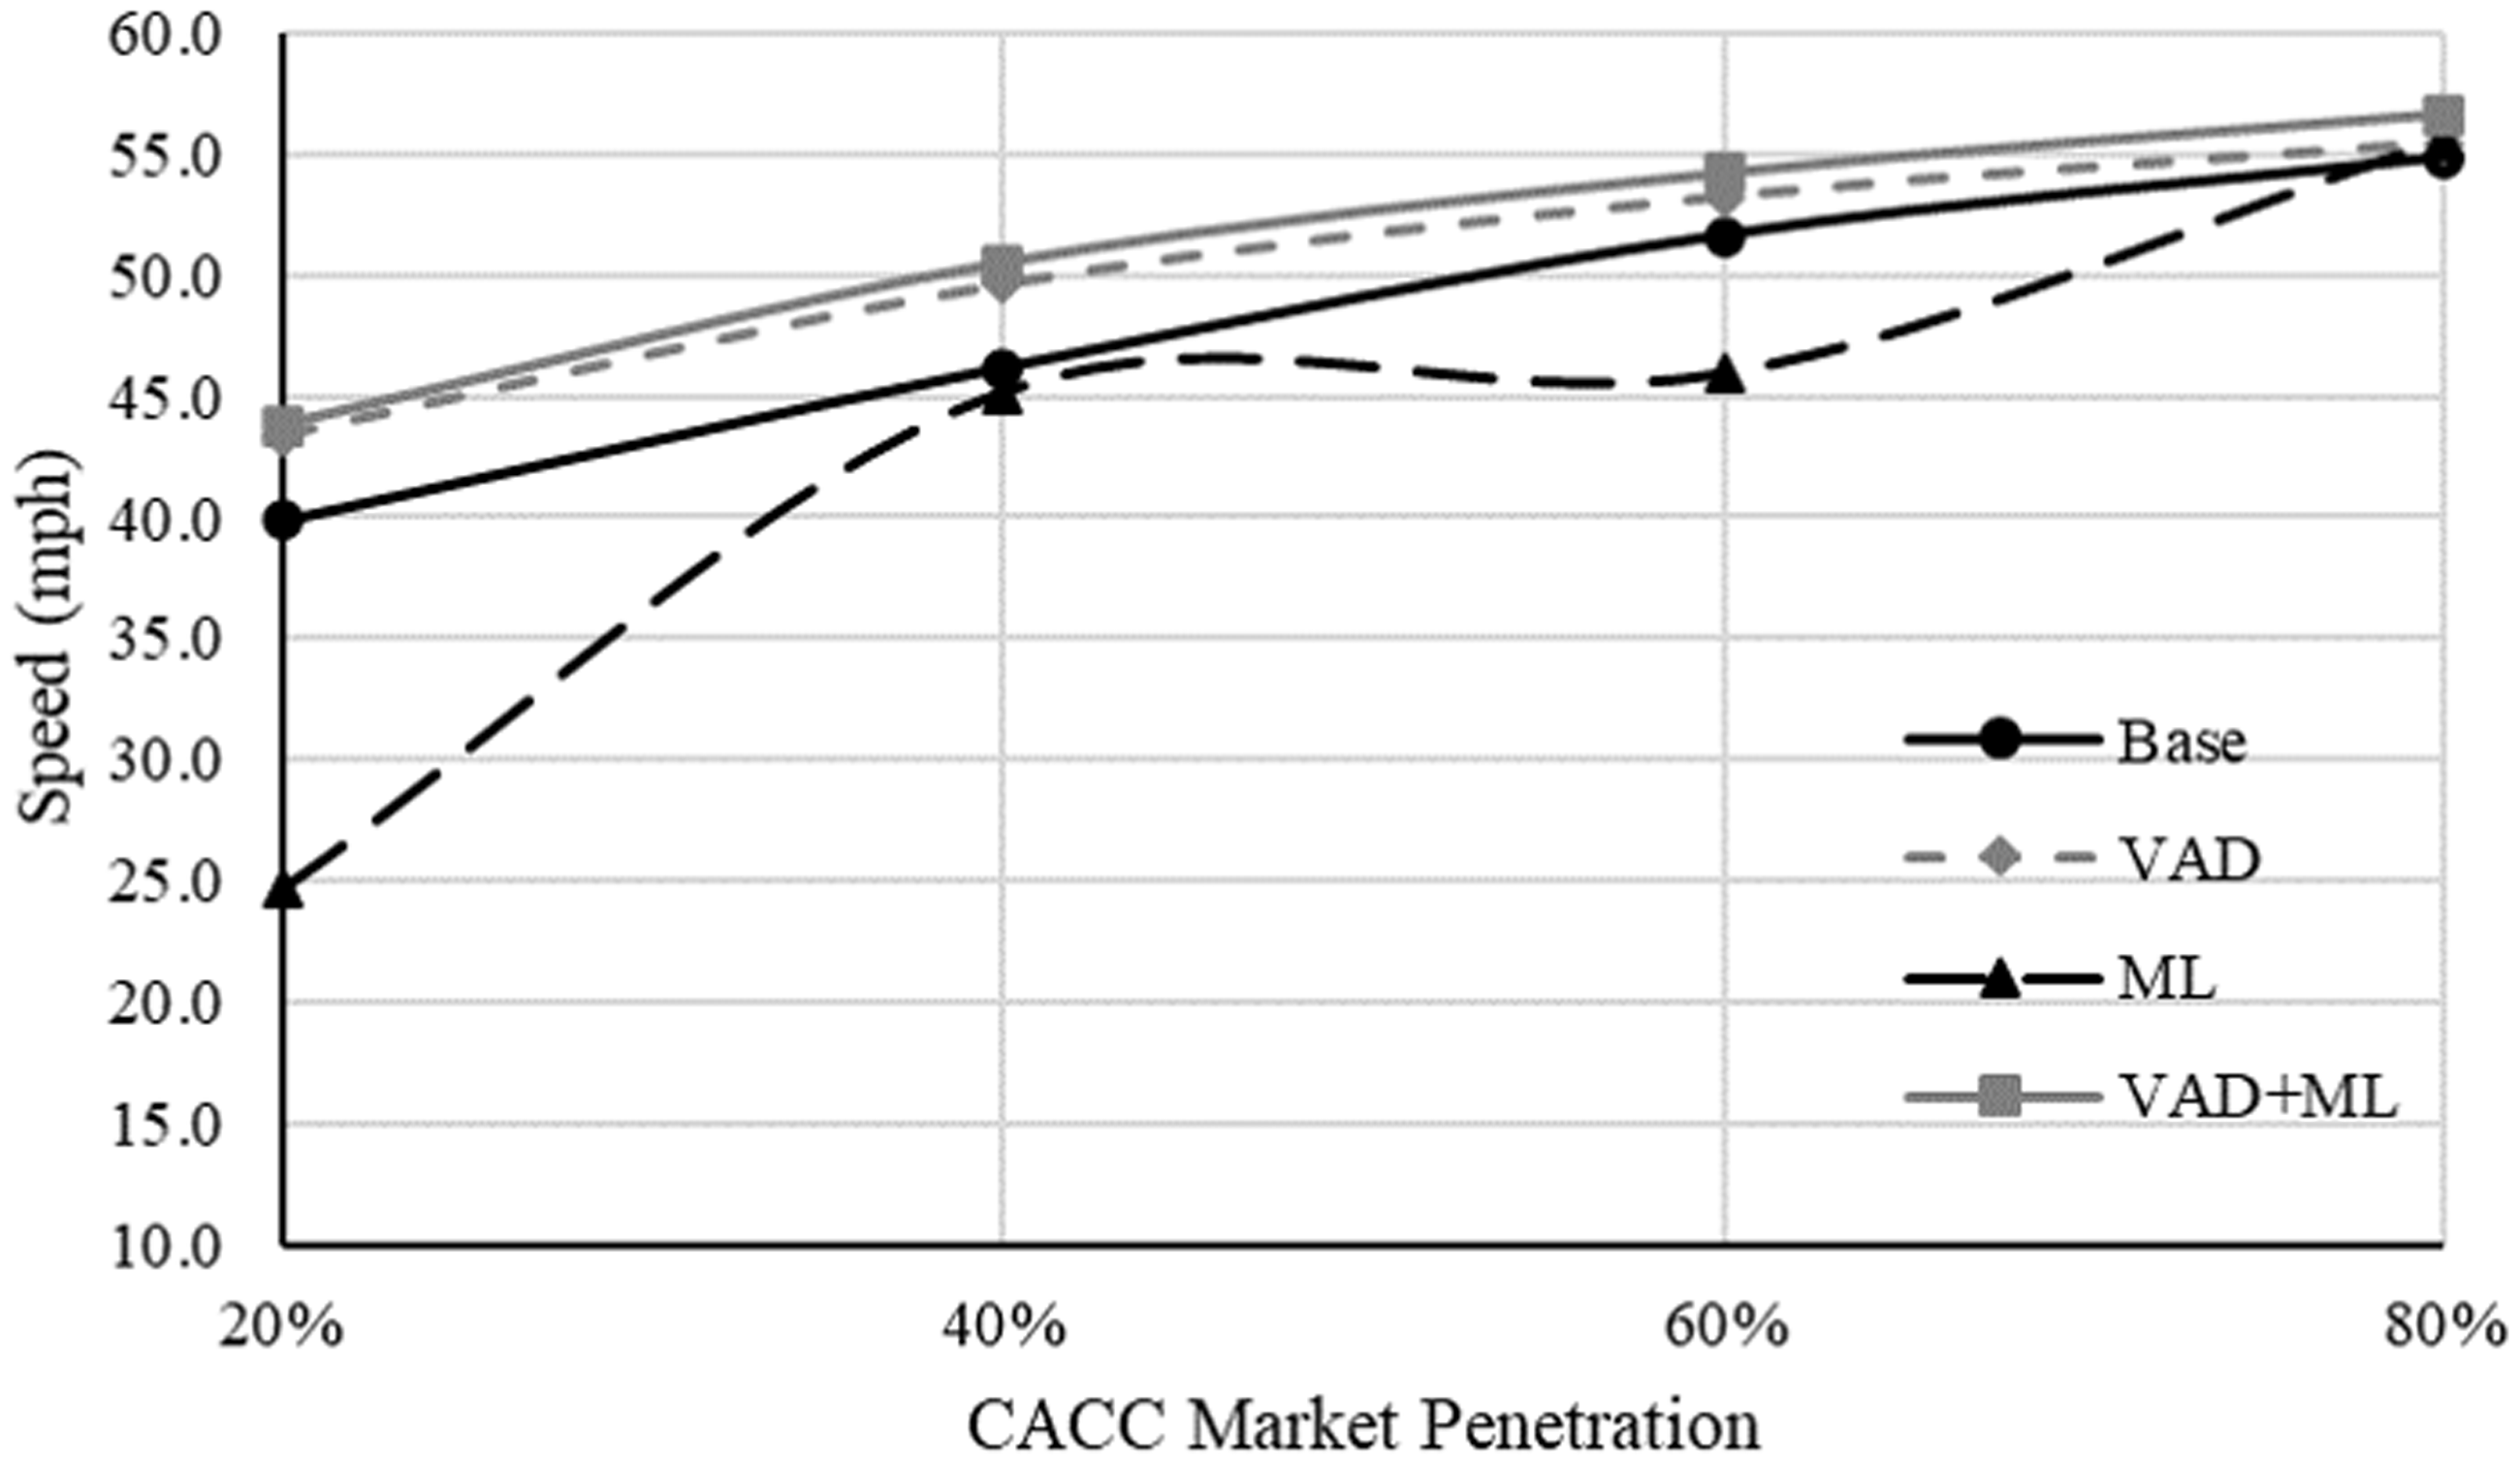
Average vehicle speeds along the corridor under the influence of vehicle awareness devices (VAD) and managed lane (ML) strategies.
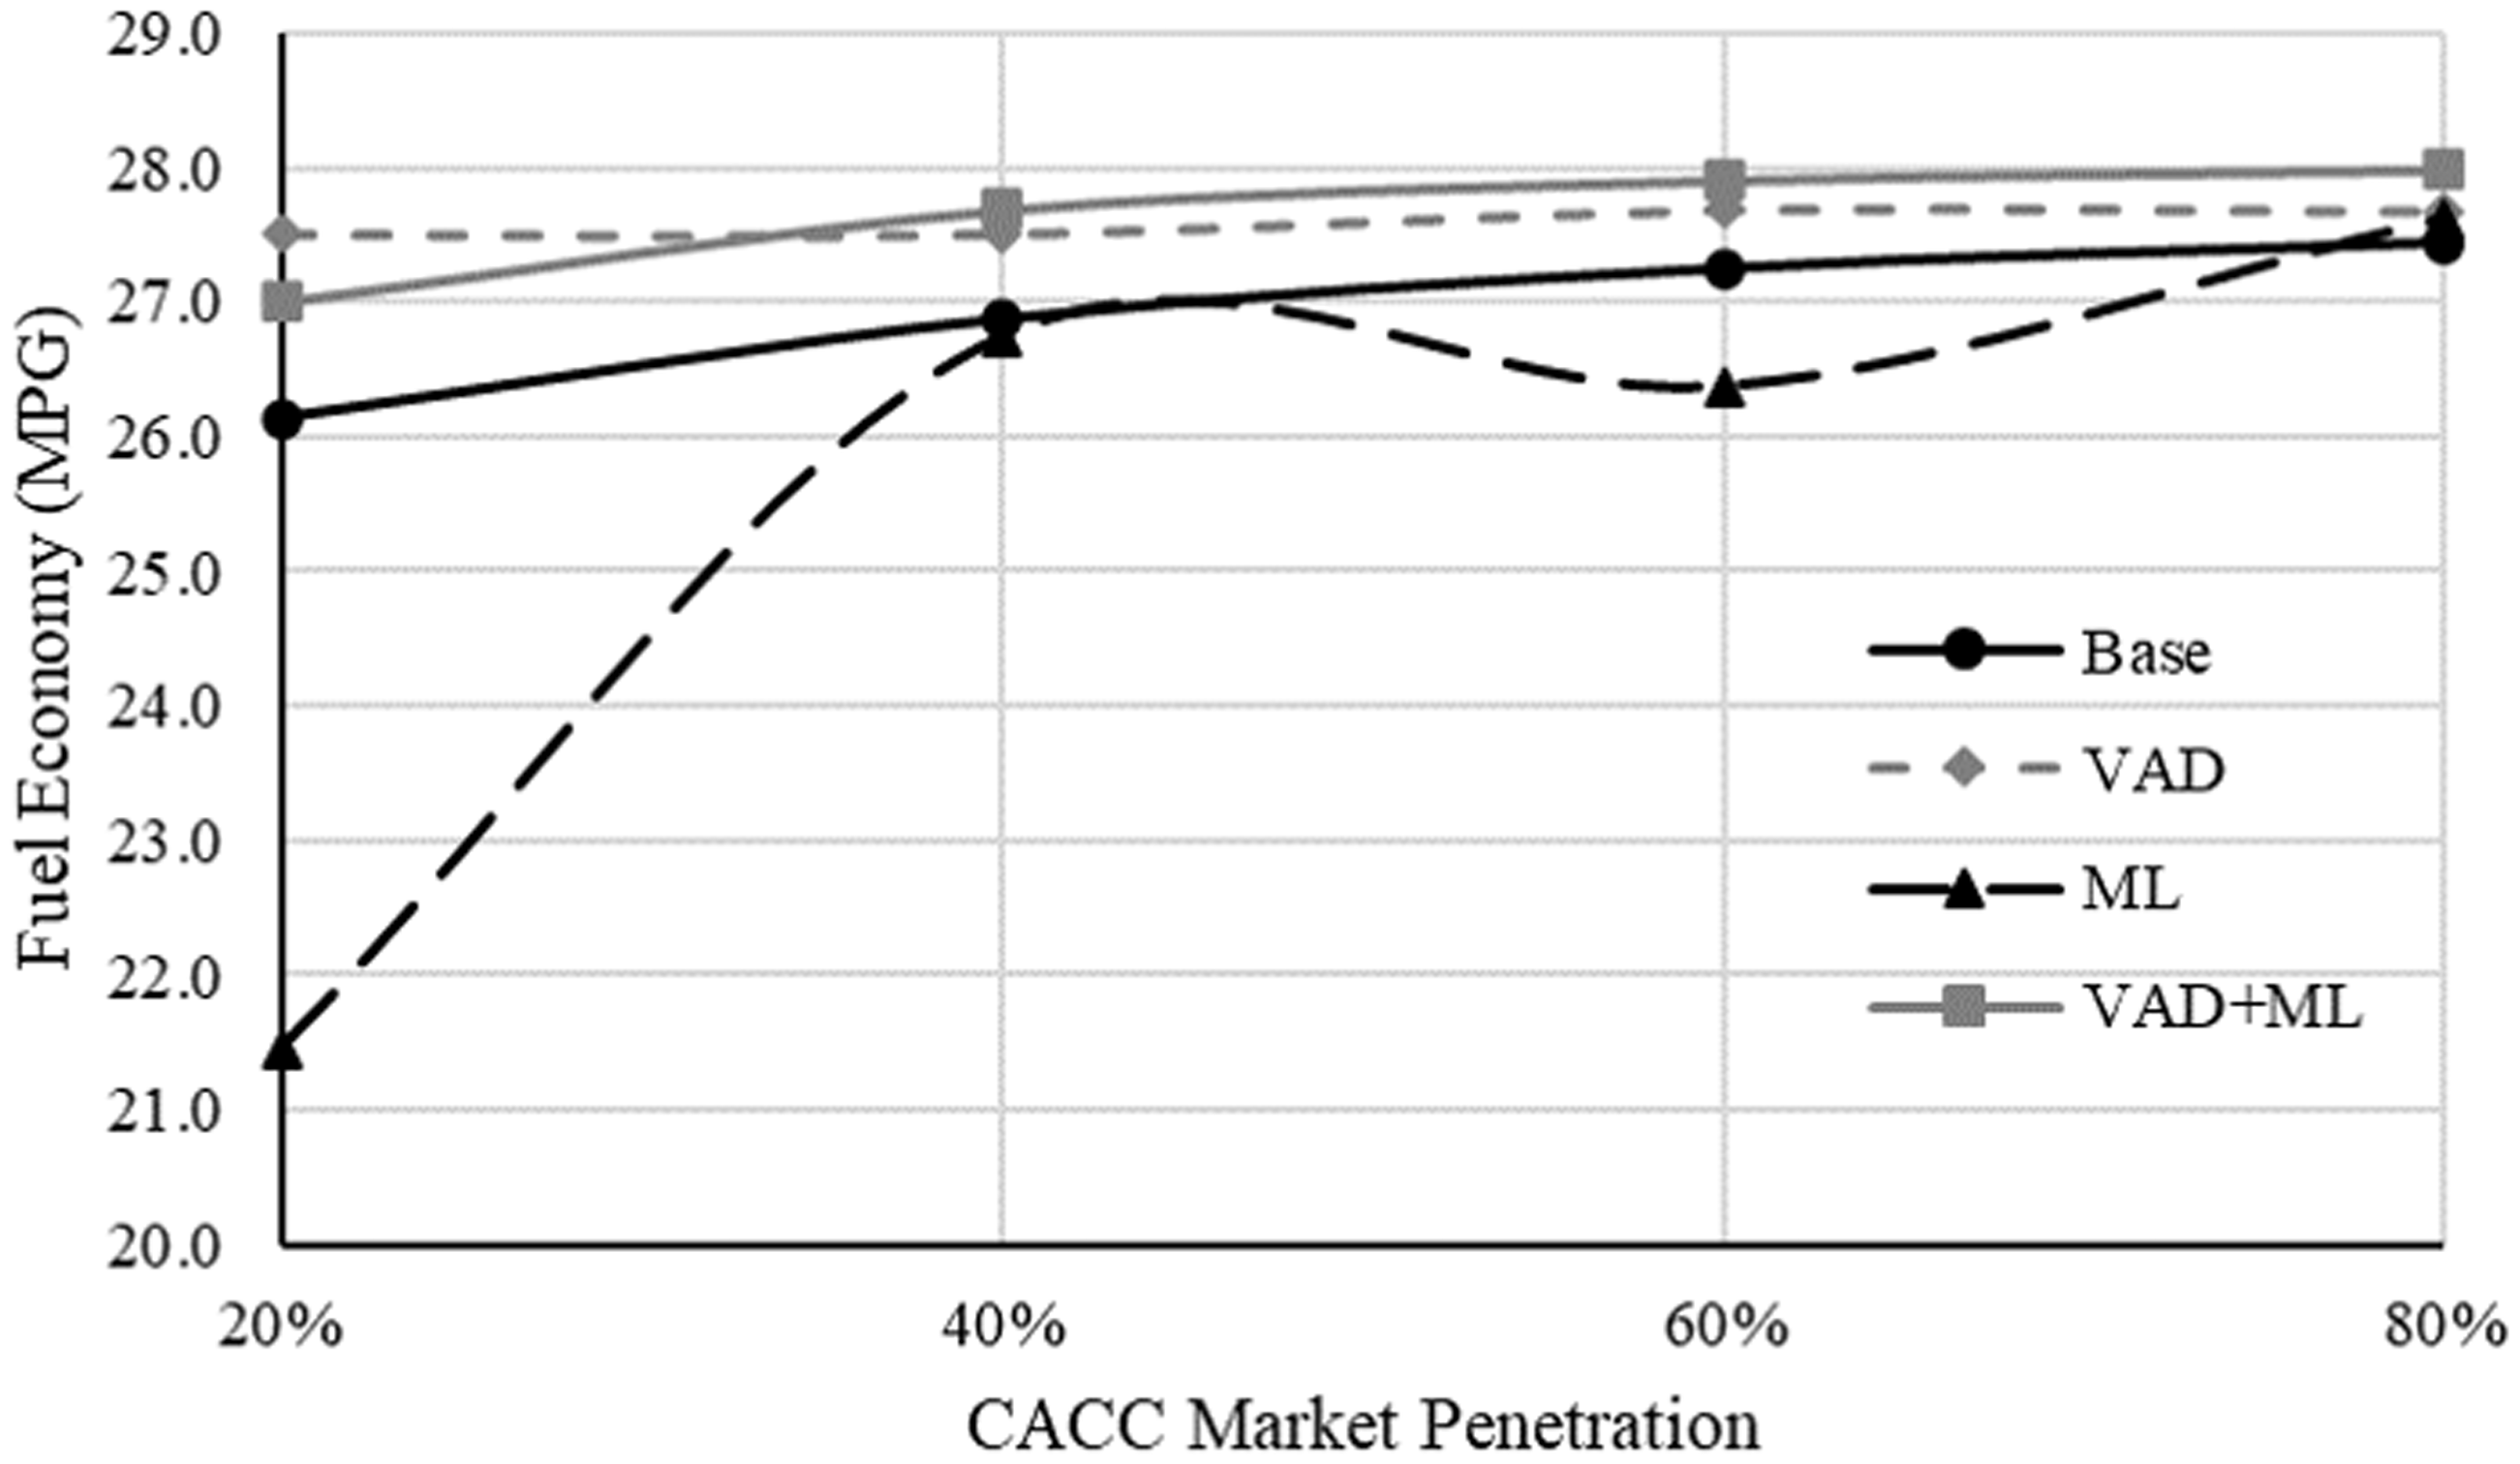
Average fuel economy in miles per gallon (mpg) under the influence of vehicle awareness devices (VAD) and managed lane (ML) strategies.
Figures 6 and 7 show that the ML strategy alone did not help to improve either freeway speed or fuel efficiency. The strategy motivated CACC vehicle drivers to make lane changes to the managed lane, causing traffic disturbances in the general purpose lanes. Particularly for an urban freeway corridor, those CACC vehicles needed to make three or four consecutive lane changes before they could merge into the managed lane. Such frequent lane changing behaviors could substantially decrease the stability of the traffic flow. In previous studies where the ML strategy was implemented at a simple on-ramp bottleneck, it was determined that the strategy brought about substantial speed and energy improvements to the network ( 5 ). This was because the majority of simulated CACC vehicles had already traveled in the managed lane when they were released into the simulation network. Those vehicles did not cause lane changing disturbances to traffic. The study results here imply that the ML strategy can be used to enhance corridor performance if it is possible to reduce the impact of the lane changes made by CACC vehicles. One potential way to resolve this challenge is to provide dedicated on-ramps for the managed lanes. With dedicated on-ramps, CACC vehicles can merge directly into the managed lane without disrupting the traffic stream in the general purpose lane. In the meantime, the CACC vehicles can concentrate in the managed lane, generating efficient traffic flow with CACC string operations. When the ML and VAD strategies were combined, it only offered small additional benefit compared with the VAD strategy alone scenario.
Effects of Increased Traffic Demand
This study examined the performance of the SR-99 corridor when the traffic demand was increased by 5%–40%. The purpose of the analysis was to identify the amount of extra traffic input the corridor could accommodate with the CACC string operation while maintaining the same average speed level observed at the 0% CACC baseline case. The results are shown in Table 3. In the table, N/A means that the simulation could not be completed within 48 h. It indicates that the traffic became so congested that the simulation run could not be handled by a computer with an Intel i7 processor and 32 GB memory.
Average Speed under Different Traffic Demand Inputs (mph)a
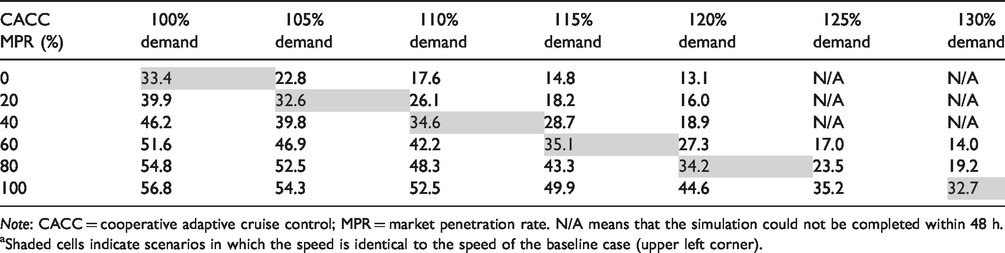
Note: CACC = cooperative adaptive cruise control; MPR = market penetration rate. N/A means that the simulation could not be completed within 48 h.aShaded cells indicate scenarios in which the speed is identical to the speed of the baseline case (upper left corner).
In Table 3, the gray cells represent the maximum traffic demand the corridor can serve while maintaining a similar average speed to that observed under the 0% CACC case. The maximum servable demand increased linearly with the CACC market penetration. The demand improvement was not as significant as the improvement identified at an isolated freeway on-ramp bottleneck ( 4 ). At the isolated bottleneck, the freeway pipeline capacity could increase by more than 90% when the CACC market penetration rate rose from 0% to 100%. On the SR-99 corridor, the entire network became very congested in the 100% CACC scenario when the traffic demand was increased by 30%. The comparison suggests that it is difficult to extend the same level of CACC benefit observed at individual bottlenecks to larger freeway corridors. One reason is that CACC does not improve bottleneck performance consistently along the corridor. While it has a significant effect on bottlenecks with smaller disturbances caused by on-/off-ramp traffic, its effectiveness is reduced at bigger bottlenecks where the traffic flow is frequently interrupted by entering and exiting traffic. In many cases, CACC improved some upstream mild bottlenecks, allowing those bottlenecks to release more vehicles downstream. This increased the input flow for downstream heavy bottlenecks. As a result, those heavy bottlenecks became more congested. The traffic congestion at those sites eventually propagated upstream, negatively affecting the operation of the upstream bottlenecks. Because of the spatial development of the congestion region, the benefit of CACC was largely offset. Such an observation calls for advanced speed harmonization strategies for such freeway corridors. The strategy can dynamically adjust the input and output flow of individual bottlenecks by providing tailored speed limits to CACC vehicles. In this case, it can maintain efficient operation at the busiest bottlenecks using the CACC capability while avoiding the upstream propagation of queues. Consequently, the performance of the entire corridor could be improved.
The impacts of CACC on vehicle fuel economy are depicted in Figure 8 under various demand inputs. As the demand increases, the traffic congestion of the freeway corridor becomes more severe. At the same time, the slope of the fuel economy curve also becomes higher. This indicates that the vehicle energy benefit of CACC is more prominent as the congestion level grows.
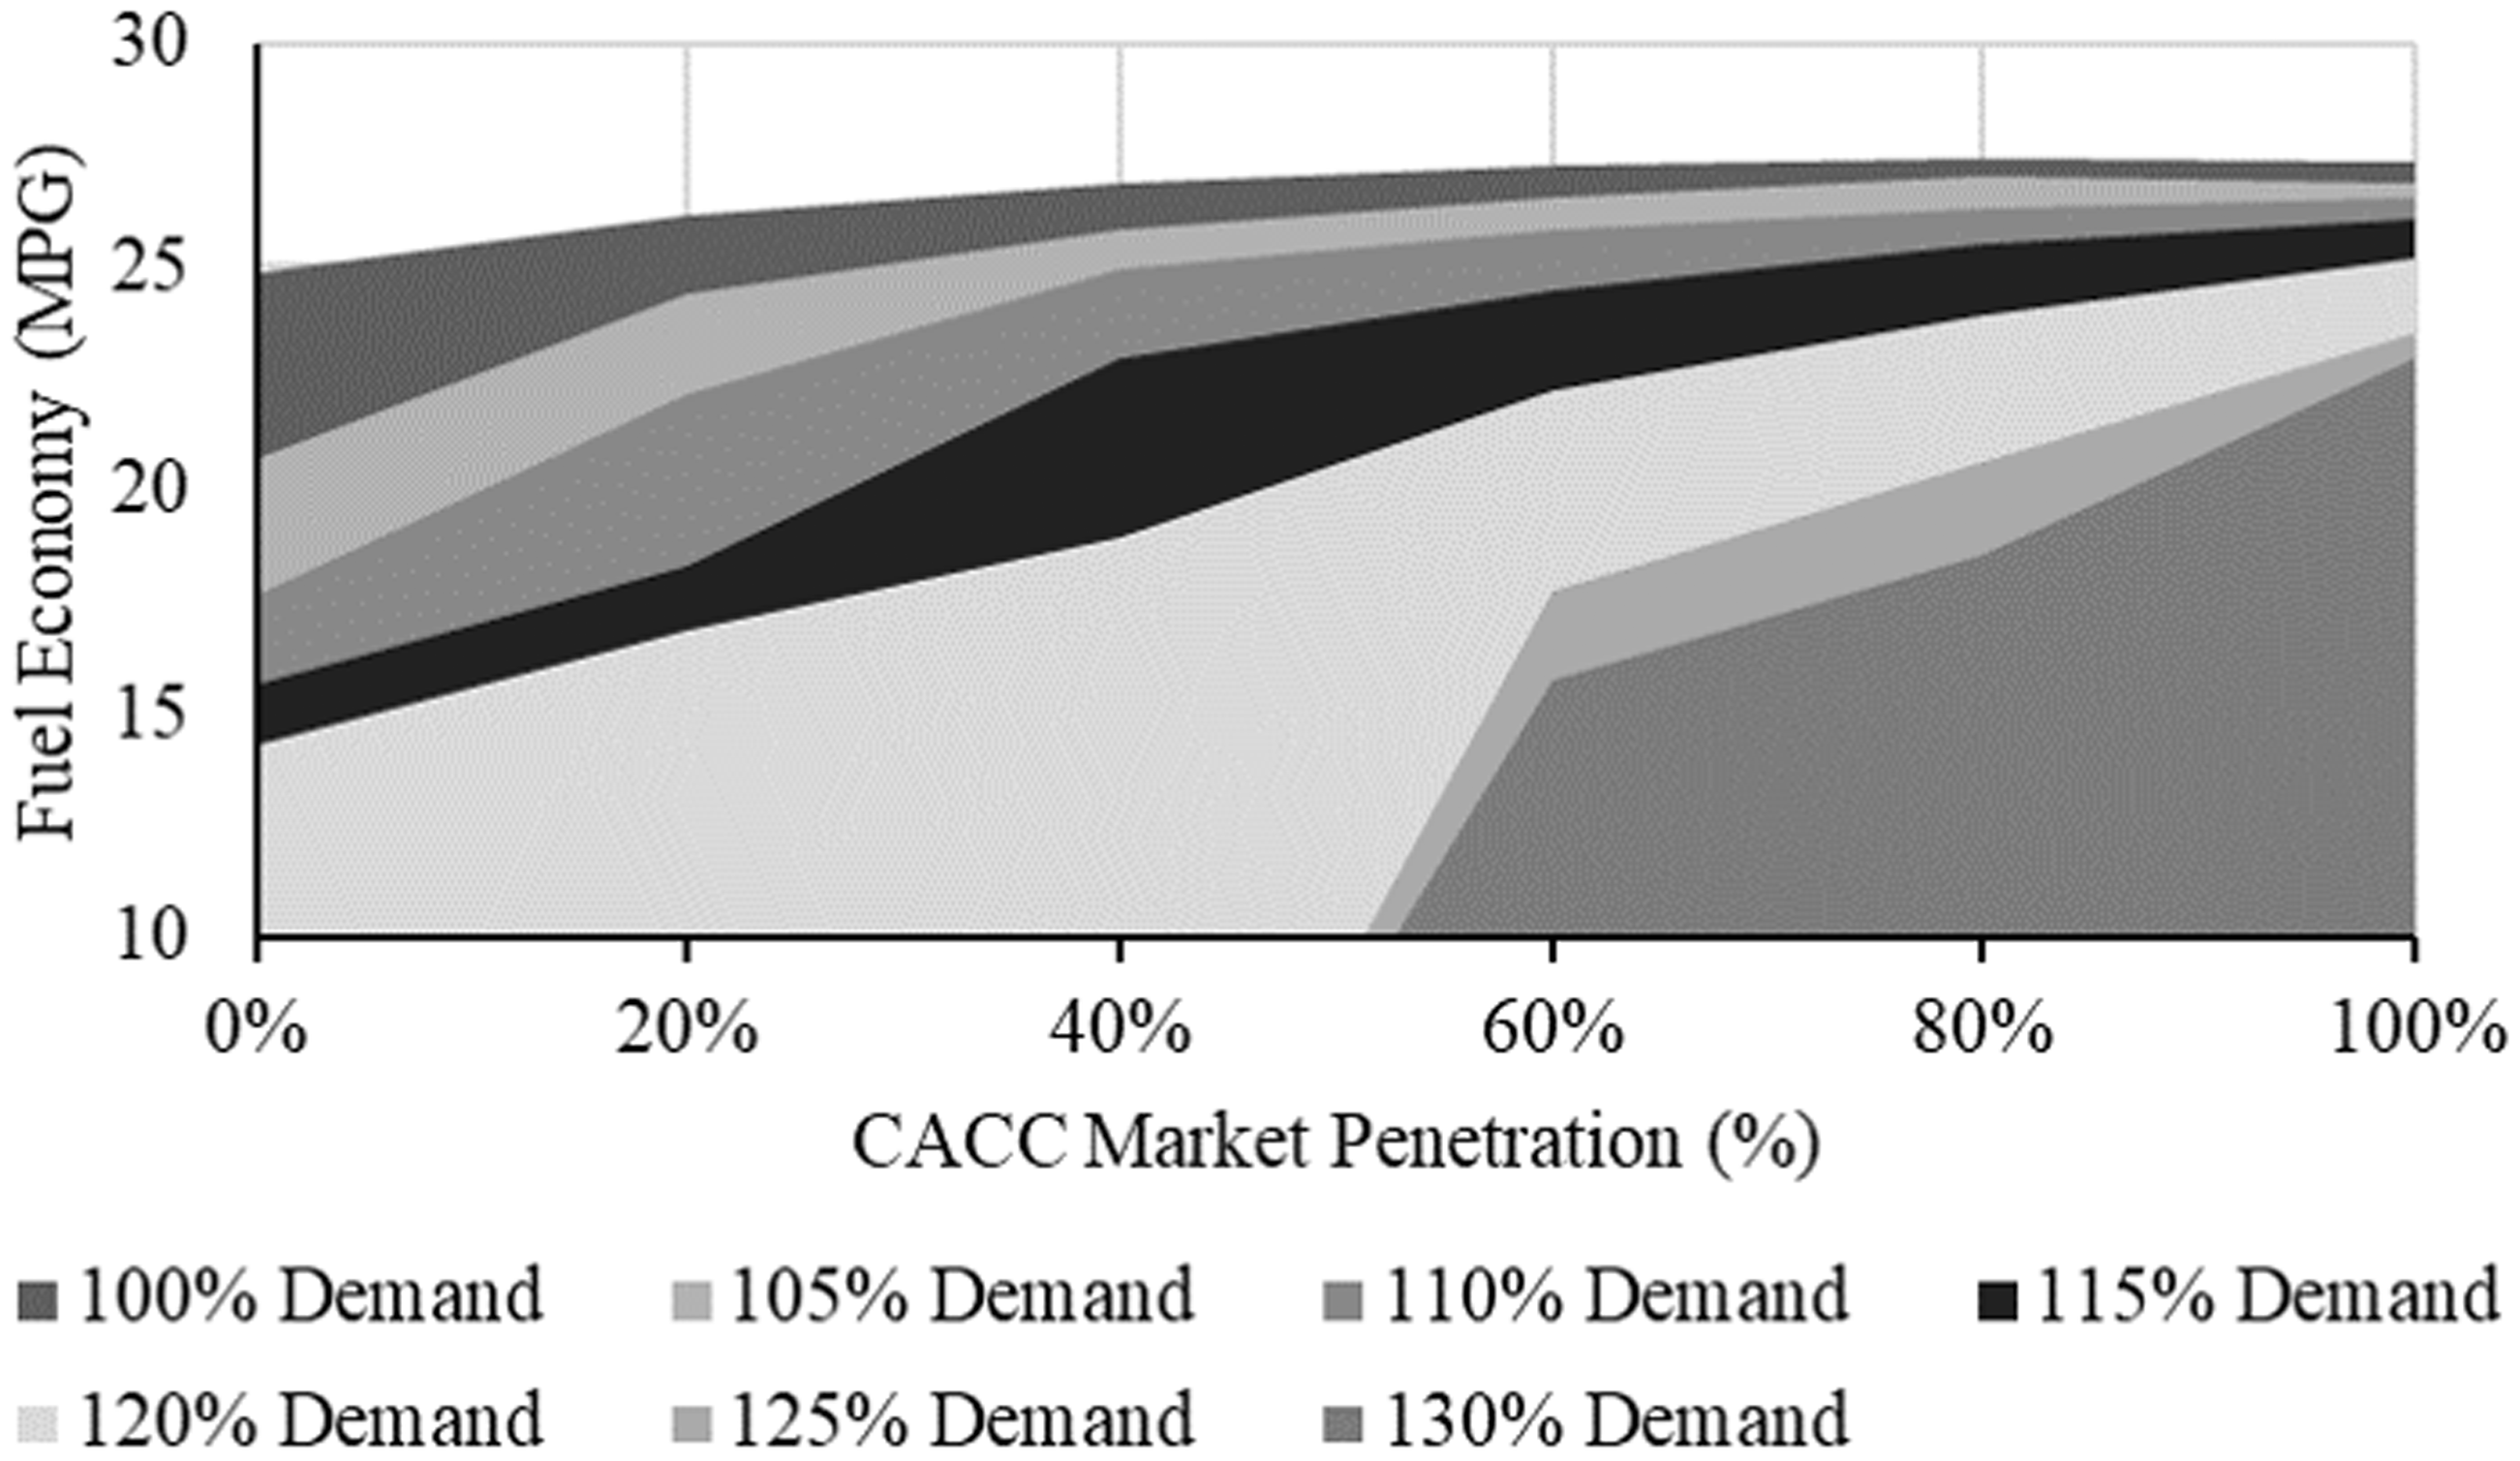
Fuel economy in miles per gallon (mpg) under various demand inputs and cooperative adaptive cruise control (CACC) market penetration rates.
Conclusion
In this research, a simulation based study was conducted to investigate the effectiveness of CACC for mitigating or solving existing transportation problems related to congestion and fuel consumption for freeway corridors. Specifically, the performance of the 13-mi SR-99 corridor was analyzed under various CACC market penetration scenarios, traffic demand inputs, and CACC management strategies. This study revealed that the average speed of the simulated freeway corridor increased linearly with CACC market penetration. The average speed increased by 70% (from 34 mph to 56 mph) when CACC market penetration increased from 0% to 100%. The CACC application positively impacted vehicle fuel efficiency, with the highest average of 27 mpg achieved when the CACC market penetration was higher than 50%. This was 10% higher than the baseline 0% CACC scenario. At all CACC market penetration rates of 50% or higher, the vehicle fuel efficiency was very similar. CACC string operation significantly improved mpg in the low to medium CACC market penetration scenarios because it mitigated traffic congestion. As the traffic flow becomes more stable, the overall vehicle energy efficiency improves. When CACC market penetration exceeded 50%, the opposing effects of traffic flow smoothing and higher speed on efficiency balanced each other, leaving net vehicle fuel economy close to constant.
When CACC market penetration reached 100%, the corridor allowed about 30% more traffic to enter the network without experiencing reduced travel time. This was much lower than the capacity increase (i.e., 90%) identified with a simple on-ramp bottleneck. The major reason was that the improved performance of an isolated bottleneck on a freeway corridor increased the output flow to the downstream segments, leading to reduction of mobility at downstream bottlenecks. As a result, the improvement of isolated bottlenecks did not necessarily bring about a benefit of the same magnitude for the entire corridor. This observation suggests a need to develop corridor-level traffic flow management strategies (e.g., speed harmonization) to coordinate the input and output flow of each bottleneck.
This case study also considered the VAD and ML strategies. The VAD strategy could enhance CACC string operation by increasing the probability of strings forming. With the strategy, CACC vehicles could locate string leaders more easily when more manually driven vehicles were equipped with VAD. The strategy had the greatest influence when the CACC market penetration rate was 20% or 40%. In those scenarios, the average speed increased by 8%, while there was also a minor increase in mpg. When CACC market penetration increased, CACC vehicles could more easily find CACC string leaders, reducing the effect of the VAD strategy. The ML strategy, on the other hand, decreased corridor performance when implemented alone. When the strategy was active, it attracted CACC vehicles to make lane changes to merge into the managed lane. This caused disturbances to the general purpose lanes, making the traffic flow in the general purpose lanes less stable. One option to address this challenge could be to use dedicated on-ramps that allow CACC vehicles to enter the managed lane directly.
The findings of this study point to several challenges that could hinder the mass deployment of CACC in freeway corridors. To take advantage fully of CACC capability, it is necessary to implement the CACC string operations with systematic traffic control and management approaches that aim to coordinate the speed of the CACC strings and enhance the string formation of the CACC vehicles. Those strategies could include speed harmonisation, freeway merge assistance or automation, or adding dedicated merge lanes to the freeway corridor. Those research questions are worthy of investigation in future studies.
Footnotes
Acknowledgments
This research is supported by the Federal Highway Administration HRDO program under the project entitled “Developing Analysis, Modeling, and Simulation (AMS) Tools for Connected Automated Vehicle Applications.”
Author Contributions
The authors confirm contribution to the paper as follows: study conception and design: H. Liu, X. Y. Lu, S. E. Shladover; data collection: H. Liu; analysis and interpretation of results: H. Liu, X. Y. Lu, S. E. Shladover; draft manuscript preparation: H. Liu, S. E. Shladover. All authors reviewed the results and approved the final version of the manuscript.
Declaration of Conflicting Interests
The author(s) declared no potential conflicts of interest with respect to the research, authorship, and/or publication of this article.
Funding
The author(s) disclosed receipt of the following financial support for the research, authorship, and/or publication of this article: The research was funded by the Federal Highway Administration HRDO program under the project entitled “Developing Analysis, Modeling, and Simulation (AMS) Tools for Connected Automated Vehicle Applications.”
The contents of this paper reflect the views of the authors, who are responsible for the facts and accuracy of the data presented.